Program: 5. Cancer Associated Fibroblast: Inflammatory.
Program description and justification of annotation: 5.
Submit a comment on this gene expression program’s interpretation: CLICK
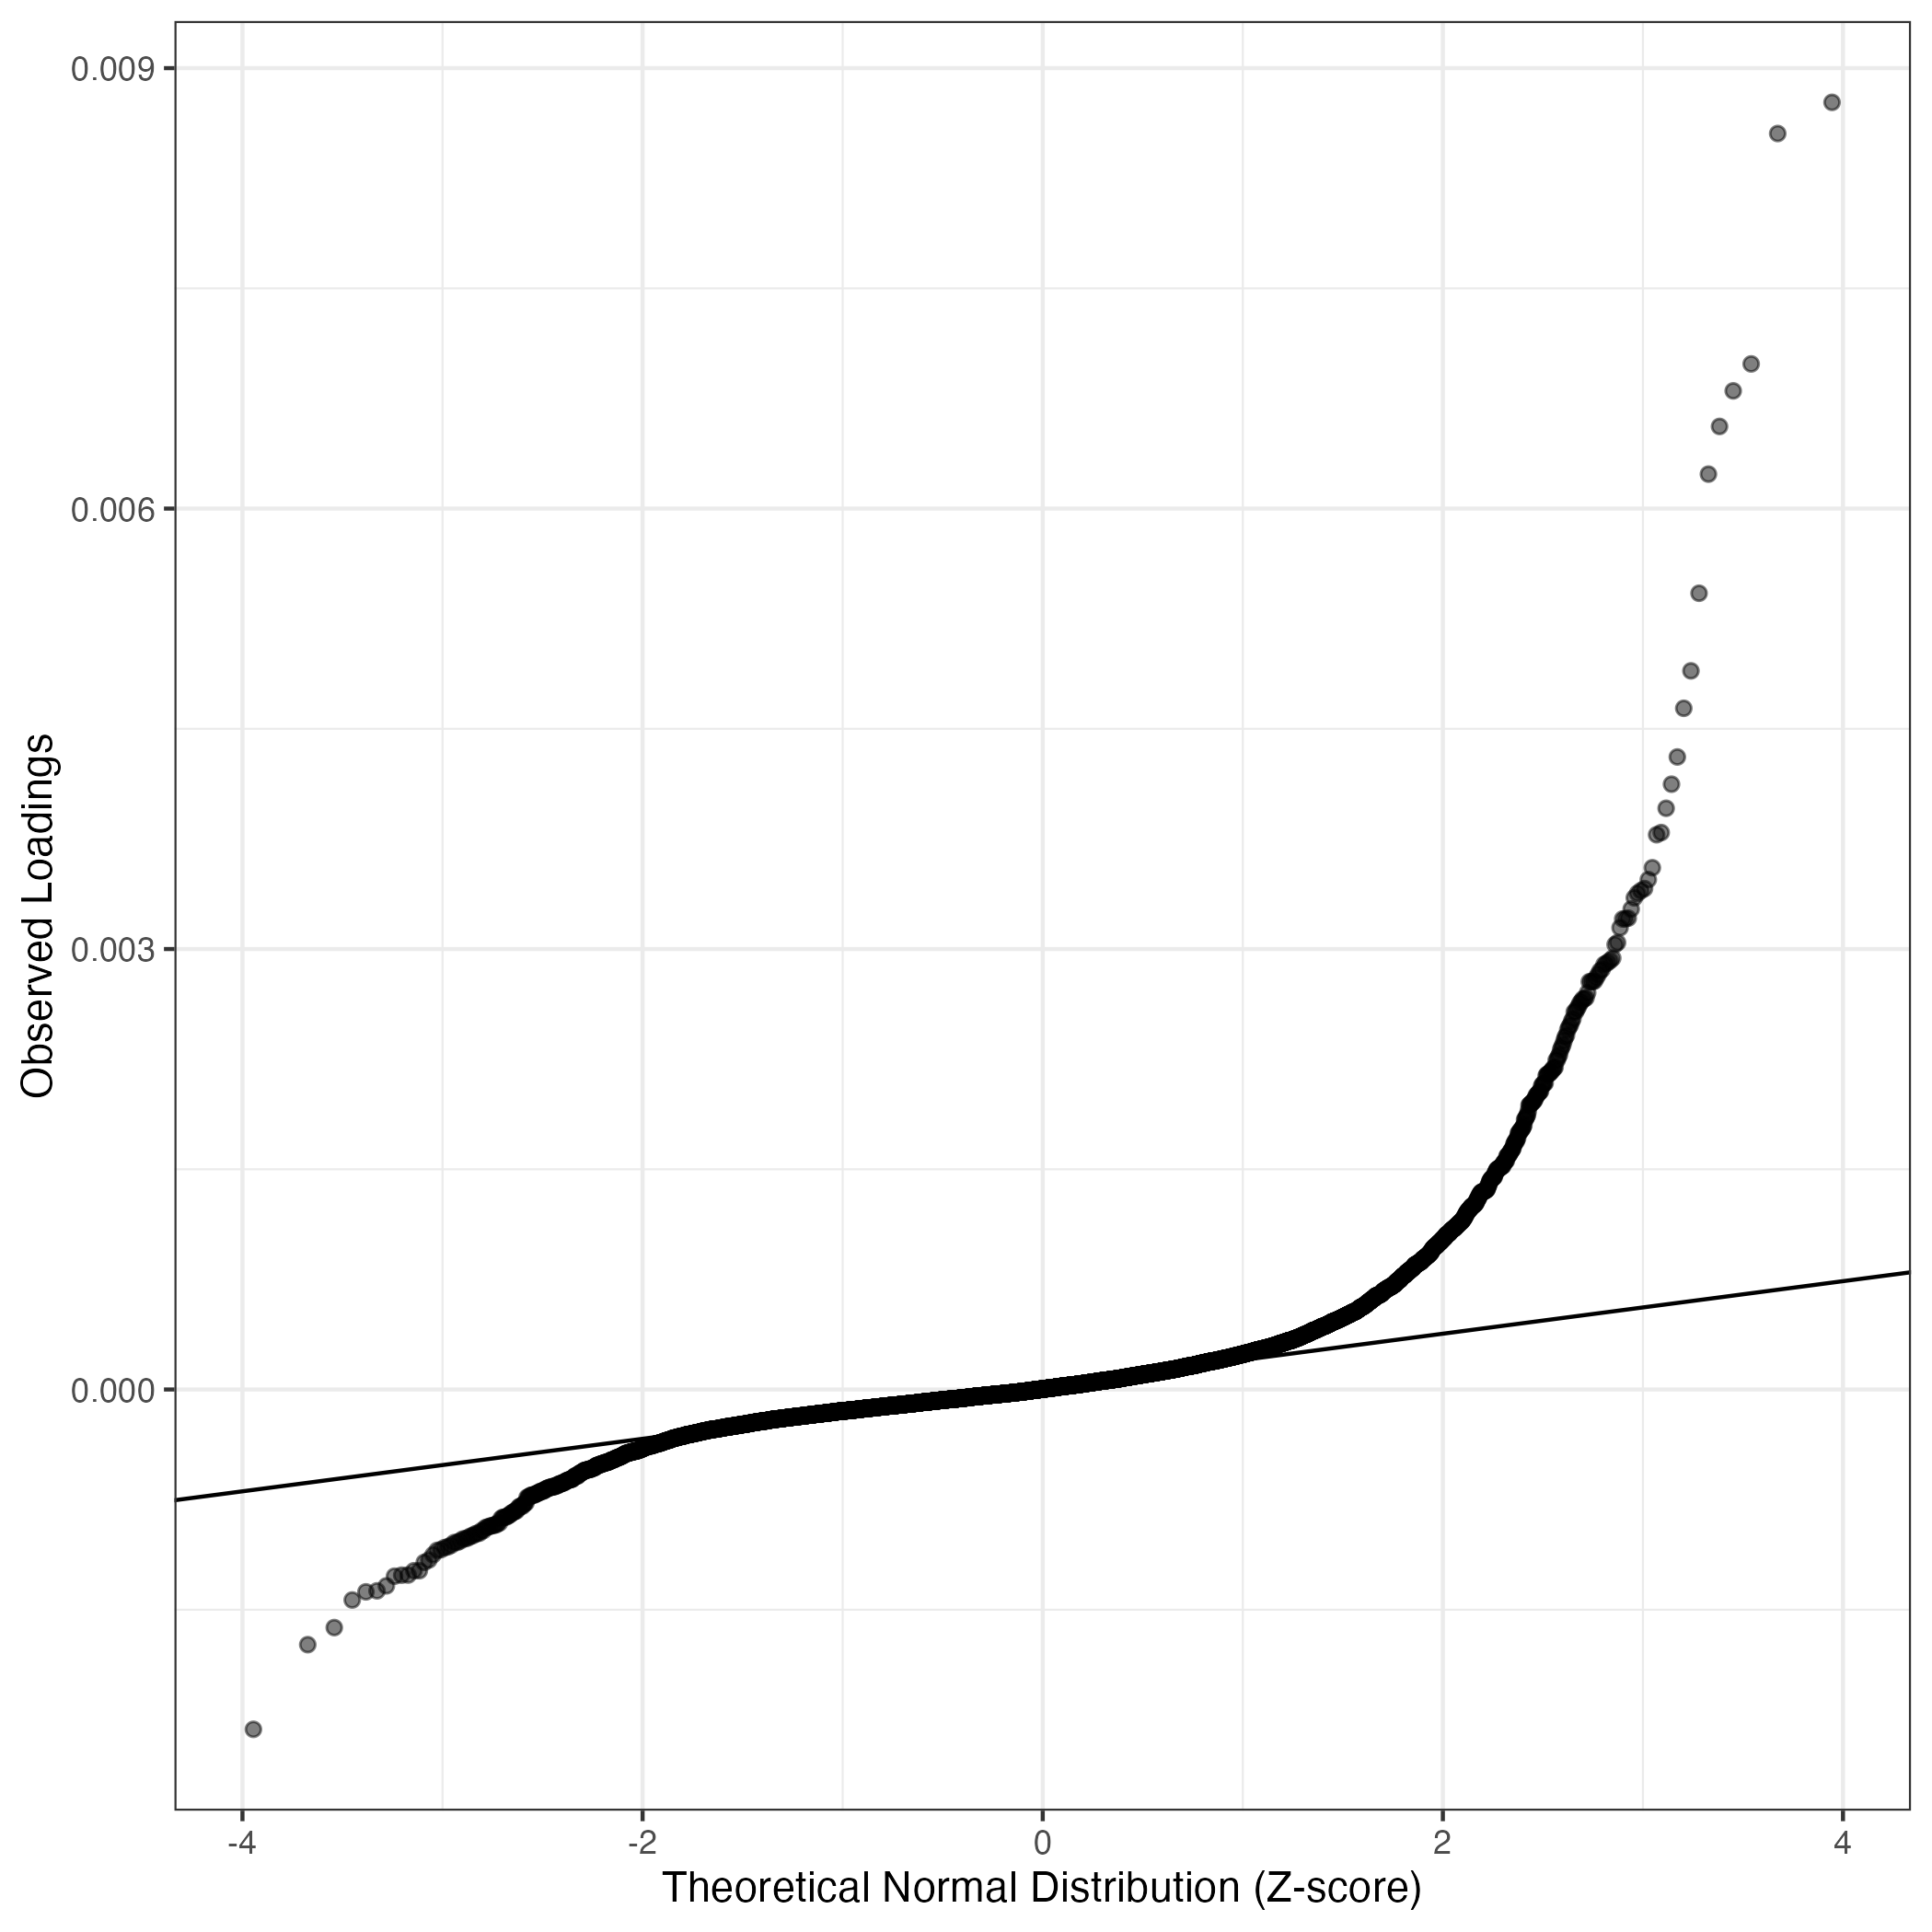
QQ-plot of gene loadings, averaged over both independent splits of the data
This plot highlights the relative contribution of each gene to the GEP
Top genes driving this program.
Note: Decartes website is buggy, try refreshing. Also, Decartes fetal adrenal data have been collected at specific time points (89-122 days), all possible cell types of interest may not be represented, do not overinterpret.
The Mean Count column shows the mean read count in cells scoring highly (H > 50) on this gene expression program.
| Gene | Loading | Gene.Name | GTEx | DepMap | Descartes | Mean.Counts | Mean.Tpm | |
|---|---|---|---|---|---|---|---|---|
| 1 | C7 | 0.0087669 | complement C7 | GTEx | DepMap | Descartes | 0.86 | 408.39 |
| 2 | TNC | 0.0085546 | tenascin C | GTEx | DepMap | Descartes | 2.06 | 488.76 |
| 3 | EXOC3L4 | 0.0069854 | exocyst complex component 3 like 4 | GTEx | DepMap | Descartes | 0.11 | 103.34 |
| 4 | IGFBP7 | 0.0068017 | insulin like growth factor binding protein 7 | GTEx | DepMap | Descartes | 3.11 | 3421.62 |
| 5 | PAPLN | 0.0065595 | papilin, proteoglycan like sulfated glycoprotein | GTEx | DepMap | Descartes | 0.32 | 70.55 |
| 6 | SULF1 | 0.0062347 | sulfatase 1 | GTEx | DepMap | Descartes | 2.85 | 906.06 |
| 7 | POSTN | 0.0054233 | periostin | GTEx | DepMap | Descartes | 1.57 | 862.81 |
| 8 | ADAM12 | 0.0048947 | ADAM metallopeptidase domain 12 | GTEx | DepMap | Descartes | 1.38 | 307.75 |
| 9 | TIMP1 | 0.0046397 | TIMP metallopeptidase inhibitor 1 | GTEx | DepMap | Descartes | 2.87 | 4863.81 |
| 10 | FN1 | 0.0043083 | fibronectin 1 | GTEx | DepMap | Descartes | 4.35 | 844.41 |
| 11 | PRRX1 | 0.0041227 | paired related homeobox 1 | GTEx | DepMap | Descartes | 0.57 | 231.54 |
| 12 | PARD3B | 0.0039587 | par-3 family cell polarity regulator beta | GTEx | DepMap | Descartes | 1.33 | 270.30 |
| 13 | CLU | 0.0037933 | clusterin | GTEx | DepMap | Descartes | 1.14 | 494.10 |
| 14 | PRKG1 | 0.0037786 | protein kinase cGMP-dependent 1 | GTEx | DepMap | Descartes | 2.21 | 477.99 |
| 15 | ADAMTS12 | 0.0035537 | ADAM metallopeptidase with thrombospondin type 1 motif 12 | GTEx | DepMap | Descartes | 0.40 | 77.21 |
| 16 | BNC2 | 0.0034729 | basonuclin 2 | GTEx | DepMap | Descartes | 1.14 | 164.39 |
| 17 | NPY1R | 0.0034116 | neuropeptide Y receptor Y1 | GTEx | DepMap | Descartes | 0.04 | 29.00 |
| 18 | SLC26A7 | 0.0033975 | solute carrier family 26 member 7 | GTEx | DepMap | Descartes | 0.16 | 36.06 |
| 19 | GEM | 0.0033794 | GTP binding protein overexpressed in skeletal muscle | GTEx | DepMap | Descartes | 0.81 | 697.57 |
| 20 | ABI3BP | 0.0033485 | ABI family member 3 binding protein | GTEx | DepMap | Descartes | 0.38 | 97.20 |
| 21 | UACA | 0.0032723 | uveal autoantigen with coiled-coil domains and ankyrin repeats | GTEx | DepMap | Descartes | 0.91 | 270.62 |
| 22 | NFIA | 0.0032102 | nuclear factor I A | GTEx | DepMap | Descartes | 1.06 | 43.23 |
| 23 | FGF11 | 0.0032060 | fibroblast growth factor 11 | GTEx | DepMap | Descartes | 0.03 | 30.80 |
| 24 | ANKRD29 | 0.0032047 | ankyrin repeat domain 29 | GTEx | DepMap | Descartes | 0.14 | 48.71 |
| 25 | B2M | 0.0031452 | beta-2-microglobulin | GTEx | DepMap | Descartes | 3.35 | 1835.87 |
| 26 | HS3ST3A1 | 0.0030440 | heparan sulfate-glucosamine 3-sulfotransferase 3A1 | GTEx | DepMap | Descartes | 0.19 | 86.58 |
| 27 | PDE1A | 0.0030304 | phosphodiesterase 1A | GTEx | DepMap | Descartes | 0.49 | 163.95 |
| 28 | BIRC3 | 0.0029385 | baculoviral IAP repeat containing 3 | GTEx | DepMap | Descartes | 0.08 | 21.25 |
| 29 | CYP7B1 | 0.0029235 | cytochrome P450 family 7 subfamily B member 1 | GTEx | DepMap | Descartes | 0.45 | 126.85 |
| 30 | IL33 | 0.0029119 | interleukin 33 | GTEx | DepMap | Descartes | 0.14 | 103.70 |
| 31 | ARHGAP42 | 0.0029005 | Rho GTPase activating protein 42 | GTEx | DepMap | Descartes | 0.40 | 92.36 |
| 32 | CCL2 | 0.0028949 | C-C motif chemokine ligand 2 | GTEx | DepMap | Descartes | 0.64 | 1212.95 |
| 33 | ARHGAP15 | 0.0028605 | Rho GTPase activating protein 15 | GTEx | DepMap | Descartes | 0.82 | 386.03 |
| 34 | PDGFRB | 0.0028514 | platelet derived growth factor receptor beta | GTEx | DepMap | Descartes | 0.50 | 162.41 |
| 35 | OSMR | 0.0028266 | oncostatin M receptor | GTEx | DepMap | Descartes | 0.43 | 137.23 |
| 36 | ITIH5 | 0.0028046 | inter-alpha-trypsin inhibitor heavy chain 5 | GTEx | DepMap | Descartes | 0.19 | 37.14 |
| 37 | KCNE4 | 0.0027821 | potassium voltage-gated channel subfamily E regulatory subunit 4 | GTEx | DepMap | Descartes | 0.21 | 114.45 |
| 38 | ZFPM2 | 0.0027781 | zinc finger protein, FOG family member 2 | GTEx | DepMap | Descartes | 1.50 | 466.75 |
| 39 | BACE2 | 0.0027780 | beta-secretase 2 | GTEx | DepMap | Descartes | 0.47 | NA |
| 40 | SLC9A9 | 0.0027771 | solute carrier family 9 member A9 | GTEx | DepMap | Descartes | 0.52 | 269.29 |
| 41 | RBPMS | 0.0027029 | RNA binding protein, mRNA processing factor | GTEx | DepMap | Descartes | 0.79 | 420.44 |
| 42 | VCAM1 | 0.0026682 | vascular cell adhesion molecule 1 | GTEx | DepMap | Descartes | 0.18 | 94.72 |
| 43 | ID3 | 0.0026613 | inhibitor of DNA binding 3, HLH protein | GTEx | DepMap | Descartes | 0.32 | 475.93 |
| 44 | C3 | 0.0026599 | complement C3 | GTEx | DepMap | Descartes | 1.04 | 311.89 |
| 45 | TNFAIP3 | 0.0026434 | TNF alpha induced protein 3 | GTEx | DepMap | Descartes | 0.15 | 48.07 |
| 46 | GNA14 | 0.0026312 | G protein subunit alpha 14 | GTEx | DepMap | Descartes | 0.35 | 206.93 |
| 47 | CALD1 | 0.0026092 | caldesmon 1 | GTEx | DepMap | Descartes | 3.33 | 1177.92 |
| 48 | SVIL | 0.0025921 | supervillin | GTEx | DepMap | Descartes | 1.06 | 219.62 |
| 49 | EPB41L2 | 0.0025726 | erythrocyte membrane protein band 4.1 like 2 | GTEx | DepMap | Descartes | 0.50 | 170.75 |
| 50 | EPHA3 | 0.0025716 | EPH receptor A3 | GTEx | DepMap | Descartes | 0.28 | 104.30 |
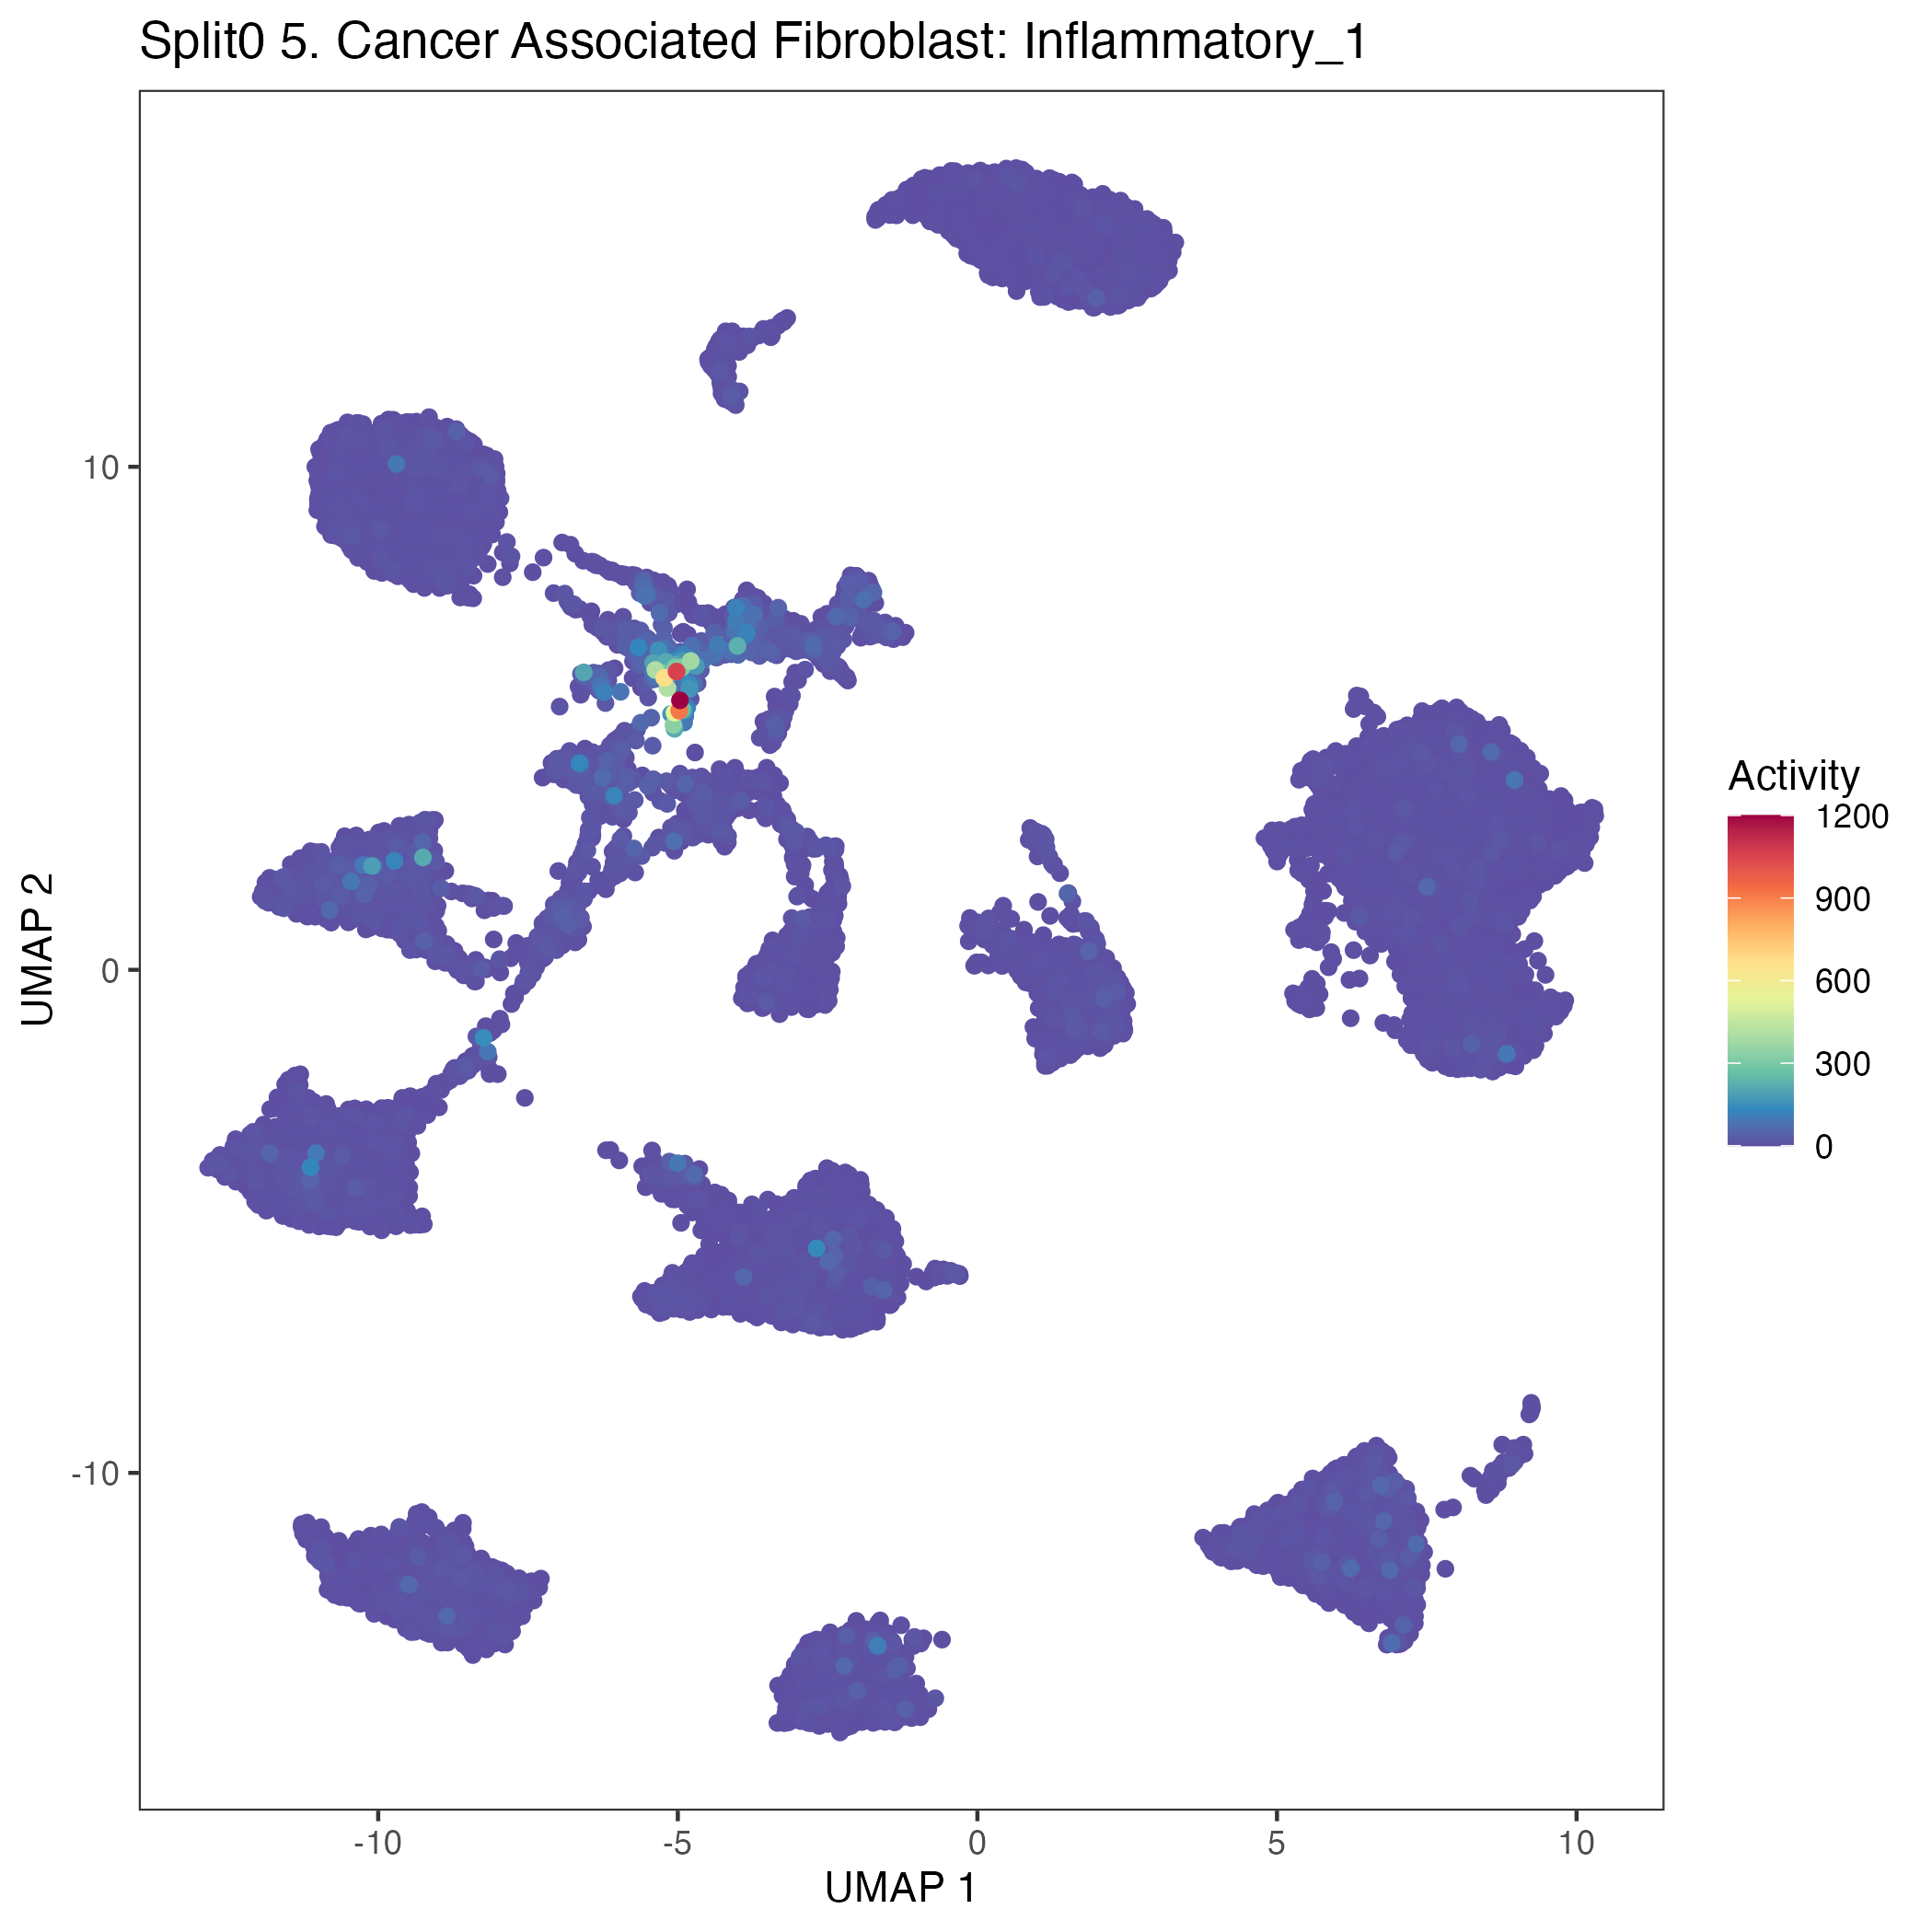
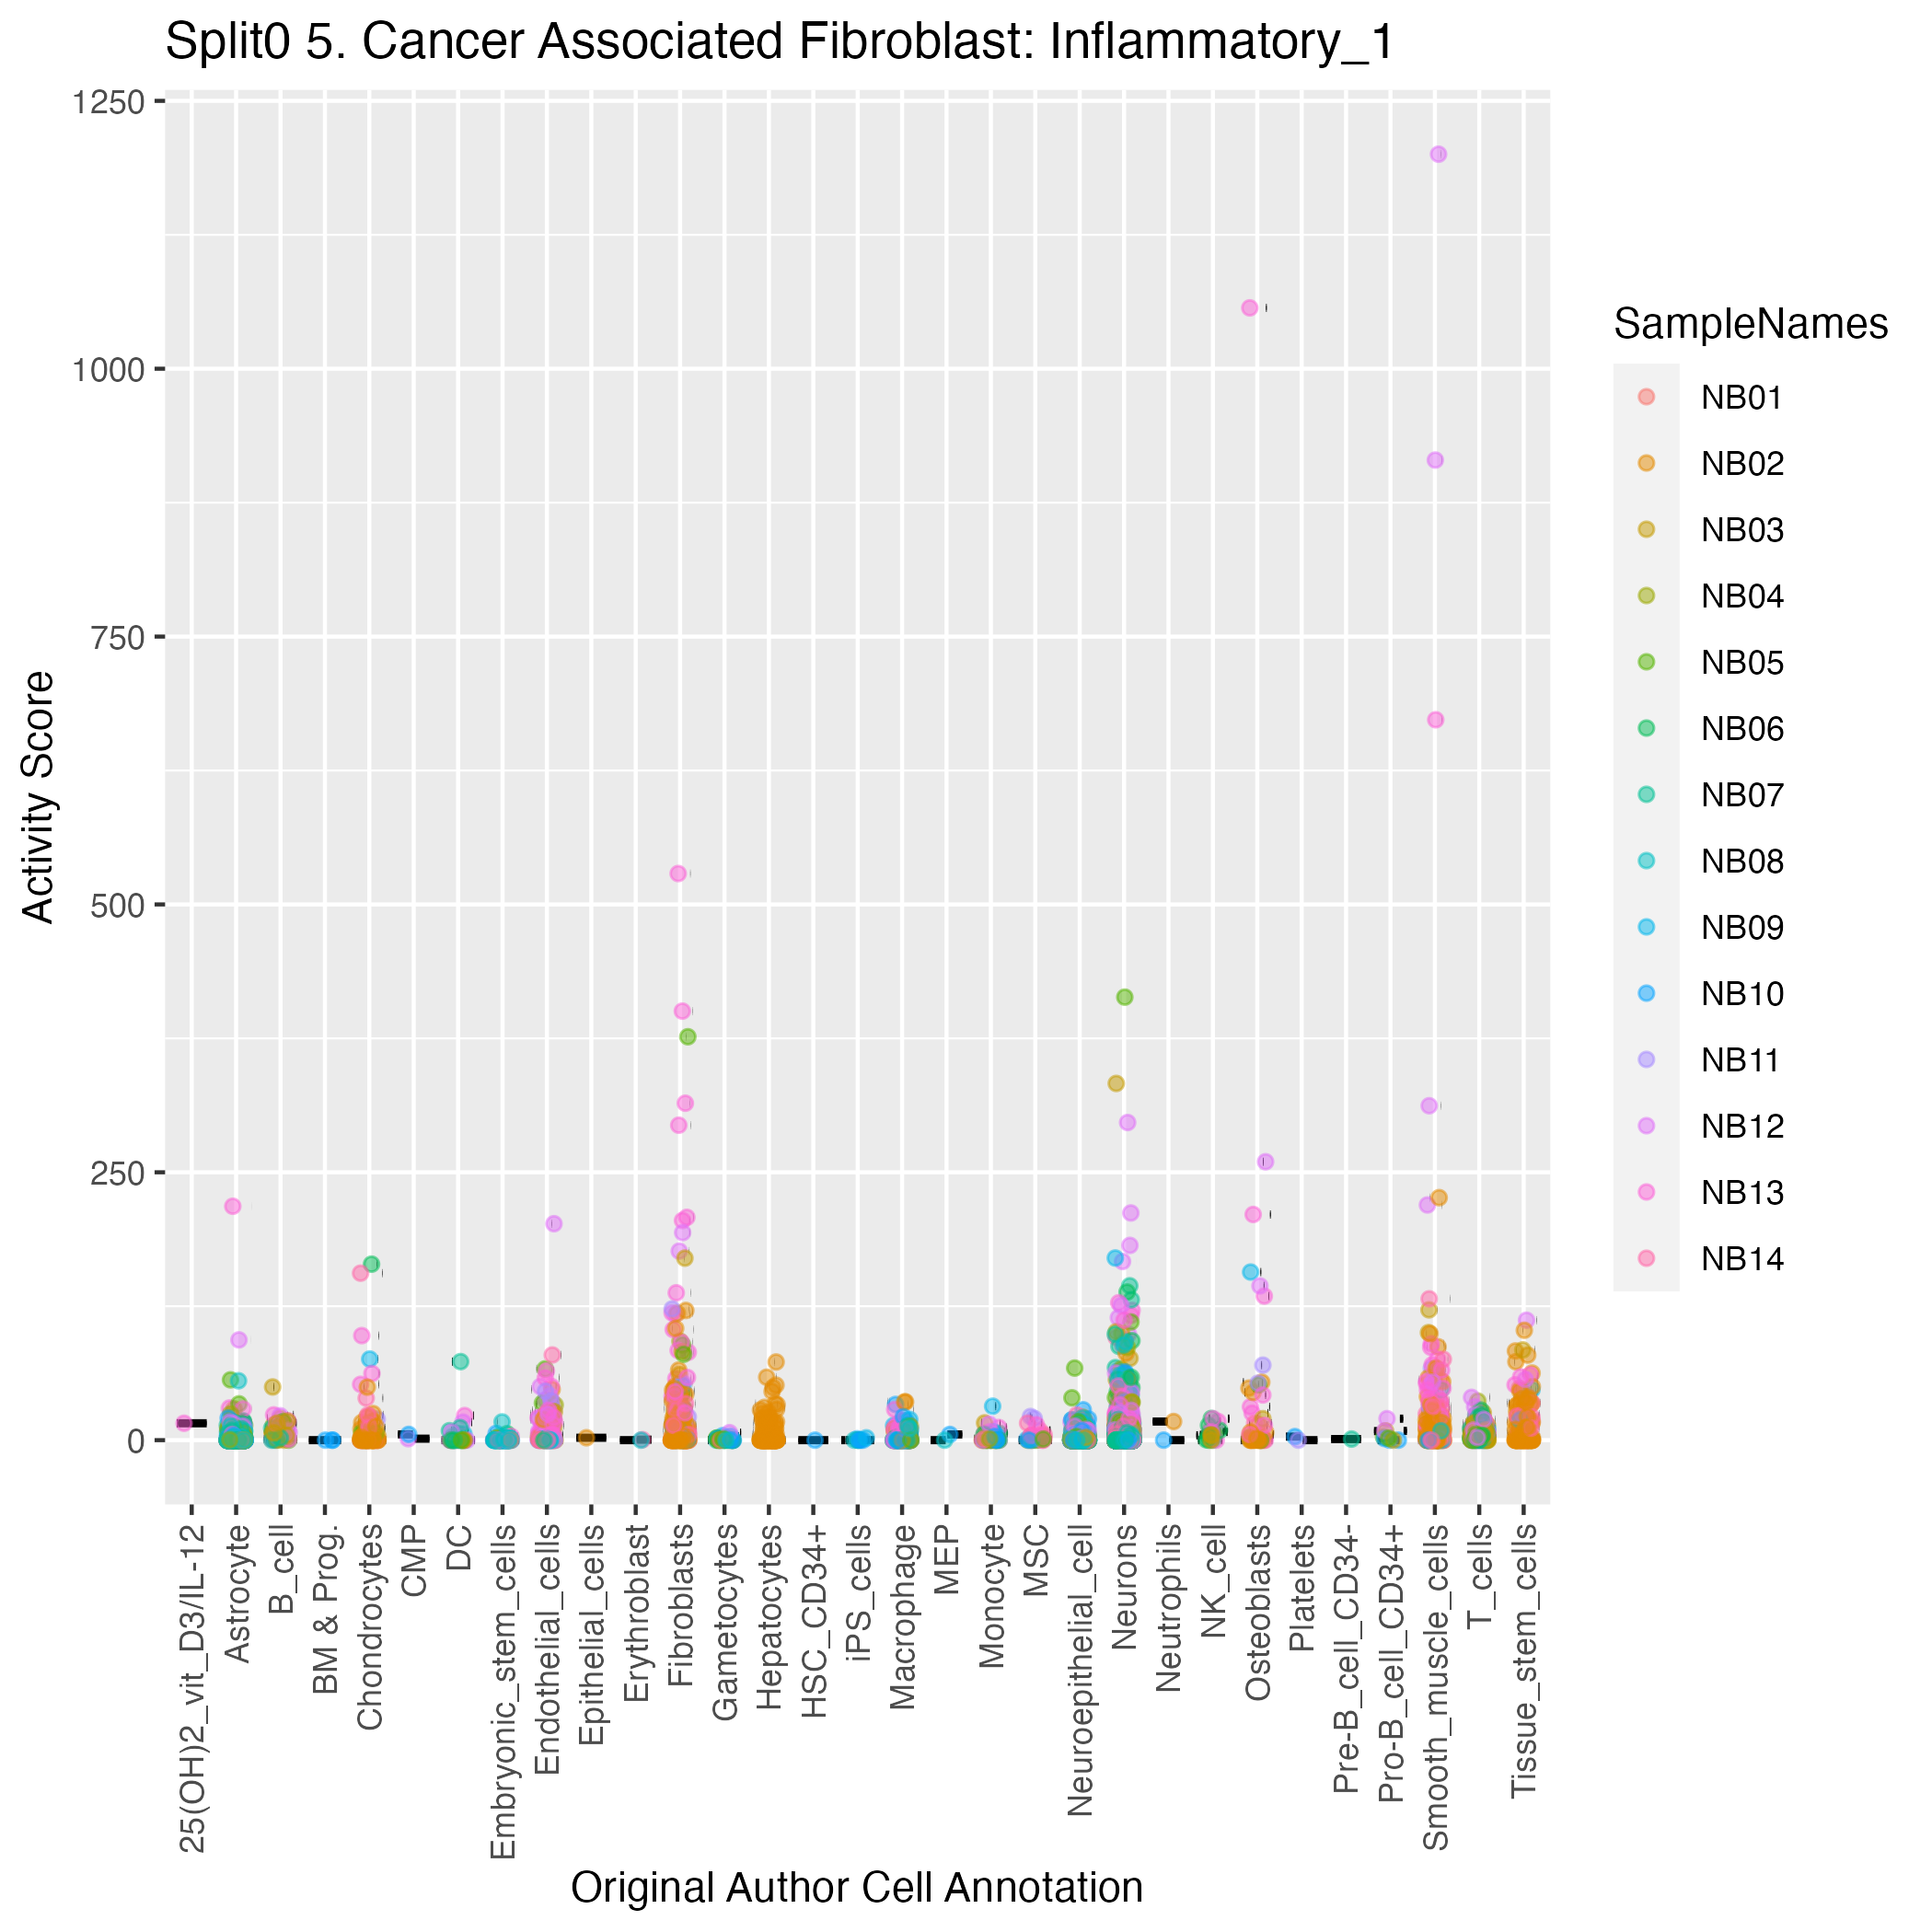
UMAP plots showing activity of gene expression program identified in community:5. Cancer Associated Fibroblast: Inflammatory
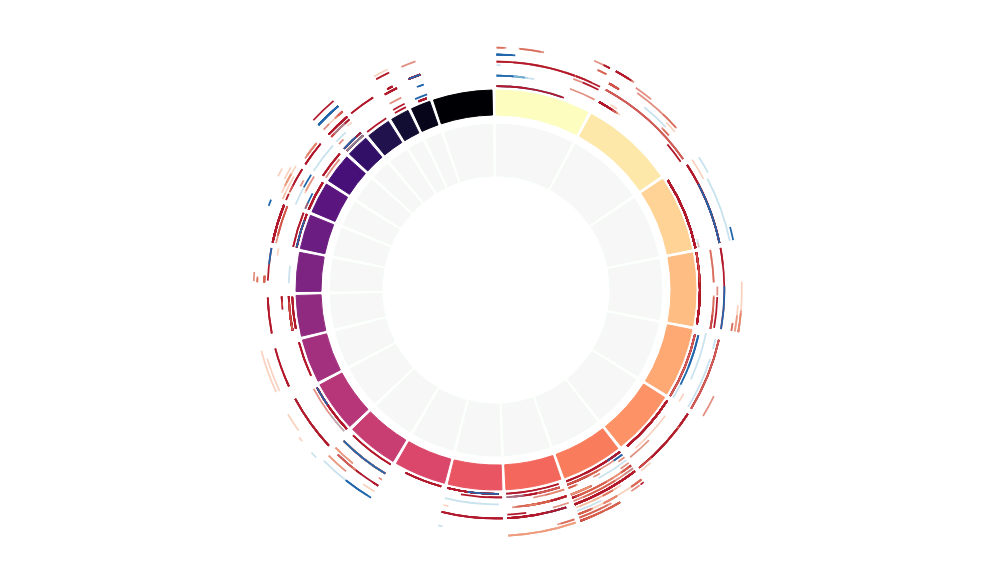
CNV Data procured from inferCNV.
Outer tracks are putative CNV regions (gains = red, losses = blue) for each patient
Inner track is expression data representing:
The top cells expressing this GEP (purple)
Random cells (n =50) from the reference set used in inferCNV (orange)
Gene set Enrichments for this program, caculated from top 50 genes
mSigDB Cell Types Gene Set:
| P-value | OR | Lower 95% CI | FDR | FWER | Genes Found | Gene Set Size | |
|---|---|---|---|---|---|---|---|
| TRAVAGLINI_LUNG_VEIN_CELL | 9.97e-09 | 49.98 | 16.33 | 1.12e-06 | 6.69e-06 | 6C7, TIMP1, CLU, ABI3BP, VCAM1, TNFAIP3 |
40 |
| DURANTE_ADULT_OLFACTORY_NEUROEPITHELIUM_FIBROBLASTS_STROMAL_CELLS | 2.99e-08 | 27.08 | 9.96 | 2.23e-06 | 2.00e-05 | 7IGFBP7, POSTN, TIMP1, PRRX1, CCL2, KCNE4, CALD1 |
82 |
| AIZARANI_LIVER_C33_STELLATE_CELLS_2 | 1.26e-09 | 23.42 | 9.79 | 1.69e-07 | 8.47e-07 | 9C7, IGFBP7, PRKG1, UACA, NFIA, RBPMS, ID3, CALD1, EPB41L2 |
126 |
| LAKE_ADULT_KIDNEY_C28_INTERSTITIUM | 4.16e-08 | 25.71 | 9.48 | 2.79e-06 | 2.79e-05 | 7C7, TNC, IGFBP7, PRKG1, UACA, NFIA, CALD1 |
86 |
| HU_FETAL_RETINA_FIBROBLAST | 8.48e-12 | 14.48 | 7.28 | 1.90e-09 | 5.69e-09 | 15IGFBP7, SULF1, TIMP1, FN1, PRRX1, SLC26A7, UACA, NFIA, B2M, PDGFRB, ID3, CALD1, SVIL, EPB41L2, EPHA3 |
385 |
| TRAVAGLINI_LUNG_MYOFIBROBLAST_CELL | 5.50e-06 | 23.11 | 6.92 | 2.31e-04 | 3.69e-03 | 5TNC, POSTN, CLU, GEM, HS3ST3A1 |
65 |
| LAKE_ADULT_KIDNEY_C26_MESANGIAL_CELLS | 2.44e-08 | 16.33 | 6.87 | 2.05e-06 | 1.64e-05 | 9C7, IGFBP7, POSTN, PRKG1, UACA, B2M, PDGFRB, CALD1, EPB41L2 |
177 |
| MANNO_MIDBRAIN_NEUROTYPES_HPERIC | 1.90e-13 | 11.71 | 6.32 | 1.27e-10 | 1.27e-10 | 21IGFBP7, ADAM12, TIMP1, FN1, PRKG1, GEM, UACA, B2M, ARHGAP42, CCL2, ARHGAP15, PDGFRB, OSMR, ITIH5, KCNE4, RBPMS, ID3, TNFAIP3, CALD1, SVIL, EPB41L2 |
795 |
| MURARO_PANCREAS_MESENCHYMAL_STROMAL_CELL | 1.71e-12 | 11.60 | 6.16 | 5.72e-10 | 1.14e-09 | 19TNC, IGFBP7, SULF1, POSTN, ADAM12, TIMP1, FN1, PRRX1, PRKG1, GEM, UACA, IL33, PDGFRB, OSMR, KCNE4, RBPMS, ID3, CALD1, SVIL |
680 |
| FAN_EMBRYONIC_CTX_BRAIN_ENDOTHELIAL_2 | 1.72e-08 | 12.07 | 5.52 | 1.65e-06 | 1.15e-05 | 11IGFBP7, ADAM12, TIMP1, FN1, PRKG1, UACA, ARHGAP42, PDGFRB, ITIH5, KCNE4, CALD1 |
303 |
| MENON_FETAL_KIDNEY_3_STROMAL_CELLS | 1.62e-05 | 18.27 | 5.51 | 5.17e-04 | 1.09e-02 | 5TNC, POSTN, FN1, UACA, CALD1 |
81 |
| HAY_BONE_MARROW_STROMAL | 1.21e-11 | 10.28 | 5.46 | 2.02e-09 | 8.10e-09 | 19C7, TNC, IGFBP7, SULF1, FN1, PRRX1, NPY1R, GEM, ABI3BP, PDE1A, CCL2, PDGFRB, OSMR, ITIH5, KCNE4, VCAM1, ID3, CALD1, EPHA3 |
765 |
| LAKE_ADULT_KIDNEY_C29_UNKNOWN_NOVEL_PT_CFH_POS_SUBPOPULATION_S2 | 2.16e-05 | 17.14 | 5.17 | 6.31e-04 | 1.45e-02 | 5PARD3B, BNC2, PDE1A, ZFPM2, SVIL |
86 |
| AIZARANI_LIVER_C21_STELLATE_CELLS_1 | 7.76e-07 | 12.80 | 5.12 | 4.34e-05 | 5.20e-04 | 8C7, IGFBP7, TIMP1, GEM, NFIA, CCL2, RBPMS, CALD1 |
194 |
| DESCARTES_FETAL_LIVER_STELLATE_CELLS | 2.67e-06 | 13.38 | 5.00 | 1.24e-04 | 1.79e-03 | 7POSTN, ADAMTS12, GEM, PDGFRB, ITIH5, KCNE4, EPHA3 |
159 |
| AIZARANI_LIVER_C32_MVECS_3 | 9.09e-06 | 14.32 | 4.89 | 3.31e-04 | 6.10e-03 | 6C7, IGFBP7, NFIA, B2M, IL33, VCAM1 |
125 |
| DURANTE_ADULT_OLFACTORY_NEUROEPITHELIUM_VASCULAR_SMOOTH_MUSCLE_CELLS | 3.15e-05 | 15.77 | 4.77 | 8.14e-04 | 2.12e-02 | 5IGFBP7, GEM, CCL2, PDGFRB, CALD1 |
93 |
| DESCARTES_FETAL_PANCREAS_CCL19_CCL21_POSITIVE_CELLS | 1.24e-04 | 17.81 | 4.52 | 2.60e-03 | 8.31e-02 | 4TNC, SLC26A7, FGF11, VCAM1 |
65 |
| LAKE_ADULT_KIDNEY_C22_ENDOTHELIAL_CELLS_GLOMERULAR_CAPILLARIES | 1.53e-05 | 13.01 | 4.45 | 5.13e-04 | 1.03e-02 | 6PRKG1, UACA, NFIA, GNA14, CALD1, SVIL |
137 |
| HU_FETAL_RETINA_RPE | 1.59e-06 | 9.70 | 4.10 | 8.20e-05 | 1.07e-03 | 9IGFBP7, SULF1, GEM, UACA, B2M, PDGFRB, BACE2, ID3, CALD1 |
292 |
Dowload full table
mSigDB Hallmark Gene Sets:
| P-value | OR | Lower 95% CI | FDR | FWER | Genes Found | Gene Set Size | |
|---|---|---|---|---|---|---|---|
| HALLMARK_EPITHELIAL_MESENCHYMAL_TRANSITION | 1.15e-11 | 20.99 | 9.83 | 5.75e-10 | 5.75e-10 | 12TNC, POSTN, ADAM12, TIMP1, FN1, PRRX1, GEM, ABI3BP, PDGFRB, VCAM1, TNFAIP3, CALD1 |
200 |
| HALLMARK_COMPLEMENT | 1.24e-04 | 8.78 | 3.02 | 3.09e-03 | 6.18e-03 | 6TIMP1, FN1, CLU, ZFPM2, C3, TNFAIP3 |
200 |
| HALLMARK_TNFA_SIGNALING_VIA_NFKB | 1.08e-03 | 7.12 | 2.18 | 1.80e-02 | 5.40e-02 | 5TNC, GEM, BIRC3, CCL2, TNFAIP3 |
200 |
| HALLMARK_COAGULATION | 2.09e-03 | 8.11 | 2.09 | 2.62e-02 | 1.05e-01 | 4TIMP1, FN1, CLU, C3 |
138 |
| HALLMARK_APOPTOSIS | 3.63e-03 | 6.92 | 1.79 | 3.63e-02 | 1.82e-01 | 4TIMP1, CLU, BIRC3, PDGFRB |
161 |
| HALLMARK_ANGIOGENESIS | 8.94e-03 | 15.30 | 1.73 | 4.97e-02 | 4.47e-01 | 2POSTN, TIMP1 |
36 |
| HALLMARK_MYOGENESIS | 7.71e-03 | 5.55 | 1.44 | 4.82e-02 | 3.85e-01 | 4IGFBP7, ADAM12, CLU, SVIL |
200 |
| HALLMARK_INTERFERON_GAMMA_RESPONSE | 7.71e-03 | 5.55 | 1.44 | 4.82e-02 | 3.85e-01 | 4B2M, CCL2, VCAM1, TNFAIP3 |
200 |
| HALLMARK_KRAS_SIGNALING_UP | 7.71e-03 | 5.55 | 1.44 | 4.82e-02 | 3.85e-01 | 4PRRX1, BIRC3, IL33, TNFAIP3 |
200 |
| HALLMARK_INFLAMMATORY_RESPONSE | 4.35e-02 | 4.05 | 0.80 | 1.98e-01 | 1.00e+00 | 3TIMP1, CCL2, OSMR |
200 |
| HALLMARK_ALLOGRAFT_REJECTION | 4.35e-02 | 4.05 | 0.80 | 1.98e-01 | 1.00e+00 | 3TIMP1, B2M, CCL2 |
200 |
| HALLMARK_UV_RESPONSE_DN | 1.10e-01 | 3.67 | 0.43 | 4.59e-01 | 1.00e+00 | 2PDGFRB, RBPMS |
144 |
| HALLMARK_ADIPOGENESIS | 1.85e-01 | 2.63 | 0.31 | 6.05e-01 | 1.00e+00 | 2ITIH5, C3 |
200 |
| HALLMARK_ESTROGEN_RESPONSE_EARLY | 1.85e-01 | 2.63 | 0.31 | 6.05e-01 | 1.00e+00 | 2NPY1R, SVIL |
200 |
| HALLMARK_APICAL_JUNCTION | 1.85e-01 | 2.63 | 0.31 | 6.05e-01 | 1.00e+00 | 2VCAM1, EPB41L2 |
200 |
| HALLMARK_TGF_BETA_SIGNALING | 1.94e-01 | 4.81 | 0.12 | 6.05e-01 | 1.00e+00 | 1ID3 |
54 |
| HALLMARK_CHOLESTEROL_HOMEOSTASIS | 2.55e-01 | 3.49 | 0.09 | 7.50e-01 | 1.00e+00 | 1CLU |
74 |
| HALLMARK_IL6_JAK_STAT3_SIGNALING | 2.93e-01 | 2.97 | 0.07 | 7.87e-01 | 1.00e+00 | 1OSMR |
87 |
| HALLMARK_INTERFERON_ALPHA_RESPONSE | 3.20e-01 | 2.66 | 0.07 | 7.87e-01 | 1.00e+00 | 1B2M |
97 |
| HALLMARK_ANDROGEN_RESPONSE | 3.28e-01 | 2.58 | 0.06 | 7.87e-01 | 1.00e+00 | 1B2M |
100 |
Dowload full table
KEGG Pathways:
| P-value | OR | Lower 95% CI | FDR | FWER | Genes Found | Gene Set Size | |
|---|---|---|---|---|---|---|---|
| KEGG_NOD_LIKE_RECEPTOR_SIGNALING_PATHWAY | 1.88e-03 | 13.52 | 2.62 | 3.50e-01 | 3.50e-01 | 3BIRC3, CCL2, TNFAIP3 |
62 |
| KEGG_FOCAL_ADHESION | 7.58e-03 | 5.57 | 1.44 | 7.05e-01 | 1.00e+00 | 4TNC, FN1, BIRC3, PDGFRB |
199 |
| KEGG_CALCIUM_SIGNALING_PATHWAY | 3.26e-02 | 4.56 | 0.90 | 9.43e-01 | 1.00e+00 | 3PDE1A, PDGFRB, GNA14 |
178 |
| KEGG_COMPLEMENT_AND_COAGULATION_CASCADES | 3.05e-02 | 7.77 | 0.90 | 9.43e-01 | 1.00e+00 | 2C7, C3 |
69 |
| KEGG_PATHWAYS_IN_CANCER | 3.70e-02 | 3.39 | 0.88 | 9.43e-01 | 1.00e+00 | 4FN1, FGF11, BIRC3, PDGFRB |
325 |
| KEGG_MELANOMA | 3.21e-02 | 7.55 | 0.87 | 9.43e-01 | 1.00e+00 | 2FGF11, PDGFRB |
71 |
| KEGG_REGULATION_OF_ACTIN_CYTOSKELETON | 5.07e-02 | 3.80 | 0.75 | 9.43e-01 | 1.00e+00 | 3FN1, FGF11, PDGFRB |
213 |
| KEGG_ECM_RECEPTOR_INTERACTION | 4.36e-02 | 6.35 | 0.74 | 9.43e-01 | 1.00e+00 | 2TNC, FN1 |
84 |
| KEGG_SMALL_CELL_LUNG_CANCER | 4.36e-02 | 6.35 | 0.74 | 9.43e-01 | 1.00e+00 | 2FN1, BIRC3 |
84 |
| KEGG_GAP_JUNCTION | 4.93e-02 | 5.92 | 0.69 | 9.43e-01 | 1.00e+00 | 2PRKG1, PDGFRB |
90 |
| KEGG_CYTOKINE_CYTOKINE_RECEPTOR_INTERACTION | 8.44e-02 | 3.05 | 0.60 | 1.00e+00 | 1.00e+00 | 3CCL2, PDGFRB, OSMR |
265 |
| KEGG_VASCULAR_SMOOTH_MUSCLE_CONTRACTION | 7.56e-02 | 4.61 | 0.54 | 1.00e+00 | 1.00e+00 | 2PRKG1, CALD1 |
115 |
| KEGG_SYSTEMIC_LUPUS_ERYTHEMATOSUS | 1.04e-01 | 3.80 | 0.44 | 1.00e+00 | 1.00e+00 | 2C7, C3 |
139 |
| KEGG_PRIMARY_BILE_ACID_BIOSYNTHESIS | 6.18e-02 | 16.98 | 0.40 | 1.00e+00 | 1.00e+00 | 1CYP7B1 |
16 |
| KEGG_GLYCOSAMINOGLYCAN_DEGRADATION | 8.04e-02 | 12.74 | 0.30 | 1.00e+00 | 1.00e+00 | 1HS3ST3A1 |
21 |
| KEGG_GLYCOSAMINOGLYCAN_BIOSYNTHESIS_HEPARAN_SULFATE | 9.85e-02 | 10.19 | 0.24 | 1.00e+00 | 1.00e+00 | 1HS3ST3A1 |
26 |
| KEGG_MAPK_SIGNALING_PATHWAY | 2.80e-01 | 1.97 | 0.23 | 1.00e+00 | 1.00e+00 | 2FGF11, PDGFRB |
267 |
| KEGG_PRION_DISEASES | 1.30e-01 | 7.50 | 0.18 | 1.00e+00 | 1.00e+00 | 1C7 |
35 |
| KEGG_TASTE_TRANSDUCTION | 1.87e-01 | 5.00 | 0.12 | 1.00e+00 | 1.00e+00 | 1PDE1A |
52 |
| KEGG_STEROID_HORMONE_BIOSYNTHESIS | 1.97e-01 | 4.72 | 0.12 | 1.00e+00 | 1.00e+00 | 1CYP7B1 |
55 |
Dowload full table
CHR Positional Gene Sets:
| P-value | OR | Lower 95% CI | FDR | FWER | Genes Found | Gene Set Size | |
|---|---|---|---|---|---|---|---|
| chr5p13 | 1.40e-02 | 6.38 | 1.25 | 1.00e+00 | 1.00e+00 | 3C7, ADAMTS12, OSMR |
128 |
| chr11q22 | 5.73e-02 | 5.42 | 0.63 | 1.00e+00 | 1.00e+00 | 2BIRC3, ARHGAP42 |
98 |
| chr6q23 | 6.57e-02 | 5.01 | 0.58 | 1.00e+00 | 1.00e+00 | 2TNFAIP3, EPB41L2 |
106 |
| chr8q22 | 1.22e-01 | 3.45 | 0.40 | 1.00e+00 | 1.00e+00 | 2GEM, ZFPM2 |
153 |
| chr3p11 | 9.13e-02 | 11.08 | 0.26 | 1.00e+00 | 1.00e+00 | 1EPHA3 |
24 |
| chr3q12 | 1.67e-01 | 5.67 | 0.14 | 1.00e+00 | 1.00e+00 | 1ABI3BP |
46 |
| chr10p14 | 1.71e-01 | 5.54 | 0.13 | 1.00e+00 | 1.00e+00 | 1ITIH5 |
47 |
| chr7q33 | 1.87e-01 | 5.00 | 0.12 | 1.00e+00 | 1.00e+00 | 1CALD1 |
52 |
| chr17p12 | 2.22e-01 | 4.11 | 0.10 | 1.00e+00 | 1.00e+00 | 1HS3ST3A1 |
63 |
| chr15q23 | 2.28e-01 | 3.99 | 0.10 | 1.00e+00 | 1.00e+00 | 1UACA |
65 |
| chr8p12 | 2.34e-01 | 3.86 | 0.09 | 1.00e+00 | 1.00e+00 | 1RBPMS |
67 |
| chr2q22 | 2.37e-01 | 3.81 | 0.09 | 1.00e+00 | 1.00e+00 | 1ARHGAP15 |
68 |
| chr8q13 | 2.46e-01 | 3.64 | 0.09 | 1.00e+00 | 1.00e+00 | 1SULF1 |
71 |
| chr13q13 | 2.67e-01 | 3.31 | 0.08 | 1.00e+00 | 1.00e+00 | 1POSTN |
78 |
| chr4q12 | 2.70e-01 | 3.27 | 0.08 | 1.00e+00 | 1.00e+00 | 1IGFBP7 |
79 |
| chr18q11 | 2.73e-01 | 3.23 | 0.08 | 1.00e+00 | 1.00e+00 | 1ANKRD29 |
80 |
| chr2q36 | 2.78e-01 | 3.15 | 0.08 | 1.00e+00 | 1.00e+00 | 1KCNE4 |
82 |
| chr8q12 | 2.95e-01 | 2.93 | 0.07 | 1.00e+00 | 1.00e+00 | 1CYP7B1 |
88 |
| chr1p21 | 3.25e-01 | 2.60 | 0.06 | 1.00e+00 | 1.00e+00 | 1VCAM1 |
99 |
| chr9p24 | 3.31e-01 | 2.55 | 0.06 | 1.00e+00 | 1.00e+00 | 1IL33 |
101 |
Dowload full table
Transcription Factor Targets:
| P-value | OR | Lower 95% CI | FDR | FWER | Genes Found | Gene Set Size | |
|---|---|---|---|---|---|---|---|
| HOX13_01 | 7.92e-04 | 18.54 | 3.56 | 3.03e-01 | 8.98e-01 | 3PRRX1, CALD1, SVIL |
46 |
| TGCCAAR_NF1_Q6 | 6.46e-05 | 4.93 | 2.27 | 7.32e-02 | 7.32e-02 | 11PAPLN, POSTN, ADAM12, BNC2, SLC26A7, NFIA, PDE1A, SLC9A9, ID3, CALD1, EPHA3 |
727 |
| CART1_01 | 1.94e-03 | 6.20 | 1.90 | 3.03e-01 | 1.00e+00 | 5PRRX1, BNC2, ZFPM2, BACE2, CALD1 |
229 |
| CEBP_Q2 | 2.29e-03 | 5.96 | 1.83 | 3.03e-01 | 1.00e+00 | 5CLU, PRKG1, OSMR, RBPMS, ID3 |
238 |
| PAX4_02 | 2.42e-03 | 5.88 | 1.81 | 3.03e-01 | 1.00e+00 | 5SLC26A7, NFIA, B2M, ARHGAP15, BACE2 |
241 |
| OCT1_04 | 2.51e-03 | 5.84 | 1.79 | 3.03e-01 | 1.00e+00 | 5BNC2, SLC26A7, NFIA, PDE1A, ZFPM2 |
243 |
| GATA1_04 | 2.69e-03 | 5.74 | 1.76 | 3.03e-01 | 1.00e+00 | 5BNC2, SLC26A7, RBPMS, ID3, CALD1 |
247 |
| AFP1_Q6 | 3.79e-03 | 5.28 | 1.62 | 3.03e-01 | 1.00e+00 | 5SULF1, PRRX1, ZFPM2, BACE2, CALD1 |
268 |
| NF1_Q6 | 3.90e-03 | 5.24 | 1.61 | 3.03e-01 | 1.00e+00 | 5SLC26A7, NFIA, FGF11, B2M, VCAM1 |
270 |
| CEBP_Q2_01 | 4.03e-03 | 5.20 | 1.60 | 3.03e-01 | 1.00e+00 | 5SULF1, PRKG1, BNC2, ID3, CALD1 |
272 |
| STAT5A_03 | 4.15e-03 | 5.16 | 1.59 | 3.03e-01 | 1.00e+00 | 5FN1, SLC26A7, FGF11, ID3, SVIL |
274 |
| NF1_Q6_01 | 4.28e-03 | 5.13 | 1.58 | 3.03e-01 | 1.00e+00 | 5POSTN, SLC26A7, NFIA, FGF11, B2M |
276 |
| YTAATTAA_LHX3_01 | 6.70e-03 | 5.78 | 1.50 | 3.35e-01 | 1.00e+00 | 4SULF1, PRRX1, BNC2, BACE2 |
192 |
| ZNF449_TARGET_GENES | 2.42e-03 | 2.96 | 1.41 | 3.03e-01 | 1.00e+00 | 12TNC, SULF1, FN1, GEM, ABI3BP, UACA, NFIA, B2M, BIRC3, RBPMS, SVIL, EPB41L2 |
1346 |
| MYOGNF1_01 | 1.55e-02 | 11.31 | 1.29 | 3.35e-01 | 1.00e+00 | 2NFIA, B2M |
48 |
| IRF2_01 | 1.42e-02 | 6.33 | 1.24 | 3.35e-01 | 1.00e+00 | 3BNC2, B2M, KCNE4 |
129 |
| LHX3_01 | 1.27e-02 | 4.77 | 1.24 | 3.35e-01 | 1.00e+00 | 4SULF1, PRRX1, PRKG1, ID3 |
232 |
| TTANTCA_UNKNOWN | 8.28e-03 | 2.87 | 1.22 | 3.35e-01 | 1.00e+00 | 9SULF1, TIMP1, PRRX1, BNC2, ABI3BP, PDE1A, ZFPM2, BACE2, SLC9A9 |
967 |
| ATF1_Q6 | 1.36e-02 | 4.67 | 1.21 | 3.35e-01 | 1.00e+00 | 4GEM, HS3ST3A1, PDE1A, CALD1 |
237 |
| GGGNNTTTCC_NFKB_Q6_01 | 1.57e-02 | 6.09 | 1.20 | 3.35e-01 | 1.00e+00 | 3BNC2, GEM, BIRC3 |
134 |
Dowload full table
GO Biological Processes:
| P-value | OR | Lower 95% CI | FDR | FWER | Genes Found | Gene Set Size | |
|---|---|---|---|---|---|---|---|
| GOBP_MICROGLIAL_CELL_PROLIFERATION | 4.28e-04 | 86.37 | 8.33 | 2.67e-01 | 1.00e+00 | 2CLU, IL33 |
8 |
| GOBP_REGULATION_OF_APOPTOTIC_CELL_CLEARANCE | 5.49e-04 | 74.10 | 7.33 | 2.67e-01 | 1.00e+00 | 2CCL2, C3 |
9 |
| GOBP_PROSTATE_GLAND_MORPHOGENESIS | 1.62e-04 | 33.18 | 6.19 | 1.53e-01 | 1.00e+00 | 3TNC, SULF1, CYP7B1 |
27 |
| GOBP_MACROPHAGE_PROLIFERATION | 9.99e-04 | 51.89 | 5.39 | 3.53e-01 | 1.00e+00 | 2CLU, IL33 |
12 |
| GOBP_REGULATION_OF_NUCLEOTIDE_BINDING_OLIGOMERIZATION_DOMAIN_CONTAINING_SIGNALING_PATHWAY | 1.18e-03 | 47.19 | 4.96 | 3.81e-01 | 1.00e+00 | 2BIRC3, TNFAIP3 |
13 |
| GOBP_NEGATIVE_REGULATION_OF_SMOOTH_MUSCLE_CONTRACTION | 1.37e-03 | 43.30 | 4.59 | 3.81e-01 | 1.00e+00 | 2PRKG1, ARHGAP42 |
14 |
| GOBP_POSITIVE_REGULATION_OF_NITRIC_OXIDE_SYNTHASE_BIOSYNTHETIC_PROCESS | 1.58e-03 | 39.95 | 4.27 | 3.92e-01 | 1.00e+00 | 2IL33, CCL2 |
15 |
| GOBP_PROSTATE_GLAND_DEVELOPMENT | 5.65e-04 | 20.97 | 4.00 | 2.67e-01 | 1.00e+00 | 3TNC, SULF1, CYP7B1 |
41 |
| GOBP_COMPLEMENT_ACTIVATION_ALTERNATIVE_PATHWAY | 2.28e-03 | 32.49 | 3.53 | 4.87e-01 | 1.00e+00 | 2C7, C3 |
18 |
| GOBP_CHRONIC_INFLAMMATORY_RESPONSE | 2.54e-03 | 30.58 | 3.34 | 4.90e-01 | 1.00e+00 | 2VCAM1, TNFAIP3 |
19 |
| GOBP_POSITIVE_REGULATION_OF_RECEPTOR_MEDIATED_ENDOCYTOSIS | 1.01e-03 | 16.95 | 3.26 | 3.53e-01 | 1.00e+00 | 3CLU, B2M, C3 |
50 |
| GOBP_NITRIC_OXIDE_SYNTHASE_BIOSYNTHETIC_PROCESS | 2.81e-03 | 28.89 | 3.17 | 4.90e-01 | 1.00e+00 | 2IL33, CCL2 |
20 |
| GOBP_POSITIVE_REGULATION_OF_CALCIUM_ION_IMPORT | 2.81e-03 | 28.89 | 3.17 | 4.90e-01 | 1.00e+00 | 2CCL2, PDGFRB |
20 |
| GOBP_EXTERNAL_ENCAPSULATING_STRUCTURE_ORGANIZATION | 1.77e-05 | 7.09 | 3.01 | 1.32e-01 | 1.32e-01 | 9TNC, PAPLN, SULF1, POSTN, ADAM12, TIMP1, FN1, ADAMTS12, VCAM1 |
396 |
| GOBP_NEGATIVE_REGULATION_OF_MUSCLE_CONTRACTION | 3.40e-03 | 26.01 | 2.87 | 5.42e-01 | 1.00e+00 | 2PRKG1, ARHGAP42 |
22 |
| GOBP_NEGATIVE_REGULATION_OF_REPRODUCTIVE_PROCESS | 1.48e-03 | 14.76 | 2.85 | 3.81e-01 | 1.00e+00 | 3SULF1, TIMP1, ZFPM2 |
57 |
| GOBP_RESPONSE_TO_RETINOIC_ACID | 7.16e-04 | 10.98 | 2.82 | 3.15e-01 | 1.00e+00 | 4TNC, IGFBP7, PDGFRB, EPHA3 |
103 |
| GOBP_INNERVATION | 3.72e-03 | 24.78 | 2.74 | 5.56e-01 | 1.00e+00 | 2SULF1, VCAM1 |
23 |
| GOBP_ACUTE_INFLAMMATORY_RESPONSE | 8.25e-04 | 10.55 | 2.71 | 3.43e-01 | 1.00e+00 | 4FN1, OSMR, VCAM1, C3 |
107 |
| GOBP_GLAND_MORPHOGENESIS | 9.45e-04 | 10.15 | 2.61 | 3.53e-01 | 1.00e+00 | 4TNC, SULF1, CYP7B1, TNFAIP3 |
111 |
Dowload full table
Immunological Gene Sets:
| P-value | OR | Lower 95% CI | FDR | FWER | Genes Found | Gene Set Size | |
|---|---|---|---|---|---|---|---|
| GSE45365_NK_CELL_VS_BCELL_UP | 1.17e-04 | 8.88 | 3.05 | 4.05e-01 | 5.71e-01 | 6GEM, BIRC3, CYP7B1, VCAM1, ID3, TNFAIP3 |
198 |
| GSE36891_POLYIC_TLR3_VS_PAM_TLR2_STIM_PERITONEAL_MACROPHAGE_UP | 3.25e-04 | 9.38 | 2.87 | 4.05e-01 | 1.00e+00 | 5GEM, BIRC3, CCL2, KCNE4, TNFAIP3 |
153 |
| GSE37605_FOXP3_FUSION_GFP_VS_IRES_GFP_TREG_C57BL6_UP | 7.65e-04 | 7.72 | 2.36 | 4.05e-01 | 1.00e+00 | 5GEM, NFIA, CCL2, KCNE4, ID3 |
185 |
| GSE9509_LPS_VS_LPS_AND_IL10_STIM_IL10_KO_MACROPHAGE_20MIN_UP | 9.44e-04 | 7.35 | 2.25 | 4.05e-01 | 1.00e+00 | 5NFIA, BIRC3, BACE2, RBPMS, C3 |
194 |
| GSE18804_SPLEEN_MACROPHAGE_VS_BRAIN_TUMORAL_MACROPHAGE_UP | 9.88e-04 | 7.27 | 2.23 | 4.05e-01 | 1.00e+00 | 5TNC, PRRX1, CCL2, ID3, TNFAIP3 |
196 |
| GSE17721_CTRL_VS_LPS_6H_BMDC_DN | 1.06e-03 | 7.16 | 2.19 | 4.05e-01 | 1.00e+00 | 5TIMP1, SLC26A7, PDE1A, CCL2, ZFPM2 |
199 |
| GSE17721_LPS_VS_PAM3CSK4_1H_BMDC_DN | 1.06e-03 | 7.16 | 2.19 | 4.05e-01 | 1.00e+00 | 5BIRC3, PDGFRB, VCAM1, EPB41L2, EPHA3 |
199 |
| GSE13306_RA_VS_UNTREATED_TCONV_DN | 1.08e-03 | 7.12 | 2.18 | 4.05e-01 | 1.00e+00 | 5EXOC3L4, POSTN, ADAM12, NPY1R, B2M |
200 |
| GSE14769_UNSTIM_VS_40MIN_LPS_BMDM_DN | 1.08e-03 | 7.12 | 2.18 | 4.05e-01 | 1.00e+00 | 5EXOC3L4, BIRC3, CCL2, ID3, TNFAIP3 |
200 |
| GSE20715_0H_VS_24H_OZONE_LUNG_DN | 1.08e-03 | 7.12 | 2.18 | 4.05e-01 | 1.00e+00 | 5PAPLN, TIMP1, IL33, OSMR, C3 |
200 |
| GSE20715_0H_VS_48H_OZONE_TLR4_KO_LUNG_DN | 1.08e-03 | 7.12 | 2.18 | 4.05e-01 | 1.00e+00 | 5TNC, CLU, CYP7B1, IL33, OSMR |
200 |
| GSE9601_NFKB_INHIBITOR_VS_PI3K_INHIBITOR_TREATED_HCMV_INF_MONOCYTE_DN | 1.08e-03 | 7.12 | 2.18 | 4.05e-01 | 1.00e+00 | 5TIMP1, GEM, IL33, CCL2, KCNE4 |
200 |
| GSE43955_1H_VS_20H_ACT_CD4_TCELL_WITH_TGFB_IL6_DN | 1.08e-03 | 7.12 | 2.18 | 4.05e-01 | 1.00e+00 | 5TNC, B2M, PDE1A, BIRC3, OSMR |
200 |
| GSE36891_UNSTIM_VS_POLYIC_TLR3_STIM_PERITONEAL_MACROPHAGE_UP | 2.76e-03 | 7.50 | 1.93 | 7.51e-01 | 1.00e+00 | 4ADAM12, CCL2, KCNE4, TNFAIP3 |
149 |
| GSE37605_TREG_VS_TCONV_NOD_FOXP3_FUSION_GFP_UP | 2.83e-03 | 7.44 | 1.92 | 7.51e-01 | 1.00e+00 | 4BIRC3, CCL2, KCNE4, ID3 |
150 |
| GSE7218_IGM_VS_IGG_SIGNAL_THGOUGH_ANTIGEN_BCELL_DN | 4.40e-03 | 6.55 | 1.69 | 7.51e-01 | 1.00e+00 | 4GEM, B2M, BIRC3, ARHGAP15 |
170 |
| GSE37605_TREG_VS_TCONV_NOD_FOXP3_FUSION_GFP_DN | 4.40e-03 | 6.55 | 1.69 | 7.51e-01 | 1.00e+00 | 4HS3ST3A1, PDE1A, CCL2, ID3 |
170 |
| GSE6259_33D1_POS_VS_DEC205_POS_FLT3L_INDUCED_SPLENIC_DC_UP | 4.87e-03 | 6.36 | 1.64 | 7.51e-01 | 1.00e+00 | 4FN1, PDGFRB, RBPMS, TNFAIP3 |
175 |
| GSE37605_FOXP3_FUSION_GFP_VS_IRES_GFP_TREG_C57BL6_DN | 4.96e-03 | 6.32 | 1.63 | 7.51e-01 | 1.00e+00 | 4HS3ST3A1, PDE1A, SLC9A9, ID3 |
176 |
| GSE21360_SECONDARY_VS_QUATERNARY_MEMORY_CD8_TCELL_UP | 5.58e-03 | 6.11 | 1.58 | 7.51e-01 | 1.00e+00 | 4CCL2, RBPMS, VCAM1, TNFAIP3 |
182 |
Top Ranked Transcription Factors for this Gene Expression Program:
| Gene Symbol | TF Rank | DNA Binding Domain | Motif Status | IUPAC PWM | GTEx | DepMap | Decartes |
|---|---|---|---|---|---|---|---|
| PRRX1 | 11 | Yes | Known motif | Monomer or homomultimer | High-throughput in vitro | None | None |
| CLU | 13 | No | Unlikely to be sequence specific TF | Not a DNA binding protein | No motif | None | Included only because GO says positive regulation of NF-kappaB transcription factor activity, but there is no DBD and no evidence of DNA binding. |
| BNC2 | 16 | Yes | Inferred motif | Monomer or homomultimer | In vivo/Misc source | Has a putative AT-hook | None |
| NFIA | 22 | Yes | Known motif | Monomer or homomultimer | High-throughput in vitro | None | None |
| ZFPM2 | 38 | Yes | Likely to be sequence specific TF | Monomer or homomultimer | No motif | None | FOG-proteins use some of their zinc-fingers to interact with the GATA proteins. Other C2H2 ZFs are probably also capable of binding DNA (PMID: 10329627). |
| ID3 | 43 | No | Unlikely to be sequence specific TF | Not a DNA binding protein | No motif | None | ID bHLH proteins lack the basic region and should not be able to bind DNA. The HT-SELEX motif for ID4 is likely by a co-precipitated protein or it is a contamination |
| TNFAIP3 | 45 | No | Unlikely to be sequence specific TF | Not a DNA binding protein | No motif | None | Inhibits NFKB-activation. No evidence for direct binding to DNA |
| HOXA10 | 51 | Yes | Known motif | Monomer or homomultimer | High-throughput in vitro | None | None |
| STK3 | 66 | No | Unlikely to be sequence specific TF | Not a DNA binding protein | No motif | None | Kinase - included only because GO says it regulates TFs |
| TBX18 | 67 | Yes | Known motif | Monomer or homomultimer | High-throughput in vitro | None | None |
| ERG | 75 | Yes | Known motif | Monomer or homomultimer | High-throughput in vitro | None | None |
| DEPTOR | 83 | No | Unlikely to be sequence specific TF | Not a DNA binding protein | No motif | None | None |
| NR2F2 | 92 | Yes | Known motif | Monomer or homomultimer | 100 perc ID - in vitro | None | None |
| HOXA7 | 96 | Yes | Known motif | Monomer or homomultimer | High-throughput in vitro | None | None |
| NOTCH3 | 98 | No | Unlikely to be sequence specific TF | Not a DNA binding protein | No motif | None | Fragment of NOTCH. Is a coactivator. |
| ETV6 | 100 | Yes | Known motif | Monomer or homomultimer | High-throughput in vitro | None | None |
| LPP | 108 | No | Unlikely to be sequence specific TF | Not a DNA binding protein | No motif | None | znfLIM is probably not a DNA binding domain (PMID: 8506279). The protein has been reported to be coactivator for ETV4 (PMID: 16738319). |
| HOXA9 | 109 | Yes | Known motif | Monomer or homomultimer | High-throughput in vitro | None | None |
| JUNB | 114 | Yes | Known motif | Monomer or homomultimer | High-throughput in vitro | None | Prefers forming heterodimers with FOS; FOSB; FOSL1 and FOSL2 over homodimers (PMID:12805554); but, clearly can bind DNA specifically in vitro. |
| RARB | 122 | Yes | Known motif | Monomer or homomultimer | High-throughput in vitro | None | None |
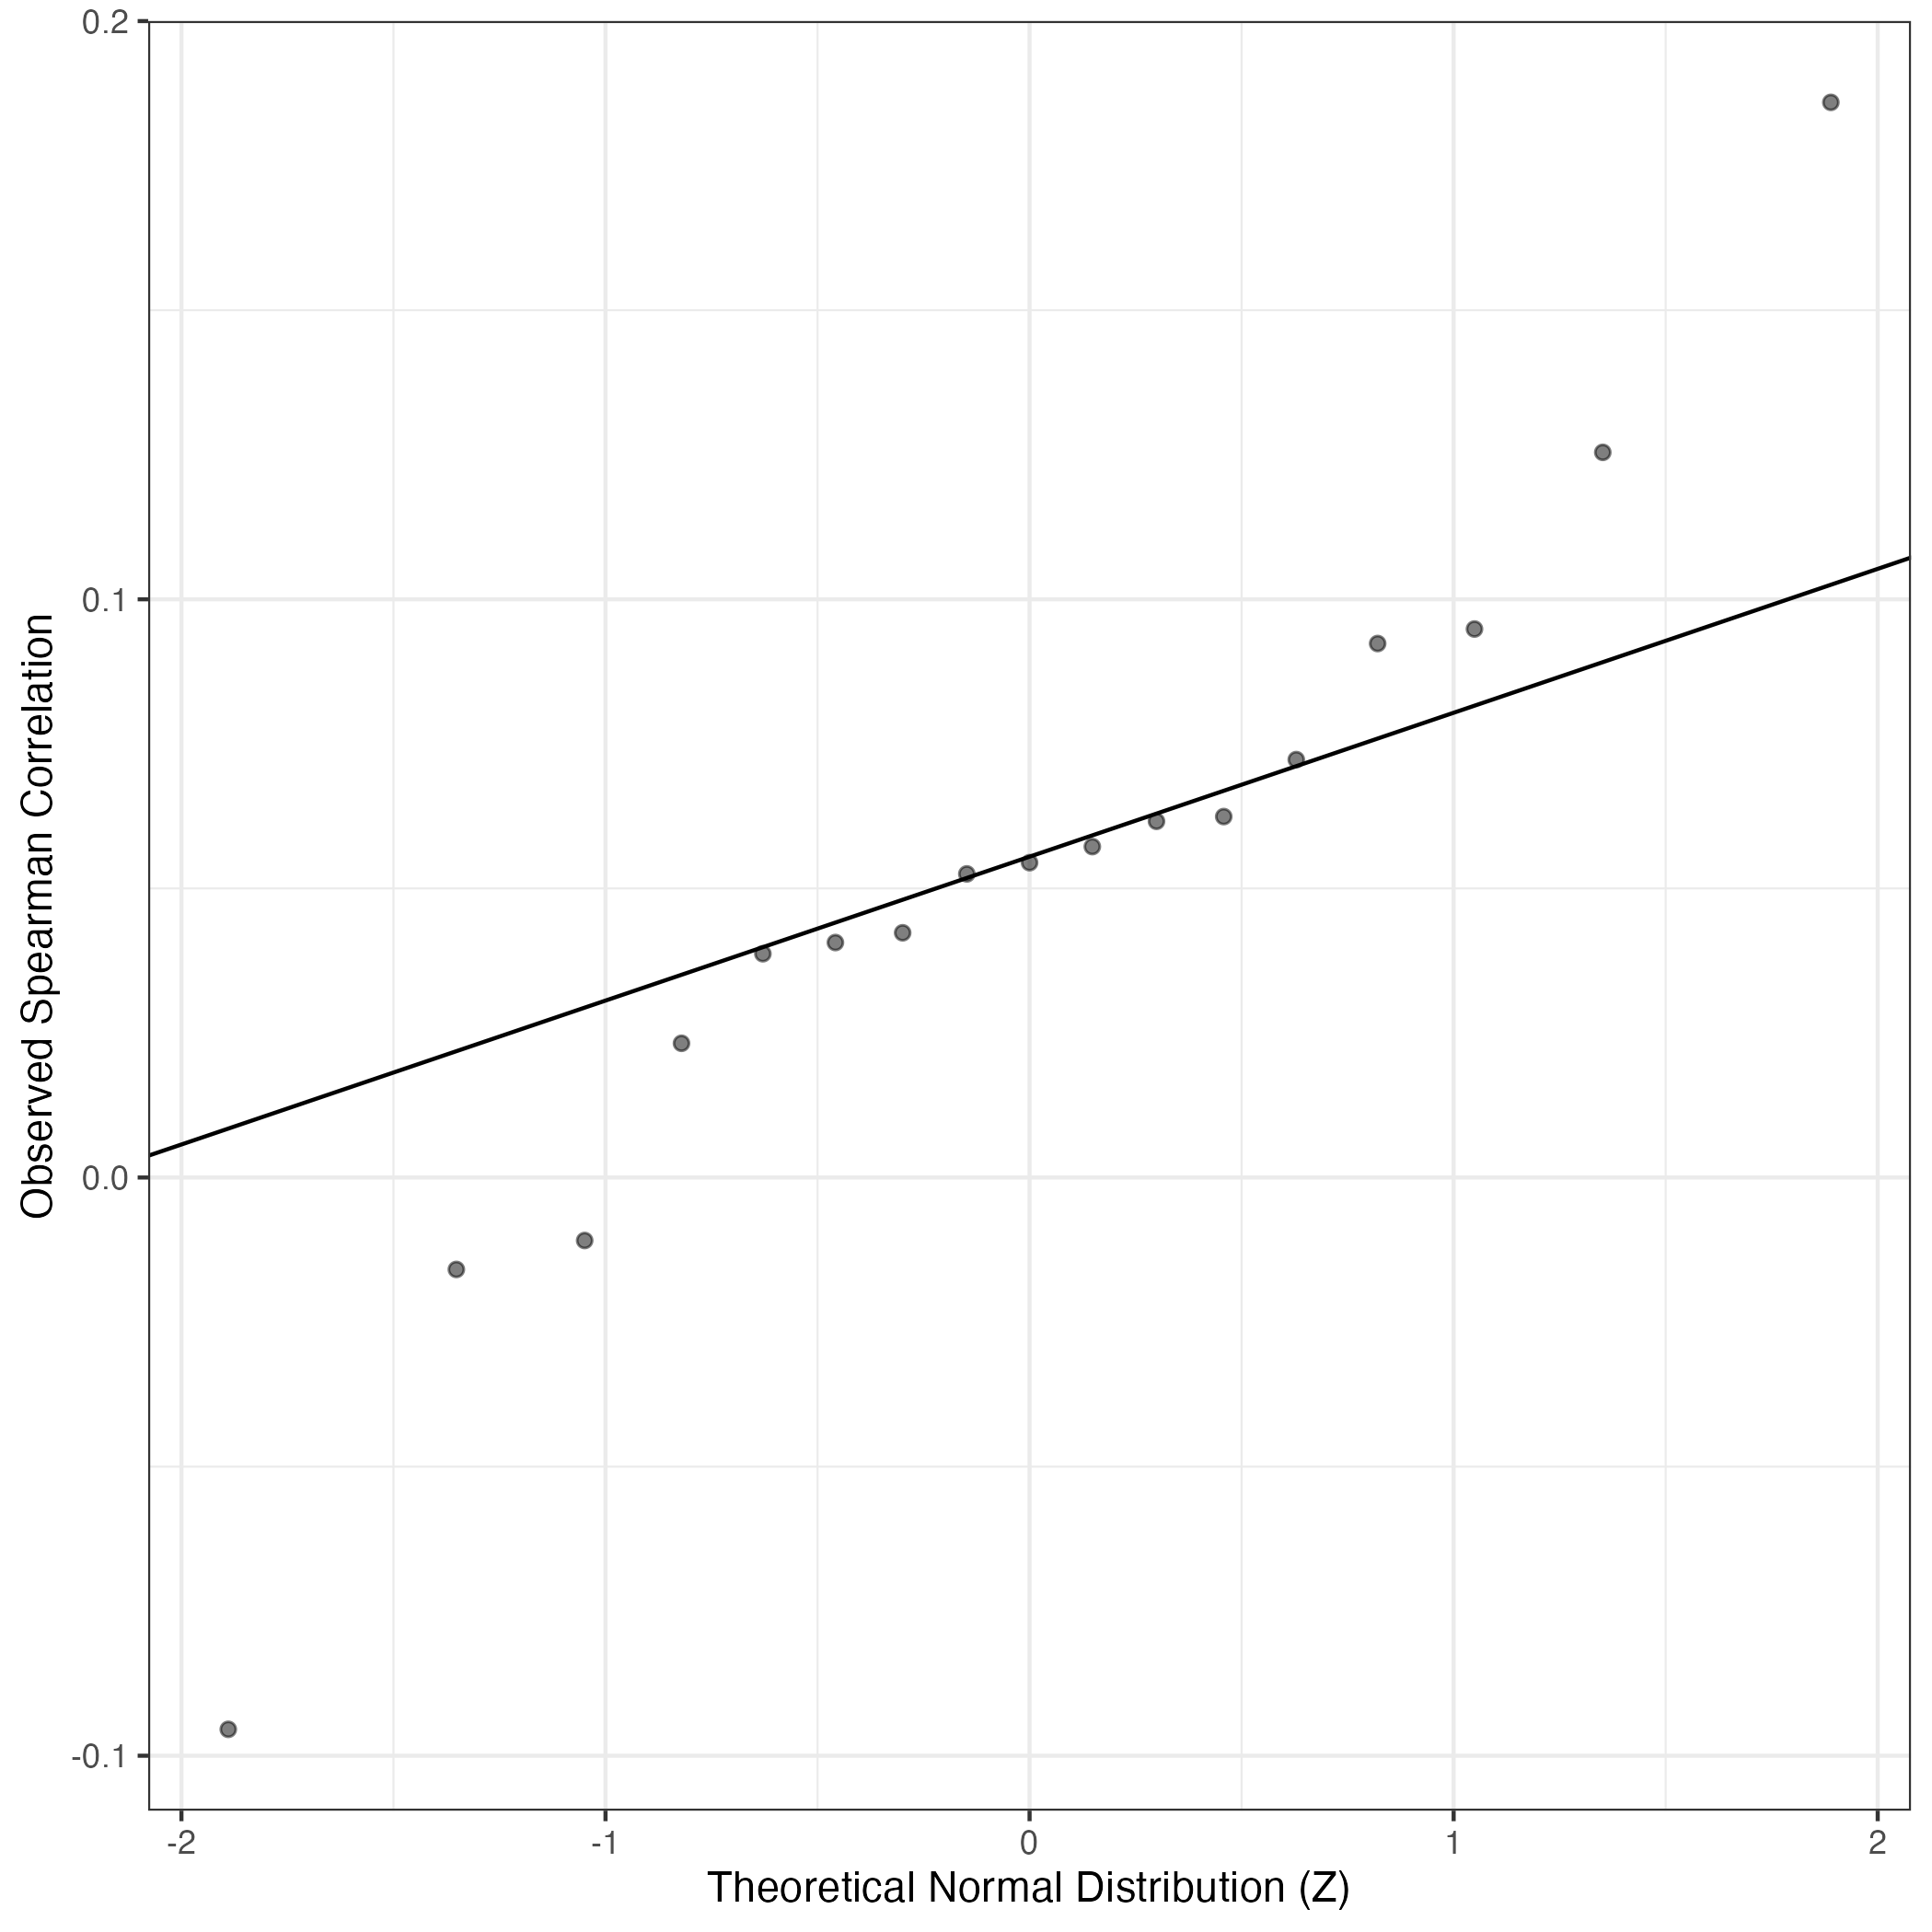
QQ Plot showing correlations with other Gene Expression Programs in this dataset, calculated by Spearman correlation:
Interactive QQ-plot of gene loadings:
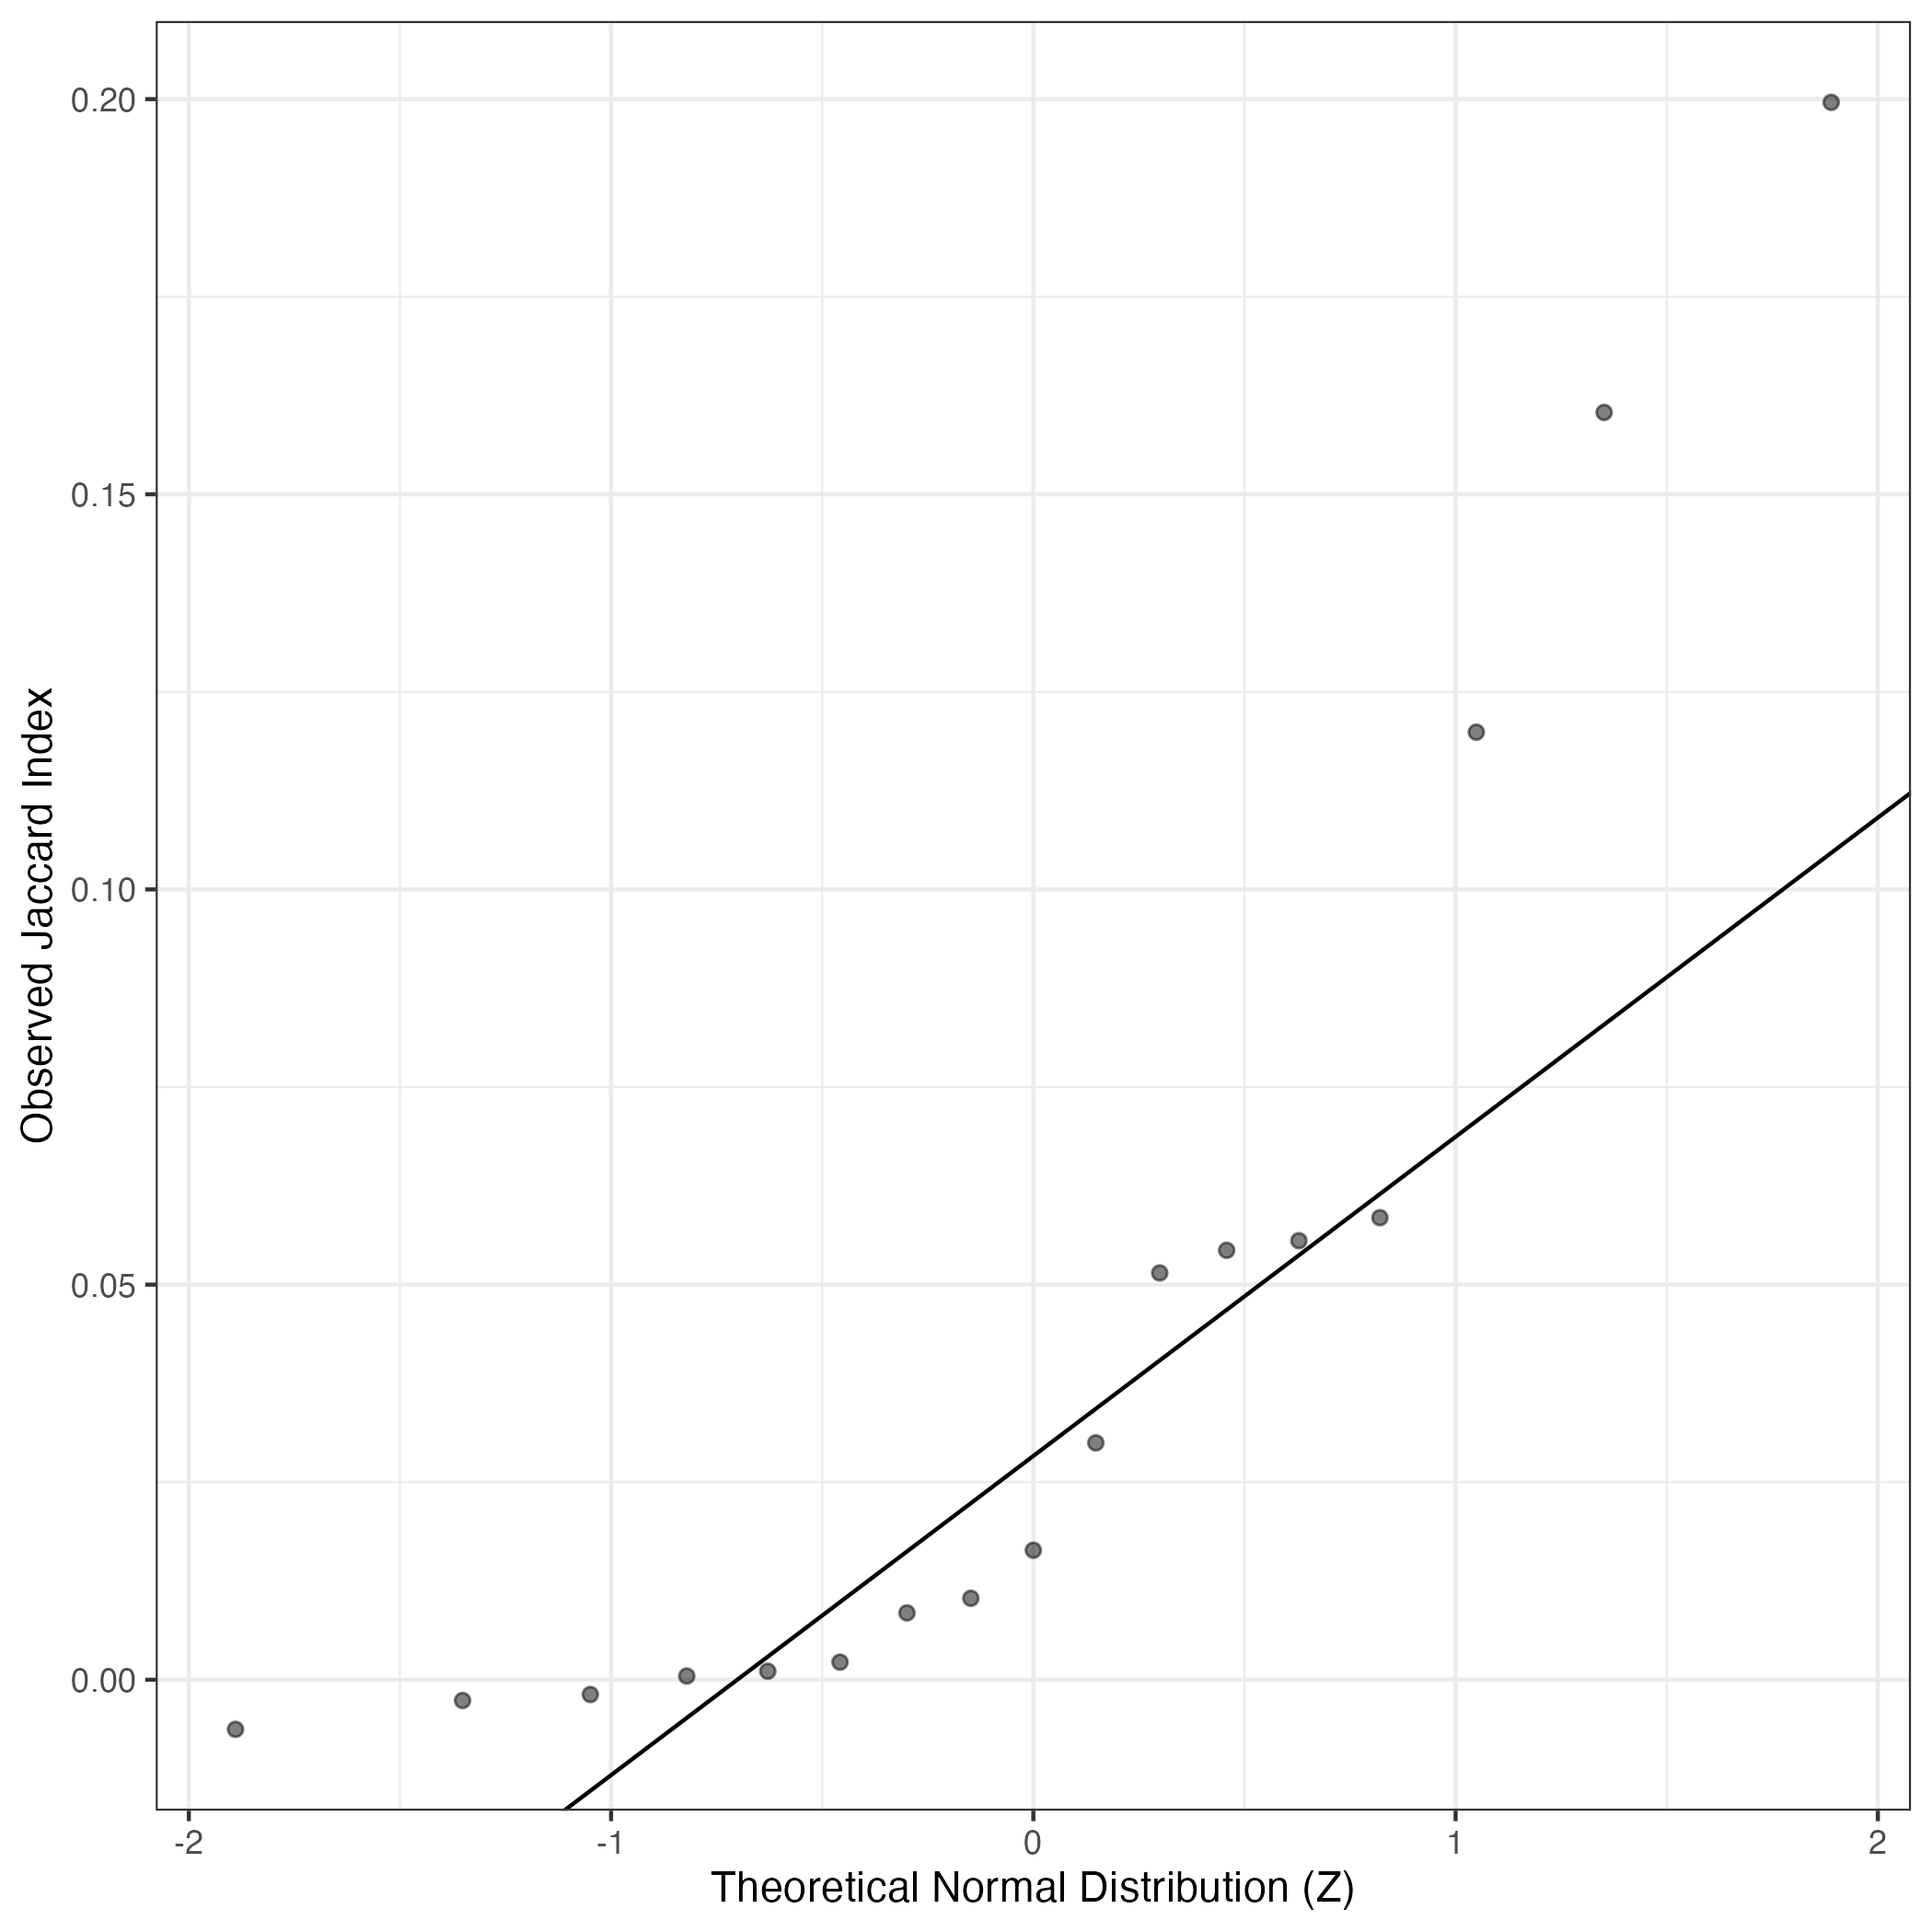
A similar QQ-plot as above, but only for instances where the H value is e.g. > 25, i.e. we are confident that the expression program is active above noise. Agreemenet between these binary vectors is tested using the Jaccard Index, with the P-values calculated by an exact test:
Interactive QQ-plot:
Singler cell type annotations for the top 50 cells on this program.
| Cell ID | Singler label | Singler Delta | Activity Score | Top Singler Raw Scores |
|---|---|---|---|---|
| NB12_CAGTAACTCCGATATG-1 | Smooth_muscle_cells:vascular | 0.16 | 1200.23 | Raw ScoresiPS_cells:CRL2097_foreskin: 0.26, Fibroblasts:breast: 0.25, Smooth_muscle_cells:vascular: 0.25, Smooth_muscle_cells:bronchial: 0.25, Smooth_muscle_cells:vascular:IL-17: 0.25, Smooth_muscle_cells:bronchial:vit_D: 0.25, Osteoblasts: 0.24, Osteoblasts:BMP2: 0.24, iPS_cells:adipose_stem_cells: 0.24, MSC: 0.24 |
| NB13_GAAACTCAGGGTATCG-1 | Fibroblasts:breast | 0.15 | 1056.79 | Raw ScoresOsteoblasts: 0.24, Osteoblasts:BMP2: 0.24, Smooth_muscle_cells:vascular: 0.24, Fibroblasts:breast: 0.24, iPS_cells:adipose_stem_cells: 0.24, iPS_cells:CRL2097_foreskin: 0.24, Smooth_muscle_cells:bronchial: 0.23, Tissue_stem_cells:BM_MSC: 0.23, Smooth_muscle_cells:bronchial:vit_D: 0.23, Smooth_muscle_cells:vascular:IL-17: 0.23 |
| NB12_TCCCGATTCCATGAAC-1 | Smooth_muscle_cells:bronchial:vit_D | 0.09 | 914.74 | Raw ScoresSmooth_muscle_cells:bronchial: 0.18, Smooth_muscle_cells:bronchial:vit_D: 0.18, Smooth_muscle_cells:vascular: 0.17, Osteoblasts: 0.17, Smooth_muscle_cells:vascular:IL-17: 0.17, Fibroblasts:breast: 0.16, iPS_cells:adipose_stem_cells: 0.16, iPS_cells:CRL2097_foreskin: 0.16, Osteoblasts:BMP2: 0.16, Tissue_stem_cells:BM_MSC: 0.16 |
| NB13_ATCATCTGTCGCGTGT-1 | Smooth_muscle_cells:vascular | 0.16 | 672.36 | Raw ScoresSmooth_muscle_cells:bronchial: 0.22, Fibroblasts:breast: 0.22, Smooth_muscle_cells:bronchial:vit_D: 0.22, Smooth_muscle_cells:vascular: 0.21, iPS_cells:adipose_stem_cells: 0.21, Smooth_muscle_cells:vascular:IL-17: 0.21, Osteoblasts: 0.2, iPS_cells:CRL2097_foreskin: 0.2, Osteoblasts:BMP2: 0.2, Tissue_stem_cells:BM_MSC:BMP2: 0.2 |
| NB13_AGGGAGTCAAACGCGA-1 | Chondrocytes:MSC-derived | 0.07 | 528.84 | Raw ScoresiPS_cells:CRL2097_foreskin: 0.16, Smooth_muscle_cells:bronchial: 0.16, Osteoblasts: 0.16, Chondrocytes:MSC-derived: 0.16, Fibroblasts:breast: 0.16, Smooth_muscle_cells:bronchial:vit_D: 0.16, Osteoblasts:BMP2: 0.16, Tissue_stem_cells:BM_MSC:TGFb3: 0.16, Smooth_muscle_cells:vascular: 0.16, iPS_cells:adipose_stem_cells: 0.15 |
| NB05_TGCGTGGCAGACAAAT-1 | Neurons:adrenal_medulla_cell_line | 0.15 | 413.48 | Raw ScoresNeurons:adrenal_medulla_cell_line: 0.33, Neuroepithelial_cell:ESC-derived: 0.33, Astrocyte:Embryonic_stem_cell-derived: 0.32, Endothelial_cells:HUVEC:VEGF: 0.3, Endothelial_cells:lymphatic:TNFa_48h: 0.3, Neurons:ES_cell-derived_neural_precursor: 0.3, Endothelial_cells:lymphatic: 0.3, Endothelial_cells:HUVEC: 0.29, MSC: 0.29, iPS_cells:CRL2097_foreskin: 0.29 |
| NB13_CTGATCCCATGGTTGT-1 | Tissue_stem_cells:BM_MSC | 0.09 | 400.44 | Raw ScoresiPS_cells:CRL2097_foreskin: 0.28, Smooth_muscle_cells:bronchial: 0.28, iPS_cells:PDB_fibroblasts: 0.28, Chondrocytes:MSC-derived: 0.27, Smooth_muscle_cells:bronchial:vit_D: 0.27, Osteoblasts: 0.27, iPS_cells:skin_fibroblast: 0.27, Fibroblasts:breast: 0.27, iPS_cells:fibroblasts: 0.27, iPS_cells:adipose_stem_cells: 0.27 |
| NB05_GTATCTTCACGCGAAA-1 | Fibroblasts:breast | 0.15 | 376.50 | Raw ScoresiPS_cells:CRL2097_foreskin: 0.28, Smooth_muscle_cells:bronchial: 0.27, Fibroblasts:breast: 0.27, MSC: 0.27, Smooth_muscle_cells:bronchial:vit_D: 0.27, iPS_cells:adipose_stem_cells: 0.26, Smooth_muscle_cells:vascular: 0.26, Astrocyte:Embryonic_stem_cell-derived: 0.26, iPS_cells:foreskin_fibrobasts: 0.26, Chondrocytes:MSC-derived: 0.26 |
| NB03_CTTGGCTCAGTGAGTG-1 | Neurons:adrenal_medulla_cell_line | 0.07 | 332.93 | Raw ScoresNeurons:adrenal_medulla_cell_line: 0.25, Astrocyte:Embryonic_stem_cell-derived: 0.24, Endothelial_cells:lymphatic:TNFa_48h: 0.23, Endothelial_cells:HUVEC:VEGF: 0.23, Endothelial_cells:lymphatic: 0.23, Smooth_muscle_cells:bronchial: 0.23, Neuroepithelial_cell:ESC-derived: 0.22, Smooth_muscle_cells:bronchial:vit_D: 0.22, iPS_cells:CRL2097_foreskin: 0.22, Neurons:ES_cell-derived_neural_precursor: 0.22 |
| NB13_AGCATACGTTCCCTTG-1 | Smooth_muscle_cells:vascular | 0.11 | 314.48 | Raw ScoresiPS_cells:CRL2097_foreskin: 0.19, Smooth_muscle_cells:bronchial: 0.18, Fibroblasts:breast: 0.18, Smooth_muscle_cells:vascular: 0.18, iPS_cells:adipose_stem_cells: 0.18, Osteoblasts: 0.18, Smooth_muscle_cells:bronchial:vit_D: 0.17, Smooth_muscle_cells:vascular:IL-17: 0.17, Tissue_stem_cells:BM_MSC: 0.17, iPS_cells:skin_fibroblast: 0.17 |
| NB12_AACTCAGGTTATTCTC-1 | Smooth_muscle_cells:vascular | 0.13 | 312.12 | Raw ScoresSmooth_muscle_cells:vascular: 0.22, Fibroblasts:breast: 0.21, Smooth_muscle_cells:bronchial: 0.21, Smooth_muscle_cells:bronchial:vit_D: 0.21, Smooth_muscle_cells:vascular:IL-17: 0.21, iPS_cells:CRL2097_foreskin: 0.21, iPS_cells:adipose_stem_cells: 0.21, MSC: 0.21, Tissue_stem_cells:BM_MSC: 0.21, Osteoblasts: 0.2 |
| NB12_CAGCGACGTGCAGACA-1 | Neurons:adrenal_medulla_cell_line | 0.14 | 296.47 | Raw ScoresNeuroepithelial_cell:ESC-derived: 0.21, Neurons:adrenal_medulla_cell_line: 0.21, Neurons:ES_cell-derived_neural_precursor: 0.2, iPS_cells:CRL2097_foreskin: 0.19, MSC: 0.19, Astrocyte:Embryonic_stem_cell-derived: 0.19, Fibroblasts:breast: 0.19, Tissue_stem_cells:lipoma-derived_MSC: 0.19, iPS_cells:skin_fibroblast: 0.18, iPS_cells:PDB_fibroblasts: 0.18 |
| NB13_CATCGGGAGATGAGAG-1 | iPS_cells:adipose_stem_cells | 0.10 | 293.97 | Raw ScoresiPS_cells:CRL2097_foreskin: 0.25, iPS_cells:adipose_stem_cells: 0.25, Fibroblasts:breast: 0.25, Osteoblasts: 0.24, Smooth_muscle_cells:bronchial: 0.24, iPS_cells:skin_fibroblast: 0.24, Smooth_muscle_cells:bronchial:vit_D: 0.24, iPS_cells:PDB_fibroblasts: 0.24, iPS_cells:fibroblasts: 0.24, Tissue_stem_cells:BM_MSC:TGFb3: 0.24 |
| NB12_AAACGGGGTCTTCAAG-1 | Osteoblasts | 0.09 | 259.85 | Raw ScoresSmooth_muscle_cells:bronchial: 0.16, Smooth_muscle_cells:bronchial:vit_D: 0.16, Osteoblasts: 0.16, Osteoblasts:BMP2: 0.15, Fibroblasts:breast: 0.15, iPS_cells:CRL2097_foreskin: 0.15, Tissue_stem_cells:BM_MSC:TGFb3: 0.15, Tissue_stem_cells:BM_MSC:BMP2: 0.15, Smooth_muscle_cells:vascular: 0.15, Tissue_stem_cells:iliac_MSC: 0.15 |
| NB02_GCAATCATCATAACCG-1 | iPS_cells:adipose_stem_cells | 0.09 | 226.34 | Raw ScoresSmooth_muscle_cells:bronchial: 0.14, Fibroblasts:breast: 0.14, Smooth_muscle_cells:bronchial:vit_D: 0.13, iPS_cells:CRL2097_foreskin: 0.13, Smooth_muscle_cells:vascular: 0.13, Smooth_muscle_cells:vascular:IL-17: 0.13, Osteoblasts: 0.13, iPS_cells:adipose_stem_cells: 0.13, Tissue_stem_cells:BM_MSC:TGFb3: 0.13, Chondrocytes:MSC-derived: 0.12 |
| NB12_GATGAGGTCCCTTGTG-1 | Smooth_muscle_cells:vascular | 0.11 | 219.51 | Raw ScoresSmooth_muscle_cells:bronchial: 0.18, Fibroblasts:breast: 0.18, Smooth_muscle_cells:bronchial:vit_D: 0.18, iPS_cells:adipose_stem_cells: 0.17, iPS_cells:CRL2097_foreskin: 0.17, Smooth_muscle_cells:vascular: 0.17, Osteoblasts: 0.17, Chondrocytes:MSC-derived: 0.16, Smooth_muscle_cells:vascular:IL-17: 0.16, Tissue_stem_cells:BM_MSC:TGFb3: 0.16 |
| NB13_CAGCAGCCAGCTTAAC-1 | Chondrocytes:MSC-derived | 0.05 | 218.32 | Raw ScoresAstrocyte:Embryonic_stem_cell-derived: 0.09, Chondrocytes:MSC-derived: 0.09, Osteoblasts: 0.08, iPS_cells:CRL2097_foreskin: 0.08, Fibroblasts:breast: 0.08, Smooth_muscle_cells:bronchial: 0.08, Smooth_muscle_cells:vascular: 0.08, Endothelial_cells:HUVEC:Serum_Amyloid_A: 0.08, Smooth_muscle_cells:bronchial:vit_D: 0.08, MSC: 0.08 |
| NB12_AGCTTGACAAGTTAAG-1 | Neurons:adrenal_medulla_cell_line | 0.16 | 212.03 | Raw ScoresNeurons:adrenal_medulla_cell_line: 0.23, Astrocyte:Embryonic_stem_cell-derived: 0.2, Neuroepithelial_cell:ESC-derived: 0.2, Neurons:ES_cell-derived_neural_precursor: 0.19, Embryonic_stem_cells: 0.17, iPS_cells:PDB_1lox-17Puro-10: 0.17, iPS_cells:PDB_1lox-21Puro-20: 0.16, iPS_cells:PDB_1lox-17Puro-5: 0.16, iPS_cells:PDB_1lox-21Puro-26: 0.16, iPS_cells:CRL2097_foreskin: 0.16 |
| NB13_TTCTACATCCAGAAGG-1 | iPS_cells:adipose_stem_cells | 0.16 | 210.63 | Raw ScoresFibroblasts:breast: 0.22, Osteoblasts: 0.22, iPS_cells:adipose_stem_cells: 0.22, iPS_cells:CRL2097_foreskin: 0.22, Smooth_muscle_cells:vascular: 0.22, Chondrocytes:MSC-derived: 0.21, Osteoblasts:BMP2: 0.21, Smooth_muscle_cells:bronchial: 0.21, Smooth_muscle_cells:bronchial:vit_D: 0.21, Smooth_muscle_cells:vascular:IL-17: 0.21 |
| NB13_TTAGGACAGAGAGCTC-1 | iPS_cells:adipose_stem_cells | 0.14 | 207.97 | Raw ScoresiPS_cells:adipose_stem_cells: 0.26, Fibroblasts:breast: 0.26, Smooth_muscle_cells:vascular: 0.25, iPS_cells:CRL2097_foreskin: 0.25, Chondrocytes:MSC-derived: 0.25, Smooth_muscle_cells:bronchial: 0.25, Smooth_muscle_cells:vascular:IL-17: 0.25, Tissue_stem_cells:BM_MSC: 0.25, Osteoblasts: 0.25, Osteoblasts:BMP2: 0.25 |
| NB13_ACCGTAAGTACGCACC-1 | Fibroblasts:breast | 0.11 | 205.00 | Raw ScoresFibroblasts:breast: 0.18, Tissue_stem_cells:BM_MSC: 0.18, iPS_cells:adipose_stem_cells: 0.18, Smooth_muscle_cells:bronchial: 0.18, MSC: 0.18, iPS_cells:skin_fibroblast: 0.18, Neurons:Schwann_cell: 0.18, Osteoblasts: 0.18, Chondrocytes:MSC-derived: 0.18, iPS_cells:CRL2097_foreskin: 0.18 |
| NB12_TGTCCCACATGGTCAT-1 | Endothelial_cells:lymphatic:TNFa_48h | 0.19 | 202.01 | Raw ScoresEndothelial_cells:lymphatic:TNFa_48h: 0.3, Endothelial_cells:lymphatic: 0.3, Endothelial_cells:HUVEC:VEGF: 0.29, Endothelial_cells:HUVEC:Serum_Amyloid_A: 0.27, Endothelial_cells:HUVEC: 0.27, Endothelial_cells:HUVEC:B._anthracis_LT: 0.26, Endothelial_cells:HUVEC:H5N1-infected: 0.26, Endothelial_cells:HUVEC:IL-1b: 0.26, Endothelial_cells:HUVEC:FPV-infected: 0.25, Endothelial_cells:HUVEC:PR8-infected: 0.25 |
| NB12_ATGAGGGTCTGGTGTA-1 | Fibroblasts:breast | 0.20 | 193.73 | Raw ScoresFibroblasts:breast: 0.27, iPS_cells:adipose_stem_cells: 0.26, Osteoblasts: 0.26, Tissue_stem_cells:BM_MSC:TGFb3: 0.25, Smooth_muscle_cells:vascular: 0.25, iPS_cells:CRL2097_foreskin: 0.25, Chondrocytes:MSC-derived: 0.25, Osteoblasts:BMP2: 0.25, Smooth_muscle_cells:vascular:IL-17: 0.24, Smooth_muscle_cells:bronchial:vit_D: 0.24 |
| NB12_GTGGGTCAGAGGGATA-1 | Neurons:adrenal_medulla_cell_line | 0.17 | 181.78 | Raw ScoresNeurons:adrenal_medulla_cell_line: 0.28, Astrocyte:Embryonic_stem_cell-derived: 0.24, Neuroepithelial_cell:ESC-derived: 0.24, Neurons:ES_cell-derived_neural_precursor: 0.23, iPS_cells:PDB_1lox-21Puro-20: 0.21, iPS_cells:PDB_1lox-21Puro-26: 0.21, iPS_cells:PDB_1lox-17Puro-10: 0.21, iPS_cells:PDB_1lox-17Puro-5: 0.2, Embryonic_stem_cells: 0.2, iPS_cells:PDB_2lox-22: 0.19 |
| NB12_AGCGTATTCTCTAAGG-1 | Neurons:adrenal_medulla_cell_line | 0.08 | 176.46 | Raw ScoresSmooth_muscle_cells:vascular: 0.16, Fibroblasts:breast: 0.16, Smooth_muscle_cells:bronchial: 0.15, Osteoblasts: 0.15, iPS_cells:CRL2097_foreskin: 0.15, Smooth_muscle_cells:vascular:IL-17: 0.15, Tissue_stem_cells:BM_MSC:BMP2: 0.15, Chondrocytes:MSC-derived: 0.15, iPS_cells:adipose_stem_cells: 0.15, Tissue_stem_cells:BM_MSC:TGFb3: 0.15 |
| NB09_TCCACACCAATGGATA-1 | Osteoblasts | 0.11 | 169.99 | Raw ScoresiPS_cells:CRL2097_foreskin: 0.19, MSC: 0.19, Smooth_muscle_cells:bronchial: 0.19, Chondrocytes:MSC-derived: 0.18, Osteoblasts: 0.18, Tissue_stem_cells:BM_MSC:TGFb3: 0.18, Fibroblasts:breast: 0.18, Smooth_muscle_cells:bronchial:vit_D: 0.18, Smooth_muscle_cells:vascular: 0.18, iPS_cells:adipose_stem_cells: 0.18 |
| NB03_AAGCCGCCACCAGCAC-1 | Smooth_muscle_cells:bronchial | 0.05 | 169.87 | Raw ScoresSmooth_muscle_cells:bronchial: 0.13, Smooth_muscle_cells:bronchial:vit_D: 0.13, iPS_cells:CRL2097_foreskin: 0.13, iPS_cells:skin_fibroblast: 0.12, Tissue_stem_cells:BM_MSC:TGFb3: 0.12, iPS_cells:fibroblasts: 0.12, iPS_cells:adipose_stem_cells: 0.12, Astrocyte:Embryonic_stem_cell-derived: 0.12, Fibroblasts:breast: 0.12, NK_cell:IL2: 0.12 |
| NB12_CAGCTAAGTATGAATG-1 | Neurons:adrenal_medulla_cell_line | 0.13 | 166.79 | Raw ScoresNeurons:adrenal_medulla_cell_line: 0.19, Astrocyte:Embryonic_stem_cell-derived: 0.17, Neuroepithelial_cell:ESC-derived: 0.16, Neurons:ES_cell-derived_neural_precursor: 0.16, Smooth_muscle_cells:bronchial: 0.15, iPS_cells:CRL2097_foreskin: 0.14, Smooth_muscle_cells:bronchial:vit_D: 0.14, MSC: 0.14, Smooth_muscle_cells:vascular: 0.14, Embryonic_stem_cells: 0.14 |
| NB06_AGTAGTCAGGTCATCT-1 | Neuroepithelial_cell:ESC-derived | 0.07 | 164.26 | Raw ScoresOsteoblasts: 0.17, iPS_cells:adipose_stem_cells: 0.17, iPS_cells:CRL2097_foreskin: 0.17, Fibroblasts:breast: 0.17, Smooth_muscle_cells:vascular: 0.17, Chondrocytes:MSC-derived: 0.17, Osteoblasts:BMP2: 0.17, Smooth_muscle_cells:vascular:IL-17: 0.16, Smooth_muscle_cells:bronchial: 0.16, Tissue_stem_cells:BM_MSC: 0.16 |
| NB09_TTGTAGGGTTCAGGCC-1 | Smooth_muscle_cells:vascular | 0.09 | 156.89 | Raw ScoresFibroblasts:breast: 0.14, Smooth_muscle_cells:vascular: 0.14, Smooth_muscle_cells:vascular:IL-17: 0.13, Neuroepithelial_cell:ESC-derived: 0.13, Neurons:ES_cell-derived_neural_precursor: 0.13, MSC: 0.13, iPS_cells:adipose_stem_cells: 0.13, Osteoblasts: 0.13, iPS_cells:CRL2097_foreskin: 0.13, Osteoblasts:BMP2: 0.13 |
| NB14_CAGAGAGTCGCGTTTC-1 | Tissue_stem_cells:BM_MSC | 0.15 | 155.86 | Raw ScoresChondrocytes:MSC-derived: 0.19, Fibroblasts:breast: 0.18, Smooth_muscle_cells:bronchial: 0.18, Smooth_muscle_cells:bronchial:vit_D: 0.18, iPS_cells:CRL2097_foreskin: 0.18, Osteoblasts: 0.18, iPS_cells:adipose_stem_cells: 0.18, Tissue_stem_cells:BM_MSC: 0.18, Smooth_muscle_cells:vascular: 0.18, Tissue_stem_cells:BM_MSC:TGFb3: 0.18 |
| NB07_AACCGCGCATTAGCCA-1 | Neurons:adrenal_medulla_cell_line | 0.17 | 144.08 | Raw ScoresNeurons:adrenal_medulla_cell_line: 0.29, Neuroepithelial_cell:ESC-derived: 0.26, Astrocyte:Embryonic_stem_cell-derived: 0.25, Neurons:ES_cell-derived_neural_precursor: 0.23, Embryonic_stem_cells: 0.21, iPS_cells:PDB_1lox-21Puro-20: 0.21, iPS_cells:PDB_1lox-17Puro-10: 0.21, iPS_cells:PDB_1lox-21Puro-26: 0.21, iPS_cells:PDB_1lox-17Puro-5: 0.21, iPS_cells:PDB_2lox-22: 0.21 |
| NB12_GATGAGGTCTCTGTCG-1 | Osteoblasts | 0.09 | 144.00 | Raw ScoresSmooth_muscle_cells:bronchial: 0.14, Smooth_muscle_cells:bronchial:vit_D: 0.14, iPS_cells:CRL2097_foreskin: 0.14, Osteoblasts: 0.14, Fibroblasts:breast: 0.14, Osteoblasts:BMP2: 0.13, iPS_cells:adipose_stem_cells: 0.13, MSC: 0.13, Smooth_muscle_cells:vascular: 0.13, iPS_cells:skin_fibroblast: 0.13 |
| NB06_CACTCCACAATCTACG-1 | Neurons:adrenal_medulla_cell_line | 0.19 | 138.24 | Raw ScoresNeurons:adrenal_medulla_cell_line: 0.33, Neuroepithelial_cell:ESC-derived: 0.31, Astrocyte:Embryonic_stem_cell-derived: 0.31, Neurons:ES_cell-derived_neural_precursor: 0.3, Embryonic_stem_cells: 0.26, iPS_cells:PDB_1lox-17Puro-10: 0.25, iPS_cells:PDB_1lox-21Puro-20: 0.25, iPS_cells:PDB_1lox-21Puro-26: 0.25, MSC: 0.25, Tissue_stem_cells:CD326-CD56+: 0.25 |
| NB13_CAGATCAAGGCGCTCT-1 | Tissue_stem_cells:BM_MSC:BMP2 | 0.06 | 137.53 | Raw ScoresTissue_stem_cells:BM_MSC:BMP2: 0.19, iPS_cells:adipose_stem_cells: 0.19, Smooth_muscle_cells:bronchial: 0.19, Tissue_stem_cells:BM_MSC:TGFb3: 0.19, Fibroblasts:breast: 0.19, Smooth_muscle_cells:bronchial:vit_D: 0.19, Osteoblasts: 0.19, Chondrocytes:MSC-derived: 0.19, Osteoblasts:BMP2: 0.19, Tissue_stem_cells:BM_MSC: 0.18 |
| NB13_GTTCTCGGTACGCACC-1 | Tissue_stem_cells:BM_MSC:BMP2 | 0.12 | 134.48 | Raw ScoresSmooth_muscle_cells:bronchial: 0.17, Osteoblasts: 0.17, Smooth_muscle_cells:bronchial:vit_D: 0.17, Fibroblasts:breast: 0.17, Osteoblasts:BMP2: 0.16, Tissue_stem_cells:BM_MSC:TGFb3: 0.16, Tissue_stem_cells:BM_MSC:BMP2: 0.16, Smooth_muscle_cells:vascular: 0.16, iPS_cells:adipose_stem_cells: 0.16, iPS_cells:CRL2097_foreskin: 0.16 |
| NB14_GGCCGATGTCCGCTGA-1 | Tissue_stem_cells:BM_MSC | 0.15 | 131.91 | Raw ScoresOsteoblasts: 0.2, Smooth_muscle_cells:bronchial: 0.2, Chondrocytes:MSC-derived: 0.2, Smooth_muscle_cells:bronchial:vit_D: 0.2, iPS_cells:adipose_stem_cells: 0.19, Osteoblasts:BMP2: 0.19, iPS_cells:CRL2097_foreskin: 0.19, Tissue_stem_cells:BM_MSC: 0.19, Fibroblasts:breast: 0.19, Smooth_muscle_cells:vascular: 0.19 |
| NB07_CGCTATCTCAGAAATG-1 | Neurons:adrenal_medulla_cell_line | 0.17 | 131.05 | Raw ScoresNeurons:adrenal_medulla_cell_line: 0.26, Astrocyte:Embryonic_stem_cell-derived: 0.22, Neuroepithelial_cell:ESC-derived: 0.21, Neurons:ES_cell-derived_neural_precursor: 0.21, iPS_cells:CRL2097_foreskin: 0.18, Smooth_muscle_cells:bronchial: 0.18, Embryonic_stem_cells: 0.17, Smooth_muscle_cells:bronchial:vit_D: 0.17, iPS_cells:PDB_1lox-21Puro-20: 0.17, iPS_cells:PDB_1lox-17Puro-10: 0.17 |
| NB13_CTAACTTAGCCGCCTA-1 | Neurons:adrenal_medulla_cell_line | 0.23 | 128.27 | Raw ScoresNeurons:adrenal_medulla_cell_line: 0.42, Astrocyte:Embryonic_stem_cell-derived: 0.34, Neuroepithelial_cell:ESC-derived: 0.33, Neurons:ES_cell-derived_neural_precursor: 0.31, iPS_cells:PDB_1lox-21Puro-20: 0.3, iPS_cells:PDB_1lox-21Puro-26: 0.3, iPS_cells:PDB_1lox-17Puro-10: 0.3, iPS_cells:PDB_1lox-17Puro-5: 0.3, Embryonic_stem_cells: 0.29, iPS_cells:PDB_2lox-22: 0.29 |
| NB12_GGGCATCGTGTGTGCC-1 | Neurons:adrenal_medulla_cell_line | 0.18 | 125.71 | Raw ScoresNeurons:adrenal_medulla_cell_line: 0.27, Neuroepithelial_cell:ESC-derived: 0.24, Astrocyte:Embryonic_stem_cell-derived: 0.23, Neurons:ES_cell-derived_neural_precursor: 0.23, iPS_cells:PDB_1lox-21Puro-20: 0.21, iPS_cells:PDB_1lox-21Puro-26: 0.21, Embryonic_stem_cells: 0.21, iPS_cells:PDB_1lox-17Puro-10: 0.21, iPS_cells:PDB_1lox-17Puro-5: 0.2, iPS_cells:PDB_2lox-22: 0.2 |
| NB11_GCAAACTAGTGGGATC-1 | Fibroblasts:breast | 0.15 | 122.45 | Raw ScoresSmooth_muscle_cells:bronchial: 0.18, Fibroblasts:breast: 0.18, iPS_cells:CRL2097_foreskin: 0.18, iPS_cells:adipose_stem_cells: 0.18, Smooth_muscle_cells:bronchial:vit_D: 0.18, Chondrocytes:MSC-derived: 0.17, Osteoblasts: 0.17, Smooth_muscle_cells:vascular: 0.16, Osteoblasts:BMP2: 0.16, iPS_cells:PDB_fibroblasts: 0.16 |
| NB03_TTGCGTCTCGAACTGT-1 | iPS_cells:skin_fibroblast | 0.06 | 121.61 | Raw ScoresiPS_cells:adipose_stem_cells: 0.15, Smooth_muscle_cells:bronchial: 0.15, iPS_cells:skin_fibroblast: 0.15, iPS_cells:CRL2097_foreskin: 0.14, Osteoblasts: 0.14, Fibroblasts:breast: 0.14, Smooth_muscle_cells:vascular: 0.14, Smooth_muscle_cells:bronchial:vit_D: 0.14, Tissue_stem_cells:BM_MSC:TGFb3: 0.14, iPS_cells:PDB_fibroblasts: 0.14 |
| NB13_CAAGGCCTCAACACAC-1 | Neurons:adrenal_medulla_cell_line | 0.07 | 121.21 | Raw ScoresNeurons:adrenal_medulla_cell_line: 0.19, Astrocyte:Embryonic_stem_cell-derived: 0.17, Neuroepithelial_cell:ESC-derived: 0.16, Neurons:ES_cell-derived_neural_precursor: 0.16, iPS_cells:skin_fibroblast: 0.15, iPS_cells:CRL2097_foreskin: 0.15, MSC: 0.15, Neurons:Schwann_cell: 0.15, Endothelial_cells:HUVEC:VEGF: 0.15, iPS_cells:PDB_fibroblasts: 0.15 |
| NB02_TATGCCCTCAACGCTA-1 | Fibroblasts:breast | 0.10 | 121.05 | Raw ScoresOsteoblasts: 0.16, Chondrocytes:MSC-derived: 0.16, Fibroblasts:breast: 0.15, iPS_cells:adipose_stem_cells: 0.15, Tissue_stem_cells:BM_MSC:TGFb3: 0.15, Tissue_stem_cells:BM_MSC:BMP2: 0.15, Tissue_stem_cells:BM_MSC: 0.15, Tissue_stem_cells:BM_MSC:osteogenic: 0.14, Smooth_muscle_cells:vascular: 0.14, Smooth_muscle_cells:vascular:IL-17: 0.14 |
| NB13_CTAATGGGTATAGTAG-1 | Smooth_muscle_cells:bronchial:vit_D | 0.12 | 118.87 | Raw ScoresSmooth_muscle_cells:bronchial:vit_D: 0.2, iPS_cells:adipose_stem_cells: 0.2, Smooth_muscle_cells:bronchial: 0.2, Fibroblasts:breast: 0.2, Chondrocytes:MSC-derived: 0.2, iPS_cells:CRL2097_foreskin: 0.2, Osteoblasts: 0.19, Tissue_stem_cells:BM_MSC:TGFb3: 0.19, Tissue_stem_cells:BM_MSC:BMP2: 0.19, Smooth_muscle_cells:vascular: 0.19 |
| NB02_GCTTCCACATTCTCAT-1 | iPS_cells:adipose_stem_cells | 0.17 | 118.48 | Raw ScoresFibroblasts:breast: 0.27, Osteoblasts: 0.27, iPS_cells:adipose_stem_cells: 0.27, Chondrocytes:MSC-derived: 0.26, Osteoblasts:BMP2: 0.26, Smooth_muscle_cells:vascular:IL-17: 0.26, Tissue_stem_cells:BM_MSC: 0.26, iPS_cells:CRL2097_foreskin: 0.26, Smooth_muscle_cells:vascular: 0.26, Tissue_stem_cells:BM_MSC:osteogenic: 0.25 |
| NB12_CAGCATAAGATACACA-1 | Neurons:adrenal_medulla_cell_line | 0.09 | 117.32 | Raw ScoresNeurons:ES_cell-derived_neural_precursor: 0.14, iPS_cells:CRL2097_foreskin: 0.14, Fibroblasts:breast: 0.14, Neuroepithelial_cell:ESC-derived: 0.14, Smooth_muscle_cells:bronchial: 0.14, Smooth_muscle_cells:bronchial:vit_D: 0.14, iPS_cells:adipose_stem_cells: 0.14, MSC: 0.14, Smooth_muscle_cells:vascular: 0.13, Osteoblasts: 0.13 |
| NB13_CGAGAAGTCACAACGT-1 | Neurons:adrenal_medulla_cell_line | 0.12 | 116.42 | Raw ScoresNeurons:adrenal_medulla_cell_line: 0.22, Neuroepithelial_cell:ESC-derived: 0.19, Astrocyte:Embryonic_stem_cell-derived: 0.19, Neurons:ES_cell-derived_neural_precursor: 0.18, Tissue_stem_cells:CD326-CD56+: 0.17, Neurons:Schwann_cell: 0.16, Embryonic_stem_cells: 0.16, Endothelial_cells:lymphatic:TNFa_48h: 0.16, Endothelial_cells:HUVEC:VEGF: 0.16, MSC: 0.16 |
| NB12_GATGCTACACATCTTT-1 | Neurons:adrenal_medulla_cell_line | 0.08 | 114.29 | Raw ScoresNeurons:adrenal_medulla_cell_line: 0.13, Astrocyte:Embryonic_stem_cell-derived: 0.11, Neurons:ES_cell-derived_neural_precursor: 0.11, Neuroepithelial_cell:ESC-derived: 0.11, MSC: 0.09, Smooth_muscle_cells:umbilical_vein: 0.09, iPS_cells:skin_fibroblast: 0.09, iPS_cells:fibroblasts: 0.09, iPS_cells:CRL2097_foreskin: 0.09, Smooth_muscle_cells:bronchial: 0.09 |
| NB13_ATTATCCCACCAGGCT-1 | Tissue_stem_cells:BM_MSC | 0.07 | 112.00 | Raw ScoresNeurons:adrenal_medulla_cell_line: 0.17, MSC: 0.17, iPS_cells:CRL2097_foreskin: 0.17, Osteoblasts: 0.17, Smooth_muscle_cells:bronchial: 0.17, Smooth_muscle_cells:bronchial:vit_D: 0.17, Osteoblasts:BMP2: 0.17, Chondrocytes:MSC-derived: 0.16, iPS_cells:skin_fibroblast: 0.16, Fibroblasts:breast: 0.16 |
Below shows the significant enrichments of this GEP for literature curated gene lists
This data was procured from existing single cell RNA-seq maps of neuroblastoma or related relevant data.
High ranks indicate this gene is a driver of this GEP.
These curated gene list are ranked by the P-value (on this GEP) of their constituent genes.
The Mean Count column shows the mean read count in cells scoring highly (H > 50) on this gene expression program.
Myofibroblastic CAF
These marker genes were curated across cancer subtypes in multiple organ systems as reviewed in Lavie et. al. (PMID 35883004) and contain myofibroblastic specific CAF genes:
Wilcoxon ranksum test P-value for gene set overrepresentation: 1.03e-07
Mean rank of genes in gene set: 3592.31
Rank on gene expression program of genes in gene set:
| Genes | Weight | Rank | GTEx | DepMap | Decartes | Mean.Counts | Mean.TPM |
|---|---|---|---|---|---|---|---|
| TNC | 0.0085546 | 2 | GTEx | DepMap | Descartes | 2.06 | 488.76 |
| IGFBP7 | 0.0068017 | 4 | GTEx | DepMap | Descartes | 3.11 | 3421.62 |
| POSTN | 0.0054233 | 7 | GTEx | DepMap | Descartes | 1.57 | 862.81 |
| FN1 | 0.0043083 | 10 | GTEx | DepMap | Descartes | 4.35 | 844.41 |
| BGN | 0.0016672 | 117 | GTEx | DepMap | Descartes | 0.65 | 661.27 |
| IGFBP3 | 0.0015960 | 125 | GTEx | DepMap | Descartes | 0.25 | 101.61 |
| COL4A1 | 0.0015230 | 135 | GTEx | DepMap | Descartes | 0.96 | 277.42 |
| ACTA2 | 0.0015138 | 140 | GTEx | DepMap | Descartes | 0.51 | 515.87 |
| MEF2C | 0.0012116 | 212 | GTEx | DepMap | Descartes | 0.72 | 89.27 |
| TPM1 | 0.0011275 | 236 | GTEx | DepMap | Descartes | 1.08 | 367.27 |
| COL14A1 | 0.0009719 | 314 | GTEx | DepMap | Descartes | 0.38 | 108.17 |
| TAGLN | 0.0008694 | 371 | GTEx | DepMap | Descartes | 0.43 | 171.46 |
| TGFBR2 | 0.0008106 | 419 | GTEx | DepMap | Descartes | 0.35 | 85.12 |
| MYH11 | 0.0007970 | 432 | GTEx | DepMap | Descartes | 0.11 | 24.98 |
| THBS2 | 0.0007479 | 468 | GTEx | DepMap | Descartes | 0.91 | 342.88 |
| MMP11 | 0.0006621 | 561 | GTEx | DepMap | Descartes | 0.04 | 27.65 |
| COL5A2 | 0.0006453 | 580 | GTEx | DepMap | Descartes | 1.28 | 376.18 |
| MYL9 | 0.0006399 | 591 | GTEx | DepMap | Descartes | 0.32 | 185.96 |
| COL3A1 | 0.0006366 | 601 | GTEx | DepMap | Descartes | 3.72 | 1343.30 |
| COL10A1 | 0.0006104 | 632 | GTEx | DepMap | Descartes | 0.03 | 23.70 |
| VCAN | 0.0005827 | 664 | GTEx | DepMap | Descartes | 1.34 | 201.70 |
| COL5A1 | 0.0005633 | 691 | GTEx | DepMap | Descartes | 0.69 | 160.34 |
| WNT5A | 0.0005314 | 744 | GTEx | DepMap | Descartes | 0.03 | 4.17 |
| THY1 | 0.0005127 | 784 | GTEx | DepMap | Descartes | 0.31 | 116.89 |
| COL15A1 | 0.0005095 | 795 | GTEx | DepMap | Descartes | 0.18 | 63.88 |
| TPM2 | 0.0004858 | 851 | GTEx | DepMap | Descartes | 0.36 | 351.06 |
| CNN2 | 0.0004831 | 858 | GTEx | DepMap | Descartes | 0.12 | 84.17 |
| ITGA7 | 0.0003383 | 1328 | GTEx | DepMap | Descartes | 0.11 | 33.49 |
| MYLK | 0.0003235 | 1413 | GTEx | DepMap | Descartes | 0.14 | 17.62 |
| DCN | 0.0002902 | 1600 | GTEx | DepMap | Descartes | 0.44 | 108.52 |
| VEGFA | 0.0002853 | 1633 | GTEx | DepMap | Descartes | 0.23 | 35.30 |
| COL13A1 | 0.0002536 | 1879 | GTEx | DepMap | Descartes | 0.06 | 25.68 |
| TGFB1 | 0.0002402 | 1991 | GTEx | DepMap | Descartes | 0.20 | 106.63 |
| HOPX | 0.0001995 | 2399 | GTEx | DepMap | Descartes | 0.03 | 8.68 |
| TGFB2 | 0.0001992 | 2403 | GTEx | DepMap | Descartes | 0.09 | 14.72 |
| PGF | 0.0000349 | 5377 | GTEx | DepMap | Descartes | 0.08 | 24.96 |
| TGFBR1 | -0.0000141 | 6761 | GTEx | DepMap | Descartes | 0.26 | 67.30 |
| COL1A1 | -0.0000431 | 7753 | GTEx | DepMap | Descartes | 4.85 | 1426.45 |
| CNN3 | -0.0000930 | 9249 | GTEx | DepMap | Descartes | 0.25 | 203.88 |
| TMEM119 | -0.0001305 | 10215 | GTEx | DepMap | Descartes | 0.07 | 28.14 |
| COL12A1 | -0.0002393 | 11715 | GTEx | DepMap | Descartes | 0.47 | 67.66 |
| RGS5 | -0.0002548 | 11828 | GTEx | DepMap | Descartes | 0.73 | 118.19 |
| ACTG2 | -0.0003723 | 12216 | GTEx | DepMap | Descartes | 0.00 | 0.00 |
| LUM | -0.0005435 | 12402 | GTEx | DepMap | Descartes | 0.48 | 293.95 |
| THBS1 | -0.0006937 | 12473 | GTEx | DepMap | Descartes | 0.87 | 237.57 |
| MMP2 | -0.0007342 | 12486 | GTEx | DepMap | Descartes | 0.23 | 105.86 |
| COL8A1 | -0.0008538 | 12501 | GTEx | DepMap | Descartes | 0.53 | 174.85 |
| COL11A1 | -0.0009265 | 12512 | GTEx | DepMap | Descartes | 0.15 | 29.31 |
| COL1A2 | -0.0013785 | 12545 | GTEx | DepMap | Descartes | 4.21 | 1365.65 |
Inflammatory CAF
These marker genes were curated across cancer subtypes in multiple organ systems as reviewed in Lavie et. al. (PMID 35883004) and contain inflammatory specific CAF genes:
Wilcoxon ranksum test P-value for gene set overrepresentation: 3.88e-07
Mean rank of genes in gene set: 2698.44
Rank on gene expression program of genes in gene set:
| Genes | Weight | Rank | GTEx | DepMap | Decartes | Mean.Counts | Mean.TPM |
|---|---|---|---|---|---|---|---|
| C7 | 0.0087669 | 1 | GTEx | DepMap | Descartes | 0.86 | 408.39 |
| IL33 | 0.0029119 | 30 | GTEx | DepMap | Descartes | 0.14 | 103.70 |
| CCL2 | 0.0028949 | 32 | GTEx | DepMap | Descartes | 0.64 | 1212.95 |
| PDGFRB | 0.0028514 | 34 | GTEx | DepMap | Descartes | 0.50 | 162.41 |
| C3 | 0.0026599 | 44 | GTEx | DepMap | Descartes | 1.04 | 311.89 |
| CXCL14 | 0.0012992 | 187 | GTEx | DepMap | Descartes | 0.05 | 35.69 |
| CXCL12 | 0.0011452 | 228 | GTEx | DepMap | Descartes | 0.19 | 94.43 |
| PDGFRA | 0.0009306 | 332 | GTEx | DepMap | Descartes | 0.14 | 51.02 |
| SERPING1 | 0.0005859 | 659 | GTEx | DepMap | Descartes | 0.29 | 201.15 |
| SCARA3 | 0.0005619 | 693 | GTEx | DepMap | Descartes | 0.08 | 28.75 |
| GPX3 | 0.0005264 | 757 | GTEx | DepMap | Descartes | 0.13 | 123.60 |
| IGFBP6 | 0.0004160 | 1053 | GTEx | DepMap | Descartes | 0.08 | 106.27 |
| PDPN | 0.0004063 | 1081 | GTEx | DepMap | Descartes | 0.06 | 44.41 |
| SOD2 | 0.0003601 | 1242 | GTEx | DepMap | Descartes | 0.47 | 54.75 |
| PDGFD | 0.0001929 | 2488 | GTEx | DepMap | Descartes | 0.24 | 88.23 |
| IL1R1 | 0.0001174 | 3569 | GTEx | DepMap | Descartes | 0.31 | 132.12 |
| RGMA | 0.0001165 | 3589 | GTEx | DepMap | Descartes | 0.08 | 11.46 |
| CFB | 0.0001033 | 3849 | GTEx | DepMap | Descartes | 0.03 | 13.32 |
| SCARA5 | 0.0000937 | 4034 | GTEx | DepMap | Descartes | 0.00 | 0.00 |
| CXCL2 | 0.0000843 | 4213 | GTEx | DepMap | Descartes | 0.07 | 138.00 |
| HGF | 0.0000710 | 4477 | GTEx | DepMap | Descartes | 0.03 | 7.16 |
| CFD | 0.0000113 | 6041 | GTEx | DepMap | Descartes | 0.03 | 48.95 |
| LIF | 0.0000037 | 6250 | GTEx | DepMap | Descartes | 0.06 | 29.27 |
| IL10 | -0.0001265 | 10129 | GTEx | DepMap | Descartes | 0.00 | 0.00 |
| IGF1 | -0.0006415 | 12449 | GTEx | DepMap | Descartes | 0.26 | 64.88 |
Stromal 2 (Hanemaaijer)
Marker genes obtained from Supplementary Table SD of Hanemaaijer et al (PMID 33500353). The authors generated single-cell RNA-seq data (sort-seq, 2,229 cells total) from mouse adrenal glads at E13.5, E14.5, E17.5, E18.5, P1 and P5. These were marker genes that matched with a similar dataset generated by Furlan et al (PMID 28684471). This particular set of markers are for Stroma subcluster:
Wilcoxon ranksum test P-value for gene set overrepresentation: 4.68e-05
Mean rank of genes in gene set: 2191.33
Rank on gene expression program of genes in gene set:
| Genes | Weight | Rank | GTEx | DepMap | Decartes | Mean.Counts | Mean.TPM |
|---|---|---|---|---|---|---|---|
| POSTN | 0.0054233 | 7 | GTEx | DepMap | Descartes | 1.57 | 862.81 |
| FBN1 | 0.0013597 | 168 | GTEx | DepMap | Descartes | 0.94 | 119.61 |
| FSTL1 | 0.0013010 | 186 | GTEx | DepMap | Descartes | 0.48 | 164.74 |
| FBN2 | 0.0010006 | 297 | GTEx | DepMap | Descartes | 0.09 | 13.56 |
| COL14A1 | 0.0009719 | 314 | GTEx | DepMap | Descartes | 0.38 | 108.17 |
| IGFBP5 | 0.0009462 | 326 | GTEx | DepMap | Descartes | 0.58 | 137.03 |
| GSN | 0.0008514 | 390 | GTEx | DepMap | Descartes | 0.44 | 107.03 |
| COL5A2 | 0.0006453 | 580 | GTEx | DepMap | Descartes | 1.28 | 376.18 |
| GAS1 | 0.0004077 | 1077 | GTEx | DepMap | Descartes | 0.06 | 29.61 |
| SFRP1 | 0.0000665 | 4599 | GTEx | DepMap | Descartes | 0.10 | 43.55 |
| ITM2A | -0.0000270 | 7180 | GTEx | DepMap | Descartes | 0.01 | 1.87 |
| PENK | -0.0001840 | 11172 | GTEx | DepMap | Descartes | 0.00 | 0.00 |
Below shows ranks on this GEP for literature curated gene lists for large gene sets
These include those reported as mesenchymal/adrenergic by Van Groningen et al.
High ranks indicate this gene is a driver of this GEP (note these results are not ordered).
The Mean Count column shows the mean read count in cells scoring highly (H > 50) on this gene expression program.
VanGroningen Adrenergic Genes
Adrenergic marker genes from Supplementary Table 2 of Van Groningen et al. Nature Genetics 2017. These genes were identified by differential expression analysis of mesenchymal-like and adrenergic-like neuroblastoma cell lines.
Wilcoxon ranksum test P-value for gene set overrepresentation: 1.00e+00
Mean rank of genes in gene set: 9000.03
Median rank of genes in gene set: 10048
Rank on gene expression program of top 30 genes in gene set:
| Genes | Weight | Rank | GTEx | DepMap | Descartes | Mean.Counts | Mean.TPM |
|---|---|---|---|---|---|---|---|
| CELF2 | 0.0008081 | 422 | GTEx | DepMap | Descartes | 0.70 | 106.62 |
| AKAP12 | 0.0005613 | 697 | GTEx | DepMap | Descartes | 0.68 | 146.95 |
| SYNPO2 | 0.0005259 | 761 | GTEx | DepMap | Descartes | 0.76 | 70.73 |
| CXCR4 | 0.0005233 | 767 | GTEx | DepMap | Descartes | 0.14 | 55.75 |
| RBP1 | 0.0004738 | 884 | GTEx | DepMap | Descartes | 0.40 | 227.63 |
| RTN1 | 0.0004684 | 895 | GTEx | DepMap | Descartes | 2.36 | 728.71 |
| NPY | 0.0004082 | 1075 | GTEx | DepMap | Descartes | 4.37 | 6313.43 |
| ABLIM1 | 0.0003148 | 1458 | GTEx | DepMap | Descartes | 0.31 | 44.99 |
| EXOC5 | 0.0003097 | 1493 | GTEx | DepMap | Descartes | 0.33 | 33.88 |
| SLIT3 | 0.0003026 | 1521 | GTEx | DepMap | Descartes | 1.66 | 236.13 |
| ICA1 | 0.0002914 | 1592 | GTEx | DepMap | Descartes | 2.45 | 1115.95 |
| CDKN2C | 0.0002511 | 1899 | GTEx | DepMap | Descartes | 0.05 | 27.45 |
| LYN | 0.0002370 | 2023 | GTEx | DepMap | Descartes | 0.11 | 28.35 |
| LSM3 | 0.0002330 | 2058 | GTEx | DepMap | Descartes | 0.16 | 91.86 |
| FKBP1B | 0.0002300 | 2083 | GTEx | DepMap | Descartes | 0.03 | 27.70 |
| POLB | 0.0002279 | 2107 | GTEx | DepMap | Descartes | 0.12 | 122.06 |
| TMEM178B | 0.0002135 | 2247 | GTEx | DepMap | Descartes | 2.04 | NA |
| INSM2 | 0.0002035 | 2358 | GTEx | DepMap | Descartes | 0.10 | 48.36 |
| PPP2R3C | 0.0001974 | 2425 | GTEx | DepMap | Descartes | 0.16 | 135.50 |
| LIN28B | 0.0001889 | 2548 | GTEx | DepMap | Descartes | 0.25 | 52.96 |
| DPYSL3 | 0.0001838 | 2603 | GTEx | DepMap | Descartes | 0.93 | 232.20 |
| PARP6 | 0.0001788 | 2652 | GTEx | DepMap | Descartes | 0.23 | 90.34 |
| PHPT1 | 0.0001773 | 2682 | GTEx | DepMap | Descartes | 0.31 | 322.02 |
| ALK | 0.0001712 | 2752 | GTEx | DepMap | Descartes | 2.27 | 379.23 |
| TUBB4B | 0.0001590 | 2911 | GTEx | DepMap | Descartes | 0.23 | 143.00 |
| RNF150 | 0.0001385 | 3196 | GTEx | DepMap | Descartes | 0.74 | 87.74 |
| RUFY3 | 0.0001376 | 3216 | GTEx | DepMap | Descartes | 0.65 | 190.52 |
| MCM7 | 0.0001361 | 3237 | GTEx | DepMap | Descartes | 0.53 | 154.15 |
| DAPK1 | 0.0001360 | 3239 | GTEx | DepMap | Descartes | 0.35 | 60.92 |
| CCNI | 0.0001225 | 3469 | GTEx | DepMap | Descartes | 0.72 | 391.17 |
VanGroningen Mesenchymal Genes
Mesenchymal marker genes from Supplementary Table 2 of Van Groningen et al. Nature Genetics 2017. These genes were identified by differential expression analysis of mesenchymal-like and adrenergic-like neuroblastoma cell lines.
Wilcoxon ranksum test P-value for gene set overrepresentation: 1.47e-34
Mean rank of genes in gene set: 4192.22
Median rank of genes in gene set: 2568
Rank on gene expression program of top 30 genes in gene set:
| Genes | Weight | Rank | GTEx | DepMap | Descartes | Mean.Counts | Mean.TPM |
|---|---|---|---|---|---|---|---|
| TNC | 0.0085546 | 2 | GTEx | DepMap | Descartes | 2.06 | 488.76 |
| POSTN | 0.0054233 | 7 | GTEx | DepMap | Descartes | 1.57 | 862.81 |
| TIMP1 | 0.0046397 | 9 | GTEx | DepMap | Descartes | 2.87 | 4863.81 |
| FN1 | 0.0043083 | 10 | GTEx | DepMap | Descartes | 4.35 | 844.41 |
| PRRX1 | 0.0041227 | 11 | GTEx | DepMap | Descartes | 0.57 | 231.54 |
| BNC2 | 0.0034729 | 16 | GTEx | DepMap | Descartes | 1.14 | 164.39 |
| NFIA | 0.0032102 | 22 | GTEx | DepMap | Descartes | 1.06 | 43.23 |
| B2M | 0.0031452 | 25 | GTEx | DepMap | Descartes | 3.35 | 1835.87 |
| HS3ST3A1 | 0.0030440 | 26 | GTEx | DepMap | Descartes | 0.19 | 86.58 |
| ID3 | 0.0026613 | 43 | GTEx | DepMap | Descartes | 0.32 | 475.93 |
| CALD1 | 0.0026092 | 47 | GTEx | DepMap | Descartes | 3.33 | 1177.92 |
| SVIL | 0.0025921 | 48 | GTEx | DepMap | Descartes | 1.06 | 219.62 |
| EPHA3 | 0.0025716 | 50 | GTEx | DepMap | Descartes | 0.28 | 104.30 |
| FLRT2 | 0.0025077 | 52 | GTEx | DepMap | Descartes | 0.73 | 33.90 |
| COL27A1 | 0.0024809 | 53 | GTEx | DepMap | Descartes | 0.21 | 67.95 |
| TFPI | 0.0024692 | 54 | GTEx | DepMap | Descartes | 0.56 | 98.10 |
| PLEKHH2 | 0.0024500 | 55 | GTEx | DepMap | Descartes | 0.19 | 63.33 |
| COL6A3 | 0.0024122 | 56 | GTEx | DepMap | Descartes | 1.21 | 215.79 |
| EDNRA | 0.0023488 | 59 | GTEx | DepMap | Descartes | 0.35 | 154.74 |
| RIN2 | 0.0023313 | 60 | GTEx | DepMap | Descartes | 0.43 | 177.56 |
| COL4A2 | 0.0022438 | 64 | GTEx | DepMap | Descartes | 1.03 | 262.76 |
| MGP | 0.0021670 | 70 | GTEx | DepMap | Descartes | 1.16 | 1200.34 |
| CDH11 | 0.0021492 | 72 | GTEx | DepMap | Descartes | 0.84 | 253.94 |
| MAML2 | 0.0021475 | 73 | GTEx | DepMap | Descartes | 1.41 | 321.79 |
| EPS8 | 0.0020320 | 81 | GTEx | DepMap | Descartes | 0.53 | 183.32 |
| COL6A2 | 0.0020268 | 82 | GTEx | DepMap | Descartes | 1.44 | 669.08 |
| PEAK1 | 0.0019873 | 87 | GTEx | DepMap | Descartes | 0.86 | NA |
| CFH | 0.0018385 | 101 | GTEx | DepMap | Descartes | 0.37 | 127.50 |
| IFITM3 | 0.0017634 | 107 | GTEx | DepMap | Descartes | 0.47 | 1105.04 |
| LPP | 0.0017524 | 108 | GTEx | DepMap | Descartes | 1.81 | 174.80 |
Descartes adrenocortical markers
Top 50 marker genes of adrenocortical cells in the Decartes fetal adrenal single cell map (https://atlas.brotmanbaty.org/bbi/human-gene-expression-during-development/cell/adrenocortical/in/adrenal)
Wilcoxon ranksum test P-value for gene set overrepresentation: 8.97e-01
Mean rank of genes in gene set: 7038.67
Median rank of genes in gene set: 7903
Rank on gene expression program of top 30 genes in gene set:
| Genes | Weight | Rank | GTEx | DepMap | Descartes | Mean.Counts | Mean.TPM |
|---|---|---|---|---|---|---|---|
| CLU | 0.0037933 | 13 | GTEx | DepMap | Descartes | 1.14 | 494.10 |
| ERN1 | 0.0004081 | 1076 | GTEx | DepMap | Descartes | 0.18 | 29.45 |
| SH3PXD2B | 0.0002931 | 1585 | GTEx | DepMap | Descartes | 0.31 | 62.28 |
| PAPSS2 | 0.0002832 | 1654 | GTEx | DepMap | Descartes | 0.15 | 74.61 |
| LDLR | 0.0002190 | 2193 | GTEx | DepMap | Descartes | 0.12 | 32.51 |
| NPC1 | 0.0002183 | 2199 | GTEx | DepMap | Descartes | 0.26 | 58.32 |
| INHA | 0.0001476 | 3069 | GTEx | DepMap | Descartes | 0.02 | 15.94 |
| IGF1R | 0.0001333 | 3287 | GTEx | DepMap | Descartes | 1.01 | 86.23 |
| CYB5B | 0.0001193 | 3530 | GTEx | DepMap | Descartes | 0.23 | 66.06 |
| SGCZ | 0.0001188 | 3537 | GTEx | DepMap | Descartes | 0.19 | 34.86 |
| FDX1 | 0.0001043 | 3820 | GTEx | DepMap | Descartes | 0.06 | 33.68 |
| SCAP | 0.0001020 | 3868 | GTEx | DepMap | Descartes | 0.19 | 58.47 |
| TM7SF2 | 0.0000899 | 4111 | GTEx | DepMap | Descartes | 0.11 | 45.36 |
| FDPS | 0.0000841 | 4221 | GTEx | DepMap | Descartes | 0.36 | 267.71 |
| PDE10A | 0.0000494 | 5025 | GTEx | DepMap | Descartes | 0.35 | 66.46 |
| SLC1A2 | 0.0000045 | 6224 | GTEx | DepMap | Descartes | 0.21 | 20.66 |
| STAR | -0.0000326 | 7381 | GTEx | DepMap | Descartes | 0.00 | 0.00 |
| SH3BP5 | -0.0000409 | 7680 | GTEx | DepMap | Descartes | 0.14 | 61.32 |
| SCARB1 | -0.0000552 | 8126 | GTEx | DepMap | Descartes | 0.09 | 18.89 |
| HMGCR | -0.0000580 | 8216 | GTEx | DepMap | Descartes | 0.11 | 26.18 |
| POR | -0.0000692 | 8581 | GTEx | DepMap | Descartes | 0.13 | 46.58 |
| DHCR7 | -0.0000705 | 8631 | GTEx | DepMap | Descartes | 0.05 | 17.77 |
| FREM2 | -0.0000766 | 8807 | GTEx | DepMap | Descartes | 0.00 | 0.00 |
| DHCR24 | -0.0000890 | 9155 | GTEx | DepMap | Descartes | 0.14 | 25.49 |
| MSMO1 | -0.0001154 | 9861 | GTEx | DepMap | Descartes | 0.07 | 36.13 |
| FDXR | -0.0001722 | 10999 | GTEx | DepMap | Descartes | 0.03 | 8.69 |
| SLC16A9 | -0.0001801 | 11109 | GTEx | DepMap | Descartes | 0.08 | 11.84 |
| APOC1 | -0.0001854 | 11194 | GTEx | DepMap | Descartes | 0.21 | 667.55 |
| HMGCS1 | -0.0001974 | 11350 | GTEx | DepMap | Descartes | 0.11 | 20.73 |
| BAIAP2L1 | -0.0002128 | 11500 | GTEx | DepMap | Descartes | 0.05 | 11.14 |
Descartes chromaffin markers
Top 50 marker genes of chromaffin cells in the Decartes fetal adrenal single cell map (https://atlas.brotmanbaty.org/bbi/human-gene-expression-during-development/cell/chromaffin/in/adrenal)
Wilcoxon ranksum test P-value for gene set overrepresentation: 1.00e+00
Mean rank of genes in gene set: 10601.22
Median rank of genes in gene set: 12083
Rank on gene expression program of top 30 genes in gene set:
| Genes | Weight | Rank | GTEx | DepMap | Descartes | Mean.Counts | Mean.TPM |
|---|---|---|---|---|---|---|---|
| SYNPO2 | 0.0005259 | 761 | GTEx | DepMap | Descartes | 0.76 | 70.73 |
| NPY | 0.0004082 | 1075 | GTEx | DepMap | Descartes | 4.37 | 6313.43 |
| ALK | 0.0001712 | 2752 | GTEx | DepMap | Descartes | 2.27 | 379.23 |
| RPH3A | 0.0000126 | 5998 | GTEx | DepMap | Descartes | 0.05 | 7.40 |
| PLXNA4 | -0.0000011 | 6394 | GTEx | DepMap | Descartes | 0.43 | 28.00 |
| MAB21L2 | -0.0000065 | 6552 | GTEx | DepMap | Descartes | 0.13 | 38.57 |
| MAB21L1 | -0.0000510 | 8016 | GTEx | DepMap | Descartes | 0.14 | 66.26 |
| GREM1 | -0.0000742 | 8737 | GTEx | DepMap | Descartes | 0.04 | 6.58 |
| GAL | -0.0001069 | 9630 | GTEx | DepMap | Descartes | 0.45 | 598.17 |
| EYA4 | -0.0001261 | 10115 | GTEx | DepMap | Descartes | 0.46 | 91.43 |
| SLC6A2 | -0.0001313 | 10233 | GTEx | DepMap | Descartes | 0.14 | 28.61 |
| CCND1 | -0.0001534 | 10692 | GTEx | DepMap | Descartes | 1.52 | 411.85 |
| EYA1 | -0.0001785 | 11085 | GTEx | DepMap | Descartes | 0.57 | 101.86 |
| IL7 | -0.0002074 | 11462 | GTEx | DepMap | Descartes | 1.49 | 692.33 |
| FAT3 | -0.0002367 | 11697 | GTEx | DepMap | Descartes | 0.31 | 13.35 |
| CNTFR | -0.0002462 | 11766 | GTEx | DepMap | Descartes | 0.13 | 53.45 |
| PTCHD1 | -0.0002518 | 11803 | GTEx | DepMap | Descartes | 0.06 | 3.38 |
| REEP1 | -0.0002800 | 11966 | GTEx | DepMap | Descartes | 0.15 | 44.33 |
| GAP43 | -0.0002937 | 12016 | GTEx | DepMap | Descartes | 0.73 | 351.68 |
| MLLT11 | -0.0003076 | 12071 | GTEx | DepMap | Descartes | 0.37 | 144.66 |
| TMEM132C | -0.0003120 | 12083 | GTEx | DepMap | Descartes | 1.91 | 315.50 |
| KCNB2 | -0.0003402 | 12154 | GTEx | DepMap | Descartes | 1.11 | 227.60 |
| TUBB2A | -0.0003872 | 12245 | GTEx | DepMap | Descartes | 0.52 | 293.83 |
| SLC44A5 | -0.0004186 | 12285 | GTEx | DepMap | Descartes | 0.19 | 54.08 |
| BASP1 | -0.0004226 | 12294 | GTEx | DepMap | Descartes | 0.74 | 450.07 |
| TMEFF2 | -0.0004245 | 12298 | GTEx | DepMap | Descartes | 0.16 | 52.66 |
| ISL1 | -0.0004304 | 12307 | GTEx | DepMap | Descartes | 0.40 | 169.30 |
| EPHA6 | -0.0004333 | 12310 | GTEx | DepMap | Descartes | 0.26 | 53.66 |
| RGMB | -0.0004568 | 12331 | GTEx | DepMap | Descartes | 0.19 | 56.92 |
| TUBB2B | -0.0005016 | 12371 | GTEx | DepMap | Descartes | 1.33 | 652.68 |
Descartes Vascular_endothelial markers
Top 50 marker genes of Vascular_endothelial cells in the Decartes fetal adrenal single cell map (https://atlas.brotmanbaty.org/bbi/human-gene-expression-during-development/cell/vascular_endothelial/in/adrenal)
Wilcoxon ranksum test P-value for gene set overrepresentation: 1.83e-01
Mean rank of genes in gene set: 5745.42
Median rank of genes in gene set: 5001.5
Rank on gene expression program of top 30 genes in gene set:
| Genes | Weight | Rank | GTEx | DepMap | Descartes | Mean.Counts | Mean.TPM |
|---|---|---|---|---|---|---|---|
| ARHGAP29 | 0.0014406 | 154 | GTEx | DepMap | Descartes | 0.40 | 66.47 |
| NPR1 | 0.0006756 | 547 | GTEx | DepMap | Descartes | 0.04 | 23.86 |
| MMRN2 | 0.0005641 | 689 | GTEx | DepMap | Descartes | 0.08 | 24.91 |
| FLT4 | 0.0004609 | 925 | GTEx | DepMap | Descartes | 0.06 | 10.64 |
| SLCO2A1 | 0.0004157 | 1055 | GTEx | DepMap | Descartes | 0.08 | 22.83 |
| ROBO4 | 0.0004026 | 1097 | GTEx | DepMap | Descartes | 0.08 | 22.31 |
| F8 | 0.0003950 | 1123 | GTEx | DepMap | Descartes | 0.04 | 3.89 |
| CEACAM1 | 0.0003816 | 1161 | GTEx | DepMap | Descartes | 0.10 | 31.18 |
| ESM1 | 0.0003553 | 1255 | GTEx | DepMap | Descartes | 0.08 | 29.38 |
| RASIP1 | 0.0003153 | 1452 | GTEx | DepMap | Descartes | 0.09 | 38.73 |
| KANK3 | 0.0002968 | 1559 | GTEx | DepMap | Descartes | 0.06 | 29.86 |
| KDR | 0.0002120 | 2271 | GTEx | DepMap | Descartes | 0.09 | 12.28 |
| CDH5 | 0.0001609 | 2883 | GTEx | DepMap | Descartes | 0.04 | 9.02 |
| PTPRB | 0.0001584 | 2922 | GTEx | DepMap | Descartes | 0.21 | 17.01 |
| TIE1 | 0.0001386 | 3193 | GTEx | DepMap | Descartes | 0.11 | 23.62 |
| SHE | 0.0001320 | 3307 | GTEx | DepMap | Descartes | 0.04 | 10.59 |
| CLDN5 | 0.0001097 | 3723 | GTEx | DepMap | Descartes | 0.13 | 46.58 |
| IRX3 | 0.0000594 | 4784 | GTEx | DepMap | Descartes | 0.00 | 0.00 |
| EHD3 | 0.0000543 | 4907 | GTEx | DepMap | Descartes | 0.04 | 9.00 |
| BTNL9 | 0.0000465 | 5096 | GTEx | DepMap | Descartes | 0.02 | 3.50 |
| HYAL2 | 0.0000205 | 5796 | GTEx | DepMap | Descartes | 0.07 | 15.64 |
| NR5A2 | 0.0000063 | 6185 | GTEx | DepMap | Descartes | 0.11 | 19.18 |
| PODXL | 0.0000005 | 6353 | GTEx | DepMap | Descartes | 0.09 | 17.86 |
| RAMP2 | -0.0000057 | 6532 | GTEx | DepMap | Descartes | 0.11 | 111.66 |
| CYP26B1 | -0.0000159 | 6816 | GTEx | DepMap | Descartes | 0.01 | 1.26 |
| CRHBP | -0.0000568 | 8175 | GTEx | DepMap | Descartes | 0.01 | 11.27 |
| CALCRL | -0.0000661 | 8467 | GTEx | DepMap | Descartes | 0.25 | 35.82 |
| ID1 | -0.0001293 | 10192 | GTEx | DepMap | Descartes | 0.06 | 95.43 |
| GALNT15 | -0.0001468 | 10563 | GTEx | DepMap | Descartes | 0.01 | NA |
| PLVAP | -0.0001471 | 10569 | GTEx | DepMap | Descartes | 0.17 | 47.65 |
Descartes stromal markers
Top 50 marker genes of stromal cells in the Decartes fetal adrenal single cell map (https://atlas.brotmanbaty.org/bbi/human-gene-expression-during-development/cell/stromal/in/adrenal)
Wilcoxon ranksum test P-value for gene set overrepresentation: 1.87e-09
Mean rank of genes in gene set: 3060.8
Median rank of genes in gene set: 799
Rank on gene expression program of top 30 genes in gene set:
| Genes | Weight | Rank | GTEx | DepMap | Descartes | Mean.Counts | Mean.TPM |
|---|---|---|---|---|---|---|---|
| C7 | 0.0087669 | 1 | GTEx | DepMap | Descartes | 0.86 | 408.39 |
| POSTN | 0.0054233 | 7 | GTEx | DepMap | Descartes | 1.57 | 862.81 |
| PRRX1 | 0.0041227 | 11 | GTEx | DepMap | Descartes | 0.57 | 231.54 |
| COL27A1 | 0.0024809 | 53 | GTEx | DepMap | Descartes | 0.21 | 67.95 |
| COL6A3 | 0.0024122 | 56 | GTEx | DepMap | Descartes | 1.21 | 215.79 |
| EDNRA | 0.0023488 | 59 | GTEx | DepMap | Descartes | 0.35 | 154.74 |
| MGP | 0.0021670 | 70 | GTEx | DepMap | Descartes | 1.16 | 1200.34 |
| ABCA6 | 0.0021566 | 71 | GTEx | DepMap | Descartes | 0.19 | 51.22 |
| CDH11 | 0.0021492 | 72 | GTEx | DepMap | Descartes | 0.84 | 253.94 |
| ABCC9 | 0.0018517 | 99 | GTEx | DepMap | Descartes | 0.21 | 32.80 |
| IGFBP3 | 0.0015960 | 125 | GTEx | DepMap | Descartes | 0.25 | 101.61 |
| ACTA2 | 0.0015138 | 140 | GTEx | DepMap | Descartes | 0.51 | 515.87 |
| ITGA11 | 0.0013564 | 169 | GTEx | DepMap | Descartes | 0.28 | 48.14 |
| ADAMTS2 | 0.0012748 | 191 | GTEx | DepMap | Descartes | 0.41 | 112.97 |
| GLI2 | 0.0011415 | 231 | GTEx | DepMap | Descartes | 0.24 | 70.73 |
| ADAMTSL3 | 0.0010642 | 266 | GTEx | DepMap | Descartes | 0.12 | 27.21 |
| PDGFRA | 0.0009306 | 332 | GTEx | DepMap | Descartes | 0.14 | 51.02 |
| CCDC80 | 0.0008862 | 362 | GTEx | DepMap | Descartes | 0.36 | 51.55 |
| BICC1 | 0.0008271 | 406 | GTEx | DepMap | Descartes | 1.12 | 463.63 |
| DKK2 | 0.0007736 | 449 | GTEx | DepMap | Descartes | 0.05 | 19.05 |
| COL3A1 | 0.0006366 | 601 | GTEx | DepMap | Descartes | 3.72 | 1343.30 |
| ISLR | 0.0006159 | 622 | GTEx | DepMap | Descartes | 0.22 | 184.51 |
| PAMR1 | 0.0004395 | 976 | GTEx | DepMap | Descartes | 0.09 | 40.65 |
| ELN | 0.0004197 | 1040 | GTEx | DepMap | Descartes | 0.41 | 181.12 |
| RSPO3 | 0.0003427 | 1314 | GTEx | DepMap | Descartes | 0.00 | NA |
| DCN | 0.0002902 | 1600 | GTEx | DepMap | Descartes | 0.44 | 108.52 |
| PCDH18 | 0.0002794 | 1684 | GTEx | DepMap | Descartes | 0.03 | 6.07 |
| LRRC17 | 0.0002545 | 1872 | GTEx | DepMap | Descartes | 0.04 | 43.44 |
| LAMC3 | 0.0001783 | 2665 | GTEx | DepMap | Descartes | 0.03 | 7.90 |
| GAS2 | 0.0001704 | 2758 | GTEx | DepMap | Descartes | 0.08 | 44.42 |
Descartes sympathoblasts markers
Top 50 marker genes of sympathoblasts cells in the Decartes fetal adrenal single cell map (https://atlas.brotmanbaty.org/bbi/human-gene-expression-during-development/cell/sympathoblasts/in/adrenal)
Wilcoxon ranksum test P-value for gene set overrepresentation: 1.00e+00
Mean rank of genes in gene set: 9518.82
Median rank of genes in gene set: 11315.5
Rank on gene expression program of top 30 genes in gene set:
| Genes | Weight | Rank | GTEx | DepMap | Descartes | Mean.Counts | Mean.TPM |
|---|---|---|---|---|---|---|---|
| LAMA3 | 0.0011355 | 234 | GTEx | DepMap | Descartes | 0.23 | 34.23 |
| CNTN3 | 0.0005565 | 706 | GTEx | DepMap | Descartes | 0.08 | 11.13 |
| TENM1 | 0.0003639 | 1226 | GTEx | DepMap | Descartes | 0.57 | NA |
| AGBL4 | 0.0002627 | 1814 | GTEx | DepMap | Descartes | 1.99 | 417.04 |
| SLC35F3 | 0.0000826 | 4253 | GTEx | DepMap | Descartes | 0.25 | 72.87 |
| CDH12 | 0.0000744 | 4413 | GTEx | DepMap | Descartes | 0.12 | 15.14 |
| SORCS3 | 0.0000720 | 4456 | GTEx | DepMap | Descartes | 0.03 | 4.39 |
| DGKK | 0.0000651 | 4636 | GTEx | DepMap | Descartes | 0.01 | 0.16 |
| HTATSF1 | -0.0000364 | 7522 | GTEx | DepMap | Descartes | 0.13 | 48.92 |
| SLC24A2 | -0.0000440 | 7786 | GTEx | DepMap | Descartes | 0.05 | 6.23 |
| CHGA | -0.0000607 | 8292 | GTEx | DepMap | Descartes | 1.38 | 651.57 |
| ARC | -0.0001009 | 9463 | GTEx | DepMap | Descartes | 0.03 | 17.24 |
| KSR2 | -0.0001172 | 9902 | GTEx | DepMap | Descartes | 0.35 | 15.71 |
| PACRG | -0.0001225 | 10033 | GTEx | DepMap | Descartes | 0.39 | 158.68 |
| TBX20 | -0.0001318 | 10243 | GTEx | DepMap | Descartes | 0.12 | 84.41 |
| C1QL1 | -0.0001579 | 10760 | GTEx | DepMap | Descartes | 0.04 | 28.74 |
| TIAM1 | -0.0001626 | 10839 | GTEx | DepMap | Descartes | 0.40 | 57.37 |
| CDH18 | -0.0001768 | 11065 | GTEx | DepMap | Descartes | 0.21 | 44.74 |
| PENK | -0.0001840 | 11172 | GTEx | DepMap | Descartes | 0.00 | 0.00 |
| CCSER1 | -0.0002073 | 11459 | GTEx | DepMap | Descartes | 1.22 | NA |
| ST18 | -0.0002698 | 11915 | GTEx | DepMap | Descartes | 0.02 | 4.60 |
| EML6 | -0.0003059 | 12062 | GTEx | DepMap | Descartes | 0.19 | 25.56 |
| GALNTL6 | -0.0003077 | 12073 | GTEx | DepMap | Descartes | 0.16 | 36.78 |
| GCH1 | -0.0003171 | 12095 | GTEx | DepMap | Descartes | 0.24 | 88.60 |
| SPOCK3 | -0.0003184 | 12100 | GTEx | DepMap | Descartes | 0.08 | 17.54 |
| ROBO1 | -0.0003674 | 12207 | GTEx | DepMap | Descartes | 2.27 | 336.13 |
| SLC18A1 | -0.0004306 | 12308 | GTEx | DepMap | Descartes | 0.14 | 31.41 |
| PCSK1N | -0.0004559 | 12330 | GTEx | DepMap | Descartes | 1.13 | 866.15 |
| PCSK2 | -0.0004772 | 12348 | GTEx | DepMap | Descartes | 0.16 | 28.98 |
| UNC80 | -0.0004806 | 12353 | GTEx | DepMap | Descartes | 0.47 | 31.00 |
Descartes erythroblasts markers
Top 50 marker genes of erythroblasts cells in the Decartes fetal adrenal single cell map (https://atlas.brotmanbaty.org/bbi/human-gene-expression-during-development/cell/erythroblasts/in/adrenal)
Wilcoxon ranksum test P-value for gene set overrepresentation: 5.41e-02
Mean rank of genes in gene set: 5195.31
Median rank of genes in gene set: 5038
Rank on gene expression program of top 30 genes in gene set:
| Genes | Weight | Rank | GTEx | DepMap | Descartes | Mean.Counts | Mean.TPM |
|---|---|---|---|---|---|---|---|
| MICAL2 | 0.0010076 | 295 | GTEx | DepMap | Descartes | 0.31 | 98.50 |
| GYPC | 0.0009309 | 330 | GTEx | DepMap | Descartes | 0.07 | 46.18 |
| RHD | 0.0009114 | 343 | GTEx | DepMap | Descartes | 0.08 | 32.65 |
| MARCH3 | 0.0006509 | 571 | GTEx | DepMap | Descartes | 0.33 | NA |
| BLVRB | 0.0004987 | 819 | GTEx | DepMap | Descartes | 0.06 | 94.16 |
| SLC25A37 | 0.0004799 | 865 | GTEx | DepMap | Descartes | 0.21 | 57.83 |
| TSPAN5 | 0.0003211 | 1424 | GTEx | DepMap | Descartes | 0.76 | 207.05 |
| SPECC1 | 0.0003111 | 1481 | GTEx | DepMap | Descartes | 0.08 | 9.90 |
| DENND4A | 0.0002665 | 1788 | GTEx | DepMap | Descartes | 0.62 | 85.43 |
| SELENBP1 | 0.0002462 | 1938 | GTEx | DepMap | Descartes | 0.03 | 10.64 |
| CAT | 0.0002146 | 2231 | GTEx | DepMap | Descartes | 0.09 | 74.73 |
| SLC25A21 | 0.0001911 | 2517 | GTEx | DepMap | Descartes | 0.04 | 16.50 |
| XPO7 | 0.0001530 | 2999 | GTEx | DepMap | Descartes | 0.18 | 43.32 |
| GCLC | 0.0000897 | 4116 | GTEx | DepMap | Descartes | 0.11 | 52.11 |
| ANK1 | 0.0000491 | 5038 | GTEx | DepMap | Descartes | 0.24 | 39.16 |
| TRAK2 | 0.0000326 | 5444 | GTEx | DepMap | Descartes | 0.14 | 23.56 |
| CPOX | -0.0000227 | 7023 | GTEx | DepMap | Descartes | 0.04 | 17.57 |
| TMCC2 | -0.0000232 | 7042 | GTEx | DepMap | Descartes | 0.03 | 1.91 |
| SLC4A1 | -0.0000355 | 7493 | GTEx | DepMap | Descartes | 0.00 | 0.00 |
| TFR2 | -0.0000359 | 7504 | GTEx | DepMap | Descartes | 0.20 | 63.35 |
| ABCB10 | -0.0000534 | 8071 | GTEx | DepMap | Descartes | 0.11 | 26.20 |
| ALAS2 | -0.0000803 | 8909 | GTEx | DepMap | Descartes | 0.00 | 0.00 |
| EPB41 | -0.0000813 | 8939 | GTEx | DepMap | Descartes | 0.52 | 55.18 |
| RAPGEF2 | -0.0000972 | 9373 | GTEx | DepMap | Descartes | 0.54 | 83.45 |
| RGS6 | -0.0001127 | 9793 | GTEx | DepMap | Descartes | 0.03 | 4.38 |
| SPTB | -0.0001236 | 10045 | GTEx | DepMap | Descartes | 0.05 | 7.74 |
| SNCA | -0.0001627 | 10841 | GTEx | DepMap | Descartes | 0.18 | 48.50 |
| FECH | -0.0001706 | 10974 | GTEx | DepMap | Descartes | 0.06 | 7.54 |
| SOX6 | -0.0006618 | 12458 | GTEx | DepMap | Descartes | 0.58 | 75.08 |
| NA | NA | NA | NA | NA | NA | NA | NA |
Descartes myeloid markers
Top 50 marker genes of myeloid cells in the Decartes fetal adrenal single cell map (https://atlas.brotmanbaty.org/bbi/human-gene-expression-during-development/cell/myeloid/in/adrenal)
Wilcoxon ranksum test P-value for gene set overrepresentation: 8.43e-01
Mean rank of genes in gene set: 6865.42
Median rank of genes in gene set: 7883.5
Rank on gene expression program of top 30 genes in gene set:
| Genes | Weight | Rank | GTEx | DepMap | Descartes | Mean.Counts | Mean.TPM |
|---|---|---|---|---|---|---|---|
| SLC9A9 | 0.0027771 | 40 | GTEx | DepMap | Descartes | 0.52 | 269.29 |
| SLCO2B1 | 0.0015027 | 144 | GTEx | DepMap | Descartes | 0.14 | 27.84 |
| PTPRE | 0.0014366 | 156 | GTEx | DepMap | Descartes | 0.58 | 162.30 |
| CD74 | 0.0013409 | 179 | GTEx | DepMap | Descartes | 0.82 | 282.02 |
| ITPR2 | 0.0010349 | 281 | GTEx | DepMap | Descartes | 0.60 | 76.08 |
| CST3 | 0.0008485 | 393 | GTEx | DepMap | Descartes | 0.55 | 214.35 |
| CTSS | 0.0006027 | 638 | GTEx | DepMap | Descartes | 0.14 | 49.34 |
| ABCA1 | 0.0005804 | 666 | GTEx | DepMap | Descartes | 0.25 | 50.05 |
| HRH1 | 0.0004683 | 896 | GTEx | DepMap | Descartes | 0.14 | 42.75 |
| CTSC | 0.0003375 | 1332 | GTEx | DepMap | Descartes | 0.11 | 30.08 |
| RGL1 | 0.0002577 | 1851 | GTEx | DepMap | Descartes | 0.21 | 57.29 |
| CSF1R | 0.0002239 | 2138 | GTEx | DepMap | Descartes | 0.06 | 21.74 |
| FGL2 | 0.0001719 | 2742 | GTEx | DepMap | Descartes | 0.04 | 14.12 |
| WWP1 | 0.0001563 | 2959 | GTEx | DepMap | Descartes | 0.23 | 80.98 |
| IFNGR1 | 0.0001508 | 3027 | GTEx | DepMap | Descartes | 0.16 | 76.26 |
| FGD2 | 0.0000602 | 4753 | GTEx | DepMap | Descartes | 0.05 | 10.11 |
| HCK | 0.0000331 | 5426 | GTEx | DepMap | Descartes | 0.03 | 22.01 |
| MARCH1 | 0.0000238 | 5694 | GTEx | DepMap | Descartes | 0.14 | NA |
| CTSD | 0.0000014 | 6328 | GTEx | DepMap | Descartes | 0.47 | 402.40 |
| SFMBT2 | -0.0000997 | 9439 | GTEx | DepMap | Descartes | 0.25 | 42.97 |
| CPVL | -0.0001293 | 10191 | GTEx | DepMap | Descartes | 0.08 | 25.95 |
| RBPJ | -0.0001486 | 10608 | GTEx | DepMap | Descartes | 0.48 | 110.99 |
| AXL | -0.0001704 | 10967 | GTEx | DepMap | Descartes | 0.16 | 37.85 |
| ATP8B4 | -0.0001807 | 11117 | GTEx | DepMap | Descartes | 0.04 | 9.75 |
| CD163 | -0.0001920 | 11279 | GTEx | DepMap | Descartes | 0.02 | 3.43 |
| CTSB | -0.0001932 | 11297 | GTEx | DepMap | Descartes | 0.33 | 140.02 |
| MERTK | -0.0002228 | 11596 | GTEx | DepMap | Descartes | 0.07 | 22.36 |
| CYBB | -0.0002295 | 11647 | GTEx | DepMap | Descartes | 0.03 | 3.64 |
| ADAP2 | -0.0003276 | 12127 | GTEx | DepMap | Descartes | 0.06 | 18.81 |
| MS4A4A | -0.0003298 | 12135 | GTEx | DepMap | Descartes | 0.00 | 0.00 |
Descartes Schwann markers
Top 50 marker genes of Schwann cells in the Decartes fetal adrenal single cell map (https://atlas.brotmanbaty.org/bbi/human-gene-expression-during-development/cell/schwann/in/adrenal)
Wilcoxon ranksum test P-value for gene set overrepresentation: 1.89e-01
Mean rank of genes in gene set: 5794.61
Median rank of genes in gene set: 4252
Rank on gene expression program of top 30 genes in gene set:
| Genes | Weight | Rank | GTEx | DepMap | Descartes | Mean.Counts | Mean.TPM |
|---|---|---|---|---|---|---|---|
| NRXN3 | 0.0021702 | 69 | GTEx | DepMap | Descartes | 0.81 | 159.27 |
| XKR4 | 0.0021460 | 74 | GTEx | DepMap | Descartes | 0.42 | 23.03 |
| GAS7 | 0.0015207 | 137 | GTEx | DepMap | Descartes | 0.47 | 106.10 |
| COL18A1 | 0.0011483 | 227 | GTEx | DepMap | Descartes | 0.91 | 219.05 |
| VIM | 0.0010974 | 250 | GTEx | DepMap | Descartes | 1.12 | 718.14 |
| LAMC1 | 0.0010211 | 288 | GTEx | DepMap | Descartes | 0.60 | 127.66 |
| EDNRB | 0.0009662 | 317 | GTEx | DepMap | Descartes | 0.06 | 13.04 |
| LAMA4 | 0.0009109 | 344 | GTEx | DepMap | Descartes | 0.23 | 48.35 |
| STARD13 | 0.0008260 | 407 | GTEx | DepMap | Descartes | 0.46 | 141.46 |
| COL5A2 | 0.0006453 | 580 | GTEx | DepMap | Descartes | 1.28 | 376.18 |
| VCAN | 0.0005827 | 664 | GTEx | DepMap | Descartes | 1.34 | 201.70 |
| GRIK3 | 0.0004236 | 1030 | GTEx | DepMap | Descartes | 0.06 | 8.99 |
| HMGA2 | 0.0003993 | 1112 | GTEx | DepMap | Descartes | 0.04 | 12.97 |
| OLFML2A | 0.0003335 | 1352 | GTEx | DepMap | Descartes | 0.04 | 9.17 |
| PLCE1 | 0.0003140 | 1467 | GTEx | DepMap | Descartes | 0.15 | 16.85 |
| FIGN | 0.0002957 | 1565 | GTEx | DepMap | Descartes | 0.31 | 45.60 |
| COL25A1 | 0.0001713 | 2751 | GTEx | DepMap | Descartes | 0.04 | 5.91 |
| PTN | 0.0001492 | 3050 | GTEx | DepMap | Descartes | 0.28 | 178.37 |
| IL1RAPL1 | 0.0001486 | 3057 | GTEx | DepMap | Descartes | 0.25 | 82.32 |
| LAMB1 | 0.0001078 | 3756 | GTEx | DepMap | Descartes | 0.52 | 122.54 |
| ERBB3 | 0.0001010 | 3887 | GTEx | DepMap | Descartes | 0.03 | 6.18 |
| PTPRZ1 | 0.0001001 | 3905 | GTEx | DepMap | Descartes | 0.01 | 0.74 |
| SFRP1 | 0.0000665 | 4599 | GTEx | DepMap | Descartes | 0.10 | 43.55 |
| PLP1 | 0.0000626 | 4695 | GTEx | DepMap | Descartes | 0.01 | 6.35 |
| KCTD12 | 0.0000293 | 5531 | GTEx | DepMap | Descartes | 0.08 | 15.05 |
| EGFLAM | -0.0000062 | 6543 | GTEx | DepMap | Descartes | 0.10 | 28.82 |
| GFRA3 | -0.0000545 | 8104 | GTEx | DepMap | Descartes | 0.17 | 67.65 |
| SLC35F1 | -0.0000682 | 8548 | GTEx | DepMap | Descartes | 0.06 | 14.73 |
| MDGA2 | -0.0000864 | 9093 | GTEx | DepMap | Descartes | 0.00 | 0.00 |
| MPZ | -0.0001051 | 9585 | GTEx | DepMap | Descartes | 0.00 | 0.00 |
Descartes Megakaryocytes markers
Top 50 marker genes of Megakaryocytes cells in the Decartes fetal adrenal single cell map (https://atlas.brotmanbaty.org/bbi/human-gene-expression-during-development/cell/megakaryocytes/in/adrenal)
Wilcoxon ranksum test P-value for gene set overrepresentation: 4.76e-03
Mean rank of genes in gene set: 4877.11
Median rank of genes in gene set: 2443
Rank on gene expression program of top 30 genes in gene set:
| Genes | Weight | Rank | GTEx | DepMap | Descartes | Mean.Counts | Mean.TPM |
|---|---|---|---|---|---|---|---|
| SLC2A3 | 0.0019557 | 91 | GTEx | DepMap | Descartes | 0.62 | 238.12 |
| SLC24A3 | 0.0011881 | 217 | GTEx | DepMap | Descartes | 0.31 | 106.46 |
| MYH9 | 0.0008616 | 379 | GTEx | DepMap | Descartes | 0.55 | 119.24 |
| GSN | 0.0008514 | 390 | GTEx | DepMap | Descartes | 0.44 | 107.03 |
| TRPC6 | 0.0008334 | 400 | GTEx | DepMap | Descartes | 0.08 | 15.96 |
| LTBP1 | 0.0008174 | 413 | GTEx | DepMap | Descartes | 0.25 | 64.28 |
| MMRN1 | 0.0007712 | 453 | GTEx | DepMap | Descartes | 0.08 | 15.49 |
| ARHGAP6 | 0.0006473 | 578 | GTEx | DepMap | Descartes | 0.16 | 33.76 |
| VCL | 0.0005363 | 733 | GTEx | DepMap | Descartes | 0.44 | 93.02 |
| FLNA | 0.0005110 | 792 | GTEx | DepMap | Descartes | 0.57 | 99.28 |
| ACTN1 | 0.0004814 | 861 | GTEx | DepMap | Descartes | 0.63 | 189.07 |
| TMSB4X | 0.0004501 | 947 | GTEx | DepMap | Descartes | 5.19 | 3018.20 |
| GP1BA | 0.0004453 | 961 | GTEx | DepMap | Descartes | 0.03 | 10.41 |
| TPM4 | 0.0004187 | 1044 | GTEx | DepMap | Descartes | 0.37 | 111.58 |
| MYLK | 0.0003235 | 1413 | GTEx | DepMap | Descartes | 0.14 | 17.62 |
| PDE3A | 0.0003206 | 1427 | GTEx | DepMap | Descartes | 0.82 | 207.09 |
| ANGPT1 | 0.0002934 | 1582 | GTEx | DepMap | Descartes | 0.08 | 23.39 |
| STOM | 0.0002730 | 1736 | GTEx | DepMap | Descartes | 0.14 | 47.62 |
| DOK6 | 0.0002700 | 1754 | GTEx | DepMap | Descartes | 0.38 | 59.74 |
| RAP1B | 0.0002674 | 1781 | GTEx | DepMap | Descartes | 0.37 | 45.73 |
| LIMS1 | 0.0002426 | 1974 | GTEx | DepMap | Descartes | 0.50 | 204.60 |
| TGFB1 | 0.0002402 | 1991 | GTEx | DepMap | Descartes | 0.20 | 106.63 |
| FLI1 | 0.0001960 | 2443 | GTEx | DepMap | Descartes | 0.29 | 59.48 |
| STON2 | 0.0001874 | 2562 | GTEx | DepMap | Descartes | 0.19 | 38.08 |
| FERMT3 | 0.0001244 | 3435 | GTEx | DepMap | Descartes | 0.05 | 42.66 |
| ZYX | 0.0000202 | 5807 | GTEx | DepMap | Descartes | 0.12 | 103.91 |
| HIPK2 | 0.0000113 | 6042 | GTEx | DepMap | Descartes | 0.57 | 51.74 |
| CD9 | -0.0000062 | 6544 | GTEx | DepMap | Descartes | 0.25 | 158.89 |
| MED12L | -0.0000249 | 7103 | GTEx | DepMap | Descartes | 0.06 | 6.74 |
| TUBB1 | -0.0000276 | 7200 | GTEx | DepMap | Descartes | 0.00 | 0.00 |
Descartes Lyphoid markers
Top 50 marker genes of Lyphoid cells in the Decartes fetal adrenal single cell map (https://atlas.brotmanbaty.org/bbi/human-gene-expression-during-development/cell/lymphoid/in/adrenal)
Wilcoxon ranksum test P-value for gene set overrepresentation: 8.60e-07
Mean rank of genes in gene set: 3605.38
Median rank of genes in gene set: 702.5
Rank on gene expression program of top 30 genes in gene set:
| Genes | Weight | Rank | GTEx | DepMap | Descartes | Mean.Counts | Mean.TPM |
|---|---|---|---|---|---|---|---|
| B2M | 0.0031452 | 25 | GTEx | DepMap | Descartes | 3.35 | 1835.87 |
| ARHGAP15 | 0.0028605 | 33 | GTEx | DepMap | Descartes | 0.82 | 386.03 |
| SP100 | 0.0013444 | 177 | GTEx | DepMap | Descartes | 0.36 | 102.36 |
| DOCK10 | 0.0012650 | 193 | GTEx | DepMap | Descartes | 0.74 | 129.45 |
| FOXP1 | 0.0012487 | 199 | GTEx | DepMap | Descartes | 2.97 | 484.52 |
| MBNL1 | 0.0010805 | 260 | GTEx | DepMap | Descartes | 1.15 | 265.05 |
| ARID5B | 0.0010575 | 270 | GTEx | DepMap | Descartes | 0.62 | 130.30 |
| ETS1 | 0.0010137 | 290 | GTEx | DepMap | Descartes | 0.35 | 99.57 |
| NCALD | 0.0010029 | 296 | GTEx | DepMap | Descartes | 0.52 | 191.98 |
| CCND3 | 0.0008970 | 352 | GTEx | DepMap | Descartes | 0.30 | 226.91 |
| PLEKHA2 | 0.0008919 | 358 | GTEx | DepMap | Descartes | 0.21 | 67.31 |
| SKAP1 | 0.0008701 | 368 | GTEx | DepMap | Descartes | 0.18 | 113.44 |
| SAMD3 | 0.0008464 | 396 | GTEx | DepMap | Descartes | 0.08 | 35.29 |
| LEF1 | 0.0008196 | 411 | GTEx | DepMap | Descartes | 0.15 | 53.50 |
| CELF2 | 0.0008081 | 422 | GTEx | DepMap | Descartes | 0.70 | 106.62 |
| RCSD1 | 0.0007997 | 428 | GTEx | DepMap | Descartes | 0.13 | 30.74 |
| IKZF1 | 0.0007772 | 444 | GTEx | DepMap | Descartes | 0.09 | 15.64 |
| ITPKB | 0.0007618 | 458 | GTEx | DepMap | Descartes | 0.17 | 37.38 |
| PRKCH | 0.0006873 | 533 | GTEx | DepMap | Descartes | 0.30 | 92.56 |
| MSN | 0.0005701 | 681 | GTEx | DepMap | Descartes | 0.22 | 88.21 |
| MCTP2 | 0.0005623 | 692 | GTEx | DepMap | Descartes | 0.16 | 30.91 |
| ANKRD44 | 0.0005504 | 713 | GTEx | DepMap | Descartes | 0.52 | 96.19 |
| CCL5 | 0.0004022 | 1101 | GTEx | DepMap | Descartes | 0.05 | 36.83 |
| LCP1 | 0.0003655 | 1217 | GTEx | DepMap | Descartes | 0.06 | 31.34 |
| WIPF1 | 0.0003169 | 1444 | GTEx | DepMap | Descartes | 0.31 | 90.79 |
| ABLIM1 | 0.0003148 | 1458 | GTEx | DepMap | Descartes | 0.31 | 44.99 |
| PITPNC1 | 0.0003032 | 1514 | GTEx | DepMap | Descartes | 0.93 | 185.19 |
| BACH2 | 0.0001911 | 2516 | GTEx | DepMap | Descartes | 0.76 | 111.43 |
| ARHGDIB | 0.0001783 | 2659 | GTEx | DepMap | Descartes | 0.06 | 45.44 |
| PTPRC | 0.0000835 | 4234 | GTEx | DepMap | Descartes | 0.10 | 19.60 |
Below shows the ranks on this GEP for immune marker gene lists curated by CellTypist (https://www.celltypist.org/encyclopedia).
High ranks indicate this gene is a driver of this GEP.
These curated gene list are ranked by P-value (on this GEP) of their constituent genes.
The Mean Count column shows the mean read count in cells scoring highly (H > 50) on this gene expression program.
Fibroblasts: Fibroblasts (model markers)
the most common cells of connective tissues which synthesize the extracellular matrix and collagen to maintain tissue homeostasis:
Wilcoxon ranksum test P-value for gene set overrepresentation: 1.55e-04
Mean rank of genes in gene set: 1920.22
Rank on gene expression program of genes in gene set:
| Genes | Weight | Rank | GTEx | DepMap | Decartes | Mean.Counts | Mean.TPM |
|---|---|---|---|---|---|---|---|
| PRRX1 | 0.0041227 | 11 | GTEx | DepMap | Descartes | 0.57 | 231.54 |
| PDGFRA | 0.0009306 | 332 | GTEx | DepMap | Descartes | 0.14 | 51.02 |
| EBF2 | 0.0007511 | 464 | GTEx | DepMap | Descartes | 0.10 | 23.95 |
| SMOC2 | 0.0004169 | 1050 | GTEx | DepMap | Descartes | 0.22 | 105.51 |
| NTRK2 | 0.0003284 | 1389 | GTEx | DepMap | Descartes | 0.11 | 20.70 |
| ANGPTL1 | 0.0002861 | 1630 | GTEx | DepMap | Descartes | 0.26 | 81.78 |
| OLFML1 | 0.0002504 | 1910 | GTEx | DepMap | Descartes | 0.03 | 7.82 |
| SFRP1 | 0.0000665 | 4599 | GTEx | DepMap | Descartes | 0.10 | 43.55 |
| F10 | 0.0000170 | 5897 | GTEx | DepMap | Descartes | 0.01 | 4.36 |
B cells: Memory B cells (model markers)
long-lived mature B lymphocytes which are formed within germinal centers following primary infection and selected for higher-affinity immunoglobulin:
Wilcoxon ranksum test P-value for gene set overrepresentation: 1.17e-02
Mean rank of genes in gene set: 467
Rank on gene expression program of genes in gene set:
| Genes | Weight | Rank | GTEx | DepMap | Decartes | Mean.Counts | Mean.TPM |
|---|---|---|---|---|---|---|---|
| CD74 | 0.0013409 | 179 | GTEx | DepMap | Descartes | 0.82 | 282.02 |
| HES1 | 0.0005265 | 755 | GTEx | DepMap | Descartes | 0.18 | 181.69 |
T cells: Tcm/Naive helper T cells (curated markers)
CD4+ helper T lymphocytes mainly localized in secondary lymphoid tissues and sustaining the responses by proliferating and producing new effectors:
Wilcoxon ranksum test P-value for gene set overrepresentation: 1.78e-02
Mean rank of genes in gene set: 1879.33
Rank on gene expression program of genes in gene set:
| Genes | Weight | Rank | GTEx | DepMap | Decartes | Mean.Counts | Mean.TPM |
|---|---|---|---|---|---|---|---|
| CCR7 | 0.0009624 | 319 | GTEx | DepMap | Descartes | 0.03 | 26.30 |
| SELL | 0.0004646 | 912 | GTEx | DepMap | Descartes | 0.03 | 7.28 |
| CD4 | 0.0000746 | 4407 | GTEx | DepMap | Descartes | 0.02 | 3.72 |