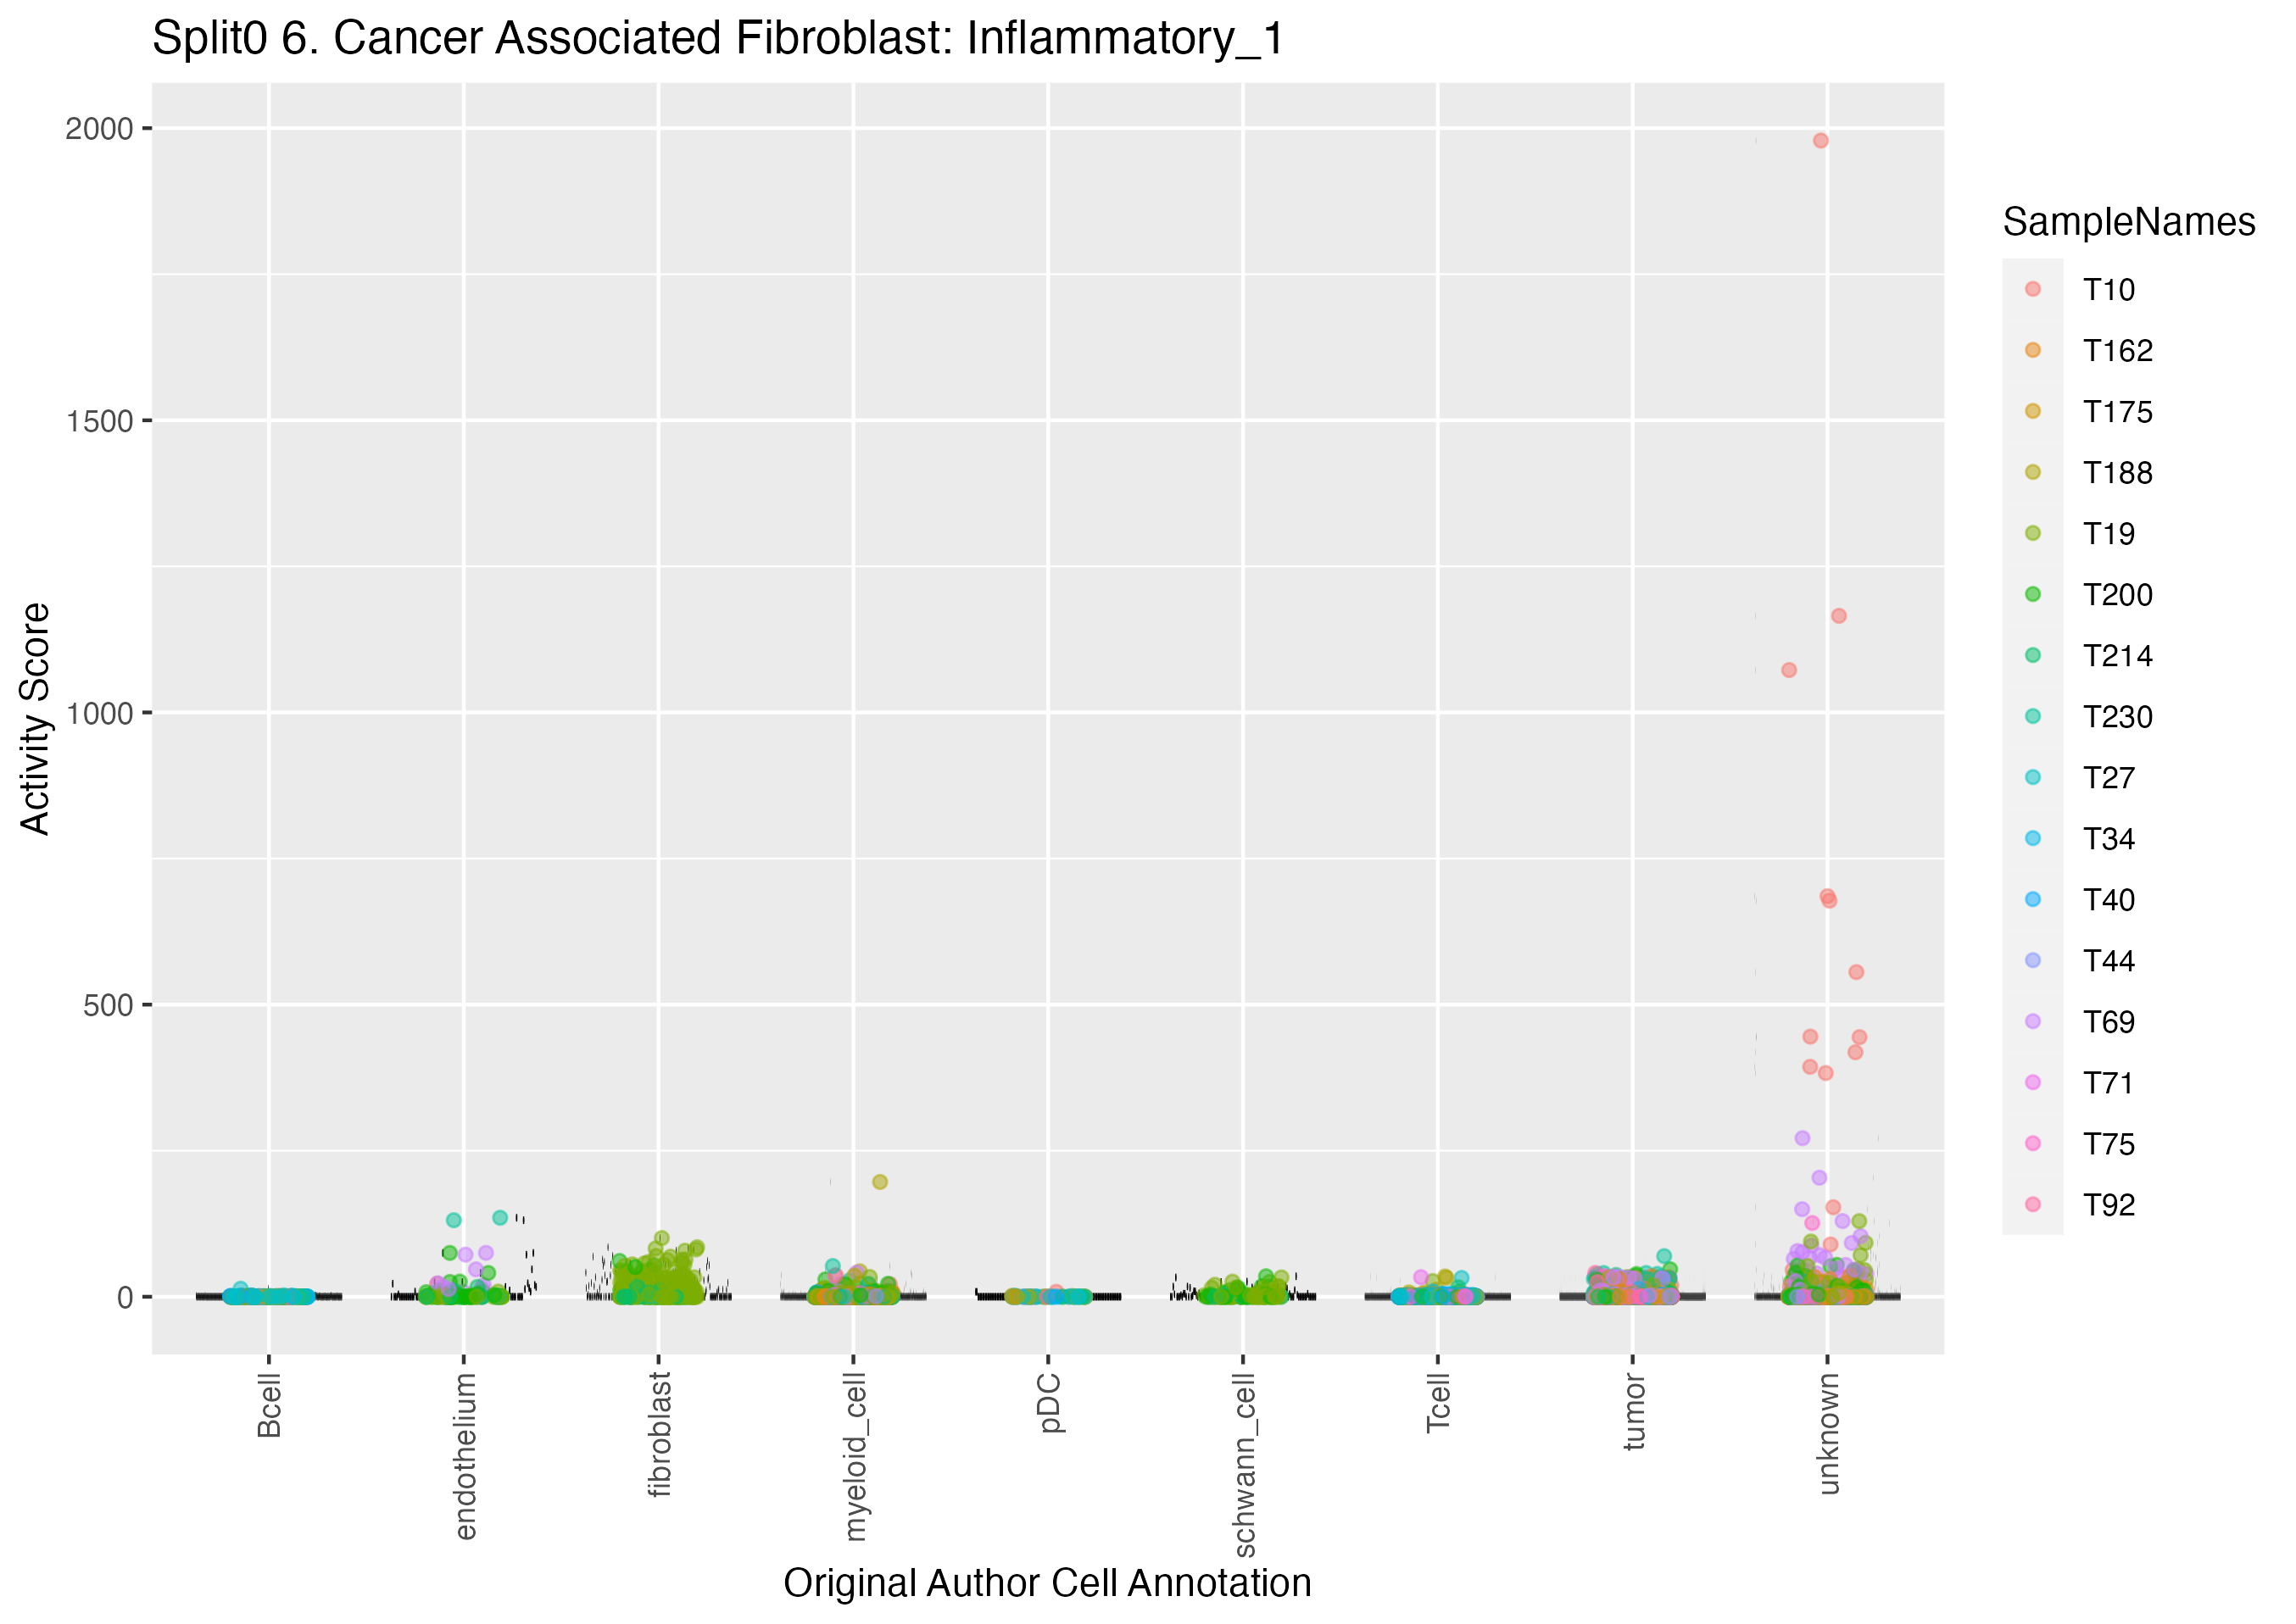
Program: 6. Cancer Associated Fibroblast: Inflammatory.
Submit a comment on this gene expression program’s interpretation: CLICK
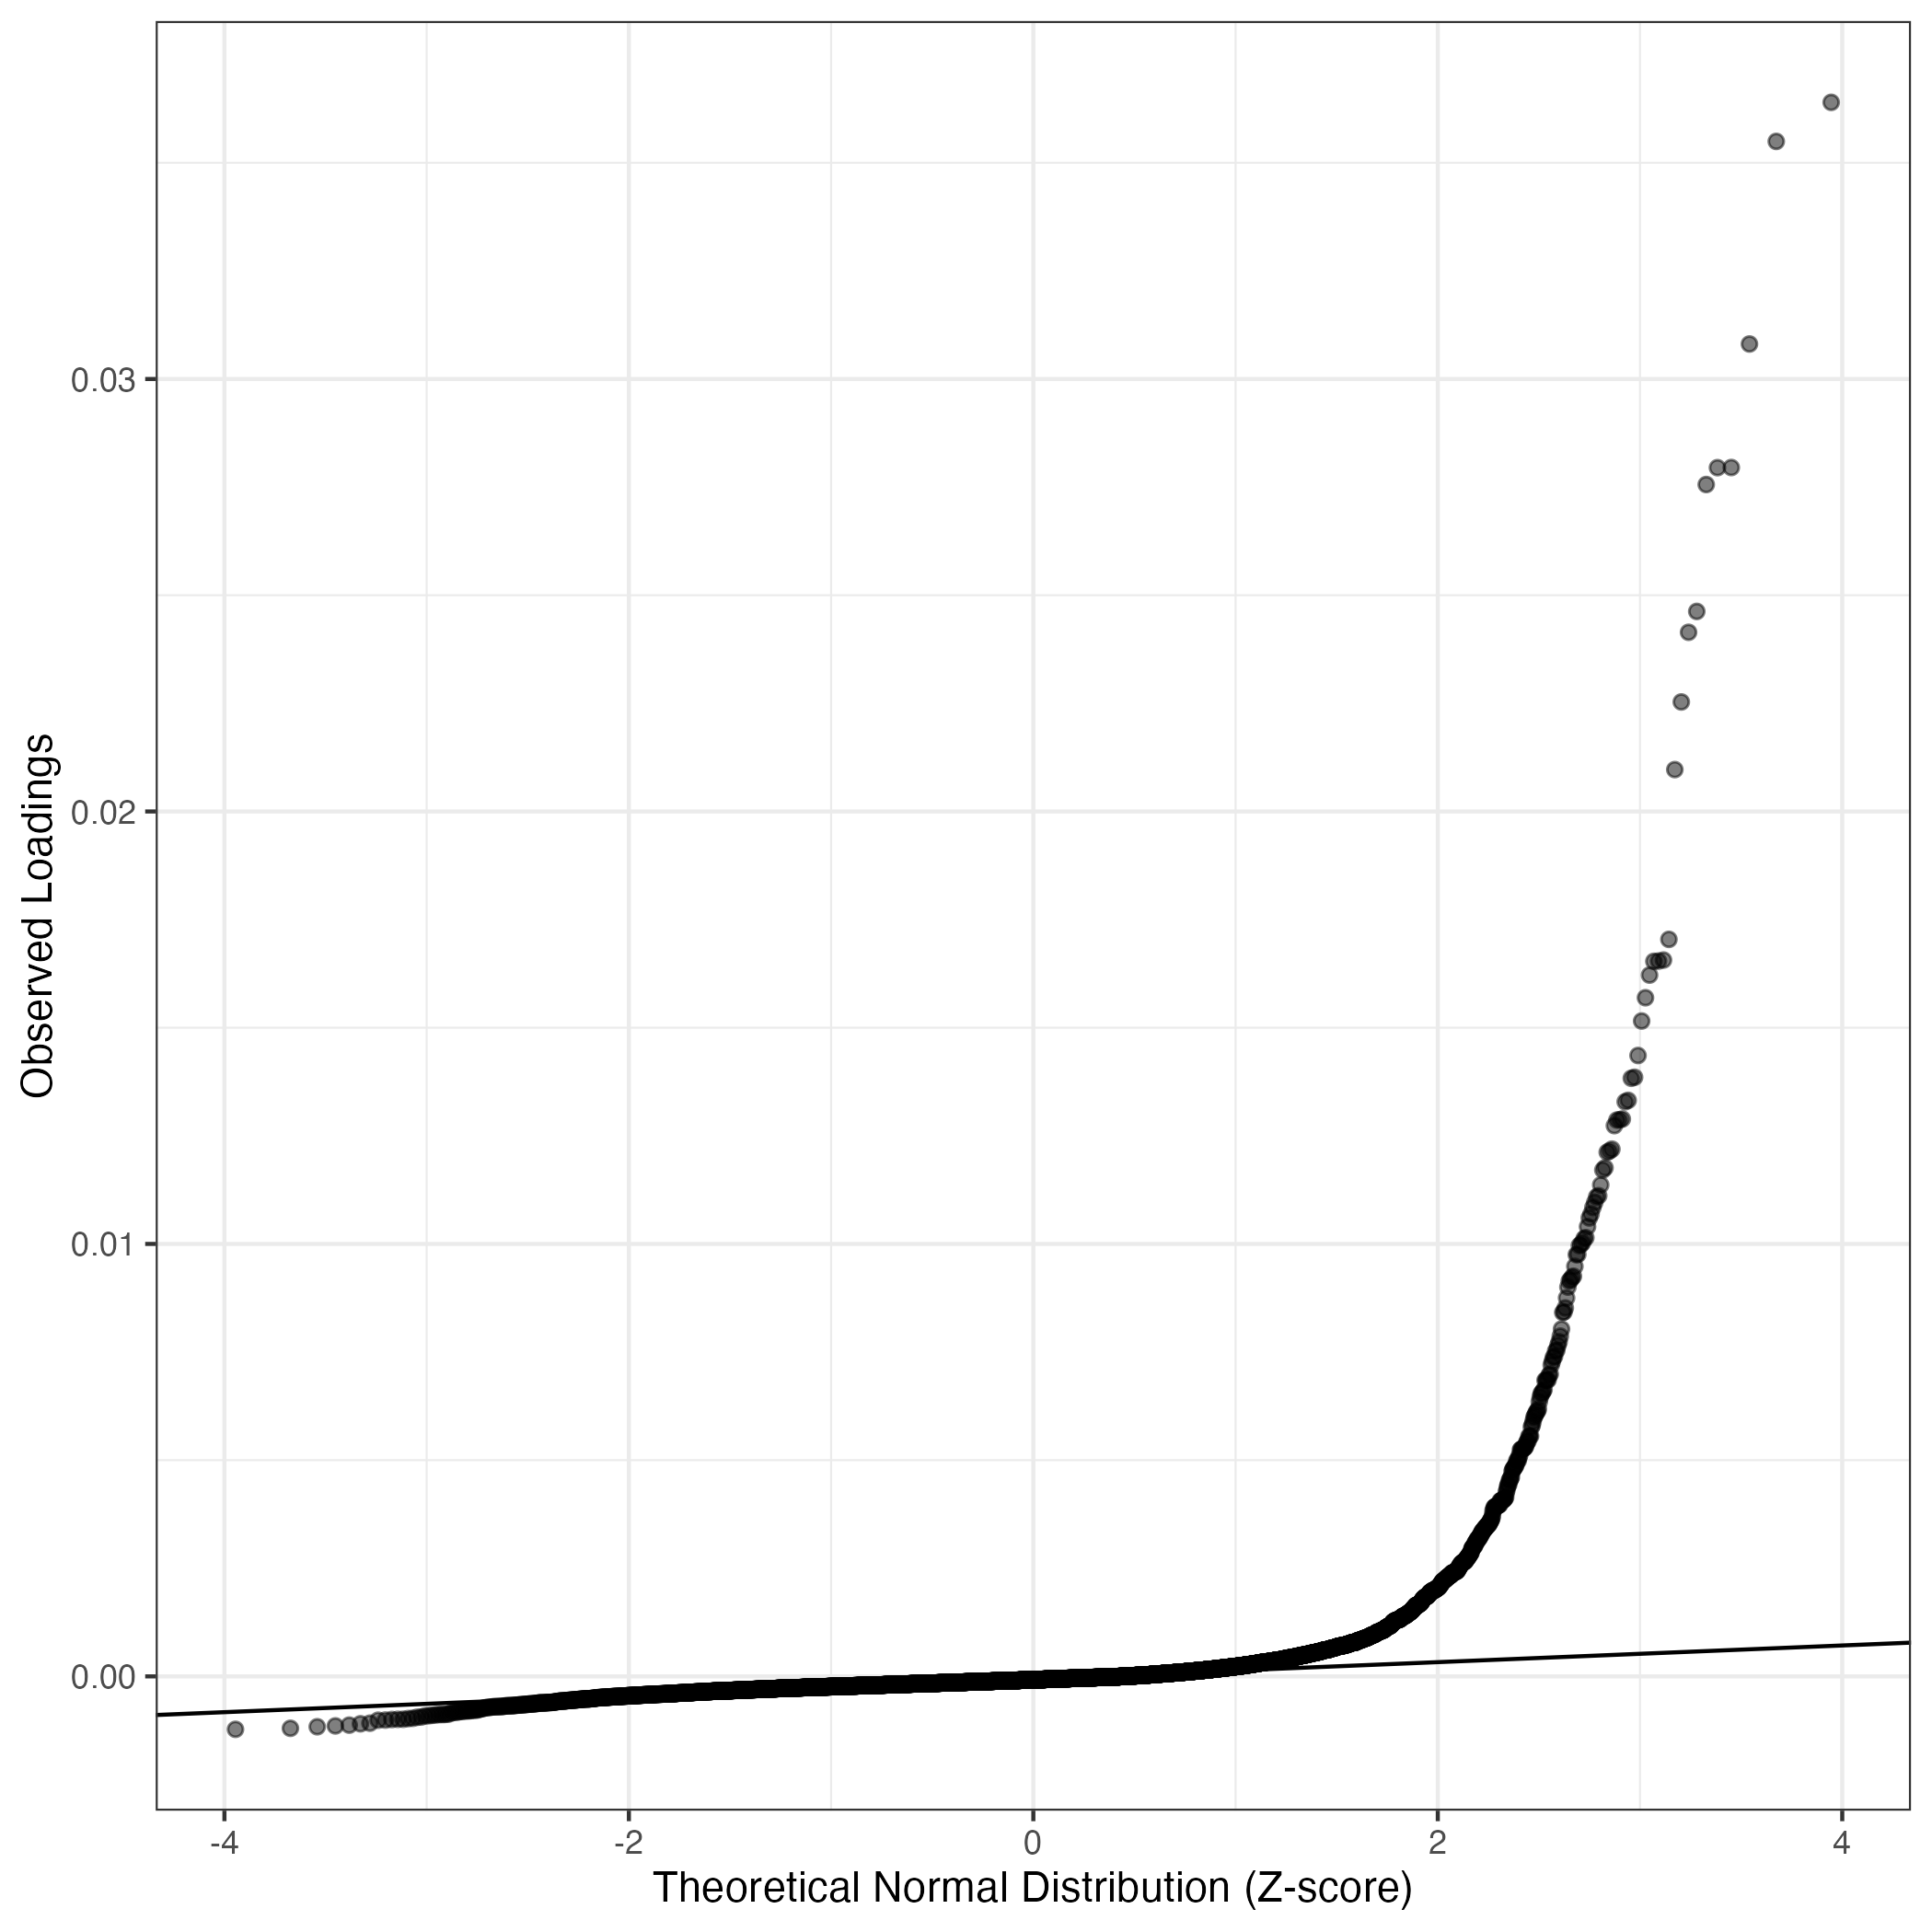
QQ-plot of gene loadings, averaged over both independent splits of the data
This plot highlights the relative contribution of each gene to the GEP
Top genes driving this program.
Note: Decartes website is buggy, try refreshing. Also, Decartes fetal adrenal data have been collected at specific time points (89-122 days), all possible cell types of interest may not be represented, do not overinterpret.
The Mean Count column shows the mean read count in cells scoring highly (H > 50) on this gene expression program.
| Gene | Loading | Gene.Name | GTEx | DepMap | Descartes | Mean.Counts | Mean.Tpm | |
|---|---|---|---|---|---|---|---|---|
| 1 | SFRP2 | 0.0363968 | secreted frizzled related protein 2 | GTEx | DepMap | Descartes | 2.00 | 498.51 |
| 2 | OMD | 0.0354938 | osteomodulin | GTEx | DepMap | Descartes | 0.89 | 133.42 |
| 3 | MFAP5 | 0.0308093 | microfibril associated protein 5 | GTEx | DepMap | Descartes | 1.30 | 177.12 |
| 4 | RSPO3 | 0.0279529 | R-spondin 3 | GTEx | DepMap | Descartes | 0.62 | NA |
| 5 | TNNC1 | 0.0279499 | troponin C1, slow skeletal and cardiac type | GTEx | DepMap | Descartes | 0.25 | 130.54 |
| 6 | DCN | 0.0275596 | decorin | GTEx | DepMap | Descartes | 30.11 | 1581.50 |
| 7 | MGP | 0.0246255 | matrix Gla protein | GTEx | DepMap | Descartes | 39.44 | 7383.72 |
| 8 | CCDC80 | 0.0241432 | coiled-coil domain containing 80 | GTEx | DepMap | Descartes | 5.75 | 148.47 |
| 9 | SERTM1 | 0.0225323 | serine rich and transmembrane domain containing 1 | GTEx | DepMap | Descartes | 0.02 | 2.98 |
| 10 | IGFBP6 | 0.0209681 | insulin like growth factor binding protein 6 | GTEx | DepMap | Descartes | 10.14 | 2935.42 |
| 11 | BOC | 0.0170424 | BOC cell adhesion associated, oncogene regulated | GTEx | DepMap | Descartes | 0.28 | 14.58 |
| 12 | FBLN1 | 0.0165639 | fibulin 1 | GTEx | DepMap | Descartes | 5.33 | 748.69 |
| 13 | CFD | 0.0165407 | complement factor D | GTEx | DepMap | Descartes | 11.02 | 4586.45 |
| 14 | SFRP4 | 0.0165349 | secreted frizzled related protein 4 | GTEx | DepMap | Descartes | 3.27 | 404.03 |
| 15 | GAS1 | 0.0162166 | growth arrest specific 1 | GTEx | DepMap | Descartes | 1.00 | 82.74 |
| 16 | C7 | 0.0156928 | complement C7 | GTEx | DepMap | Descartes | 1.59 | 106.00 |
| 17 | OGN | 0.0151548 | osteoglycin | GTEx | DepMap | Descartes | 1.92 | 172.35 |
| 18 | PODN | 0.0143571 | podocan | GTEx | DepMap | Descartes | 0.59 | 69.16 |
| 19 | ASPN | 0.0138540 | asporin | GTEx | DepMap | Descartes | 0.53 | 100.32 |
| 20 | MGST1 | 0.0138307 | microsomal glutathione S-transferase 1 | GTEx | DepMap | Descartes | 1.47 | 192.78 |
| 21 | NNMT | 0.0133198 | nicotinamide N-methyltransferase | GTEx | DepMap | Descartes | 4.30 | 599.11 |
| 22 | PROCR | 0.0132877 | protein C receptor | GTEx | DepMap | Descartes | 0.78 | 209.21 |
| 23 | F3 | 0.0128880 | coagulation factor III, tissue factor | GTEx | DepMap | Descartes | 1.17 | 192.85 |
| 24 | ANGPTL1 | 0.0128715 | angiopoietin like 1 | GTEx | DepMap | Descartes | 0.30 | 31.38 |
| 25 | C3 | 0.0128638 | complement C3 | GTEx | DepMap | Descartes | 3.08 | 186.29 |
| 26 | FIBIN | 0.0127353 | fin bud initiation factor homolog | GTEx | DepMap | Descartes | 0.14 | 15.40 |
| 27 | GSN | 0.0121915 | gelsolin | GTEx | DepMap | Descartes | 17.66 | 955.42 |
| 28 | TWIST2 | 0.0121491 | twist family bHLH transcription factor 2 | GTEx | DepMap | Descartes | 0.52 | 124.55 |
| 29 | PDGFRL | 0.0121216 | platelet derived growth factor receptor like | GTEx | DepMap | Descartes | 1.14 | 215.56 |
| 30 | EMP1 | 0.0117605 | epithelial membrane protein 1 | GTEx | DepMap | Descartes | 1.88 | 83.64 |
| 31 | MFGE8 | 0.0117090 | milk fat globule EGF and factor V/VIII domain containing | GTEx | DepMap | Descartes | 1.97 | 248.13 |
| 32 | ABI3BP | 0.0113648 | ABI family member 3 binding protein | GTEx | DepMap | Descartes | 0.33 | 15.25 |
| 33 | PRELP | 0.0111144 | proline and arginine rich end leucine rich repeat protein | GTEx | DepMap | Descartes | 1.11 | 73.58 |
| 34 | CXCL14 | 0.0110899 | C-X-C motif chemokine ligand 14 | GTEx | DepMap | Descartes | 1.12 | 217.80 |
| 35 | CCDC3 | 0.0109610 | coiled-coil domain containing 3 | GTEx | DepMap | Descartes | 0.36 | 42.53 |
| 36 | CLU | 0.0108443 | clusterin | GTEx | DepMap | Descartes | 4.30 | 520.17 |
| 37 | MFAP4 | 0.0106936 | microfibril associated protein 4 | GTEx | DepMap | Descartes | 1.11 | 228.77 |
| 38 | SERPING1 | 0.0106009 | serpin family G member 1 | GTEx | DepMap | Descartes | 4.08 | 597.18 |
| 39 | TNXB | 0.0103995 | tenascin XB | GTEx | DepMap | Descartes | 0.52 | 15.02 |
| 40 | SOD3 | 0.0101448 | superoxide dismutase 3 | GTEx | DepMap | Descartes | 2.77 | 628.55 |
| 41 | IGF2 | 0.0101239 | insulin like growth factor 2 | GTEx | DepMap | Descartes | 1.69 | 121.68 |
| 42 | F10 | 0.0100318 | coagulation factor X | GTEx | DepMap | Descartes | 0.31 | 79.50 |
| 43 | INMT | 0.0099834 | indolethylamine N-methyltransferase | GTEx | DepMap | Descartes | 0.95 | 110.78 |
| 44 | EFEMP1 | 0.0099628 | EGF containing fibulin extracellular matrix protein 1 | GTEx | DepMap | Descartes | 3.84 | 364.45 |
| 45 | KRT222 | 0.0097584 | keratin 222 | GTEx | DepMap | Descartes | 0.05 | 5.89 |
| 46 | CRISPLD2 | 0.0097514 | cysteine rich secretory protein LCCL domain containing 2 | GTEx | DepMap | Descartes | 0.94 | 56.55 |
| 47 | AOX1 | 0.0094814 | aldehyde oxidase 1 | GTEx | DepMap | Descartes | 0.20 | 13.62 |
| 48 | CYBRD1 | 0.0092537 | cytochrome b reductase 1 | GTEx | DepMap | Descartes | 0.83 | 57.60 |
| 49 | ACKR4 | 0.0092263 | atypical chemokine receptor 4 | GTEx | DepMap | Descartes | 0.08 | NA |
| 50 | THSD4 | 0.0091708 | thrombospondin type 1 domain containing 4 | GTEx | DepMap | Descartes | 0.17 | 5.28 |
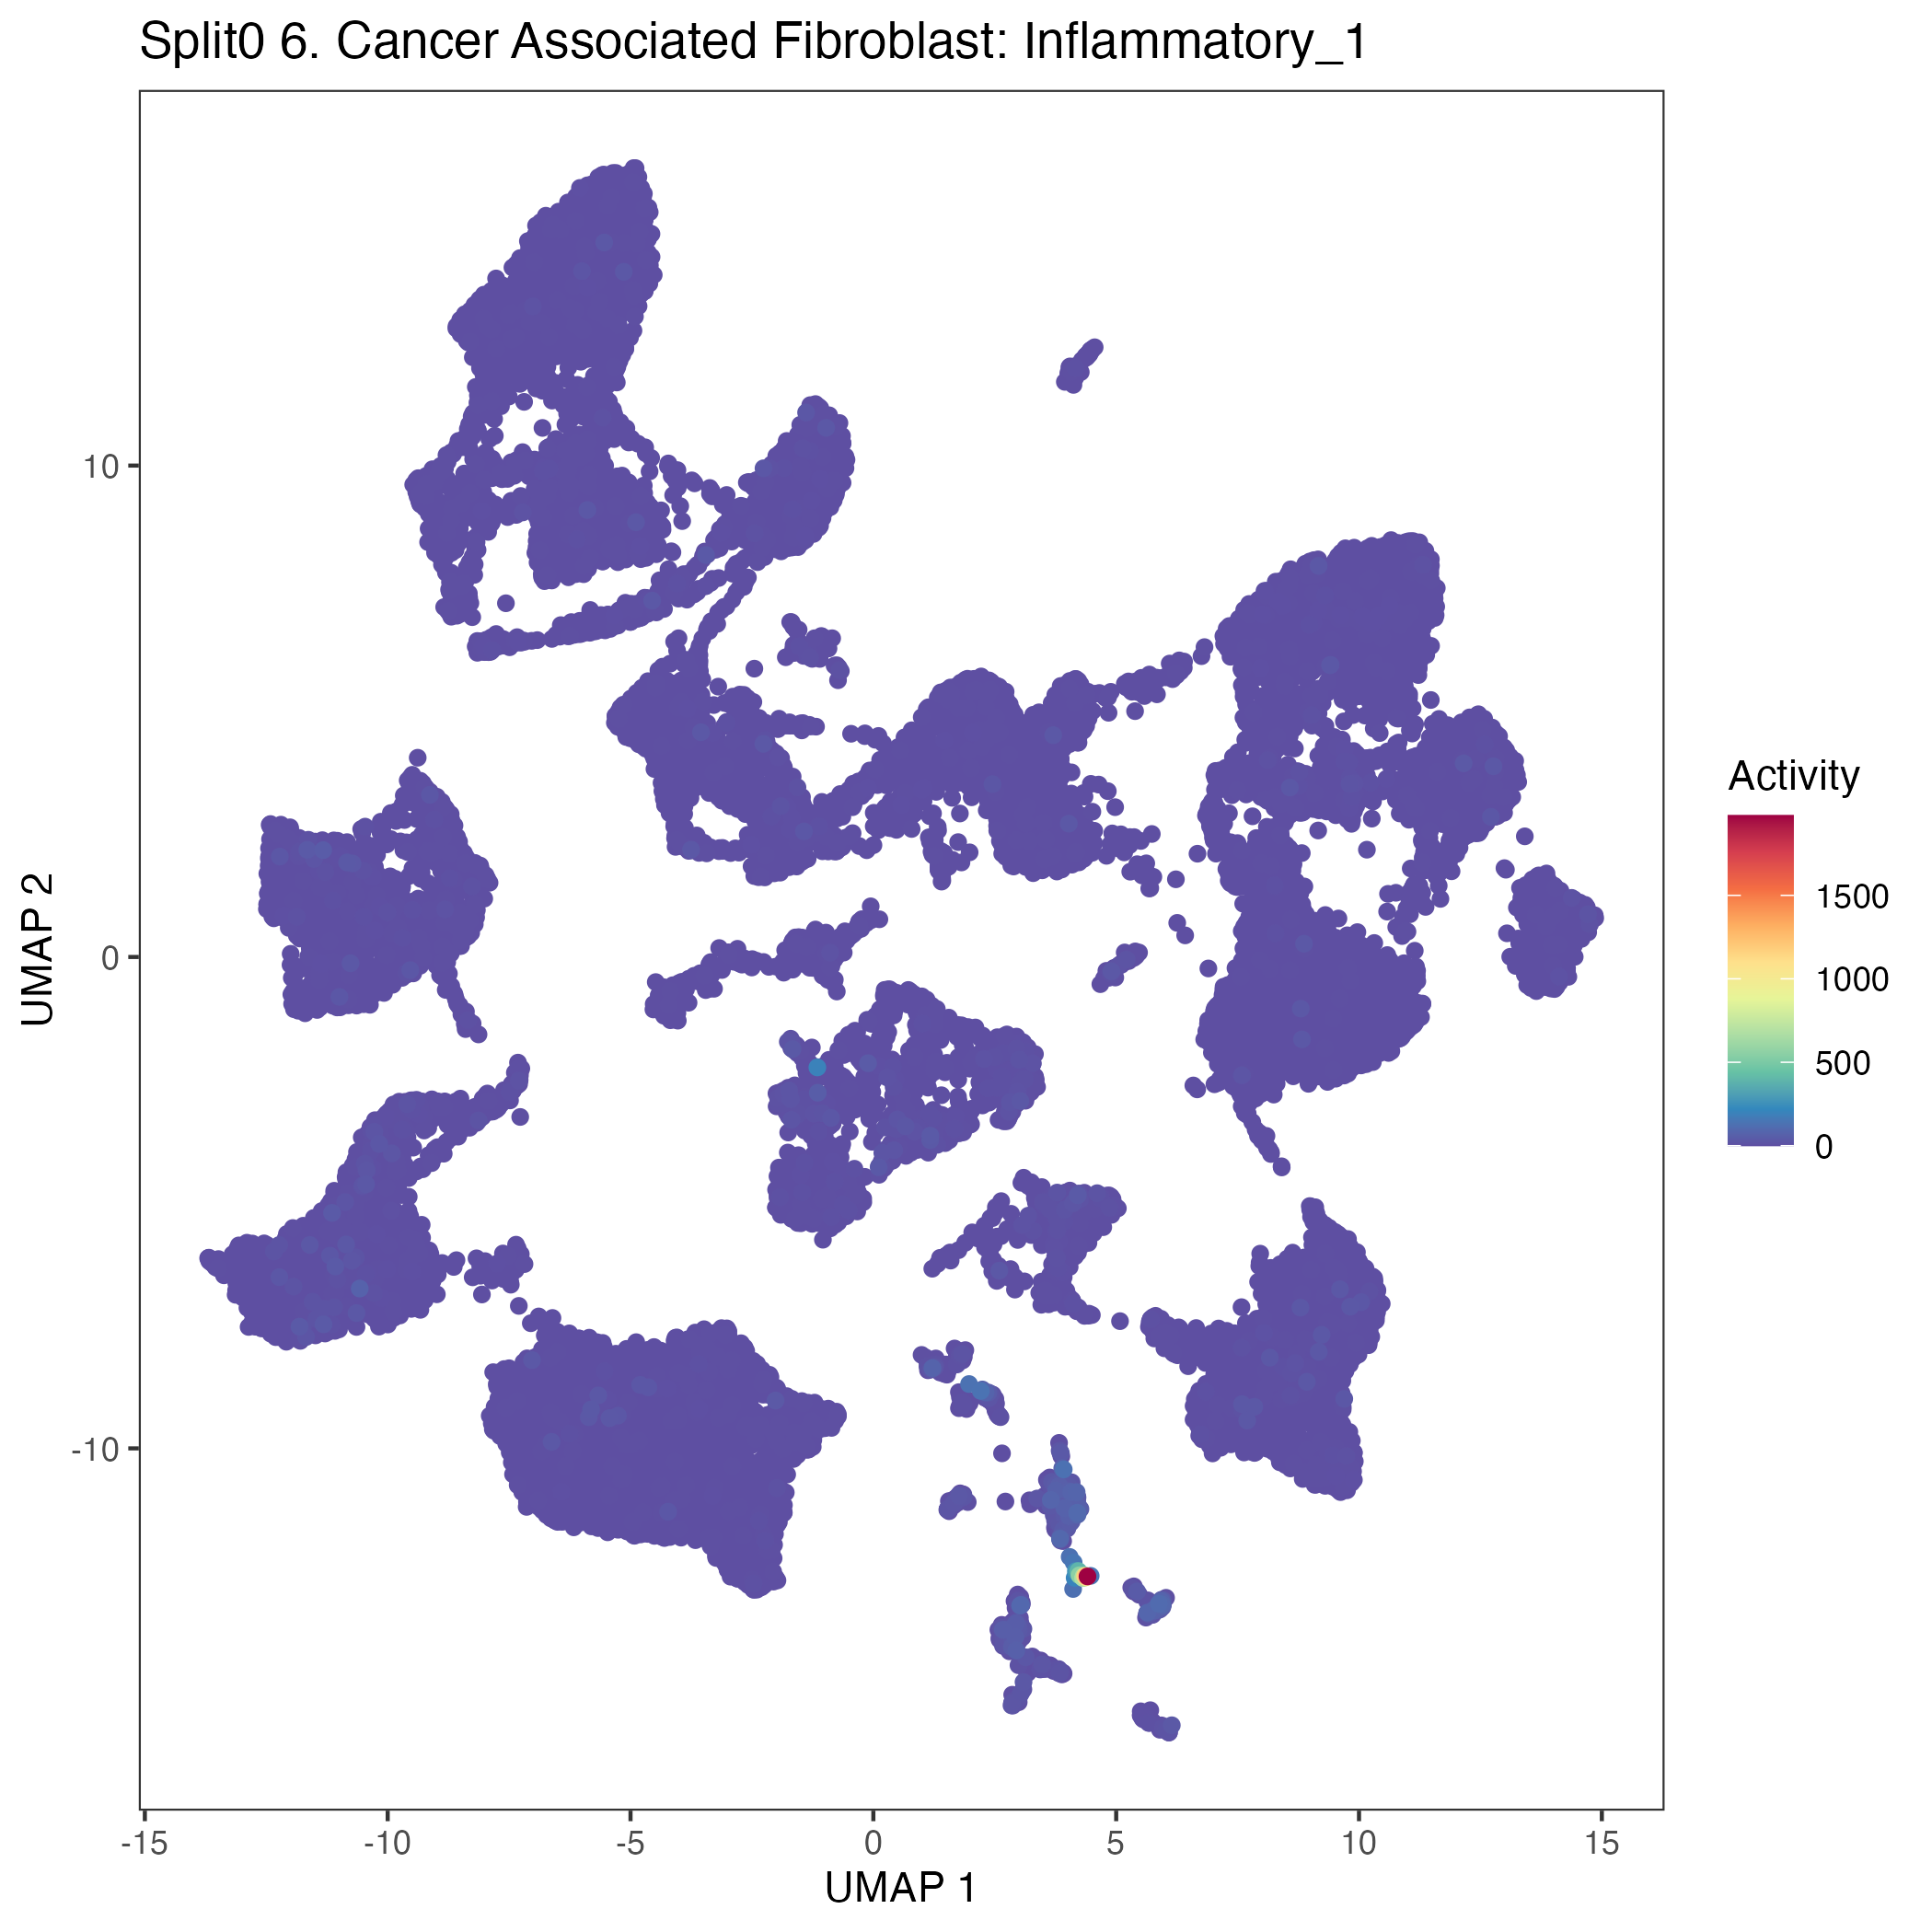
UMAP plots showing activity of gene expression program identified in GEP 6. Cancer Associated Fibroblast: Inflammatory:
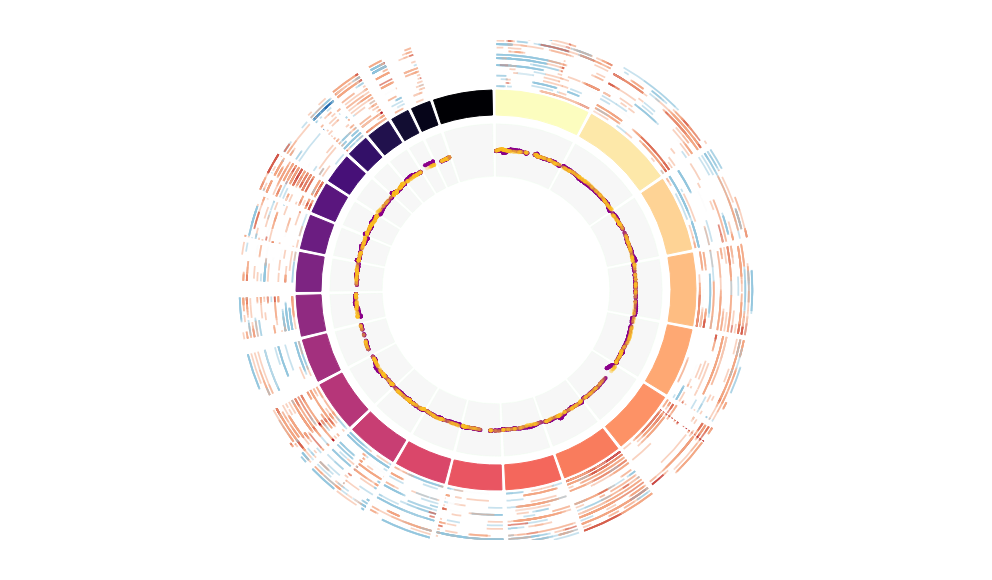
CNV Data procured from inferCNV.
Outer tracks are putative CNV regions (gains = red, losses = blue) for each patient
Inner track is expression data representing:
The top cells expressing this GEP (purple)
Random cells (n =50) from the reference set used in inferCNV (orange)
Gene set Enrichments for this program, caculated from top 50 genes
mSigDB Cell Types Gene Set:
| P-value | OR | Lower 95% CI | FDR | FWER | Genes Found | Gene Set Size | |
|---|---|---|---|---|---|---|---|
| TRAVAGLINI_LUNG_ADVENTITIAL_FIBROBLAST_CELL | 3.59e-35 | 64.70 | 35.13 | 2.41e-32 | 2.41e-32 | 29SFRP2, OMD, MFAP5, RSPO3, DCN, MGP, CCDC80, IGFBP6, FBLN1, CFD, SFRP4, GAS1, C7, OGN, PODN, MGST1, NNMT, F3, C3, FIBIN, GSN, PDGFRL, EMP1, ABI3BP, CXCL14, EFEMP1, AOX1, CYBRD1, ACKR4 |
296 |
| RUBENSTEIN_SKELETAL_MUSCLE_FAP_CELLS | 1.84e-26 | 57.21 | 30.31 | 6.17e-24 | 1.23e-23 | 21MFAP5, DCN, MGP, CCDC80, IGFBP6, FBLN1, CFD, SFRP4, PODN, MGST1, ANGPTL1, C3, GSN, PDGFRL, EMP1, CXCL14, MFAP4, SERPING1, TNXB, EFEMP1, CYBRD1 |
179 |
| GAO_LARGE_INTESTINE_24W_C1_DCLK1POS_PROGENITOR | 9.30e-19 | 57.15 | 27.43 | 1.25e-16 | 6.24e-16 | 14SFRP2, DCN, MGP, CCDC80, BOC, FBLN1, C7, OGN, ASPN, NNMT, C3, PDGFRL, SERPING1, CYBRD1 |
99 |
| DESCARTES_FETAL_MUSCLE_STROMAL_CELLS | 4.47e-17 | 51.64 | 24.27 | 4.29e-15 | 3.00e-14 | 13MFAP5, RSPO3, DCN, MGP, IGFBP6, FBLN1, OGN, ASPN, ANGPTL1, PDGFRL, CXCL14, TNXB, ACKR4 |
98 |
| DESCARTES_FETAL_STOMACH_STROMAL_CELLS | 1.62e-11 | 56.55 | 21.62 | 7.24e-10 | 1.09e-08 | 8SFRP2, DCN, FBLN1, C7, ANGPTL1, TWIST2, CXCL14, MFAP4 |
50 |
| DESCARTES_FETAL_KIDNEY_STROMAL_CELLS | 6.24e-18 | 40.86 | 20.21 | 6.98e-16 | 4.19e-15 | 15SFRP2, OMD, MFAP5, DCN, MGP, IGFBP6, OGN, PODN, ASPN, ANGPTL1, FIBIN, PRELP, SOD3, F10, AOX1 |
146 |
| DESCARTES_FETAL_EYE_STROMAL_CELLS | 3.79e-14 | 44.55 | 19.83 | 2.31e-12 | 2.54e-11 | 11SFRP2, OMD, MFAP5, DCN, MGP, IGFBP6, OGN, PODN, ASPN, TWIST2, PDGFRL |
90 |
| DESCARTES_FETAL_THYMUS_STROMAL_CELLS | 1.00e-16 | 39.48 | 19.17 | 8.43e-15 | 6.74e-14 | 14SFRP2, MFAP5, DCN, MGP, CCDC80, FBLN1, GAS1, OGN, ASPN, C3, MFGE8, MFAP4, SERPING1, IGF2 |
137 |
| DURANTE_ADULT_OLFACTORY_NEUROEPITHELIUM_FIBROBLASTS_STROMAL_CELLS | 6.29e-13 | 43.32 | 18.60 | 3.52e-11 | 4.22e-10 | 10SFRP2, DCN, MGP, IGFBP6, FBLN1, GSN, CCDC3, MFAP4, SERPING1, INMT |
82 |
| RUBENSTEIN_SKELETAL_MUSCLE_FBN1_FAP_CELLS | 4.55e-22 | 33.81 | 18.05 | 1.02e-19 | 3.06e-19 | 21MFAP5, DCN, MGP, CCDC80, IGFBP6, FBLN1, CFD, GAS1, MGST1, PROCR, C3, GSN, PDGFRL, ABI3BP, CLU, MFAP4, SERPING1, TNXB, F10, EFEMP1, CYBRD1 |
289 |
| CUI_DEVELOPING_HEART_SMOOTH_MUSCLE_CELL | 6.52e-10 | 49.49 | 17.75 | 2.31e-08 | 4.38e-07 | 7SFRP2, MFAP5, CCDC80, FBLN1, ANGPTL1, PDGFRL, F10 |
48 |
| DESCARTES_FETAL_ADRENAL_STROMAL_CELLS | 4.78e-16 | 34.95 | 17.02 | 3.21e-14 | 3.21e-13 | 14SFRP2, RSPO3, DCN, MGP, CCDC80, IGFBP6, C7, OGN, PODN, ASPN, TWIST2, PDGFRL, ABI3BP, PRELP |
153 |
| AIZARANI_LIVER_C21_STELLATE_CELLS_1 | 4.48e-16 | 29.91 | 14.90 | 3.21e-14 | 3.00e-13 | 15DCN, MGP, CCDC80, FBLN1, C7, GSN, EMP1, PRELP, CCDC3, MFAP4, SOD3, INMT, EFEMP1, CRISPLD2, CYBRD1 |
194 |
| DESCARTES_FETAL_HEART_STROMAL_CELLS | 2.06e-07 | 47.76 | 13.82 | 5.76e-06 | 1.38e-04 | 5MFAP5, DCN, FBLN1, ANGPTL1, PRELP |
34 |
| HAY_BONE_MARROW_STROMAL | 6.25e-21 | 19.90 | 10.94 | 1.05e-18 | 4.20e-18 | 27RSPO3, DCN, MGP, CCDC80, IGFBP6, BOC, FBLN1, CFD, GAS1, C7, PODN, NNMT, FIBIN, GSN, TWIST2, PDGFRL, EMP1, ABI3BP, PRELP, CXCL14, SERPING1, SOD3, IGF2, EFEMP1, KRT222, CYBRD1, THSD4 |
765 |
| CUI_DEVELOPING_HEART_C3_FIBROBLAST_LIKE_CELL | 6.54e-10 | 25.38 | 10.58 | 2.31e-08 | 4.39e-07 | 9DCN, MGP, FBLN1, C7, OGN, ASPN, MFAP4, SERPING1, CYBRD1 |
117 |
| DESCARTES_FETAL_SPLEEN_MESOTHELIAL_CELLS | 8.57e-12 | 21.58 | 10.09 | 4.11e-10 | 5.75e-09 | 12SFRP2, OMD, RSPO3, MGP, GAS1, OGN, PROCR, F3, PDGFRL, INMT, EFEMP1, AOX1 |
195 |
| CUI_DEVELOPING_HEART_COMPACT_VENTRICULAR_CARDIOMYOCYTE | 1.97e-07 | 28.86 | 9.68 | 5.74e-06 | 1.32e-04 | 6DCN, MGP, C7, OGN, ASPN, CXCL14 |
65 |
| CUI_DEVELOPING_HEART_C6_EPICARDIAL_CELL | 1.80e-10 | 19.16 | 8.71 | 7.11e-09 | 1.21e-07 | 11CCDC80, MGST1, NNMT, PROCR, C3, PDGFRL, SERPING1, INMT, EFEMP1, AOX1, CYBRD1 |
195 |
| DESCARTES_FETAL_STOMACH_MESOTHELIAL_CELLS | 1.18e-05 | 33.91 | 8.38 | 2.51e-04 | 7.93e-03 | 4RSPO3, GAS1, C3, AOX1 |
36 |
Dowload full table
mSigDB Hallmark Gene Sets:
| P-value | OR | Lower 95% CI | FDR | FWER | Genes Found | Gene Set Size | |
|---|---|---|---|---|---|---|---|
| HALLMARK_COAGULATION | 1.05e-06 | 15.53 | 5.78 | 2.61e-05 | 5.23e-05 | 7CFD, F3, C3, GSN, CLU, SERPING1, F10 |
138 |
| HALLMARK_EPITHELIAL_MESENCHYMAL_TRANSITION | 9.73e-07 | 12.40 | 4.96 | 2.61e-05 | 4.87e-05 | 8MFAP5, DCN, MGP, FBLN1, SFRP4, GAS1, NNMT, ABI3BP |
200 |
| HALLMARK_APOPTOSIS | 4.10e-04 | 8.90 | 2.72 | 6.83e-03 | 2.05e-02 | 5DCN, IGFBP6, GSN, EMP1, CLU |
161 |
| HALLMARK_MYOGENESIS | 1.08e-03 | 7.12 | 2.18 | 1.08e-02 | 5.40e-02 | 5TNNC1, CFD, GSN, CLU, SOD3 |
200 |
| HALLMARK_COMPLEMENT | 1.08e-03 | 7.12 | 2.18 | 1.08e-02 | 5.40e-02 | 5F3, C3, CLU, SERPING1, F10 |
200 |
| HALLMARK_XENOBIOTIC_METABOLISM | 4.35e-02 | 4.05 | 0.80 | 3.63e-01 | 1.00e+00 | 3FBLN1, F10, AOX1 |
200 |
| HALLMARK_UV_RESPONSE_DN | 1.10e-01 | 3.67 | 0.43 | 7.11e-01 | 1.00e+00 | 2F3, EFEMP1 |
144 |
| HALLMARK_HYPOXIA | 1.85e-01 | 2.63 | 0.31 | 7.11e-01 | 1.00e+00 | 2DCN, F3 |
200 |
| HALLMARK_ADIPOGENESIS | 1.85e-01 | 2.63 | 0.31 | 7.11e-01 | 1.00e+00 | 2OMD, C3 |
200 |
| HALLMARK_ESTROGEN_RESPONSE_LATE | 1.85e-01 | 2.63 | 0.31 | 7.11e-01 | 1.00e+00 | 2TNNC1, CXCL14 |
200 |
| HALLMARK_KRAS_SIGNALING_UP | 1.85e-01 | 2.63 | 0.31 | 7.11e-01 | 1.00e+00 | 2EMP1, IGF2 |
200 |
| HALLMARK_APICAL_SURFACE | 1.61e-01 | 5.93 | 0.14 | 7.11e-01 | 1.00e+00 | 1GAS1 |
44 |
| HALLMARK_REACTIVE_OXYGEN_SPECIES_PATHWAY | 1.77e-01 | 5.31 | 0.13 | 7.11e-01 | 1.00e+00 | 1MGST1 |
49 |
| HALLMARK_CHOLESTEROL_HOMEOSTASIS | 2.55e-01 | 3.49 | 0.09 | 9.11e-01 | 1.00e+00 | 1CLU |
74 |
| HALLMARK_INTERFERON_ALPHA_RESPONSE | 3.20e-01 | 2.66 | 0.07 | 1.00e+00 | 1.00e+00 | 1PROCR |
97 |
| HALLMARK_FATTY_ACID_METABOLISM | 4.66e-01 | 1.62 | 0.04 | 1.00e+00 | 1.00e+00 | 1INMT |
158 |
| HALLMARK_MITOTIC_SPINDLE | 5.45e-01 | 1.29 | 0.03 | 1.00e+00 | 1.00e+00 | 1GSN |
199 |
| HALLMARK_IL2_STAT5_SIGNALING | 5.45e-01 | 1.29 | 0.03 | 1.00e+00 | 1.00e+00 | 1EMP1 |
199 |
| HALLMARK_TNFA_SIGNALING_VIA_NFKB | 5.47e-01 | 1.28 | 0.03 | 1.00e+00 | 1.00e+00 | 1F3 |
200 |
| HALLMARK_ESTROGEN_RESPONSE_EARLY | 5.47e-01 | 1.28 | 0.03 | 1.00e+00 | 1.00e+00 | 1THSD4 |
200 |
Dowload full table
KEGG Pathways:
| P-value | OR | Lower 95% CI | FDR | FWER | Genes Found | Gene Set Size | |
|---|---|---|---|---|---|---|---|
| KEGG_COMPLEMENT_AND_COAGULATION_CASCADES | 2.82e-07 | 27.03 | 9.08 | 5.24e-05 | 5.24e-05 | 6CFD, C7, F3, C3, SERPING1, F10 |
69 |
| KEGG_NICOTINATE_AND_NICOTINAMIDE_METABOLISM | 4.05e-03 | 23.65 | 2.62 | 3.76e-01 | 7.52e-01 | 2NNMT, AOX1 |
24 |
| KEGG_TRYPTOPHAN_METABOLISM | 1.10e-02 | 13.70 | 1.56 | 6.79e-01 | 1.00e+00 | 2INMT, AOX1 |
40 |
| KEGG_DRUG_METABOLISM_CYTOCHROME_P450 | 3.30e-02 | 7.44 | 0.86 | 1.00e+00 | 1.00e+00 | 2MGST1, AOX1 |
72 |
| KEGG_SYSTEMIC_LUPUS_ERYTHEMATOSUS | 1.04e-01 | 3.80 | 0.44 | 1.00e+00 | 1.00e+00 | 2C7, C3 |
139 |
| KEGG_WNT_SIGNALING_PATHWAY | 1.19e-01 | 3.50 | 0.41 | 1.00e+00 | 1.00e+00 | 2SFRP2, SFRP4 |
151 |
| KEGG_PRION_DISEASES | 1.30e-01 | 7.50 | 0.18 | 1.00e+00 | 1.00e+00 | 1C7 |
35 |
| KEGG_TYROSINE_METABOLISM | 1.54e-01 | 6.22 | 0.15 | 1.00e+00 | 1.00e+00 | 1AOX1 |
42 |
| KEGG_VALINE_LEUCINE_AND_ISOLEUCINE_DEGRADATION | 1.61e-01 | 5.93 | 0.14 | 1.00e+00 | 1.00e+00 | 1AOX1 |
44 |
| KEGG_GLUTATHIONE_METABOLISM | 1.81e-01 | 5.21 | 0.13 | 1.00e+00 | 1.00e+00 | 1MGST1 |
50 |
| KEGG_HEDGEHOG_SIGNALING_PATHWAY | 2.00e-01 | 4.64 | 0.11 | 1.00e+00 | 1.00e+00 | 1GAS1 |
56 |
| KEGG_METABOLISM_OF_XENOBIOTICS_BY_CYTOCHROME_P450 | 2.43e-01 | 3.70 | 0.09 | 1.00e+00 | 1.00e+00 | 1MGST1 |
70 |
| KEGG_LEISHMANIA_INFECTION | 2.49e-01 | 3.59 | 0.09 | 1.00e+00 | 1.00e+00 | 1C3 |
72 |
| KEGG_CARDIAC_MUSCLE_CONTRACTION | 2.70e-01 | 3.27 | 0.08 | 1.00e+00 | 1.00e+00 | 1TNNC1 |
79 |
| KEGG_HYPERTROPHIC_CARDIOMYOPATHY_HCM | 2.81e-01 | 3.11 | 0.08 | 1.00e+00 | 1.00e+00 | 1TNNC1 |
83 |
| KEGG_ECM_RECEPTOR_INTERACTION | 2.84e-01 | 3.07 | 0.08 | 1.00e+00 | 1.00e+00 | 1TNXB |
84 |
| KEGG_TGF_BETA_SIGNALING_PATHWAY | 2.90e-01 | 3.00 | 0.07 | 1.00e+00 | 1.00e+00 | 1DCN |
86 |
| KEGG_DILATED_CARDIOMYOPATHY | 3.01e-01 | 2.87 | 0.07 | 1.00e+00 | 1.00e+00 | 1TNNC1 |
90 |
| KEGG_FC_GAMMA_R_MEDIATED_PHAGOCYTOSIS | 3.17e-01 | 2.68 | 0.07 | 1.00e+00 | 1.00e+00 | 1GSN |
96 |
| KEGG_CALCIUM_SIGNALING_PATHWAY | 5.06e-01 | 1.44 | 0.04 | 1.00e+00 | 1.00e+00 | 1TNNC1 |
178 |
Dowload full table
CHR Positional Gene Sets:
| P-value | OR | Lower 95% CI | FDR | FWER | Genes Found | Gene Set Size | |
|---|---|---|---|---|---|---|---|
| chr9q22 | 3.59e-02 | 4.38 | 0.86 | 1.00e+00 | 1.00e+00 | 3OMD, OGN, ASPN |
185 |
| chr12p12 | 6.67e-02 | 4.96 | 0.58 | 1.00e+00 | 1.00e+00 | 2MGP, MGST1 |
107 |
| chr7p14 | 1.35e-01 | 3.23 | 0.38 | 1.00e+00 | 1.00e+00 | 2SFRP4, INMT |
163 |
| chr3q13 | 1.67e-01 | 2.82 | 0.33 | 1.00e+00 | 1.00e+00 | 2CCDC80, BOC |
187 |
| chr12p13 | 3.72e-01 | 1.57 | 0.18 | 1.00e+00 | 1.00e+00 | 2MFAP5, EMP1 |
333 |
| chr8p22 | 1.64e-01 | 5.80 | 0.14 | 1.00e+00 | 1.00e+00 | 1PDGFRL |
45 |
| chr3q12 | 1.67e-01 | 5.67 | 0.14 | 1.00e+00 | 1.00e+00 | 1ABI3BP |
46 |
| chr11p14 | 2.00e-01 | 4.64 | 0.11 | 1.00e+00 | 1.00e+00 | 1FIBIN |
56 |
| chr10p13 | 2.25e-01 | 4.05 | 0.10 | 1.00e+00 | 1.00e+00 | 1CCDC3 |
64 |
| chr15q23 | 2.28e-01 | 3.99 | 0.10 | 1.00e+00 | 1.00e+00 | 1THSD4 |
65 |
| chr13q13 | 2.67e-01 | 3.31 | 0.08 | 1.00e+00 | 1.00e+00 | 1SERTM1 |
78 |
| chr19p13 | 1.00e+00 | 0.68 | 0.08 | 1.00e+00 | 1.00e+00 | 2CFD, C3 |
773 |
| chr1p21 | 3.25e-01 | 2.60 | 0.06 | 1.00e+00 | 1.00e+00 | 1F3 |
99 |
| chr2p16 | 3.64e-01 | 2.26 | 0.06 | 1.00e+00 | 1.00e+00 | 1EFEMP1 |
114 |
| chr3q22 | 3.72e-01 | 2.20 | 0.05 | 1.00e+00 | 1.00e+00 | 1ACKR4 |
117 |
| chr6q22 | 3.77e-01 | 2.16 | 0.05 | 1.00e+00 | 1.00e+00 | 1RSPO3 |
119 |
| chr4p15 | 3.84e-01 | 2.11 | 0.05 | 1.00e+00 | 1.00e+00 | 1SOD3 |
122 |
| chr12q21 | 3.99e-01 | 2.01 | 0.05 | 1.00e+00 | 1.00e+00 | 1DCN |
128 |
| chr5p13 | 3.99e-01 | 2.01 | 0.05 | 1.00e+00 | 1.00e+00 | 1C7 |
128 |
| chr8p21 | 3.99e-01 | 2.01 | 0.05 | 1.00e+00 | 1.00e+00 | 1CLU |
128 |
Dowload full table
Transcription Factor Targets:
| P-value | OR | Lower 95% CI | FDR | FWER | Genes Found | Gene Set Size | |
|---|---|---|---|---|---|---|---|
| TGGAAA_NFAT_Q4_01 | 2.42e-03 | 2.79 | 1.42 | 2.74e-01 | 1.00e+00 | 15OMD, DCN, MGP, CCDC80, SFRP4, PODN, ASPN, ANGPTL1, FIBIN, GSN, EMP1, PRELP, CCDC3, TNXB, ACKR4 |
1934 |
| MZF1_01 | 1.42e-02 | 4.61 | 1.19 | 4.73e-01 | 1.00e+00 | 4DCN, PRELP, CXCL14, SOD3 |
240 |
| COUP_DR1_Q6 | 1.71e-02 | 4.35 | 1.13 | 4.94e-01 | 1.00e+00 | 4FBLN1, ABI3BP, CXCL14, EFEMP1 |
254 |
| HNF4_01_B | 1.77e-02 | 4.30 | 1.11 | 4.94e-01 | 1.00e+00 | 4TNNC1, FBLN1, F10, EFEMP1 |
257 |
| CP2_01 | 1.84e-02 | 4.25 | 1.10 | 4.94e-01 | 1.00e+00 | 4IGFBP6, PRELP, TNXB, SOD3 |
260 |
| AP1_Q2 | 1.96e-02 | 4.16 | 1.08 | 4.94e-01 | 1.00e+00 | 4DCN, IGFBP6, GSN, MFGE8 |
265 |
| GGGTGGRR_PAX4_03 | 2.39e-02 | 2.41 | 1.07 | 5.43e-01 | 1.00e+00 | 10TNNC1, DCN, IGFBP6, PODN, PROCR, FIBIN, ABI3BP, PRELP, TNXB, IGF2 |
1310 |
| TGCCAAR_NF1_Q6 | 1.84e-02 | 2.83 | 1.07 | 4.94e-01 | 1.00e+00 | 7SFRP2, OMD, IGFBP6, OGN, PODN, PRELP, CXCL14 |
727 |
| YNTTTNNNANGCARM_UNKNOWN | 3.30e-02 | 7.44 | 0.86 | 6.23e-01 | 1.00e+00 | 2SFRP2, KRT222 |
72 |
| TGANTCA_AP1_C | 6.57e-02 | 2.11 | 0.85 | 8.13e-01 | 1.00e+00 | 8OMD, IGFBP6, PODN, PROCR, F3, EMP1, CXCL14, TNXB |
1139 |
| TGASTMAGC_NFE2_01 | 4.09e-02 | 4.16 | 0.82 | 7.22e-01 | 1.00e+00 | 3PROCR, ABI3BP, TNXB |
195 |
| HFH3_01 | 4.14e-02 | 4.13 | 0.82 | 7.22e-01 | 1.00e+00 | 3OMD, TWIST2, INMT |
196 |
| TGTTTGY_HNF3_Q6 | 6.03e-02 | 2.30 | 0.80 | 7.94e-01 | 1.00e+00 | 6OMD, MGP, ASPN, MGST1, ANGPTL1, PRELP |
748 |
| ZNF514_TARGET_GENES | 3.14e-02 | 36.29 | 0.79 | 6.10e-01 | 1.00e+00 | 1GSN |
8 |
| WGTTNNNNNAAA_UNKNOWN | 5.91e-02 | 2.53 | 0.78 | 7.87e-01 | 1.00e+00 | 5DCN, MGP, IGFBP6, OGN, INMT |
554 |
| YNGTTNNNATT_UNKNOWN | 5.70e-02 | 2.92 | 0.76 | 7.87e-01 | 1.00e+00 | 4SFRP2, OMD, EMP1, THSD4 |
376 |
| FOX_Q2 | 5.07e-02 | 3.80 | 0.75 | 7.51e-01 | 1.00e+00 | 3ANGPTL1, TWIST2, EFEMP1 |
213 |
| TEF1_Q6 | 5.90e-02 | 3.56 | 0.70 | 7.87e-01 | 1.00e+00 | 3MFAP5, NNMT, FIBIN |
227 |
| CTGYNNCTYTAA_UNKNOWN | 4.73e-02 | 6.05 | 0.70 | 7.51e-01 | 1.00e+00 | 2FIBIN, KRT222 |
88 |
| CCAWWNAAGG_SRF_Q4 | 4.73e-02 | 6.05 | 0.70 | 7.51e-01 | 1.00e+00 | 2TNNC1, PODN |
88 |
Dowload full table
GO Biological Processes:
| P-value | OR | Lower 95% CI | FDR | FWER | Genes Found | Gene Set Size | |
|---|---|---|---|---|---|---|---|
| GOBP_ELASTIC_FIBER_ASSEMBLY | 6.99e-06 | 112.93 | 18.36 | 2.61e-02 | 5.23e-02 | 3MFAP4, TNXB, THSD4 |
10 |
| GOBP_KERATAN_SULFATE_CATABOLIC_PROCESS | 1.27e-05 | 88.17 | 14.90 | 3.17e-02 | 9.52e-02 | 3OMD, OGN, PRELP |
12 |
| GOBP_KERATINOCYTE_APOPTOTIC_PROCESS | 2.31e-04 | 129.66 | 11.45 | 1.44e-01 | 1.00e+00 | 2SFRP4, GSN |
6 |
| GOBP_NEGATIVE_REGULATION_OF_NON_CANONICAL_WNT_SIGNALING_PATHWAY | 2.31e-04 | 129.66 | 11.45 | 1.44e-01 | 1.00e+00 | 2SFRP2, SFRP4 |
6 |
| GOBP_PROTEIN_ACTIVATION_CASCADE | 4.22e-06 | 45.22 | 10.96 | 2.61e-02 | 3.16e-02 | 4FBLN1, F3, SERPING1, F10 |
28 |
| GOBP_COMPLEMENT_ACTIVATION_ALTERNATIVE_PATHWAY | 4.64e-05 | 53.00 | 9.53 | 6.56e-02 | 3.47e-01 | 3CFD, C7, C3 |
18 |
| GOBP_REGULATION_OF_NON_CANONICAL_WNT_SIGNALING_PATHWAY | 1.28e-04 | 36.22 | 6.71 | 1.20e-01 | 9.57e-01 | 3SFRP2, RSPO3, SFRP4 |
25 |
| GOBP_KERATAN_SULFATE_BIOSYNTHETIC_PROCESS | 1.81e-04 | 31.85 | 5.95 | 1.35e-01 | 1.00e+00 | 3OMD, OGN, PRELP |
28 |
| GOBP_COMPLEMENT_ACTIVATION_LECTIN_PATHWAY | 9.99e-04 | 51.89 | 5.39 | 3.84e-01 | 1.00e+00 | 2MFAP4, SERPING1 |
12 |
| GOBP_SULFUR_COMPOUND_CATABOLIC_PROCESS | 6.91e-05 | 20.88 | 5.27 | 7.39e-02 | 5.17e-01 | 4OMD, DCN, OGN, PRELP |
56 |
| GOBP_KERATAN_SULFATE_METABOLIC_PROCESS | 2.96e-04 | 26.56 | 5.01 | 1.70e-01 | 1.00e+00 | 3OMD, OGN, PRELP |
33 |
| GOBP_AMINOGLYCAN_CATABOLIC_PROCESS | 1.47e-04 | 16.96 | 4.31 | 1.23e-01 | 1.00e+00 | 4OMD, DCN, OGN, PRELP |
68 |
| GOBP_REGULATION_OF_WNT_SIGNALING_PATHWAY_PLANAR_CELL_POLARITY_PATHWAY | 1.58e-03 | 39.95 | 4.27 | 5.19e-01 | 1.00e+00 | 2SFRP2, RSPO3 |
15 |
| GOBP_EXTRACELLULAR_MATRIX_ASSEMBLY | 7.43e-04 | 18.98 | 3.64 | 3.71e-01 | 1.00e+00 | 3MFAP4, TNXB, THSD4 |
45 |
| GOBP_COMPLEMENT_ACTIVATION | 5.26e-05 | 10.32 | 3.55 | 6.56e-02 | 3.94e-01 | 6CFD, C7, C3, CLU, MFAP4, SERPING1 |
171 |
| GOBP_POSITIVE_REGULATION_OF_RECEPTOR_MEDIATED_ENDOCYTOSIS | 1.01e-03 | 16.95 | 3.26 | 3.84e-01 | 1.00e+00 | 3SFRP4, C3, CLU |
50 |
| GOBP_EXTERNAL_ENCAPSULATING_STRUCTURE_ORGANIZATION | 1.77e-05 | 7.09 | 3.01 | 3.30e-02 | 1.32e-01 | 9SFRP2, MFAP5, DCN, CCDC80, FBLN1, MFAP4, TNXB, CRISPLD2, THSD4 |
396 |
| GOBP_EMBRYONIC_PLACENTA_MORPHOGENESIS | 4.05e-03 | 23.65 | 2.62 | 1.00e+00 | 1.00e+00 | 2RSPO3, IGF2 |
24 |
| GOBP_AMINOGLYCAN_BIOSYNTHETIC_PROCESS | 1.04e-03 | 9.88 | 2.54 | 3.84e-01 | 1.00e+00 | 4OMD, DCN, OGN, PRELP |
114 |
| GOBP_REGULATION_OF_COMPLEMENT_ACTIVATION | 1.04e-03 | 9.88 | 2.54 | 3.84e-01 | 1.00e+00 | 4C7, C3, CLU, SERPING1 |
114 |
Dowload full table
Immunological Gene Sets:
| P-value | OR | Lower 95% CI | FDR | FWER | Genes Found | Gene Set Size | |
|---|---|---|---|---|---|---|---|
| GSE5679_CTRL_VS_PPARG_LIGAND_ROSIGLITAZONE_AND_RARA_AGONIST_AM580_TREATED_DC_DN | 1.24e-04 | 8.78 | 3.02 | 6.03e-01 | 6.03e-01 | 6DCN, GAS1, EMP1, MFGE8, CXCL14, CLU |
200 |
| GSE37605_FOXP3_FUSION_GFP_VS_IRES_GFP_TREG_C57BL6_DN | 6.12e-04 | 8.12 | 2.49 | 7.51e-01 | 1.00e+00 | 5MGP, CCDC80, IGFBP6, GAS1, OGN |
176 |
| GSE41978_ID2_KO_AND_BIM_KO_VS_BIM_KO_KLRG1_LOW_EFFECTOR_CD8_TCELL_UP | 1.06e-03 | 7.16 | 2.19 | 7.51e-01 | 1.00e+00 | 5FBLN1, GAS1, MGST1, NNMT, INMT |
199 |
| GSE17721_4_VS_24H_CPG_BMDC_UP | 1.08e-03 | 7.12 | 2.18 | 7.51e-01 | 1.00e+00 | 5CCDC80, EMP1, ABI3BP, SOD3, F10 |
200 |
| GSE27786_NKTCELL_VS_ERYTHROBLAST_DN | 1.08e-03 | 7.12 | 2.18 | 7.51e-01 | 1.00e+00 | 5GAS1, TWIST2, CCDC3, MFAP4, ACKR4 |
200 |
| GSE9650_GP33_VS_GP276_LCMV_SPECIFIC_EXHAUSTED_CD8_TCELL_UP | 1.08e-03 | 7.12 | 2.18 | 7.51e-01 | 1.00e+00 | 5SFRP2, OGN, CXCL14, SERPING1, IGF2 |
200 |
| GSE2405_0H_VS_1.5H_A_PHAGOCYTOPHILUM_STIM_NEUTROPHIL_UP | 1.08e-03 | 7.12 | 2.18 | 7.51e-01 | 1.00e+00 | 5MGP, CCDC80, CFD, SFRP4, PRELP |
200 |
| GSE3720_LPS_VS_PMA_STIM_VD2_GAMMADELTA_TCELL_DN | 3.17e-03 | 7.20 | 1.86 | 1.00e+00 | 1.00e+00 | 4CCDC80, IGFBP6, GAS1, SOD3 |
155 |
| GSE24671_CTRL_VS_BAKIMULC_INFECTED_MOUSE_SPLENOCYTES_DN | 4.40e-03 | 6.55 | 1.69 | 1.00e+00 | 1.00e+00 | 4DCN, IGFBP6, C7, THSD4 |
170 |
| GSE6269_FLU_VS_STREP_PNEUMO_INF_PBMC_DN | 4.58e-03 | 6.47 | 1.67 | 1.00e+00 | 1.00e+00 | 4GSN, MFAP4, IGF2, CYBRD1 |
172 |
| GSE6269_HEALTHY_VS_STAPH_AUREUS_INF_PBMC_DN | 5.06e-03 | 6.28 | 1.62 | 1.00e+00 | 1.00e+00 | 4IGFBP6, GAS1, MFAP4, CYBRD1 |
177 |
| GSE6259_CD4_TCELL_VS_CD8_TCELL_UP | 6.12e-03 | 5.94 | 1.54 | 1.00e+00 | 1.00e+00 | 4IGFBP6, FBLN1, GAS1, OGN |
187 |
| GSE1112_HY_CD8AB_VS_HY_CD8AA_THYMOCYTE_RTOC_CULTURE_DN | 6.70e-03 | 5.78 | 1.50 | 1.00e+00 | 1.00e+00 | 4SFRP2, PROCR, C3, EMP1 |
192 |
| GSE24634_IL4_VS_CTRL_TREATED_NAIVE_CD4_TCELL_DAY10_DN | 7.58e-03 | 5.57 | 1.44 | 1.00e+00 | 1.00e+00 | 4IGFBP6, F3, C3, SERPING1 |
199 |
| GSE19888_ADENOSINE_A3R_INH_VS_ACT_IN_MAST_CELL_DN | 7.58e-03 | 5.57 | 1.44 | 1.00e+00 | 1.00e+00 | 4CFD, MGST1, GSN, F10 |
199 |
| GSE25088_WT_VS_STAT6_KO_MACROPHAGE_DN | 7.58e-03 | 5.57 | 1.44 | 1.00e+00 | 1.00e+00 | 4DCN, C7, SERPING1, EFEMP1 |
199 |
| GSE17721_LPS_VS_CPG_8H_BMDC_UP | 7.71e-03 | 5.55 | 1.44 | 1.00e+00 | 1.00e+00 | 4BOC, ABI3BP, TNXB, IGF2 |
200 |
| GSE17721_LPS_VS_CPG_16H_BMDC_DN | 7.71e-03 | 5.55 | 1.44 | 1.00e+00 | 1.00e+00 | 4OMD, CCDC80, FIBIN, MFGE8 |
200 |
| GSE20715_0H_VS_24H_OZONE_LUNG_DN | 7.71e-03 | 5.55 | 1.44 | 1.00e+00 | 1.00e+00 | 4MGP, C3, GSN, CXCL14 |
200 |
| GSE20715_0H_VS_6H_OZONE_TLR4_KO_LUNG_DN | 7.71e-03 | 5.55 | 1.44 | 1.00e+00 | 1.00e+00 | 4IGFBP6, GAS1, F3, INMT |
200 |
Top Ranked Transcription Factors for this Gene Expression Program:
| Gene Symbol | TF Rank | DNA Binding Domain | Motif Status | IUPAC PWM | GTEx | DepMap | Decartes |
|---|---|---|---|---|---|---|---|
| SFRP4 | 14 | No | Unlikely to be sequence specific TF | Not a DNA binding protein | No motif | None | None |
| TWIST2 | 28 | Yes | Known motif | Monomer or homomultimer | 100 perc ID - in vitro | None | None |
| CCDC3 | 35 | No | Unlikely to be sequence specific TF | Not a DNA binding protein | No motif | None | bZIP domain is truncated and lacks the DNA-contacting residues. |
| CLU | 36 | No | Unlikely to be sequence specific TF | Not a DNA binding protein | No motif | None | Included only because GO says positive regulation of NF-kappaB transcription factor activity, but there is no DBD and no evidence of DNA binding. |
| AEBP1 | 52 | Yes | Likely to be sequence specific TF | Monomer or homomultimer | No motif | None | This is a protease, but its ability to bind DNA is supported by both gel-shift (PMID: 15654748) and ChIP (PMID: 22723309). |
| HES1 | 54 | Yes | Known motif | Monomer or homomultimer | High-throughput in vitro | None | None |
| NFIA | 68 | Yes | Known motif | Monomer or homomultimer | High-throughput in vitro | None | None |
| CEBPB | 80 | Yes | Known motif | Monomer or homomultimer | High-throughput in vitro | None | None |
| KLF5 | 86 | Yes | Known motif | Monomer or homomultimer | High-throughput in vitro | None | Binds as a monomer and as a dimer (PMID: 25575120). |
| EMX2 | 90 | Yes | Known motif | Monomer or homomultimer | High-throughput in vitro | None | None |
| ID3 | 91 | No | Unlikely to be sequence specific TF | Not a DNA binding protein | No motif | None | ID bHLH proteins lack the basic region and should not be able to bind DNA. The HT-SELEX motif for ID4 is likely by a co-precipitated protein or it is a contamination |
| FHL2 | 93 | No | Unlikely to be sequence specific TF | Not a DNA binding protein | No motif | None | LIM ZF proteins are unlikely to bind DNA. Experimental evidence does not support a role for FHL2 as a sequence-specific DNA-binding protein (PMID:10654935) |
| MYC | 95 | Yes | Known motif | Obligate heteromer | In vivo/Misc source | None | Functions as a heterodimer with MAX. |
| FZD1 | 97 | No | Unlikely to be sequence specific TF | Not a DNA binding protein | No motif | None | None |
| ZFP36 | 103 | No | ssDNA/RNA binding | Not a DNA binding protein | No motif | None | RNA binding protein (PMID: 10330172). |
| NR4A1 | 104 | Yes | Known motif | Monomer or homomultimer | High-throughput in vitro | None | None |
| ID1 | 108 | No | Unlikely to be sequence specific TF | Not a DNA binding protein | No motif | None | ID bHLH proteins lack the basic region and should not be able to bind DNA. The HT-SELEX motif for ID4 is likely by a co-precipitated protein or it is a contamination |
| PRRX1 | 117 | Yes | Known motif | Monomer or homomultimer | High-throughput in vitro | None | None |
| AR | 129 | Yes | Known motif | Monomer or homomultimer | High-throughput in vitro | None | None |
| KLF8 | 132 | Yes | Known motif | Monomer or homomultimer | 100 perc ID - in vitro | None | None |
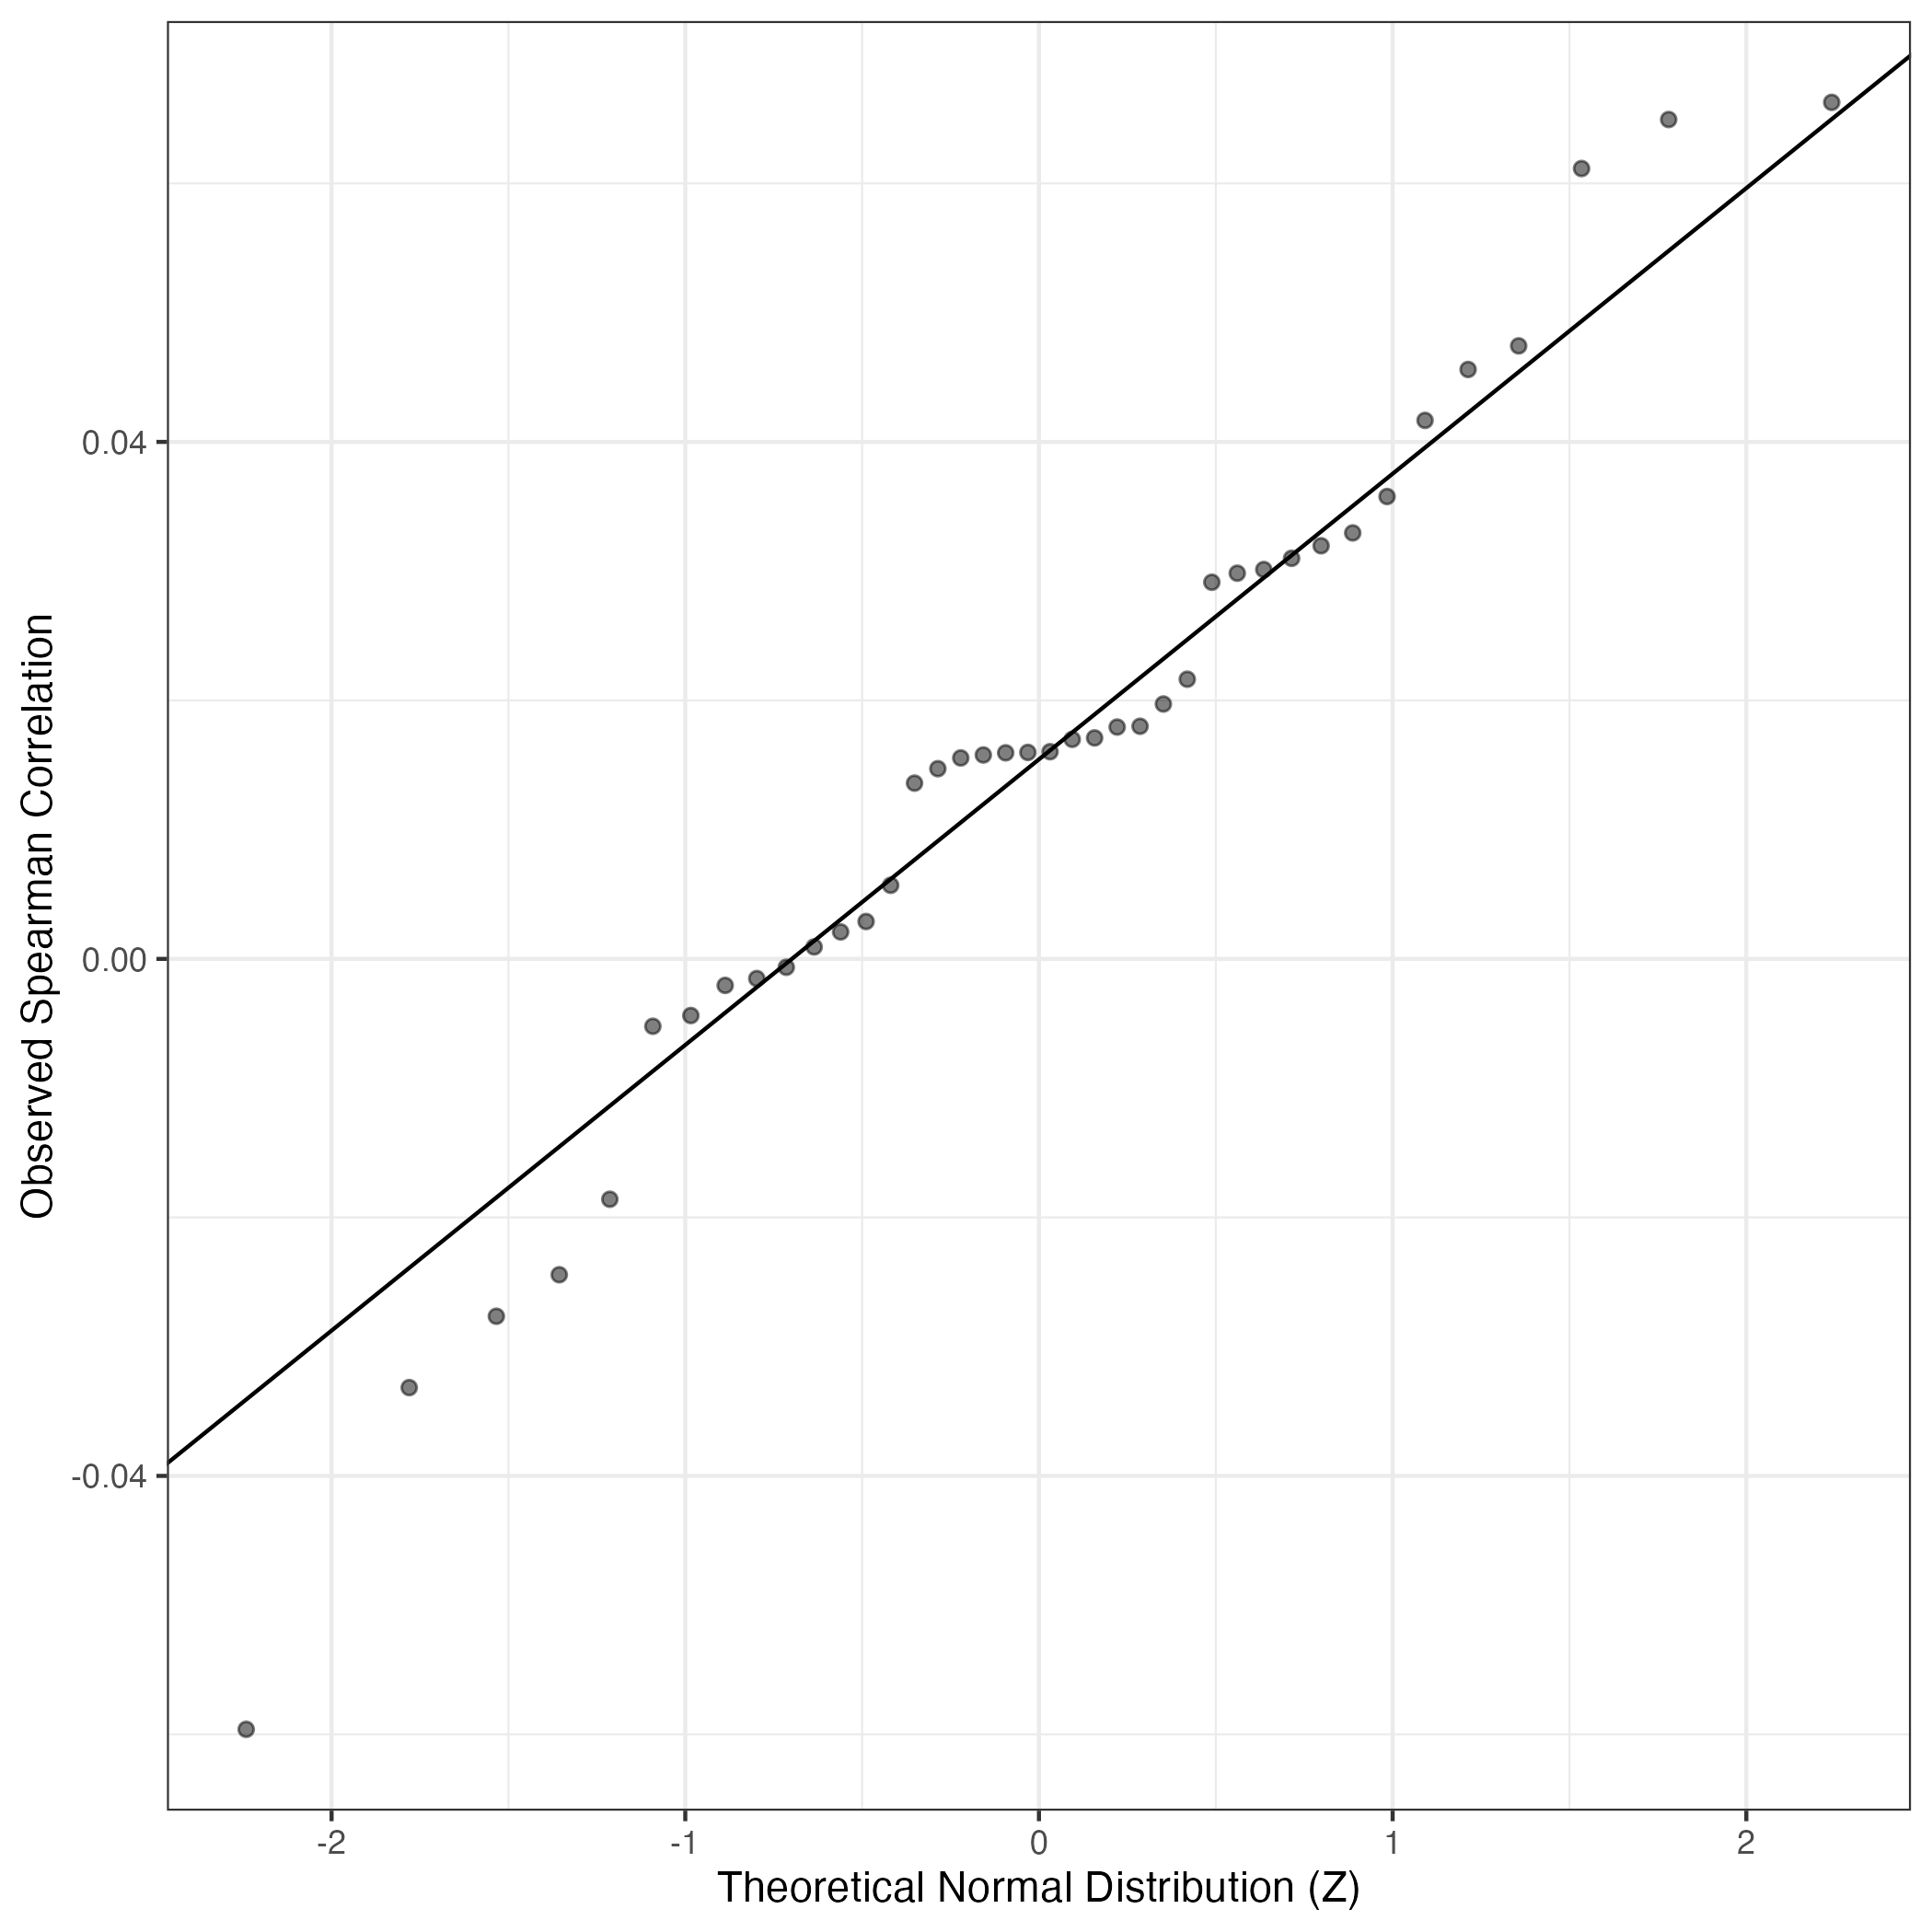
QQ Plot showing correlations with other GEPs in this dataset, calculated by Spearman correlation:
Interactive QQ-plot of gene loadings:
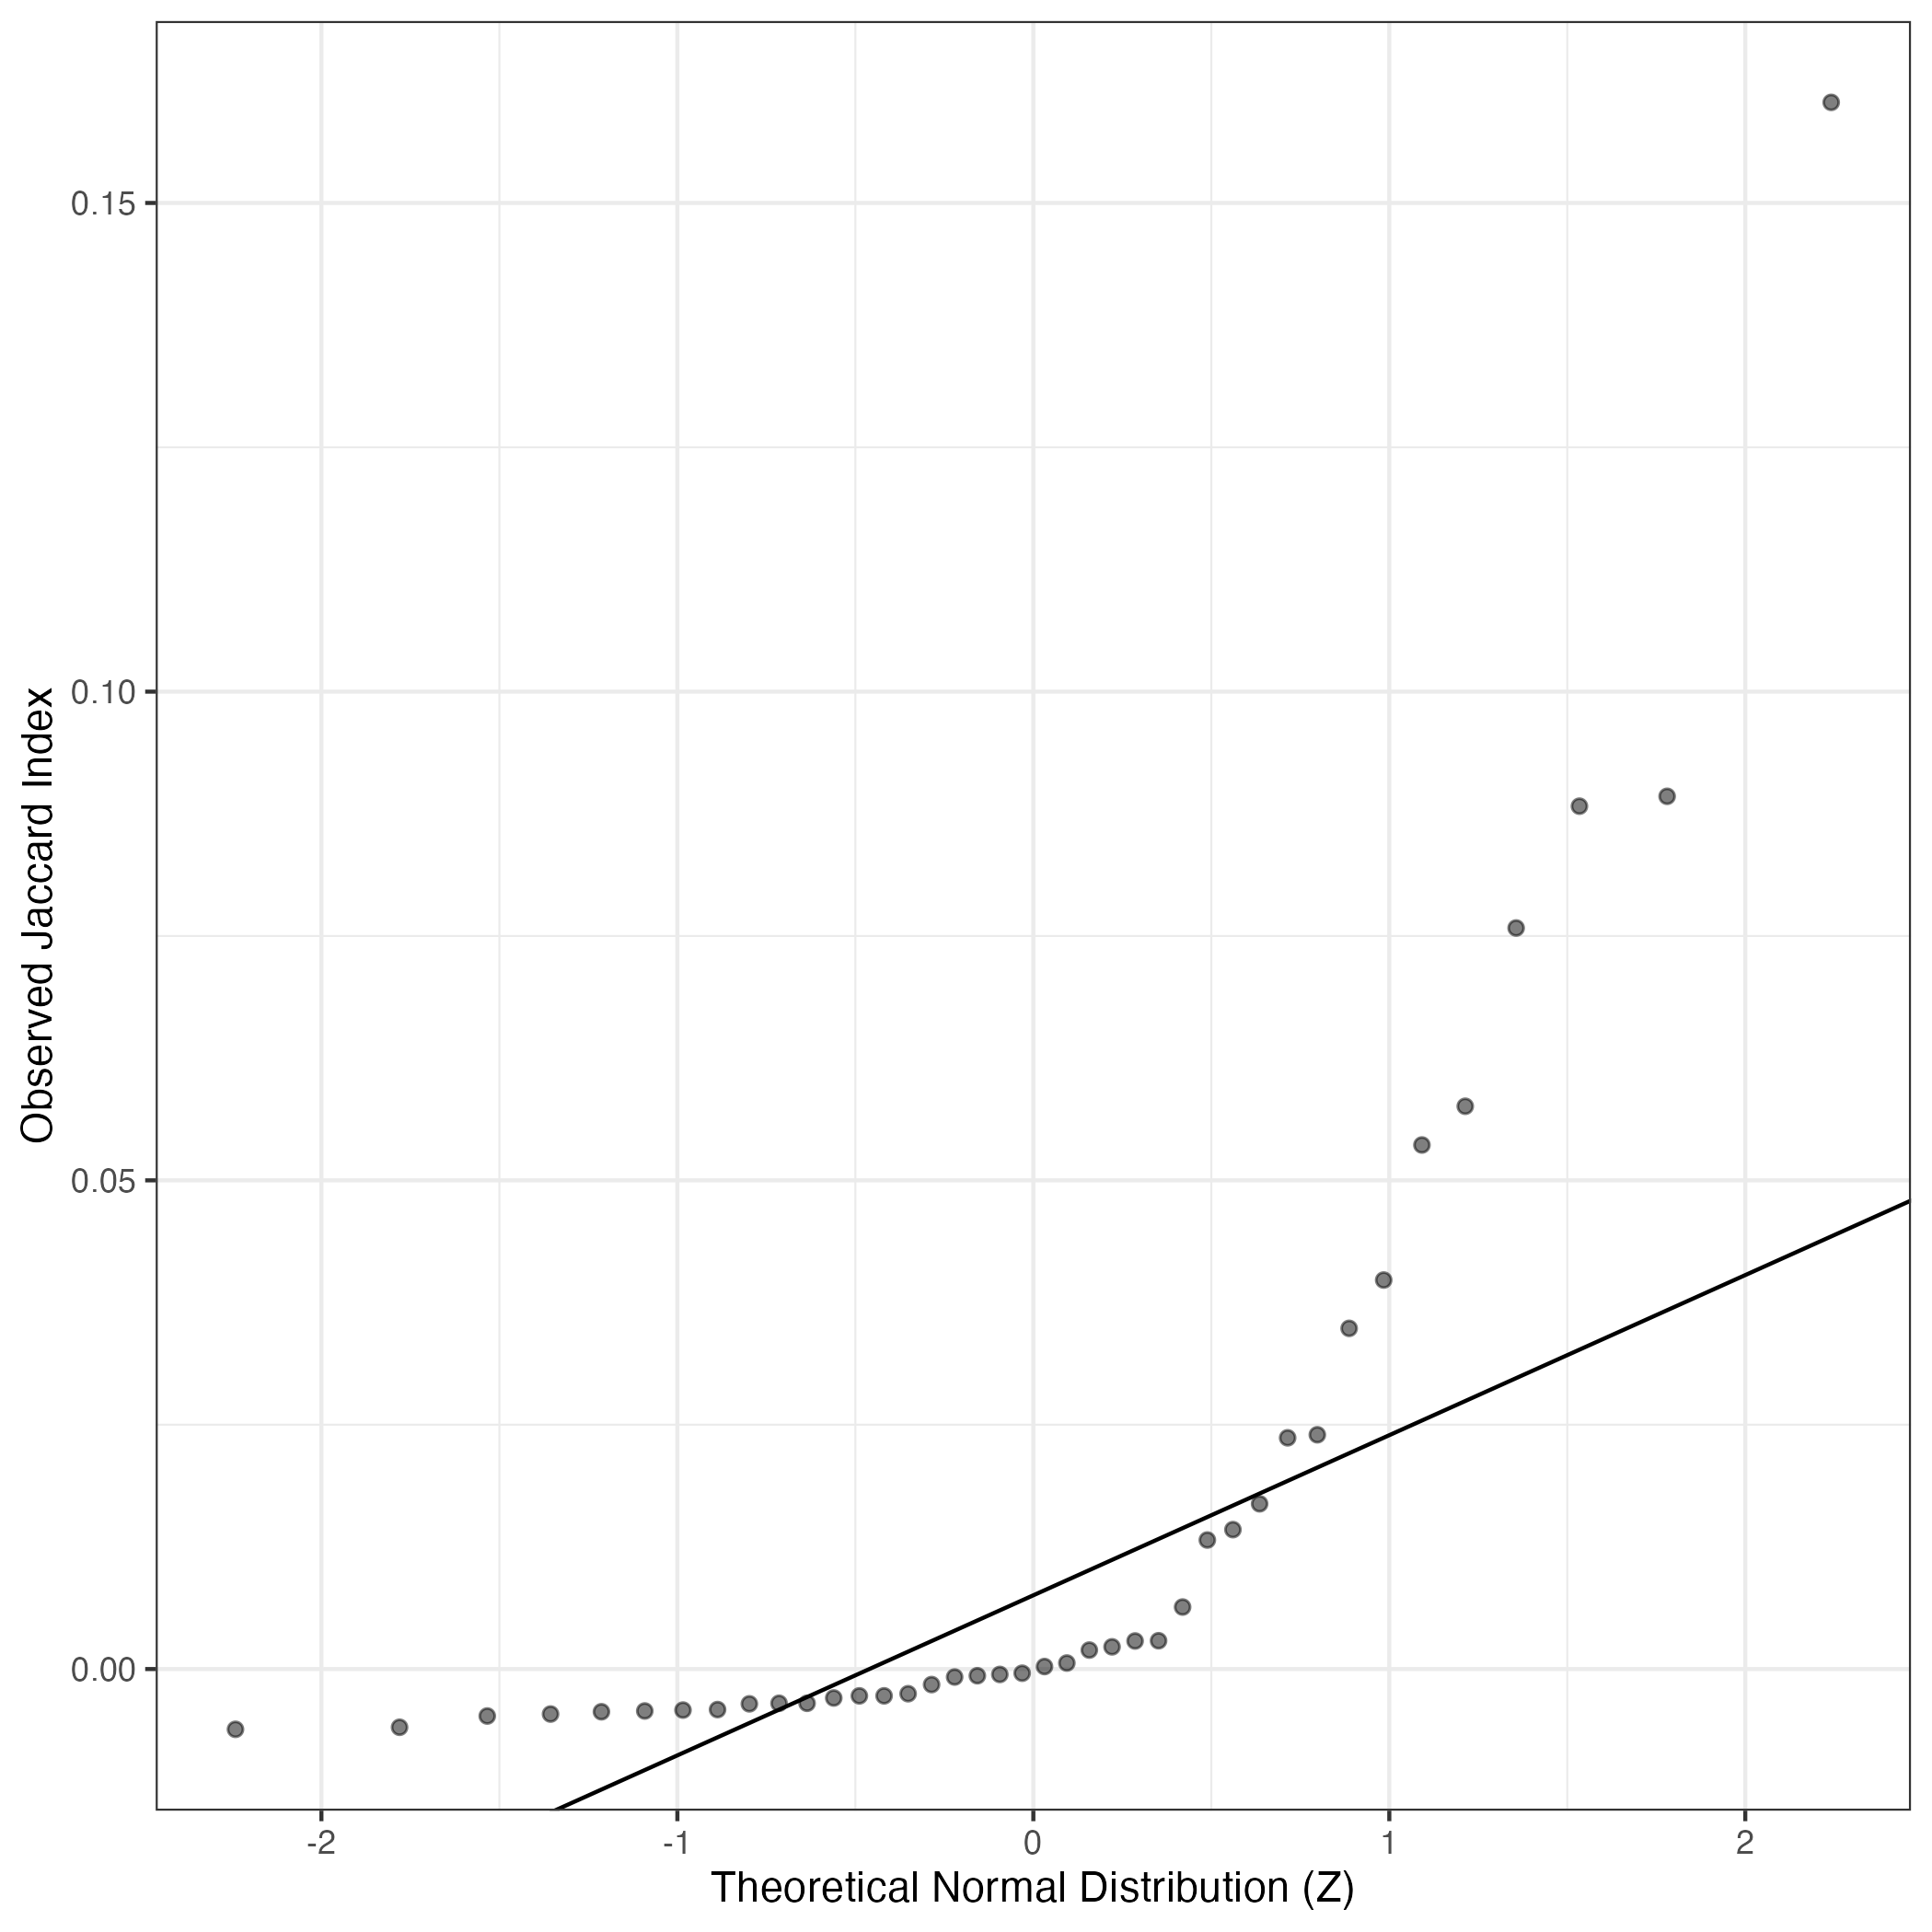
A similar QQ-plot as above, but only for instances where the H value is e.g. > 25, i.e. we are confident that the expression program is active above noise. Agreemenet between these binary vectors is tested using the Jaccard Index, with the P-values calculated by an exact test:
Interactive QQ-plot:
Singler cell type annotations for the top 50 cells on this program.
| Cell ID | Singler label | Singler Delta | Activity Score | Top Singler Raw Scores |
|---|---|---|---|---|
| T10_TCAACGACACAGGCCT.1 | Chondrocytes:MSC-derived | 0.14 | 1978.71 | Raw ScoresFibroblasts:breast: 0.39, Smooth_muscle_cells:bronchial: 0.39, Smooth_muscle_cells:bronchial:vit_D: 0.39, iPS_cells:adipose_stem_cells: 0.38, Osteoblasts: 0.38, Chondrocytes:MSC-derived: 0.38, Tissue_stem_cells:BM_MSC:TGFb3: 0.38, Smooth_muscle_cells:vascular: 0.38, Smooth_muscle_cells:vascular:IL-17: 0.38, Tissue_stem_cells:BM_MSC:BMP2: 0.37 |
| T10_GGGACCTGTAGAAGGA.1 | Chondrocytes:MSC-derived | 0.13 | 1165.37 | Raw ScoresFibroblasts:breast: 0.32, iPS_cells:adipose_stem_cells: 0.31, Chondrocytes:MSC-derived: 0.31, Osteoblasts: 0.3, Smooth_muscle_cells:bronchial: 0.3, Tissue_stem_cells:BM_MSC:TGFb3: 0.29, Smooth_muscle_cells:bronchial:vit_D: 0.29, Smooth_muscle_cells:vascular: 0.29, iPS_cells:CRL2097_foreskin: 0.29, Tissue_stem_cells:BM_MSC:BMP2: 0.28 |
| T10_GAGTCCGCAATGCCAT.1 | Fibroblasts:breast | 0.17 | 1072.59 | Raw ScoresFibroblasts:breast: 0.38, Smooth_muscle_cells:bronchial: 0.38, Osteoblasts: 0.38, Smooth_muscle_cells:bronchial:vit_D: 0.37, Chondrocytes:MSC-derived: 0.37, iPS_cells:adipose_stem_cells: 0.37, Smooth_muscle_cells:vascular: 0.36, Tissue_stem_cells:iliac_MSC: 0.36, Tissue_stem_cells:BM_MSC:BMP2: 0.36, Smooth_muscle_cells:vascular:IL-17: 0.36 |
| T10_CAGCTAAGTAATTGGA.1 | Smooth_muscle_cells:bronchial | 0.16 | 685.57 | Raw ScoresFibroblasts:breast: 0.33, Smooth_muscle_cells:bronchial:vit_D: 0.33, Smooth_muscle_cells:bronchial: 0.33, iPS_cells:adipose_stem_cells: 0.32, Osteoblasts: 0.31, Tissue_stem_cells:BM_MSC:TGFb3: 0.31, Tissue_stem_cells:BM_MSC:BMP2: 0.31, Chondrocytes:MSC-derived: 0.31, Smooth_muscle_cells:vascular: 0.31, Tissue_stem_cells:iliac_MSC: 0.3 |
| T10_TCTCATAAGAAAGTGG.1 | Fibroblasts:breast | 0.20 | 677.85 | Raw ScoresFibroblasts:breast: 0.41, Smooth_muscle_cells:bronchial: 0.4, Smooth_muscle_cells:bronchial:vit_D: 0.4, iPS_cells:adipose_stem_cells: 0.39, Osteoblasts: 0.39, Smooth_muscle_cells:vascular: 0.39, Smooth_muscle_cells:vascular:IL-17: 0.39, Tissue_stem_cells:BM_MSC:TGFb3: 0.38, Chondrocytes:MSC-derived: 0.38, Tissue_stem_cells:iliac_MSC: 0.38 |
| T10_CGTAGGCTCAGGATCT.1 | Fibroblasts:breast | 0.18 | 555.63 | Raw ScoresSmooth_muscle_cells:bronchial: 0.32, Smooth_muscle_cells:bronchial:vit_D: 0.31, Fibroblasts:breast: 0.31, iPS_cells:adipose_stem_cells: 0.3, Smooth_muscle_cells:vascular: 0.29, Osteoblasts: 0.29, Smooth_muscle_cells:vascular:IL-17: 0.29, Chondrocytes:MSC-derived: 0.29, Tissue_stem_cells:BM_MSC:TGFb3: 0.29, Tissue_stem_cells:BM_MSC:BMP2: 0.29 |
| T10_TTTGTCATCTAAGCCA.1 | Fibroblasts:breast | 0.13 | 445.20 | Raw ScoresFibroblasts:breast: 0.3, Smooth_muscle_cells:bronchial: 0.3, Smooth_muscle_cells:bronchial:vit_D: 0.29, Tissue_stem_cells:BM_MSC:TGFb3: 0.29, Tissue_stem_cells:BM_MSC:BMP2: 0.29, Osteoblasts: 0.29, iPS_cells:adipose_stem_cells: 0.29, Chondrocytes:MSC-derived: 0.29, Tissue_stem_cells:iliac_MSC: 0.28, Smooth_muscle_cells:vascular: 0.28 |
| T10_TCGGTAATCTCGTATT.1 | Smooth_muscle_cells:bronchial:vit_D | 0.16 | 444.32 | Raw ScoresSmooth_muscle_cells:bronchial:vit_D: 0.34, Smooth_muscle_cells:bronchial: 0.34, Fibroblasts:breast: 0.33, iPS_cells:adipose_stem_cells: 0.32, Tissue_stem_cells:BM_MSC:BMP2: 0.32, Tissue_stem_cells:BM_MSC:TGFb3: 0.32, Osteoblasts: 0.32, Chondrocytes:MSC-derived: 0.32, Tissue_stem_cells:iliac_MSC: 0.31, iPS_cells:CRL2097_foreskin: 0.31 |
| T10_GCTTCCAAGTCCTCCT.1 | Tissue_stem_cells:BM_MSC:TGFb3 | 0.15 | 418.47 | Raw ScoresFibroblasts:breast: 0.33, Smooth_muscle_cells:bronchial: 0.33, Smooth_muscle_cells:bronchial:vit_D: 0.32, Tissue_stem_cells:BM_MSC:TGFb3: 0.32, iPS_cells:adipose_stem_cells: 0.32, Tissue_stem_cells:BM_MSC:BMP2: 0.31, Chondrocytes:MSC-derived: 0.31, Osteoblasts: 0.31, Smooth_muscle_cells:vascular: 0.31, Tissue_stem_cells:iliac_MSC: 0.3 |
| T10_ATCACGAGTTAAGGGC.1 | Fibroblasts:breast | 0.16 | 393.56 | Raw ScoresSmooth_muscle_cells:bronchial:vit_D: 0.33, Smooth_muscle_cells:bronchial: 0.33, Fibroblasts:breast: 0.33, Smooth_muscle_cells:vascular: 0.31, iPS_cells:adipose_stem_cells: 0.31, Smooth_muscle_cells:vascular:IL-17: 0.31, Osteoblasts: 0.31, Tissue_stem_cells:BM_MSC:TGFb3: 0.31, Chondrocytes:MSC-derived: 0.3, Tissue_stem_cells:BM_MSC:BMP2: 0.3 |
| T10_GTTCGGGTCAAGGTAA.1 | Fibroblasts:breast | 0.15 | 382.87 | Raw ScoresFibroblasts:breast: 0.31, Smooth_muscle_cells:bronchial: 0.31, Smooth_muscle_cells:bronchial:vit_D: 0.31, iPS_cells:adipose_stem_cells: 0.3, Tissue_stem_cells:BM_MSC:TGFb3: 0.3, Smooth_muscle_cells:vascular: 0.29, Smooth_muscle_cells:vascular:IL-17: 0.29, Tissue_stem_cells:BM_MSC:BMP2: 0.29, Osteoblasts: 0.29, Chondrocytes:MSC-derived: 0.29 |
| T69_TGCCCATGTCCAACTA.1 | iPS_cells:adipose_stem_cells | 0.14 | 271.39 | Raw ScoresFibroblasts:breast: 0.33, iPS_cells:adipose_stem_cells: 0.32, Smooth_muscle_cells:bronchial: 0.32, Smooth_muscle_cells:bronchial:vit_D: 0.32, Tissue_stem_cells:BM_MSC:TGFb3: 0.32, Osteoblasts: 0.32, Chondrocytes:MSC-derived: 0.31, Tissue_stem_cells:BM_MSC:BMP2: 0.31, iPS_cells:CRL2097_foreskin: 0.31, Tissue_stem_cells:iliac_MSC: 0.31 |
| T69_CTGCCTAAGTGTGGCA.1 | iPS_cells:adipose_stem_cells | 0.17 | 203.72 | Raw ScoresiPS_cells:adipose_stem_cells: 0.36, Fibroblasts:breast: 0.35, Chondrocytes:MSC-derived: 0.35, Tissue_stem_cells:BM_MSC:TGFb3: 0.34, Osteoblasts: 0.34, Smooth_muscle_cells:bronchial: 0.34, iPS_cells:CRL2097_foreskin: 0.34, Smooth_muscle_cells:bronchial:vit_D: 0.34, Tissue_stem_cells:BM_MSC: 0.34, Tissue_stem_cells:BM_MSC:BMP2: 0.34 |
| T188_TCACGCTTCCTACGGG-1 | DC:monocyte-derived:A._fumigatus_germ_tubes_6h | 0.19 | 196.45 | Raw ScoresDC:monocyte-derived:A._fumigatus_germ_tubes_6h: 0.44, Macrophage:monocyte-derived:M-CSF/IFNg/Pam3Cys: 0.43, DC:monocyte-derived:antiCD40/VAF347: 0.42, Macrophage:monocyte-derived:S._aureus: 0.42, Macrophage:monocyte-derived:M-CSF/Pam3Cys: 0.42, DC:monocyte-derived:Poly(IC): 0.42, DC:monocyte-derived:Schuler_treatment: 0.42, DC:monocyte-derived:LPS: 0.42, Macrophage:Alveolar:B._anthacis_spores: 0.41, DC:monocyte-derived:Galectin-1: 0.41 |
| T10_GACGTGCAGAGTTGGC.1 | Smooth_muscle_cells:bronchial:vit_D | 0.12 | 153.20 | Raw ScoresSmooth_muscle_cells:bronchial:vit_D: 0.27, Tissue_stem_cells:iliac_MSC: 0.27, Smooth_muscle_cells:bronchial: 0.27, Fibroblasts:breast: 0.27, Tissue_stem_cells:BM_MSC:TGFb3: 0.26, iPS_cells:adipose_stem_cells: 0.26, Tissue_stem_cells:BM_MSC:BMP2: 0.26, Osteoblasts: 0.26, Smooth_muscle_cells:vascular:IL-17: 0.26, Smooth_muscle_cells:vascular: 0.26 |
| T69_ATAAGAGTCACAATGC.1 | Fibroblasts:breast | 0.13 | 149.88 | Raw ScoresFibroblasts:breast: 0.31, Smooth_muscle_cells:bronchial: 0.3, Smooth_muscle_cells:bronchial:vit_D: 0.3, iPS_cells:adipose_stem_cells: 0.3, Tissue_stem_cells:BM_MSC:BMP2: 0.3, Tissue_stem_cells:BM_MSC:TGFb3: 0.3, Osteoblasts: 0.3, Tissue_stem_cells:iliac_MSC: 0.3, Smooth_muscle_cells:vascular:IL-17: 0.29, Smooth_muscle_cells:vascular: 0.29 |
| T230_ATCCGTCGTAACAGGC-1 | Endothelial_cells:HUVEC:Borrelia_burgdorferi | 0.18 | 135.19 | Raw ScoresEndothelial_cells:HUVEC:IFNg: 0.43, Endothelial_cells:HUVEC:Borrelia_burgdorferi: 0.42, Endothelial_cells:lymphatic:TNFa_48h: 0.42, Endothelial_cells:lymphatic: 0.42, Endothelial_cells:HUVEC:VEGF: 0.42, Endothelial_cells:HUVEC: 0.42, Endothelial_cells:HUVEC:Serum_Amyloid_A: 0.41, Endothelial_cells:HUVEC:H5N1-infected: 0.41, Endothelial_cells:HUVEC:FPV-infected: 0.41, Endothelial_cells:HUVEC:B._anthracis_LT: 0.41 |
| T230_TGTTGAGCAAATGATG-1 | Endothelial_cells:HUVEC:Borrelia_burgdorferi | 0.15 | 130.95 | Raw ScoresEndothelial_cells:lymphatic: 0.42, Endothelial_cells:lymphatic:TNFa_48h: 0.42, Endothelial_cells:HUVEC: 0.42, Endothelial_cells:HUVEC:VEGF: 0.42, Endothelial_cells:HUVEC:Serum_Amyloid_A: 0.42, Endothelial_cells:HUVEC:IFNg: 0.41, Endothelial_cells:HUVEC:B._anthracis_LT: 0.41, Endothelial_cells:HUVEC:H5N1-infected: 0.41, Endothelial_cells:HUVEC:PR8-infected: 0.41, Endothelial_cells:HUVEC:Borrelia_burgdorferi: 0.41 |
| T69_GCAAACTAGCCCAATT.1 | Fibroblasts:breast | 0.14 | 129.50 | Raw ScoresFibroblasts:breast: 0.29, Tissue_stem_cells:BM_MSC:TGFb3: 0.28, iPS_cells:adipose_stem_cells: 0.28, Osteoblasts: 0.28, Tissue_stem_cells:BM_MSC:BMP2: 0.28, Smooth_muscle_cells:bronchial: 0.27, Chondrocytes:MSC-derived: 0.27, Smooth_muscle_cells:bronchial:vit_D: 0.27, Tissue_stem_cells:iliac_MSC: 0.27, Smooth_muscle_cells:vascular: 0.27 |
| T19_CCTATTACAGACACTT.1 | Smooth_muscle_cells:bronchial | 0.09 | 129.44 | Raw ScoresSmooth_muscle_cells:bronchial: 0.29, iPS_cells:adipose_stem_cells: 0.29, Smooth_muscle_cells:bronchial:vit_D: 0.29, Osteoblasts: 0.28, Chondrocytes:MSC-derived: 0.28, Fibroblasts:breast: 0.28, Tissue_stem_cells:BM_MSC:BMP2: 0.28, Tissue_stem_cells:BM_MSC:TGFb3: 0.27, Tissue_stem_cells:iliac_MSC: 0.27, Fibroblasts:foreskin: 0.27 |
| T75_CCTTCCCCATGCTGGC.1 | Neurons:adrenal_medulla_cell_line | 0.12 | 126.23 | Raw ScoresFibroblasts:breast: 0.34, MSC: 0.34, Fibroblasts:foreskin: 0.33, iPS_cells:skin_fibroblast: 0.33, Neurons:Schwann_cell: 0.33, iPS_cells:CRL2097_foreskin: 0.33, iPS_cells:foreskin_fibrobasts: 0.32, iPS_cells:adipose_stem_cells: 0.32, Neurons:adrenal_medulla_cell_line: 0.32, iPS_cells:PDB_fibroblasts: 0.32 |
| T69_TTCTCAACACTAGTAC.1 | Smooth_muscle_cells:vascular | 0.11 | 103.72 | Raw ScoresFibroblasts:breast: 0.34, Smooth_muscle_cells:vascular:IL-17: 0.33, Smooth_muscle_cells:bronchial:vit_D: 0.33, Smooth_muscle_cells:vascular: 0.33, Smooth_muscle_cells:bronchial: 0.33, iPS_cells:adipose_stem_cells: 0.33, Tissue_stem_cells:BM_MSC:TGFb3: 0.32, Chondrocytes:MSC-derived: 0.32, Tissue_stem_cells:BM_MSC: 0.32, Tissue_stem_cells:BM_MSC:BMP2: 0.32 |
| T19_GCTTCCATCACGCATA.1 | Tissue_stem_cells:BM_MSC:TGFb3 | 0.12 | 100.46 | Raw ScoresTissue_stem_cells:BM_MSC:BMP2: 0.31, Osteoblasts: 0.31, Fibroblasts:breast: 0.31, iPS_cells:adipose_stem_cells: 0.3, Smooth_muscle_cells:bronchial: 0.3, Tissue_stem_cells:iliac_MSC: 0.3, Tissue_stem_cells:BM_MSC:TGFb3: 0.3, Smooth_muscle_cells:bronchial:vit_D: 0.3, Chondrocytes:MSC-derived: 0.3, Tissue_stem_cells:BM_MSC:osteogenic: 0.3 |
| T19_CGCTATCTCACTCCTG.1 | Neurons:Schwann_cell | 0.14 | 94.50 | Raw ScoresiPS_cells:adipose_stem_cells: 0.36, Tissue_stem_cells:BM_MSC:BMP2: 0.36, Tissue_stem_cells:BM_MSC:TGFb3: 0.36, Tissue_stem_cells:BM_MSC: 0.36, Osteoblasts: 0.36, Fibroblasts:breast: 0.35, Tissue_stem_cells:BM_MSC:osteogenic: 0.35, Smooth_muscle_cells:bronchial: 0.35, Tissue_stem_cells:iliac_MSC: 0.35, Chondrocytes:MSC-derived: 0.35 |
| T19_CTACCCATCACCGTAA.1 | Tissue_stem_cells:BM_MSC:TGFb3 | 0.15 | 92.29 | Raw ScoresFibroblasts:breast: 0.35, Osteoblasts: 0.35, Tissue_stem_cells:BM_MSC:TGFb3: 0.35, iPS_cells:adipose_stem_cells: 0.35, Tissue_stem_cells:BM_MSC:BMP2: 0.34, Tissue_stem_cells:iliac_MSC: 0.34, Smooth_muscle_cells:bronchial: 0.34, Tissue_stem_cells:BM_MSC: 0.34, Smooth_muscle_cells:bronchial:vit_D: 0.34, Chondrocytes:MSC-derived: 0.33 |
| T69_TATGCCCTCTCTTGAT.1 | Chondrocytes:MSC-derived | 0.11 | 92.06 | Raw ScoresFibroblasts:breast: 0.31, Chondrocytes:MSC-derived: 0.31, Tissue_stem_cells:BM_MSC:TGFb3: 0.31, Smooth_muscle_cells:vascular: 0.3, iPS_cells:adipose_stem_cells: 0.3, Tissue_stem_cells:BM_MSC:BMP2: 0.3, Smooth_muscle_cells:vascular:IL-17: 0.3, Tissue_stem_cells:BM_MSC: 0.3, Smooth_muscle_cells:bronchial: 0.3, Smooth_muscle_cells:bronchial:vit_D: 0.3 |
| T10_CTGAAACGTAGCGTAG.1 | Tissue_stem_cells:BM_MSC:TGFb3 | 0.11 | 89.51 | Raw ScoresTissue_stem_cells:BM_MSC: 0.3, Fibroblasts:breast: 0.3, iPS_cells:adipose_stem_cells: 0.3, Tissue_stem_cells:BM_MSC:TGFb3: 0.3, Tissue_stem_cells:BM_MSC:BMP2: 0.29, Osteoblasts: 0.29, Tissue_stem_cells:iliac_MSC: 0.29, Chondrocytes:MSC-derived: 0.29, Smooth_muscle_cells:vascular: 0.29, Fibroblasts:foreskin: 0.29 |
| T69_CAACCAAGTGTAATGA.1 | Smooth_muscle_cells:bronchial | 0.14 | 87.53 | Raw ScoresFibroblasts:breast: 0.33, iPS_cells:adipose_stem_cells: 0.33, Chondrocytes:MSC-derived: 0.33, Smooth_muscle_cells:vascular: 0.33, Smooth_muscle_cells:bronchial: 0.33, Smooth_muscle_cells:bronchial:vit_D: 0.33, Smooth_muscle_cells:vascular:IL-17: 0.33, Fibroblasts:foreskin: 0.32, Tissue_stem_cells:BM_MSC: 0.32, iPS_cells:CRL2097_foreskin: 0.32 |
| T19_CACACAAAGAGTCTGG.1 | Tissue_stem_cells:BM_MSC:TGFb3 | 0.14 | 84.74 | Raw ScoresSmooth_muscle_cells:bronchial: 0.38, Tissue_stem_cells:BM_MSC:BMP2: 0.37, Smooth_muscle_cells:bronchial:vit_D: 0.37, Tissue_stem_cells:BM_MSC:TGFb3: 0.37, iPS_cells:adipose_stem_cells: 0.37, Fibroblasts:breast: 0.37, Chondrocytes:MSC-derived: 0.36, Osteoblasts: 0.36, iPS_cells:CRL2097_foreskin: 0.36, Tissue_stem_cells:iliac_MSC: 0.36 |
| T19_TCTATTGGTGGCGAAT.1 | Fibroblasts:breast | 0.13 | 82.69 | Raw ScoresSmooth_muscle_cells:bronchial: 0.3, Smooth_muscle_cells:bronchial:vit_D: 0.3, Fibroblasts:breast: 0.29, Tissue_stem_cells:BM_MSC:BMP2: 0.29, iPS_cells:adipose_stem_cells: 0.29, Osteoblasts: 0.29, Chondrocytes:MSC-derived: 0.29, Tissue_stem_cells:BM_MSC:TGFb3: 0.29, Fibroblasts:foreskin: 0.28, Smooth_muscle_cells:vascular: 0.28 |
| T19_TGGGCGTAGCCAACAG.1 | Fibroblasts:foreskin | 0.10 | 80.91 | Raw ScoresSmooth_muscle_cells:bronchial: 0.33, Smooth_muscle_cells:bronchial:vit_D: 0.32, Fibroblasts:breast: 0.31, Tissue_stem_cells:BM_MSC:TGFb3: 0.31, Tissue_stem_cells:BM_MSC:BMP2: 0.31, Chondrocytes:MSC-derived: 0.31, iPS_cells:adipose_stem_cells: 0.31, Osteoblasts: 0.31, Tissue_stem_cells:iliac_MSC: 0.31, Smooth_muscle_cells:vascular: 0.3 |
| T19_TACCTATGTACAGTTC.1 | Chondrocytes:MSC-derived | 0.11 | 78.82 | Raw ScoresiPS_cells:adipose_stem_cells: 0.35, Fibroblasts:breast: 0.35, Smooth_muscle_cells:bronchial: 0.35, Osteoblasts: 0.35, Smooth_muscle_cells:bronchial:vit_D: 0.34, Chondrocytes:MSC-derived: 0.34, Tissue_stem_cells:BM_MSC:BMP2: 0.34, Tissue_stem_cells:BM_MSC:TGFb3: 0.34, Tissue_stem_cells:BM_MSC: 0.33, iPS_cells:CRL2097_foreskin: 0.33 |
| T69_CCTTACGTCTGAAAGA.1 | Tissue_stem_cells:BM_MSC:BMP2 | 0.10 | 78.21 | Raw ScoresFibroblasts:breast: 0.29, Smooth_muscle_cells:bronchial: 0.28, Tissue_stem_cells:BM_MSC:BMP2: 0.28, Smooth_muscle_cells:bronchial:vit_D: 0.28, Smooth_muscle_cells:vascular:IL-17: 0.28, Smooth_muscle_cells:vascular: 0.28, iPS_cells:adipose_stem_cells: 0.28, Tissue_stem_cells:BM_MSC:TGFb3: 0.28, Tissue_stem_cells:BM_MSC: 0.28, Osteoblasts: 0.28 |
| T69_CCACTACAGATATACG.1 | Smooth_muscle_cells:vascular:IL-17 | 0.14 | 76.59 | Raw ScoresFibroblasts:breast: 0.36, Smooth_muscle_cells:vascular:IL-17: 0.35, Smooth_muscle_cells:vascular: 0.35, Tissue_stem_cells:BM_MSC:TGFb3: 0.34, iPS_cells:adipose_stem_cells: 0.34, Fibroblasts:foreskin: 0.34, Tissue_stem_cells:BM_MSC:BMP2: 0.34, iPS_cells:CRL2097_foreskin: 0.34, Osteoblasts: 0.33, Tissue_stem_cells:BM_MSC: 0.33 |
| T69_GTAACGTTCGTCCGTT.1 | Endothelial_cells:HUVEC:Borrelia_burgdorferi | 0.11 | 75.07 | Raw ScoresEndothelial_cells:HUVEC:IFNg: 0.35, Endothelial_cells:HUVEC:Borrelia_burgdorferi: 0.34, Endothelial_cells:lymphatic:TNFa_48h: 0.34, Endothelial_cells:HUVEC:VEGF: 0.34, Endothelial_cells:lymphatic: 0.34, Endothelial_cells:HUVEC:B._anthracis_LT: 0.33, Endothelial_cells:HUVEC: 0.33, Endothelial_cells:HUVEC:PR8-infected: 0.33, Endothelial_cells:HUVEC:H5N1-infected: 0.33, Endothelial_cells:HUVEC:FPV-infected: 0.33 |
| T200_CAACCAAGTAGACACG-1 | Endothelial_cells:lymphatic:TNFa_48h | 0.13 | 74.99 | Raw ScoresEndothelial_cells:lymphatic:TNFa_48h: 0.41, Endothelial_cells:HUVEC:IFNg: 0.41, Endothelial_cells:blood_vessel: 0.41, Endothelial_cells:lymphatic: 0.4, Endothelial_cells:lymphatic:KSHV: 0.4, Endothelial_cells:HUVEC:PR8-infected: 0.39, Endothelial_cells:HUVEC:Borrelia_burgdorferi: 0.39, Endothelial_cells:HUVEC:B._anthracis_LT: 0.39, Endothelial_cells:HUVEC:Serum_Amyloid_A: 0.38, Endothelial_cells:HUVEC: 0.38 |
| T69_AGCCTAAAGGAATCGC.1 | Endothelial_cells:HUVEC:Borrelia_burgdorferi | 0.13 | 72.07 | Raw ScoresEndothelial_cells:HUVEC:H5N1-infected: 0.35, Endothelial_cells:HUVEC:IFNg: 0.35, Endothelial_cells:HUVEC:PR8-infected: 0.35, Endothelial_cells:HUVEC:FPV-infected: 0.35, Endothelial_cells:HUVEC: 0.35, Endothelial_cells:HUVEC:Borrelia_burgdorferi: 0.35, Endothelial_cells:lymphatic:TNFa_48h: 0.34, Endothelial_cells:HUVEC:VEGF: 0.34, Endothelial_cells:HUVEC:B._anthracis_LT: 0.34, Endothelial_cells:lymphatic: 0.34 |
| T69_CTGTTTAAGGGAGTAA.1 | Smooth_muscle_cells:vascular | 0.13 | 71.18 | Raw ScoresSmooth_muscle_cells:vascular: 0.33, Fibroblasts:breast: 0.33, Smooth_muscle_cells:vascular:IL-17: 0.33, Tissue_stem_cells:BM_MSC:BMP2: 0.33, Tissue_stem_cells:BM_MSC:TGFb3: 0.32, iPS_cells:adipose_stem_cells: 0.32, Smooth_muscle_cells:bronchial: 0.32, Smooth_muscle_cells:bronchial:vit_D: 0.32, Chondrocytes:MSC-derived: 0.32, Tissue_stem_cells:BM_MSC: 0.32 |
| T19_TCTATTGTCAGTTTGG.1 | Endothelial_cells:HUVEC:IFNg | 0.06 | 71.12 | Raw ScoresSmooth_muscle_cells:bronchial: 0.32, iPS_cells:adipose_stem_cells: 0.31, Tissue_stem_cells:BM_MSC:BMP2: 0.31, Smooth_muscle_cells:bronchial:vit_D: 0.31, Fibroblasts:breast: 0.31, Fibroblasts:foreskin: 0.31, Osteoblasts: 0.31, Chondrocytes:MSC-derived: 0.31, Tissue_stem_cells:BM_MSC:TGFb3: 0.31, Tissue_stem_cells:iliac_MSC: 0.3 |
| T19_CACCACTAGGGTGTTG.1 | Smooth_muscle_cells:bronchial | 0.11 | 69.87 | Raw ScoresSmooth_muscle_cells:bronchial: 0.32, Smooth_muscle_cells:bronchial:vit_D: 0.32, iPS_cells:adipose_stem_cells: 0.31, Tissue_stem_cells:BM_MSC:BMP2: 0.31, Tissue_stem_cells:BM_MSC:TGFb3: 0.3, Chondrocytes:MSC-derived: 0.3, Fibroblasts:breast: 0.3, Osteoblasts: 0.3, iPS_cells:CRL2097_foreskin: 0.3, Tissue_stem_cells:iliac_MSC: 0.29 |
| T230_TGTCCTGCATAGCTGT-1 | Neurons:adrenal_medulla_cell_line | 0.17 | 69.55 | Raw ScoresNeurons:adrenal_medulla_cell_line: 0.38, Neuroepithelial_cell:ESC-derived: 0.33, Astrocyte:Embryonic_stem_cell-derived: 0.31, Neurons:ES_cell-derived_neural_precursor: 0.31, iPS_cells:PDB_1lox-21Puro-20: 0.31, iPS_cells:PDB_1lox-17Puro-10: 0.31, iPS_cells:PDB_2lox-22: 0.31, iPS_cells:CRL2097_foreskin-derived:undiff.: 0.31, Embryonic_stem_cells: 0.31, iPS_cells:PDB_1lox-21Puro-26: 0.31 |
| T19_ACCGTAATCGGCGCTA.1 | Smooth_muscle_cells:bronchial | 0.13 | 68.60 | Raw ScoresSmooth_muscle_cells:bronchial: 0.31, Smooth_muscle_cells:bronchial:vit_D: 0.31, Fibroblasts:breast: 0.3, Osteoblasts: 0.3, iPS_cells:adipose_stem_cells: 0.3, Tissue_stem_cells:BM_MSC:BMP2: 0.3, Chondrocytes:MSC-derived: 0.3, Tissue_stem_cells:BM_MSC:TGFb3: 0.3, iPS_cells:CRL2097_foreskin: 0.29, iPS_cells:fibroblasts: 0.29 |
| T69_GTATCTTGTTGGAGGT.1 | Smooth_muscle_cells:bronchial:vit_D | 0.11 | 66.78 | Raw ScoresSmooth_muscle_cells:vascular:IL-17: 0.34, Smooth_muscle_cells:vascular: 0.34, Fibroblasts:breast: 0.34, Chondrocytes:MSC-derived: 0.34, Tissue_stem_cells:BM_MSC: 0.33, iPS_cells:skin_fibroblast: 0.33, Fibroblasts:foreskin: 0.33, MSC: 0.33, Osteoblasts: 0.33, iPS_cells:foreskin_fibrobasts: 0.33 |
| T69_GGCAATTTCGTTACGA.1 | Smooth_muscle_cells:vascular:IL-17 | 0.17 | 66.60 | Raw ScoresSmooth_muscle_cells:vascular:IL-17: 0.34, Smooth_muscle_cells:vascular: 0.33, Fibroblasts:breast: 0.33, Tissue_stem_cells:BM_MSC: 0.33, Tissue_stem_cells:BM_MSC:BMP2: 0.32, iPS_cells:adipose_stem_cells: 0.32, Tissue_stem_cells:BM_MSC:TGFb3: 0.32, Chondrocytes:MSC-derived: 0.32, Fibroblasts:foreskin: 0.31, Tissue_stem_cells:BM_MSC:osteogenic: 0.31 |
| T69_CCCTCCTCACGGCTAC.1 | Smooth_muscle_cells:vascular:IL-17 | 0.07 | 64.86 | Raw ScoresSmooth_muscle_cells:vascular: 0.26, Smooth_muscle_cells:vascular:IL-17: 0.25, Smooth_muscle_cells:bronchial: 0.25, Smooth_muscle_cells:bronchial:vit_D: 0.25, Fibroblasts:breast: 0.25, Tissue_stem_cells:iliac_MSC: 0.25, iPS_cells:adipose_stem_cells: 0.24, Tissue_stem_cells:BM_MSC:BMP2: 0.24, Tissue_stem_cells:BM_MSC:TGFb3: 0.24, Tissue_stem_cells:BM_MSC: 0.24 |
| T19_AGTGGGAAGTCGCCGT.1 | Tissue_stem_cells:BM_MSC:TGFb3 | 0.12 | 63.74 | Raw ScoresSmooth_muscle_cells:bronchial: 0.31, Tissue_stem_cells:BM_MSC:BMP2: 0.31, Fibroblasts:breast: 0.3, Smooth_muscle_cells:bronchial:vit_D: 0.3, Tissue_stem_cells:BM_MSC:TGFb3: 0.3, Chondrocytes:MSC-derived: 0.3, Osteoblasts: 0.3, Tissue_stem_cells:iliac_MSC: 0.3, iPS_cells:adipose_stem_cells: 0.3, Smooth_muscle_cells:vascular: 0.29 |
| T19_TACGGTAAGCCTATGT.1 | Neurons:Schwann_cell | 0.11 | 63.60 | Raw ScoresFibroblasts:breast: 0.35, iPS_cells:adipose_stem_cells: 0.34, Smooth_muscle_cells:bronchial: 0.34, Smooth_muscle_cells:bronchial:vit_D: 0.33, Tissue_stem_cells:BM_MSC:BMP2: 0.33, Osteoblasts: 0.33, Tissue_stem_cells:iliac_MSC: 0.33, Smooth_muscle_cells:vascular: 0.32, Chondrocytes:MSC-derived: 0.32, Tissue_stem_cells:BM_MSC:TGFb3: 0.32 |
| T19_GGGCATCTCAAGAAGT.1 | Chondrocytes:MSC-derived | 0.14 | 62.86 | Raw ScoresiPS_cells:adipose_stem_cells: 0.34, Fibroblasts:breast: 0.34, Chondrocytes:MSC-derived: 0.34, Smooth_muscle_cells:bronchial: 0.33, Smooth_muscle_cells:bronchial:vit_D: 0.33, Tissue_stem_cells:BM_MSC:BMP2: 0.33, Osteoblasts: 0.33, Tissue_stem_cells:BM_MSC:TGFb3: 0.32, Tissue_stem_cells:iliac_MSC: 0.32, iPS_cells:CRL2097_foreskin: 0.32 |
| T200_CCCTGATAGAGAGCAA-1 | Fibroblasts:breast | 0.17 | 61.30 | Raw ScoresFibroblasts:breast: 0.37, Tissue_stem_cells:BM_MSC:BMP2: 0.36, iPS_cells:adipose_stem_cells: 0.36, Tissue_stem_cells:BM_MSC:TGFb3: 0.36, iPS_cells:CRL2097_foreskin: 0.36, Osteoblasts: 0.35, Smooth_muscle_cells:bronchial: 0.35, MSC: 0.35, Chondrocytes:MSC-derived: 0.35, Tissue_stem_cells:BM_MSC: 0.35 |
| T19_ATCCGAAGTGTGGTTT.1 | Fibroblasts:breast | 0.15 | 59.51 | Raw ScoresiPS_cells:adipose_stem_cells: 0.36, Fibroblasts:breast: 0.36, Osteoblasts: 0.36, Smooth_muscle_cells:bronchial: 0.36, Chondrocytes:MSC-derived: 0.35, Smooth_muscle_cells:bronchial:vit_D: 0.35, Tissue_stem_cells:BM_MSC:BMP2: 0.35, Tissue_stem_cells:BM_MSC:TGFb3: 0.35, Tissue_stem_cells:iliac_MSC: 0.34, iPS_cells:CRL2097_foreskin: 0.34 |
Below shows the significant enrichments of this GEP for literature curated gene lists
This data was procured from existing single cell RNA-seq maps of neuroblastoma or related relevant data.
High ranks indicate this gene is a driver of this GEP.
These curated gene list are ranked by the P-value (on this GEP) of their constituent genes.
The Mean Count column shows the mean read count in cells scoring highly (H > 50) on this gene expression program.
Inflammatory CAF
These marker genes were curated across cancer subtypes in multiple organ systems as reviewed in Lavie et. al. (PMID 35883004) and contain inflammatory specific CAF genes:
Wilcoxon ranksum test P-value for gene set overrepresentation: 2.61e-11
Mean rank of genes in gene set: 1523.44
Rank on gene expression program of genes in gene set:
| Genes | Weight | Rank | GTEx | DepMap | Decartes | Mean.Counts | Mean.TPM |
|---|---|---|---|---|---|---|---|
| IGFBP6 | 0.0209681 | 10 | GTEx | DepMap | Descartes | 10.14 | 2935.42 |
| CFD | 0.0165407 | 13 | GTEx | DepMap | Descartes | 11.02 | 4586.45 |
| C7 | 0.0156928 | 16 | GTEx | DepMap | Descartes | 1.59 | 106.00 |
| C3 | 0.0128638 | 25 | GTEx | DepMap | Descartes | 3.08 | 186.29 |
| CXCL14 | 0.0110899 | 34 | GTEx | DepMap | Descartes | 1.12 | 217.80 |
| SERPING1 | 0.0106009 | 38 | GTEx | DepMap | Descartes | 4.08 | 597.18 |
| SCARA5 | 0.0075260 | 62 | GTEx | DepMap | Descartes | 0.20 | 19.18 |
| IL33 | 0.0073966 | 63 | GTEx | DepMap | Descartes | 0.31 | 39.04 |
| IGF1 | 0.0069915 | 67 | GTEx | DepMap | Descartes | 1.91 | 84.29 |
| GPX3 | 0.0052846 | 96 | GTEx | DepMap | Descartes | 1.39 | 280.11 |
| IL1R1 | 0.0036016 | 149 | GTEx | DepMap | Descartes | 0.45 | 23.07 |
| PDGFD | 0.0022314 | 265 | GTEx | DepMap | Descartes | 0.14 | 8.43 |
| CFB | 0.0019582 | 308 | GTEx | DepMap | Descartes | 0.17 | 11.30 |
| CXCL12 | 0.0013132 | 445 | GTEx | DepMap | Descartes | 2.00 | 174.81 |
| PDPN | 0.0008911 | 624 | GTEx | DepMap | Descartes | 0.34 | 25.93 |
| RGMA | 0.0007434 | 753 | GTEx | DepMap | Descartes | 0.14 | 3.39 |
| PDGFRA | 0.0006334 | 894 | GTEx | DepMap | Descartes | 0.53 | 23.75 |
| CXCL2 | 0.0005605 | 1007 | GTEx | DepMap | Descartes | 3.36 | 535.64 |
| SOD2 | 0.0005487 | 1030 | GTEx | DepMap | Descartes | 1.81 | 19.57 |
| SCARA3 | 0.0003579 | 1478 | GTEx | DepMap | Descartes | 0.05 | 3.58 |
| CCL2 | 0.0001937 | 2190 | GTEx | DepMap | Descartes | 6.38 | 1781.48 |
| PDGFRB | 0.0000984 | 2901 | GTEx | DepMap | Descartes | 0.67 | 36.08 |
| HGF | -0.0000685 | 6000 | GTEx | DepMap | Descartes | 0.14 | 4.92 |
| IL10 | -0.0001378 | 8100 | GTEx | DepMap | Descartes | 0.03 | 3.57 |
| LIF | -0.0003044 | 11518 | GTEx | DepMap | Descartes | 0.08 | 6.10 |
Myofibroblastic CAF
These marker genes were curated across cancer subtypes in multiple organ systems as reviewed in Lavie et. al. (PMID 35883004) and contain myofibroblastic specific CAF genes:
Wilcoxon ranksum test P-value for gene set overrepresentation: 1.36e-10
Mean rank of genes in gene set: 3013.94
Rank on gene expression program of genes in gene set:
| Genes | Weight | Rank | GTEx | DepMap | Decartes | Mean.Counts | Mean.TPM |
|---|---|---|---|---|---|---|---|
| DCN | 0.0275596 | 6 | GTEx | DepMap | Descartes | 30.11 | 1581.50 |
| COL12A1 | 0.0048163 | 110 | GTEx | DepMap | Descartes | 0.14 | 4.69 |
| MMP2 | 0.0044369 | 119 | GTEx | DepMap | Descartes | 2.11 | 176.12 |
| TAGLN | 0.0043070 | 121 | GTEx | DepMap | Descartes | 10.84 | 858.23 |
| COL8A1 | 0.0036624 | 147 | GTEx | DepMap | Descartes | 0.75 | 29.73 |
| COL14A1 | 0.0032419 | 171 | GTEx | DepMap | Descartes | 0.48 | 23.56 |
| COL1A2 | 0.0029881 | 187 | GTEx | DepMap | Descartes | 7.55 | 393.42 |
| LUM | 0.0023434 | 245 | GTEx | DepMap | Descartes | 12.62 | 1705.05 |
| BGN | 0.0022929 | 255 | GTEx | DepMap | Descartes | 2.66 | 301.79 |
| IGFBP3 | 0.0021546 | 274 | GTEx | DepMap | Descartes | 1.09 | 115.61 |
| IGFBP7 | 0.0020537 | 285 | GTEx | DepMap | Descartes | 51.75 | 11064.04 |
| MYL9 | 0.0019478 | 311 | GTEx | DepMap | Descartes | 4.09 | 386.87 |
| TGFBR2 | 0.0018284 | 332 | GTEx | DepMap | Descartes | 0.88 | 41.19 |
| THBS1 | 0.0016323 | 369 | GTEx | DepMap | Descartes | 2.20 | 74.86 |
| CNN3 | 0.0014985 | 390 | GTEx | DepMap | Descartes | 2.27 | 321.82 |
| COL3A1 | 0.0014447 | 403 | GTEx | DepMap | Descartes | 6.61 | 366.75 |
| POSTN | 0.0013659 | 430 | GTEx | DepMap | Descartes | 1.09 | 109.43 |
| MYH11 | 0.0011439 | 502 | GTEx | DepMap | Descartes | 0.59 | 21.28 |
| WNT5A | 0.0010106 | 563 | GTEx | DepMap | Descartes | 0.06 | 2.93 |
| THY1 | 0.0009537 | 592 | GTEx | DepMap | Descartes | 1.55 | 98.30 |
| TPM2 | 0.0007256 | 769 | GTEx | DepMap | Descartes | 3.20 | 467.87 |
| MYLK | 0.0006844 | 836 | GTEx | DepMap | Descartes | 0.61 | 12.45 |
| THBS2 | 0.0006055 | 944 | GTEx | DepMap | Descartes | 0.48 | 26.00 |
| COL1A1 | 0.0005916 | 960 | GTEx | DepMap | Descartes | 9.50 | 450.92 |
| MMP11 | 0.0005535 | 1017 | GTEx | DepMap | Descartes | 0.70 | 38.74 |
| ITGA7 | 0.0005283 | 1067 | GTEx | DepMap | Descartes | 0.05 | 3.11 |
| VCAN | 0.0005126 | 1097 | GTEx | DepMap | Descartes | 1.27 | 29.71 |
| TMEM119 | 0.0004953 | 1129 | GTEx | DepMap | Descartes | 0.12 | 13.10 |
| TNC | 0.0003685 | 1446 | GTEx | DepMap | Descartes | 0.02 | 0.57 |
| COL5A2 | 0.0002901 | 1721 | GTEx | DepMap | Descartes | 0.39 | 14.24 |
| ACTA2 | 0.0002791 | 1756 | GTEx | DepMap | Descartes | 3.48 | 679.27 |
| PGF | 0.0002052 | 2121 | GTEx | DepMap | Descartes | 0.80 | 67.59 |
| TPM1 | 0.0002007 | 2147 | GTEx | DepMap | Descartes | 4.09 | 256.42 |
| CNN2 | 0.0001640 | 2369 | GTEx | DepMap | Descartes | 0.48 | 52.29 |
| VEGFA | 0.0001242 | 2665 | GTEx | DepMap | Descartes | 0.25 | 6.81 |
| TGFBR1 | 0.0000691 | 3187 | GTEx | DepMap | Descartes | 0.22 | 7.15 |
| COL13A1 | 0.0000353 | 3576 | GTEx | DepMap | Descartes | 0.00 | 0.00 |
| COL10A1 | -0.0000144 | 4467 | GTEx | DepMap | Descartes | 0.00 | 0.00 |
| MEF2C | -0.0000716 | 6091 | GTEx | DepMap | Descartes | 0.59 | 18.12 |
| COL11A1 | -0.0001096 | 7241 | GTEx | DepMap | Descartes | 0.00 | 0.00 |
| COL15A1 | -0.0001326 | 7943 | GTEx | DepMap | Descartes | 0.75 | 33.56 |
| TGFB2 | -0.0001566 | 8628 | GTEx | DepMap | Descartes | 0.03 | 0.56 |
| HOPX | -0.0001708 | 9036 | GTEx | DepMap | Descartes | 0.11 | 10.22 |
| TGFB1 | -0.0002498 | 10811 | GTEx | DepMap | Descartes | 0.58 | 32.96 |
| ACTG2 | -0.0002631 | 11018 | GTEx | DepMap | Descartes | 0.12 | 12.30 |
| FN1 | -0.0002953 | 11419 | GTEx | DepMap | Descartes | 4.98 | 126.89 |
| RGS5 | -0.0003990 | 12095 | GTEx | DepMap | Descartes | 1.23 | 72.19 |
| COL5A1 | -0.0004061 | 12124 | GTEx | DepMap | Descartes | 0.52 | 14.82 |
| COL4A1 | -0.0004227 | 12191 | GTEx | DepMap | Descartes | 1.64 | 59.12 |
Mesenchymal Fig 1D (Olsen)
Selected mesenchymal marker genes shown in Fig. 1D of Olsen et al. https://www.biorxiv.org/content/10.1101/2020.05.04.077057v1 - these are highly expressed in their mesenchymal cluster on their UMAP.:
Wilcoxon ranksum test P-value for gene set overrepresentation: 1.75e-09
Mean rank of genes in gene set: 343.69
Rank on gene expression program of genes in gene set:
| Genes | Weight | Rank | GTEx | DepMap | Decartes | Mean.Counts | Mean.TPM |
|---|---|---|---|---|---|---|---|
| DCN | 0.0275596 | 6 | GTEx | DepMap | Descartes | 30.11 | 1581.50 |
| MGP | 0.0246255 | 7 | GTEx | DepMap | Descartes | 39.44 | 7383.72 |
| LEPR | 0.0078675 | 58 | GTEx | DepMap | Descartes | 0.36 | 14.20 |
| PRRX1 | 0.0045333 | 117 | GTEx | DepMap | Descartes | 0.52 | 43.35 |
| CALD1 | 0.0041421 | 123 | GTEx | DepMap | Descartes | 7.28 | 386.96 |
| COL6A2 | 0.0034929 | 156 | GTEx | DepMap | Descartes | 3.41 | 310.27 |
| COL1A2 | 0.0029881 | 187 | GTEx | DepMap | Descartes | 7.55 | 393.42 |
| LUM | 0.0023434 | 245 | GTEx | DepMap | Descartes | 12.62 | 1705.05 |
| BGN | 0.0022929 | 255 | GTEx | DepMap | Descartes | 2.66 | 301.79 |
| COL3A1 | 0.0014447 | 403 | GTEx | DepMap | Descartes | 6.61 | 366.75 |
| PDGFRA | 0.0006334 | 894 | GTEx | DepMap | Descartes | 0.53 | 23.75 |
| COL1A1 | 0.0005916 | 960 | GTEx | DepMap | Descartes | 9.50 | 450.92 |
| SPARC | 0.0005350 | 1057 | GTEx | DepMap | Descartes | 7.81 | 485.89 |
Below shows ranks on this GEP for literature curated gene lists for large gene sets
These include those reported as mesenchymal/adrenergic by Van Groningen et al.
High ranks indicate this gene is a driver of this GEP (note these results are not ordered).
The Mean Count column shows the mean read count in cells scoring highly (H > 50) on this gene expression program.
VanGroningen Adrenergic Genes
Adrenergic marker genes from Supplementary Table 2 of Van Groningen et al. Nature Genetics 2017. These genes were identified by differential expression analysis of mesenchymal-like and adrenergic-like neuroblastoma cell lines.
Wilcoxon ranksum test P-value for gene set overrepresentation: 1.00e+00
Mean rank of genes in gene set: 9625.5
Median rank of genes in gene set: 10876
Rank on gene expression program of top 30 genes in gene set:
| Genes | Weight | Rank | GTEx | DepMap | Descartes | Mean.Counts | Mean.TPM |
|---|---|---|---|---|---|---|---|
| AKAP12 | 0.0023980 | 238 | GTEx | DepMap | Descartes | 1.55 | 63.12 |
| ABLIM1 | 0.0013187 | 441 | GTEx | DepMap | Descartes | 0.48 | 16.33 |
| SLC35G2 | 0.0007995 | 691 | GTEx | DepMap | Descartes | 0.14 | NA |
| NFIL3 | 0.0007378 | 759 | GTEx | DepMap | Descartes | 0.27 | 33.46 |
| SYNPO2 | 0.0006951 | 823 | GTEx | DepMap | Descartes | 0.48 | 9.40 |
| GRB10 | 0.0004399 | 1255 | GTEx | DepMap | Descartes | 0.14 | 4.67 |
| CDKN2C | 0.0003782 | 1405 | GTEx | DepMap | Descartes | 0.19 | 22.57 |
| CETN3 | 0.0003591 | 1474 | GTEx | DepMap | Descartes | 0.19 | 23.16 |
| CYGB | 0.0002815 | 1751 | GTEx | DepMap | Descartes | 0.62 | 109.74 |
| INO80C | 0.0002773 | 1764 | GTEx | DepMap | Descartes | 0.20 | 12.35 |
| TUBB4B | 0.0002301 | 1981 | GTEx | DepMap | Descartes | 1.38 | 179.73 |
| NAP1L5 | 0.0002045 | 2127 | GTEx | DepMap | Descartes | 0.14 | 18.90 |
| EML6 | 0.0001995 | 2155 | GTEx | DepMap | Descartes | 0.02 | 1.07 |
| SETD7 | 0.0001704 | 2320 | GTEx | DepMap | Descartes | 0.14 | 4.87 |
| FAM163A | 0.0001647 | 2364 | GTEx | DepMap | Descartes | 0.03 | 4.44 |
| NET1 | 0.0001510 | 2467 | GTEx | DepMap | Descartes | 0.25 | 16.12 |
| KLC1 | 0.0001510 | 2468 | GTEx | DepMap | Descartes | 0.42 | 5.98 |
| DPYSL3 | 0.0001482 | 2480 | GTEx | DepMap | Descartes | 0.45 | 19.62 |
| ZWILCH | 0.0001185 | 2714 | GTEx | DepMap | Descartes | 0.09 | 9.21 |
| RNF144A | 0.0001122 | 2767 | GTEx | DepMap | Descartes | 0.12 | 5.57 |
| SLIT3 | 0.0001023 | 2849 | GTEx | DepMap | Descartes | 0.92 | 23.77 |
| ACVR1B | 0.0001002 | 2875 | GTEx | DepMap | Descartes | 0.09 | 3.97 |
| ARL6IP1 | 0.0000671 | 3214 | GTEx | DepMap | Descartes | 1.06 | 109.44 |
| ADCYAP1R1 | 0.0000620 | 3269 | GTEx | DepMap | Descartes | 0.02 | 0.08 |
| IGFBPL1 | 0.0000396 | 3531 | GTEx | DepMap | Descartes | 0.00 | 0.00 |
| UNC79 | 0.0000255 | 3713 | GTEx | DepMap | Descartes | 0.02 | 0.24 |
| RNF150 | 0.0000091 | 3978 | GTEx | DepMap | Descartes | 0.17 | 3.56 |
| BEND4 | -0.0000063 | 4239 | GTEx | DepMap | Descartes | 0.00 | 0.00 |
| DAPK1 | -0.0000073 | 4268 | GTEx | DepMap | Descartes | 0.48 | 14.35 |
| MCM6 | -0.0000133 | 4439 | GTEx | DepMap | Descartes | 0.05 | 2.60 |
VanGroningen Mesenchymal Genes
Mesenchymal marker genes from Supplementary Table 2 of Van Groningen et al. Nature Genetics 2017. These genes were identified by differential expression analysis of mesenchymal-like and adrenergic-like neuroblastoma cell lines.
Wilcoxon ranksum test P-value for gene set overrepresentation: 4.17e-68
Mean rank of genes in gene set: 3305.63
Median rank of genes in gene set: 1528
Rank on gene expression program of top 30 genes in gene set:
| Genes | Weight | Rank | GTEx | DepMap | Descartes | Mean.Counts | Mean.TPM |
|---|---|---|---|---|---|---|---|
| MGP | 0.0246255 | 7 | GTEx | DepMap | Descartes | 39.44 | 7383.72 |
| CCDC80 | 0.0241432 | 8 | GTEx | DepMap | Descartes | 5.75 | 148.47 |
| IGFBP6 | 0.0209681 | 10 | GTEx | DepMap | Descartes | 10.14 | 2935.42 |
| BOC | 0.0170424 | 11 | GTEx | DepMap | Descartes | 0.28 | 14.58 |
| GAS1 | 0.0162166 | 15 | GTEx | DepMap | Descartes | 1.00 | 82.74 |
| MGST1 | 0.0138307 | 20 | GTEx | DepMap | Descartes | 1.47 | 192.78 |
| FIBIN | 0.0127353 | 26 | GTEx | DepMap | Descartes | 0.14 | 15.40 |
| GSN | 0.0121915 | 27 | GTEx | DepMap | Descartes | 17.66 | 955.42 |
| EMP1 | 0.0117605 | 30 | GTEx | DepMap | Descartes | 1.88 | 83.64 |
| CYBRD1 | 0.0092537 | 48 | GTEx | DepMap | Descartes | 0.83 | 57.60 |
| AEBP1 | 0.0090017 | 52 | GTEx | DepMap | Descartes | 1.75 | 129.76 |
| HES1 | 0.0085200 | 54 | GTEx | DepMap | Descartes | 2.81 | 428.82 |
| FMOD | 0.0080324 | 57 | GTEx | DepMap | Descartes | 0.20 | 18.51 |
| IGFBP5 | 0.0072011 | 66 | GTEx | DepMap | Descartes | 13.00 | 728.85 |
| NFIA | 0.0069657 | 68 | GTEx | DepMap | Descartes | 1.12 | 6.62 |
| SEMA3C | 0.0065405 | 76 | GTEx | DepMap | Descartes | 0.38 | 24.48 |
| FSTL1 | 0.0060731 | 82 | GTEx | DepMap | Descartes | 2.62 | 147.21 |
| ID3 | 0.0054444 | 91 | GTEx | DepMap | Descartes | 6.00 | 1905.73 |
| LTBP1 | 0.0054337 | 92 | GTEx | DepMap | Descartes | 0.48 | 23.05 |
| FZD1 | 0.0052666 | 97 | GTEx | DepMap | Descartes | 0.23 | 11.62 |
| PCOLCE2 | 0.0052351 | 101 | GTEx | DepMap | Descartes | 0.31 | 64.85 |
| HTRA1 | 0.0051162 | 102 | GTEx | DepMap | Descartes | 1.77 | 192.01 |
| SRPX | 0.0049904 | 105 | GTEx | DepMap | Descartes | 1.66 | 376.76 |
| ID1 | 0.0048631 | 108 | GTEx | DepMap | Descartes | 2.61 | 454.52 |
| COL12A1 | 0.0048163 | 110 | GTEx | DepMap | Descartes | 0.14 | 4.69 |
| PPIC | 0.0046102 | 114 | GTEx | DepMap | Descartes | 0.95 | 210.16 |
| PHLDA3 | 0.0045425 | 116 | GTEx | DepMap | Descartes | 0.66 | 74.71 |
| PRRX1 | 0.0045333 | 117 | GTEx | DepMap | Descartes | 0.52 | 43.35 |
| MMP2 | 0.0044369 | 119 | GTEx | DepMap | Descartes | 2.11 | 176.12 |
| ERRFI1 | 0.0042511 | 122 | GTEx | DepMap | Descartes | 0.58 | 64.97 |
Descartes adrenocortical markers
Top 50 marker genes of adrenocortical cells in the Decartes fetal adrenal single cell map (https://atlas.brotmanbaty.org/bbi/human-gene-expression-during-development/cell/adrenocortical/in/adrenal)
Wilcoxon ranksum test P-value for gene set overrepresentation: 8.57e-01
Mean rank of genes in gene set: 6917.03
Median rank of genes in gene set: 7239
Rank on gene expression program of top 30 genes in gene set:
| Genes | Weight | Rank | GTEx | DepMap | Descartes | Mean.Counts | Mean.TPM |
|---|---|---|---|---|---|---|---|
| CLU | 0.0108443 | 36 | GTEx | DepMap | Descartes | 4.30 | 520.17 |
| SH3BP5 | 0.0018039 | 337 | GTEx | DepMap | Descartes | 0.80 | 71.02 |
| POR | 0.0001379 | 2563 | GTEx | DepMap | Descartes | 0.33 | 29.02 |
| SH3PXD2B | 0.0001317 | 2597 | GTEx | DepMap | Descartes | 0.08 | 1.10 |
| DHCR7 | 0.0000764 | 3109 | GTEx | DepMap | Descartes | 0.05 | 7.91 |
| DHCR24 | 0.0000762 | 3110 | GTEx | DepMap | Descartes | 0.16 | 5.64 |
| SCARB1 | 0.0000624 | 3261 | GTEx | DepMap | Descartes | 0.19 | 5.36 |
| PDE10A | -0.0000022 | 4174 | GTEx | DepMap | Descartes | 0.08 | 2.43 |
| FDX1 | -0.0000115 | 4377 | GTEx | DepMap | Descartes | 0.33 | 18.90 |
| ERN1 | -0.0000232 | 4704 | GTEx | DepMap | Descartes | 0.12 | 4.06 |
| IGF1R | -0.0000576 | 5703 | GTEx | DepMap | Descartes | 0.17 | 4.38 |
| SGCZ | -0.0000582 | 5713 | GTEx | DepMap | Descartes | 0.00 | 0.00 |
| CYB5B | -0.0000584 | 5720 | GTEx | DepMap | Descartes | 0.22 | 11.42 |
| SLC1A2 | -0.0000678 | 5989 | GTEx | DepMap | Descartes | 0.02 | 0.64 |
| BAIAP2L1 | -0.0000719 | 6099 | GTEx | DepMap | Descartes | 0.02 | 0.49 |
| GSTA4 | -0.0000735 | 6153 | GTEx | DepMap | Descartes | 0.47 | 73.36 |
| INHA | -0.0000993 | 6935 | GTEx | DepMap | Descartes | 0.00 | 0.00 |
| FREM2 | -0.0001082 | 7201 | GTEx | DepMap | Descartes | 0.00 | 0.00 |
| FDPS | -0.0001104 | 7277 | GTEx | DepMap | Descartes | 0.61 | 61.71 |
| SCAP | -0.0001155 | 7420 | GTEx | DepMap | Descartes | 0.11 | 6.03 |
| FDXR | -0.0001279 | 7811 | GTEx | DepMap | Descartes | 0.08 | 10.42 |
| APOC1 | -0.0001357 | 8033 | GTEx | DepMap | Descartes | 6.53 | 1020.35 |
| LDLR | -0.0001552 | 8583 | GTEx | DepMap | Descartes | 0.17 | 7.77 |
| GRAMD1B | -0.0001632 | 8821 | GTEx | DepMap | Descartes | 0.06 | 1.35 |
| TM7SF2 | -0.0001656 | 8888 | GTEx | DepMap | Descartes | 0.11 | 12.53 |
| SLC16A9 | -0.0001716 | 9051 | GTEx | DepMap | Descartes | 0.00 | 0.00 |
| NPC1 | -0.0001718 | 9061 | GTEx | DepMap | Descartes | 0.08 | 2.12 |
| FRMD5 | -0.0001804 | 9281 | GTEx | DepMap | Descartes | 0.00 | 0.00 |
| PAPSS2 | -0.0001897 | 9494 | GTEx | DepMap | Descartes | 0.12 | 5.07 |
| HMGCS1 | -0.0002402 | 10634 | GTEx | DepMap | Descartes | 0.19 | 7.43 |
Descartes chromaffin markers
Top 50 marker genes of chromaffin cells in the Decartes fetal adrenal single cell map (https://atlas.brotmanbaty.org/bbi/human-gene-expression-during-development/cell/chromaffin/in/adrenal)
Wilcoxon ranksum test P-value for gene set overrepresentation: 1.00e+00
Mean rank of genes in gene set: 10271.27
Median rank of genes in gene set: 11755
Rank on gene expression program of top 30 genes in gene set:
| Genes | Weight | Rank | GTEx | DepMap | Descartes | Mean.Counts | Mean.TPM |
|---|---|---|---|---|---|---|---|
| SYNPO2 | 0.0006951 | 823 | GTEx | DepMap | Descartes | 0.48 | 9.40 |
| SLC44A5 | 0.0000478 | 3430 | GTEx | DepMap | Descartes | 0.02 | 1.38 |
| ANKFN1 | -0.0000401 | 5179 | GTEx | DepMap | Descartes | 0.02 | 2.46 |
| EYA1 | -0.0000402 | 5182 | GTEx | DepMap | Descartes | 0.03 | 1.82 |
| EPHA6 | -0.0001039 | 7068 | GTEx | DepMap | Descartes | 0.00 | 0.00 |
| EYA4 | -0.0001045 | 7091 | GTEx | DepMap | Descartes | 0.02 | 0.59 |
| RPH3A | -0.0001162 | 7440 | GTEx | DepMap | Descartes | 0.00 | 0.00 |
| FAT3 | -0.0001248 | 7703 | GTEx | DepMap | Descartes | 0.02 | 0.30 |
| PTCHD1 | -0.0001613 | 8766 | GTEx | DepMap | Descartes | 0.03 | 0.08 |
| ALK | -0.0001626 | 8805 | GTEx | DepMap | Descartes | 0.00 | 0.00 |
| RYR2 | -0.0001678 | 8956 | GTEx | DepMap | Descartes | 0.02 | 0.42 |
| KCNB2 | -0.0001910 | 9528 | GTEx | DepMap | Descartes | 0.00 | 0.00 |
| PLXNA4 | -0.0001923 | 9565 | GTEx | DepMap | Descartes | 0.03 | 0.48 |
| CNKSR2 | -0.0002196 | 10219 | GTEx | DepMap | Descartes | 0.02 | 0.25 |
| TMEM132C | -0.0002205 | 10243 | GTEx | DepMap | Descartes | 0.00 | 0.00 |
| HS3ST5 | -0.0002227 | 10297 | GTEx | DepMap | Descartes | 0.00 | 0.00 |
| GREM1 | -0.0002364 | 10555 | GTEx | DepMap | Descartes | 0.00 | 0.00 |
| SLC6A2 | -0.0002424 | 10666 | GTEx | DepMap | Descartes | 0.03 | 2.25 |
| IL7 | -0.0002620 | 11001 | GTEx | DepMap | Descartes | 0.05 | 7.66 |
| RGMB | -0.0003071 | 11546 | GTEx | DepMap | Descartes | 0.11 | 6.16 |
| RBFOX1 | -0.0003334 | 11755 | GTEx | DepMap | Descartes | 0.00 | 0.00 |
| TMEFF2 | -0.0003341 | 11761 | GTEx | DepMap | Descartes | 0.00 | 0.00 |
| REEP1 | -0.0003379 | 11799 | GTEx | DepMap | Descartes | 0.09 | 4.94 |
| GAL | -0.0003587 | 11922 | GTEx | DepMap | Descartes | 0.08 | 13.46 |
| TUBB2A | -0.0003856 | 12046 | GTEx | DepMap | Descartes | 0.50 | 87.84 |
| CNTFR | -0.0003873 | 12056 | GTEx | DepMap | Descartes | 0.06 | 6.77 |
| MAB21L2 | -0.0004010 | 12106 | GTEx | DepMap | Descartes | 0.16 | 8.35 |
| ISL1 | -0.0004107 | 12149 | GTEx | DepMap | Descartes | 0.31 | 24.12 |
| MARCH11 | -0.0004178 | 12171 | GTEx | DepMap | Descartes | 0.50 | NA |
| MAB21L1 | -0.0004312 | 12218 | GTEx | DepMap | Descartes | 0.14 | 10.36 |
Descartes Vascular_endothelial markers
Top 50 marker genes of Vascular_endothelial cells in the Decartes fetal adrenal single cell map (https://atlas.brotmanbaty.org/bbi/human-gene-expression-during-development/cell/vascular_endothelial/in/adrenal)
Wilcoxon ranksum test P-value for gene set overrepresentation: 1.10e-01
Mean rank of genes in gene set: 5555.97
Median rank of genes in gene set: 6270.5
Rank on gene expression program of top 30 genes in gene set:
| Genes | Weight | Rank | GTEx | DepMap | Descartes | Mean.Counts | Mean.TPM |
|---|---|---|---|---|---|---|---|
| NPR1 | 0.0084148 | 56 | GTEx | DepMap | Descartes | 0.16 | 12.25 |
| ID1 | 0.0048631 | 108 | GTEx | DepMap | Descartes | 2.61 | 454.52 |
| GALNT15 | 0.0009061 | 615 | GTEx | DepMap | Descartes | 0.03 | NA |
| CDH13 | 0.0008375 | 667 | GTEx | DepMap | Descartes | 0.19 | 5.62 |
| SHE | 0.0005900 | 965 | GTEx | DepMap | Descartes | 0.09 | 3.47 |
| ARHGAP29 | 0.0005739 | 986 | GTEx | DepMap | Descartes | 0.69 | 16.84 |
| RAMP2 | 0.0003999 | 1356 | GTEx | DepMap | Descartes | 1.72 | 342.28 |
| PTPRB | 0.0003575 | 1481 | GTEx | DepMap | Descartes | 0.44 | 3.56 |
| CALCRL | 0.0002904 | 1718 | GTEx | DepMap | Descartes | 0.20 | 7.16 |
| MMRN2 | 0.0001826 | 2250 | GTEx | DepMap | Descartes | 0.22 | 7.79 |
| TEK | 0.0001554 | 2436 | GTEx | DepMap | Descartes | 0.09 | 3.06 |
| PODXL | 0.0001168 | 2725 | GTEx | DepMap | Descartes | 0.45 | 7.22 |
| CDH5 | 0.0000998 | 2882 | GTEx | DepMap | Descartes | 0.47 | 13.62 |
| BTNL9 | 0.0000735 | 3144 | GTEx | DepMap | Descartes | 0.05 | 1.72 |
| SLCO2A1 | 0.0000250 | 3718 | GTEx | DepMap | Descartes | 0.02 | 0.58 |
| TMEM88 | 0.0000230 | 3748 | GTEx | DepMap | Descartes | 0.11 | 11.39 |
| ESM1 | -0.0000077 | 4282 | GTEx | DepMap | Descartes | 0.61 | 17.57 |
| MYRIP | -0.0000269 | 4807 | GTEx | DepMap | Descartes | 0.03 | 0.87 |
| CRHBP | -0.0000624 | 5847 | GTEx | DepMap | Descartes | 0.02 | 0.70 |
| IRX3 | -0.0000919 | 6694 | GTEx | DepMap | Descartes | 0.00 | 0.00 |
| TIE1 | -0.0001065 | 7155 | GTEx | DepMap | Descartes | 0.14 | 5.14 |
| F8 | -0.0001180 | 7491 | GTEx | DepMap | Descartes | 0.05 | 1.97 |
| PLVAP | -0.0001235 | 7653 | GTEx | DepMap | Descartes | 0.66 | 23.14 |
| RASIP1 | -0.0001293 | 7842 | GTEx | DepMap | Descartes | 0.09 | 3.62 |
| HYAL2 | -0.0001320 | 7919 | GTEx | DepMap | Descartes | 0.47 | 25.11 |
| SHANK3 | -0.0001324 | 7935 | GTEx | DepMap | Descartes | 0.03 | 0.23 |
| NR5A2 | -0.0001458 | 8314 | GTEx | DepMap | Descartes | 0.00 | 0.00 |
| CEACAM1 | -0.0001497 | 8425 | GTEx | DepMap | Descartes | 0.00 | 0.00 |
| EHD3 | -0.0001539 | 8551 | GTEx | DepMap | Descartes | 0.03 | 1.36 |
| CYP26B1 | -0.0001555 | 8596 | GTEx | DepMap | Descartes | 0.05 | 2.99 |
Descartes stromal markers
Top 50 marker genes of stromal cells in the Decartes fetal adrenal single cell map (https://atlas.brotmanbaty.org/bbi/human-gene-expression-during-development/cell/stromal/in/adrenal)
Wilcoxon ranksum test P-value for gene set overrepresentation: 5.88e-19
Mean rank of genes in gene set: 1468.05
Median rank of genes in gene set: 325
Rank on gene expression program of top 30 genes in gene set:
| Genes | Weight | Rank | GTEx | DepMap | Descartes | Mean.Counts | Mean.TPM |
|---|---|---|---|---|---|---|---|
| SFRP2 | 0.0363968 | 1 | GTEx | DepMap | Descartes | 2.00 | 498.51 |
| RSPO3 | 0.0279529 | 4 | GTEx | DepMap | Descartes | 0.62 | NA |
| DCN | 0.0275596 | 6 | GTEx | DepMap | Descartes | 30.11 | 1581.50 |
| MGP | 0.0246255 | 7 | GTEx | DepMap | Descartes | 39.44 | 7383.72 |
| CCDC80 | 0.0241432 | 8 | GTEx | DepMap | Descartes | 5.75 | 148.47 |
| C7 | 0.0156928 | 16 | GTEx | DepMap | Descartes | 1.59 | 106.00 |
| OGN | 0.0151548 | 17 | GTEx | DepMap | Descartes | 1.92 | 172.35 |
| SCARA5 | 0.0075260 | 62 | GTEx | DepMap | Descartes | 0.20 | 19.18 |
| ISLR | 0.0065964 | 74 | GTEx | DepMap | Descartes | 0.73 | 108.95 |
| DKK2 | 0.0059883 | 84 | GTEx | DepMap | Descartes | 0.09 | 8.43 |
| BICC1 | 0.0055509 | 89 | GTEx | DepMap | Descartes | 0.59 | 31.07 |
| ADAMTSL3 | 0.0048524 | 109 | GTEx | DepMap | Descartes | 0.05 | 2.69 |
| COL12A1 | 0.0048163 | 110 | GTEx | DepMap | Descartes | 0.14 | 4.69 |
| PRRX1 | 0.0045333 | 117 | GTEx | DepMap | Descartes | 0.52 | 43.35 |
| PCOLCE | 0.0039269 | 140 | GTEx | DepMap | Descartes | 2.89 | 676.82 |
| COL1A2 | 0.0029881 | 187 | GTEx | DepMap | Descartes | 7.55 | 393.42 |
| ELN | 0.0026374 | 212 | GTEx | DepMap | Descartes | 0.94 | 67.63 |
| CD248 | 0.0026168 | 214 | GTEx | DepMap | Descartes | 0.36 | 49.03 |
| LUM | 0.0023434 | 245 | GTEx | DepMap | Descartes | 12.62 | 1705.05 |
| IGFBP3 | 0.0021546 | 274 | GTEx | DepMap | Descartes | 1.09 | 115.61 |
| CLDN11 | 0.0020696 | 282 | GTEx | DepMap | Descartes | 0.19 | 16.51 |
| LRRC17 | 0.0018949 | 317 | GTEx | DepMap | Descartes | 0.14 | 26.21 |
| PAMR1 | 0.0018217 | 333 | GTEx | DepMap | Descartes | 0.36 | 42.23 |
| COL3A1 | 0.0014447 | 403 | GTEx | DepMap | Descartes | 6.61 | 366.75 |
| POSTN | 0.0013659 | 430 | GTEx | DepMap | Descartes | 1.09 | 109.43 |
| PCDH18 | 0.0013049 | 450 | GTEx | DepMap | Descartes | 0.16 | 7.19 |
| LOX | 0.0011686 | 489 | GTEx | DepMap | Descartes | 0.48 | 25.49 |
| ABCC9 | 0.0011168 | 512 | GTEx | DepMap | Descartes | 0.02 | 0.95 |
| ABCA6 | 0.0007227 | 774 | GTEx | DepMap | Descartes | 0.50 | 24.38 |
| PDGFRA | 0.0006334 | 894 | GTEx | DepMap | Descartes | 0.53 | 23.75 |
Descartes sympathoblasts markers
Top 50 marker genes of sympathoblasts cells in the Decartes fetal adrenal single cell map (https://atlas.brotmanbaty.org/bbi/human-gene-expression-during-development/cell/sympathoblasts/in/adrenal)
Wilcoxon ranksum test P-value for gene set overrepresentation: 9.97e-01
Mean rank of genes in gene set: 7897.16
Median rank of genes in gene set: 8256.5
Rank on gene expression program of top 30 genes in gene set:
| Genes | Weight | Rank | GTEx | DepMap | Descartes | Mean.Counts | Mean.TPM |
|---|---|---|---|---|---|---|---|
| GRM7 | 0.0004505 | 1227 | GTEx | DepMap | Descartes | 0.00 | 0.00 |
| MGAT4C | 0.0002948 | 1705 | GTEx | DepMap | Descartes | 0.03 | 0.67 |
| EML6 | 0.0001995 | 2155 | GTEx | DepMap | Descartes | 0.02 | 1.07 |
| ST18 | 0.0001426 | 2514 | GTEx | DepMap | Descartes | 0.00 | 0.00 |
| GCH1 | -0.0000196 | 4611 | GTEx | DepMap | Descartes | 0.11 | 8.30 |
| DGKK | -0.0000197 | 4617 | GTEx | DepMap | Descartes | 0.00 | 0.00 |
| LAMA3 | -0.0000240 | 4726 | GTEx | DepMap | Descartes | 0.00 | 0.00 |
| TENM1 | -0.0000445 | 5325 | GTEx | DepMap | Descartes | 0.05 | NA |
| TBX20 | -0.0000613 | 5809 | GTEx | DepMap | Descartes | 0.00 | 0.00 |
| CDH12 | -0.0000759 | 6243 | GTEx | DepMap | Descartes | 0.00 | 0.00 |
| SORCS3 | -0.0000778 | 6302 | GTEx | DepMap | Descartes | 0.00 | 0.00 |
| SLC24A2 | -0.0000827 | 6439 | GTEx | DepMap | Descartes | 0.00 | 0.00 |
| CNTN3 | -0.0000864 | 6541 | GTEx | DepMap | Descartes | 0.00 | 0.00 |
| SLC35F3 | -0.0000923 | 6711 | GTEx | DepMap | Descartes | 0.00 | 0.00 |
| CCSER1 | -0.0000925 | 6719 | GTEx | DepMap | Descartes | 0.02 | NA |
| PCSK2 | -0.0000968 | 6849 | GTEx | DepMap | Descartes | 0.02 | 0.47 |
| CDH18 | -0.0001091 | 7228 | GTEx | DepMap | Descartes | 0.00 | 0.00 |
| SPOCK3 | -0.0001320 | 7920 | GTEx | DepMap | Descartes | 0.03 | 2.96 |
| KSR2 | -0.0001433 | 8246 | GTEx | DepMap | Descartes | 0.02 | 0.03 |
| FGF14 | -0.0001442 | 8267 | GTEx | DepMap | Descartes | 0.00 | 0.00 |
| FAM155A | -0.0001454 | 8306 | GTEx | DepMap | Descartes | 0.11 | 0.94 |
| GRID2 | -0.0001463 | 8326 | GTEx | DepMap | Descartes | 0.00 | 0.00 |
| AGBL4 | -0.0001485 | 8386 | GTEx | DepMap | Descartes | 0.00 | 0.00 |
| GALNTL6 | -0.0001515 | 8478 | GTEx | DepMap | Descartes | 0.00 | 0.00 |
| NTNG1 | -0.0001752 | 9151 | GTEx | DepMap | Descartes | 0.00 | 0.00 |
| PACRG | -0.0001890 | 9467 | GTEx | DepMap | Descartes | 0.00 | 0.00 |
| SLC18A1 | -0.0002003 | 9771 | GTEx | DepMap | Descartes | 0.02 | 1.91 |
| UNC80 | -0.0002062 | 9917 | GTEx | DepMap | Descartes | 0.00 | 0.00 |
| ROBO1 | -0.0002087 | 9978 | GTEx | DepMap | Descartes | 0.11 | 1.90 |
| KCTD16 | -0.0002720 | 11149 | GTEx | DepMap | Descartes | 0.16 | 1.32 |
Descartes erythroblasts markers
Top 50 marker genes of erythroblasts cells in the Decartes fetal adrenal single cell map (https://atlas.brotmanbaty.org/bbi/human-gene-expression-during-development/cell/erythroblasts/in/adrenal)
Wilcoxon ranksum test P-value for gene set overrepresentation: 3.13e-01
Mean rank of genes in gene set: 5946.86
Median rank of genes in gene set: 6904
Rank on gene expression program of top 30 genes in gene set:
| Genes | Weight | Rank | GTEx | DepMap | Descartes | Mean.Counts | Mean.TPM |
|---|---|---|---|---|---|---|---|
| SELENBP1 | 0.0040769 | 127 | GTEx | DepMap | Descartes | 0.30 | 35.77 |
| MARCH3 | 0.0008772 | 637 | GTEx | DepMap | Descartes | 0.19 | NA |
| BLVRB | 0.0006466 | 884 | GTEx | DepMap | Descartes | 1.25 | 174.01 |
| SLC25A37 | 0.0005049 | 1108 | GTEx | DepMap | Descartes | 0.38 | 23.03 |
| CPOX | 0.0003811 | 1400 | GTEx | DepMap | Descartes | 0.09 | 10.66 |
| CAT | 0.0001697 | 2324 | GTEx | DepMap | Descartes | 0.33 | 35.22 |
| MICAL2 | 0.0001691 | 2329 | GTEx | DepMap | Descartes | 0.09 | 3.17 |
| TRAK2 | 0.0001320 | 2595 | GTEx | DepMap | Descartes | 0.05 | 2.13 |
| ALAS2 | 0.0001085 | 2797 | GTEx | DepMap | Descartes | 0.00 | 0.00 |
| GYPC | 0.0000670 | 3216 | GTEx | DepMap | Descartes | 1.03 | 126.54 |
| ABCB10 | 0.0000273 | 3692 | GTEx | DepMap | Descartes | 0.08 | 3.80 |
| SLC4A1 | 0.0000010 | 4120 | GTEx | DepMap | Descartes | 0.00 | 0.00 |
| RHD | -0.0000088 | 4307 | GTEx | DepMap | Descartes | 0.00 | 0.00 |
| DENND4A | -0.0000213 | 4654 | GTEx | DepMap | Descartes | 0.11 | 2.16 |
| SLC25A21 | -0.0000985 | 6904 | GTEx | DepMap | Descartes | 0.00 | 0.00 |
| XPO7 | -0.0001071 | 7173 | GTEx | DepMap | Descartes | 0.03 | 0.93 |
| RGS6 | -0.0001191 | 7521 | GTEx | DepMap | Descartes | 0.02 | 1.02 |
| TFR2 | -0.0001213 | 7589 | GTEx | DepMap | Descartes | 0.00 | 0.00 |
| SPECC1 | -0.0001279 | 7810 | GTEx | DepMap | Descartes | 0.11 | 2.61 |
| SPTB | -0.0001415 | 8193 | GTEx | DepMap | Descartes | 0.00 | 0.00 |
| TMCC2 | -0.0001458 | 8313 | GTEx | DepMap | Descartes | 0.02 | 0.29 |
| ANK1 | -0.0001695 | 9000 | GTEx | DepMap | Descartes | 0.00 | 0.00 |
| SNCA | -0.0001919 | 9554 | GTEx | DepMap | Descartes | 0.30 | 13.56 |
| GCLC | -0.0001994 | 9745 | GTEx | DepMap | Descartes | 0.06 | 4.89 |
| SOX6 | -0.0002007 | 9786 | GTEx | DepMap | Descartes | 0.05 | 0.95 |
| RAPGEF2 | -0.0002679 | 11100 | GTEx | DepMap | Descartes | 0.09 | 2.57 |
| EPB41 | -0.0003119 | 11590 | GTEx | DepMap | Descartes | 0.03 | 0.97 |
| FECH | -0.0003163 | 11625 | GTEx | DepMap | Descartes | 0.02 | 0.84 |
| TSPAN5 | -0.0005113 | 12366 | GTEx | DepMap | Descartes | 0.30 | 14.42 |
| NA | NA | NA | NA | NA | NA | NA | NA |
Descartes myeloid markers
Top 50 marker genes of myeloid cells in the Decartes fetal adrenal single cell map (https://atlas.brotmanbaty.org/bbi/human-gene-expression-during-development/cell/myeloid/in/adrenal)
Wilcoxon ranksum test P-value for gene set overrepresentation: 4.22e-01
Mean rank of genes in gene set: 6159.47
Median rank of genes in gene set: 7289
Rank on gene expression program of top 30 genes in gene set:
| Genes | Weight | Rank | GTEx | DepMap | Descartes | Mean.Counts | Mean.TPM |
|---|---|---|---|---|---|---|---|
| CST3 | 0.0039737 | 133 | GTEx | DepMap | Descartes | 19.31 | 1717.63 |
| AXL | 0.0023925 | 240 | GTEx | DepMap | Descartes | 0.89 | 50.75 |
| HRH1 | 0.0016394 | 368 | GTEx | DepMap | Descartes | 0.09 | 7.13 |
| CTSC | 0.0013973 | 418 | GTEx | DepMap | Descartes | 3.98 | 113.92 |
| RGL1 | 0.0003937 | 1368 | GTEx | DepMap | Descartes | 0.25 | 16.77 |
| SLC9A9 | 0.0003444 | 1520 | GTEx | DepMap | Descartes | 0.09 | 4.15 |
| FGL2 | 0.0003300 | 1580 | GTEx | DepMap | Descartes | 0.88 | 26.08 |
| ITPR2 | 0.0001814 | 2256 | GTEx | DepMap | Descartes | 0.38 | 3.90 |
| WWP1 | 0.0001603 | 2393 | GTEx | DepMap | Descartes | 0.20 | 7.55 |
| IFNGR1 | 0.0001515 | 2465 | GTEx | DepMap | Descartes | 0.59 | 47.27 |
| ATP8B4 | 0.0001382 | 2560 | GTEx | DepMap | Descartes | 0.06 | 2.31 |
| RBPJ | 0.0000786 | 3091 | GTEx | DepMap | Descartes | 0.45 | 19.37 |
| FGD2 | 0.0000087 | 3989 | GTEx | DepMap | Descartes | 0.08 | 3.21 |
| CTSS | 0.0000086 | 3994 | GTEx | DepMap | Descartes | 1.45 | 37.12 |
| ADAP2 | -0.0000005 | 4144 | GTEx | DepMap | Descartes | 0.19 | 12.54 |
| CPVL | -0.0000124 | 4416 | GTEx | DepMap | Descartes | 0.58 | 25.12 |
| CD74 | -0.0000188 | 4593 | GTEx | DepMap | Descartes | 11.38 | 580.64 |
| CTSD | -0.0000360 | 5072 | GTEx | DepMap | Descartes | 4.67 | 266.83 |
| PTPRE | -0.0001071 | 7174 | GTEx | DepMap | Descartes | 0.23 | 4.34 |
| MERTK | -0.0001150 | 7404 | GTEx | DepMap | Descartes | 0.25 | 4.57 |
| SPP1 | -0.0001179 | 7490 | GTEx | DepMap | Descartes | 0.19 | 26.62 |
| MSR1 | -0.0001193 | 7526 | GTEx | DepMap | Descartes | 0.14 | 3.45 |
| SFMBT2 | -0.0001361 | 8052 | GTEx | DepMap | Descartes | 0.03 | 0.62 |
| LGMN | -0.0001448 | 8288 | GTEx | DepMap | Descartes | 1.92 | 101.50 |
| CTSB | -0.0001523 | 8502 | GTEx | DepMap | Descartes | 3.44 | 115.76 |
| CD14 | -0.0001550 | 8579 | GTEx | DepMap | Descartes | 2.58 | 153.59 |
| FMN1 | -0.0001650 | 8872 | GTEx | DepMap | Descartes | 0.06 | 0.40 |
| CSF1R | -0.0001875 | 9441 | GTEx | DepMap | Descartes | 0.17 | 3.82 |
| CYBB | -0.0001876 | 9443 | GTEx | DepMap | Descartes | 0.45 | 8.98 |
| MARCH1 | -0.0001910 | 9529 | GTEx | DepMap | Descartes | 0.12 | NA |
Descartes Schwann markers
Top 50 marker genes of Schwann cells in the Decartes fetal adrenal single cell map (https://atlas.brotmanbaty.org/bbi/human-gene-expression-during-development/cell/schwann/in/adrenal)
Wilcoxon ranksum test P-value for gene set overrepresentation: 2.18e-01
Mean rank of genes in gene set: 5850.52
Median rank of genes in gene set: 5936
Rank on gene expression program of top 30 genes in gene set:
| Genes | Weight | Rank | GTEx | DepMap | Descartes | Mean.Counts | Mean.TPM |
|---|---|---|---|---|---|---|---|
| EGFLAM | 0.0017089 | 348 | GTEx | DepMap | Descartes | 0.28 | 10.65 |
| SFRP1 | 0.0014644 | 399 | GTEx | DepMap | Descartes | 0.55 | 39.53 |
| VIM | 0.0011281 | 507 | GTEx | DepMap | Descartes | 19.64 | 1771.88 |
| LAMA4 | 0.0010229 | 553 | GTEx | DepMap | Descartes | 1.23 | 33.38 |
| ADAMTS5 | 0.0008798 | 635 | GTEx | DepMap | Descartes | 0.22 | 3.07 |
| PMP22 | 0.0006155 | 922 | GTEx | DepMap | Descartes | 1.89 | 303.62 |
| VCAN | 0.0005126 | 1097 | GTEx | DepMap | Descartes | 1.27 | 29.71 |
| GAS7 | 0.0004525 | 1222 | GTEx | DepMap | Descartes | 0.20 | 8.51 |
| LAMC1 | 0.0004116 | 1327 | GTEx | DepMap | Descartes | 0.62 | 20.05 |
| KCTD12 | 0.0003117 | 1646 | GTEx | DepMap | Descartes | 0.61 | 20.64 |
| COL5A2 | 0.0002901 | 1721 | GTEx | DepMap | Descartes | 0.39 | 14.24 |
| PLCE1 | 0.0001975 | 2172 | GTEx | DepMap | Descartes | 0.03 | 0.97 |
| PLP1 | 0.0001319 | 2596 | GTEx | DepMap | Descartes | 0.19 | 21.11 |
| SCN7A | 0.0001156 | 2738 | GTEx | DepMap | Descartes | 0.28 | 11.49 |
| PTN | 0.0000802 | 3074 | GTEx | DepMap | Descartes | 0.30 | 51.27 |
| HMGA2 | 0.0000712 | 3169 | GTEx | DepMap | Descartes | 0.00 | 0.00 |
| OLFML2A | 0.0000528 | 3379 | GTEx | DepMap | Descartes | 0.36 | 11.58 |
| IL1RAPL2 | 0.0000298 | 3651 | GTEx | DepMap | Descartes | 0.00 | 0.00 |
| IL1RAPL1 | 0.0000024 | 4098 | GTEx | DepMap | Descartes | 0.03 | 2.18 |
| TRPM3 | -0.0000362 | 5081 | GTEx | DepMap | Descartes | 0.02 | 0.09 |
| MDGA2 | -0.0000420 | 5239 | GTEx | DepMap | Descartes | 0.00 | 0.00 |
| COL25A1 | -0.0000609 | 5795 | GTEx | DepMap | Descartes | 0.00 | 0.00 |
| LRRTM4 | -0.0000712 | 6077 | GTEx | DepMap | Descartes | 0.03 | 3.12 |
| STARD13 | -0.0000748 | 6191 | GTEx | DepMap | Descartes | 0.16 | 7.16 |
| ERBB4 | -0.0000759 | 6240 | GTEx | DepMap | Descartes | 0.00 | 0.00 |
| PTPRZ1 | -0.0000858 | 6527 | GTEx | DepMap | Descartes | 0.00 | 0.00 |
| GRIK3 | -0.0001085 | 7208 | GTEx | DepMap | Descartes | 0.00 | 0.00 |
| FIGN | -0.0001136 | 7375 | GTEx | DepMap | Descartes | 0.03 | 0.63 |
| SLC35F1 | -0.0001278 | 7808 | GTEx | DepMap | Descartes | 0.02 | 0.73 |
| XKR4 | -0.0001535 | 8532 | GTEx | DepMap | Descartes | 0.00 | 0.00 |
Descartes Megakaryocytes markers
Top 50 marker genes of Megakaryocytes cells in the Decartes fetal adrenal single cell map (https://atlas.brotmanbaty.org/bbi/human-gene-expression-during-development/cell/megakaryocytes/in/adrenal)
Wilcoxon ranksum test P-value for gene set overrepresentation: 1.16e-02
Mean rank of genes in gene set: 5051.82
Median rank of genes in gene set: 4113
Rank on gene expression program of top 30 genes in gene set:
| Genes | Weight | Rank | GTEx | DepMap | Descartes | Mean.Counts | Mean.TPM |
|---|---|---|---|---|---|---|---|
| GSN | 0.0121915 | 27 | GTEx | DepMap | Descartes | 17.66 | 955.42 |
| LTBP1 | 0.0054337 | 92 | GTEx | DepMap | Descartes | 0.48 | 23.05 |
| CD9 | 0.0022801 | 257 | GTEx | DepMap | Descartes | 1.61 | 210.91 |
| SLC2A3 | 0.0018515 | 323 | GTEx | DepMap | Descartes | 1.22 | 80.94 |
| THBS1 | 0.0016323 | 369 | GTEx | DepMap | Descartes | 2.20 | 74.86 |
| ANGPT1 | 0.0009144 | 611 | GTEx | DepMap | Descartes | 0.11 | 8.28 |
| STOM | 0.0007981 | 692 | GTEx | DepMap | Descartes | 1.02 | 66.23 |
| ACTN1 | 0.0006938 | 824 | GTEx | DepMap | Descartes | 0.67 | 33.56 |
| MYLK | 0.0006844 | 836 | GTEx | DepMap | Descartes | 0.61 | 12.45 |
| ZYX | 0.0006203 | 912 | GTEx | DepMap | Descartes | 0.53 | 66.06 |
| ACTB | 0.0005095 | 1103 | GTEx | DepMap | Descartes | 21.70 | 2445.52 |
| MYH9 | 0.0004956 | 1128 | GTEx | DepMap | Descartes | 0.84 | 28.27 |
| FLNA | 0.0004394 | 1256 | GTEx | DepMap | Descartes | 1.27 | 35.96 |
| ITGA2B | 0.0003655 | 1454 | GTEx | DepMap | Descartes | 0.00 | 0.00 |
| TPM4 | 0.0002876 | 1729 | GTEx | DepMap | Descartes | 2.58 | 130.11 |
| VCL | 0.0002840 | 1741 | GTEx | DepMap | Descartes | 0.50 | 19.19 |
| MCTP1 | 0.0002624 | 1839 | GTEx | DepMap | Descartes | 0.19 | 6.33 |
| MMRN1 | 0.0000965 | 2916 | GTEx | DepMap | Descartes | 0.22 | 10.47 |
| RAP1B | 0.0000920 | 2959 | GTEx | DepMap | Descartes | 0.91 | 15.31 |
| PDE3A | 0.0000915 | 2968 | GTEx | DepMap | Descartes | 0.14 | 4.78 |
| STON2 | 0.0000683 | 3197 | GTEx | DepMap | Descartes | 0.03 | 1.49 |
| TMSB4X | 0.0000160 | 3860 | GTEx | DepMap | Descartes | 90.00 | 11041.89 |
| GP1BA | 0.0000016 | 4113 | GTEx | DepMap | Descartes | 0.00 | 0.00 |
| P2RX1 | -0.0000423 | 5250 | GTEx | DepMap | Descartes | 0.02 | 0.65 |
| MED12L | -0.0000654 | 5930 | GTEx | DepMap | Descartes | 0.03 | 1.04 |
| ITGB3 | -0.0000759 | 6242 | GTEx | DepMap | Descartes | 0.00 | 0.00 |
| INPP4B | -0.0000778 | 6301 | GTEx | DepMap | Descartes | 0.06 | 3.42 |
| FLI1 | -0.0001108 | 7289 | GTEx | DepMap | Descartes | 0.06 | 1.83 |
| TLN1 | -0.0001109 | 7290 | GTEx | DepMap | Descartes | 0.73 | 17.91 |
| TRPC6 | -0.0001134 | 7366 | GTEx | DepMap | Descartes | 0.00 | 0.00 |
Descartes Lyphoid markers
Top 50 marker genes of Lyphoid cells in the Decartes fetal adrenal single cell map (https://atlas.brotmanbaty.org/bbi/human-gene-expression-during-development/cell/lymphoid/in/adrenal)
Wilcoxon ranksum test P-value for gene set overrepresentation: 1.00e+00
Mean rank of genes in gene set: 8350.74
Median rank of genes in gene set: 9453
Rank on gene expression program of top 30 genes in gene set:
| Genes | Weight | Rank | GTEx | DepMap | Descartes | Mean.Counts | Mean.TPM |
|---|---|---|---|---|---|---|---|
| ABLIM1 | 0.0013187 | 441 | GTEx | DepMap | Descartes | 0.48 | 16.33 |
| ARID5B | 0.0013170 | 443 | GTEx | DepMap | Descartes | 1.28 | 50.01 |
| NCALD | 0.0010703 | 526 | GTEx | DepMap | Descartes | 0.11 | 13.07 |
| SP100 | 0.0005911 | 962 | GTEx | DepMap | Descartes | 0.73 | 40.39 |
| PLEKHA2 | 0.0002370 | 1945 | GTEx | DepMap | Descartes | 0.08 | 3.82 |
| B2M | 0.0002126 | 2075 | GTEx | DepMap | Descartes | 68.42 | 6084.43 |
| MBNL1 | 0.0001004 | 2871 | GTEx | DepMap | Descartes | 0.56 | 19.86 |
| SORL1 | -0.0000212 | 4653 | GTEx | DepMap | Descartes | 0.16 | 4.39 |
| MCTP2 | -0.0000393 | 5151 | GTEx | DepMap | Descartes | 0.09 | 2.50 |
| ARHGAP15 | -0.0000568 | 5680 | GTEx | DepMap | Descartes | 0.17 | 20.22 |
| FOXP1 | -0.0000823 | 6428 | GTEx | DepMap | Descartes | 0.50 | 12.44 |
| SAMD3 | -0.0001132 | 7354 | GTEx | DepMap | Descartes | 0.02 | 1.30 |
| CCL5 | -0.0001326 | 7942 | GTEx | DepMap | Descartes | 0.12 | 15.77 |
| ANKRD44 | -0.0001340 | 7983 | GTEx | DepMap | Descartes | 0.08 | 2.48 |
| WIPF1 | -0.0001480 | 8375 | GTEx | DepMap | Descartes | 0.39 | 16.81 |
| PITPNC1 | -0.0001592 | 8712 | GTEx | DepMap | Descartes | 0.16 | 2.79 |
| BACH2 | -0.0001594 | 8717 | GTEx | DepMap | Descartes | 0.06 | 1.24 |
| RCSD1 | -0.0001616 | 8771 | GTEx | DepMap | Descartes | 0.11 | 4.05 |
| PRKCH | -0.0001735 | 9109 | GTEx | DepMap | Descartes | 0.09 | 1.70 |
| PDE3B | -0.0001760 | 9171 | GTEx | DepMap | Descartes | 0.05 | 0.79 |
| CCND3 | -0.0001859 | 9405 | GTEx | DepMap | Descartes | 0.28 | 31.68 |
| SKAP1 | -0.0001899 | 9501 | GTEx | DepMap | Descartes | 0.02 | 0.56 |
| SCML4 | -0.0002082 | 9961 | GTEx | DepMap | Descartes | 0.00 | 0.00 |
| ITPKB | -0.0002115 | 10045 | GTEx | DepMap | Descartes | 0.03 | 1.32 |
| DOCK10 | -0.0002174 | 10160 | GTEx | DepMap | Descartes | 0.09 | 3.78 |
| IKZF1 | -0.0002263 | 10365 | GTEx | DepMap | Descartes | 0.05 | 0.52 |
| CELF2 | -0.0002292 | 10423 | GTEx | DepMap | Descartes | 0.75 | 20.85 |
| MSN | -0.0002360 | 10546 | GTEx | DepMap | Descartes | 0.75 | 36.85 |
| LEF1 | -0.0002525 | 10863 | GTEx | DepMap | Descartes | 0.06 | 4.39 |
| ETS1 | -0.0002575 | 10935 | GTEx | DepMap | Descartes | 0.28 | 8.75 |
Below shows the ranks on this GEP for immune marker gene lists curated by CellTypist (https://www.celltypist.org/encyclopedia).
High ranks indicate this gene is a driver of this GEP.
These curated gene list are ranked by P-value (on this GEP) of their constituent genes.
The Mean Count column shows the mean read count in cells scoring highly (H > 50) on this gene expression program.
Fibroblasts: Fibroblasts (model markers)
the most common cells of connective tissues which synthesize the extracellular matrix and collagen to maintain tissue homeostasis:
Wilcoxon ranksum test P-value for gene set overrepresentation: 6.03e-05
Mean rank of genes in gene set: 1633.44
Rank on gene expression program of genes in gene set:
| Genes | Weight | Rank | GTEx | DepMap | Decartes | Mean.Counts | Mean.TPM |
|---|---|---|---|---|---|---|---|
| ANGPTL1 | 0.0128715 | 24 | GTEx | DepMap | Descartes | 0.30 | 31.38 |
| F10 | 0.0100318 | 42 | GTEx | DepMap | Descartes | 0.31 | 79.50 |
| PRRX1 | 0.0045333 | 117 | GTEx | DepMap | Descartes | 0.52 | 43.35 |
| OLFML1 | 0.0022344 | 263 | GTEx | DepMap | Descartes | 0.19 | 19.63 |
| SMOC2 | 0.0021796 | 272 | GTEx | DepMap | Descartes | 1.09 | 107.72 |
| NTRK2 | 0.0017479 | 343 | GTEx | DepMap | Descartes | 0.53 | 17.79 |
| SFRP1 | 0.0014644 | 399 | GTEx | DepMap | Descartes | 0.55 | 39.53 |
| PDGFRA | 0.0006334 | 894 | GTEx | DepMap | Descartes | 0.53 | 23.75 |
| EBF2 | -0.0004905 | 12347 | GTEx | DepMap | Descartes | 0.27 | 17.86 |
Fibroblasts: Fibroblasts (curated markers)
the most common cells of connective tissues which synthesize the extracellular matrix and collagen to maintain tissue homeostasis:
Wilcoxon ranksum test P-value for gene set overrepresentation: 2.43e-03
Mean rank of genes in gene set: 384.33
Rank on gene expression program of genes in gene set:
| Genes | Weight | Rank | GTEx | DepMap | Decartes | Mean.Counts | Mean.TPM |
|---|---|---|---|---|---|---|---|
| DCN | 0.0275596 | 6 | GTEx | DepMap | Descartes | 30.11 | 1581.50 |
| COL1A2 | 0.0029881 | 187 | GTEx | DepMap | Descartes | 7.55 | 393.42 |
| COL1A1 | 0.0005916 | 960 | GTEx | DepMap | Descartes | 9.50 | 450.92 |
DC: Transitional DC (curated markers)
immature dendritic cells which follow dendritic cell precursors and are committed to the mature dendritic cells:
Wilcoxon ranksum test P-value for gene set overrepresentation: 8.83e-03
Mean rank of genes in gene set: 197.5
Rank on gene expression program of genes in gene set:
| Genes | Weight | Rank | GTEx | DepMap | Decartes | Mean.Counts | Mean.TPM |
|---|---|---|---|---|---|---|---|
| KLF4 | 0.0035044 | 155 | GTEx | DepMap | Descartes | 1.33 | 120.38 |
| AXL | 0.0023925 | 240 | GTEx | DepMap | Descartes | 0.89 | 50.75 |