Program: 15. Cancer Associated Fibroblast.
Submit a comment on this gene expression program’s interpretation: CLICK
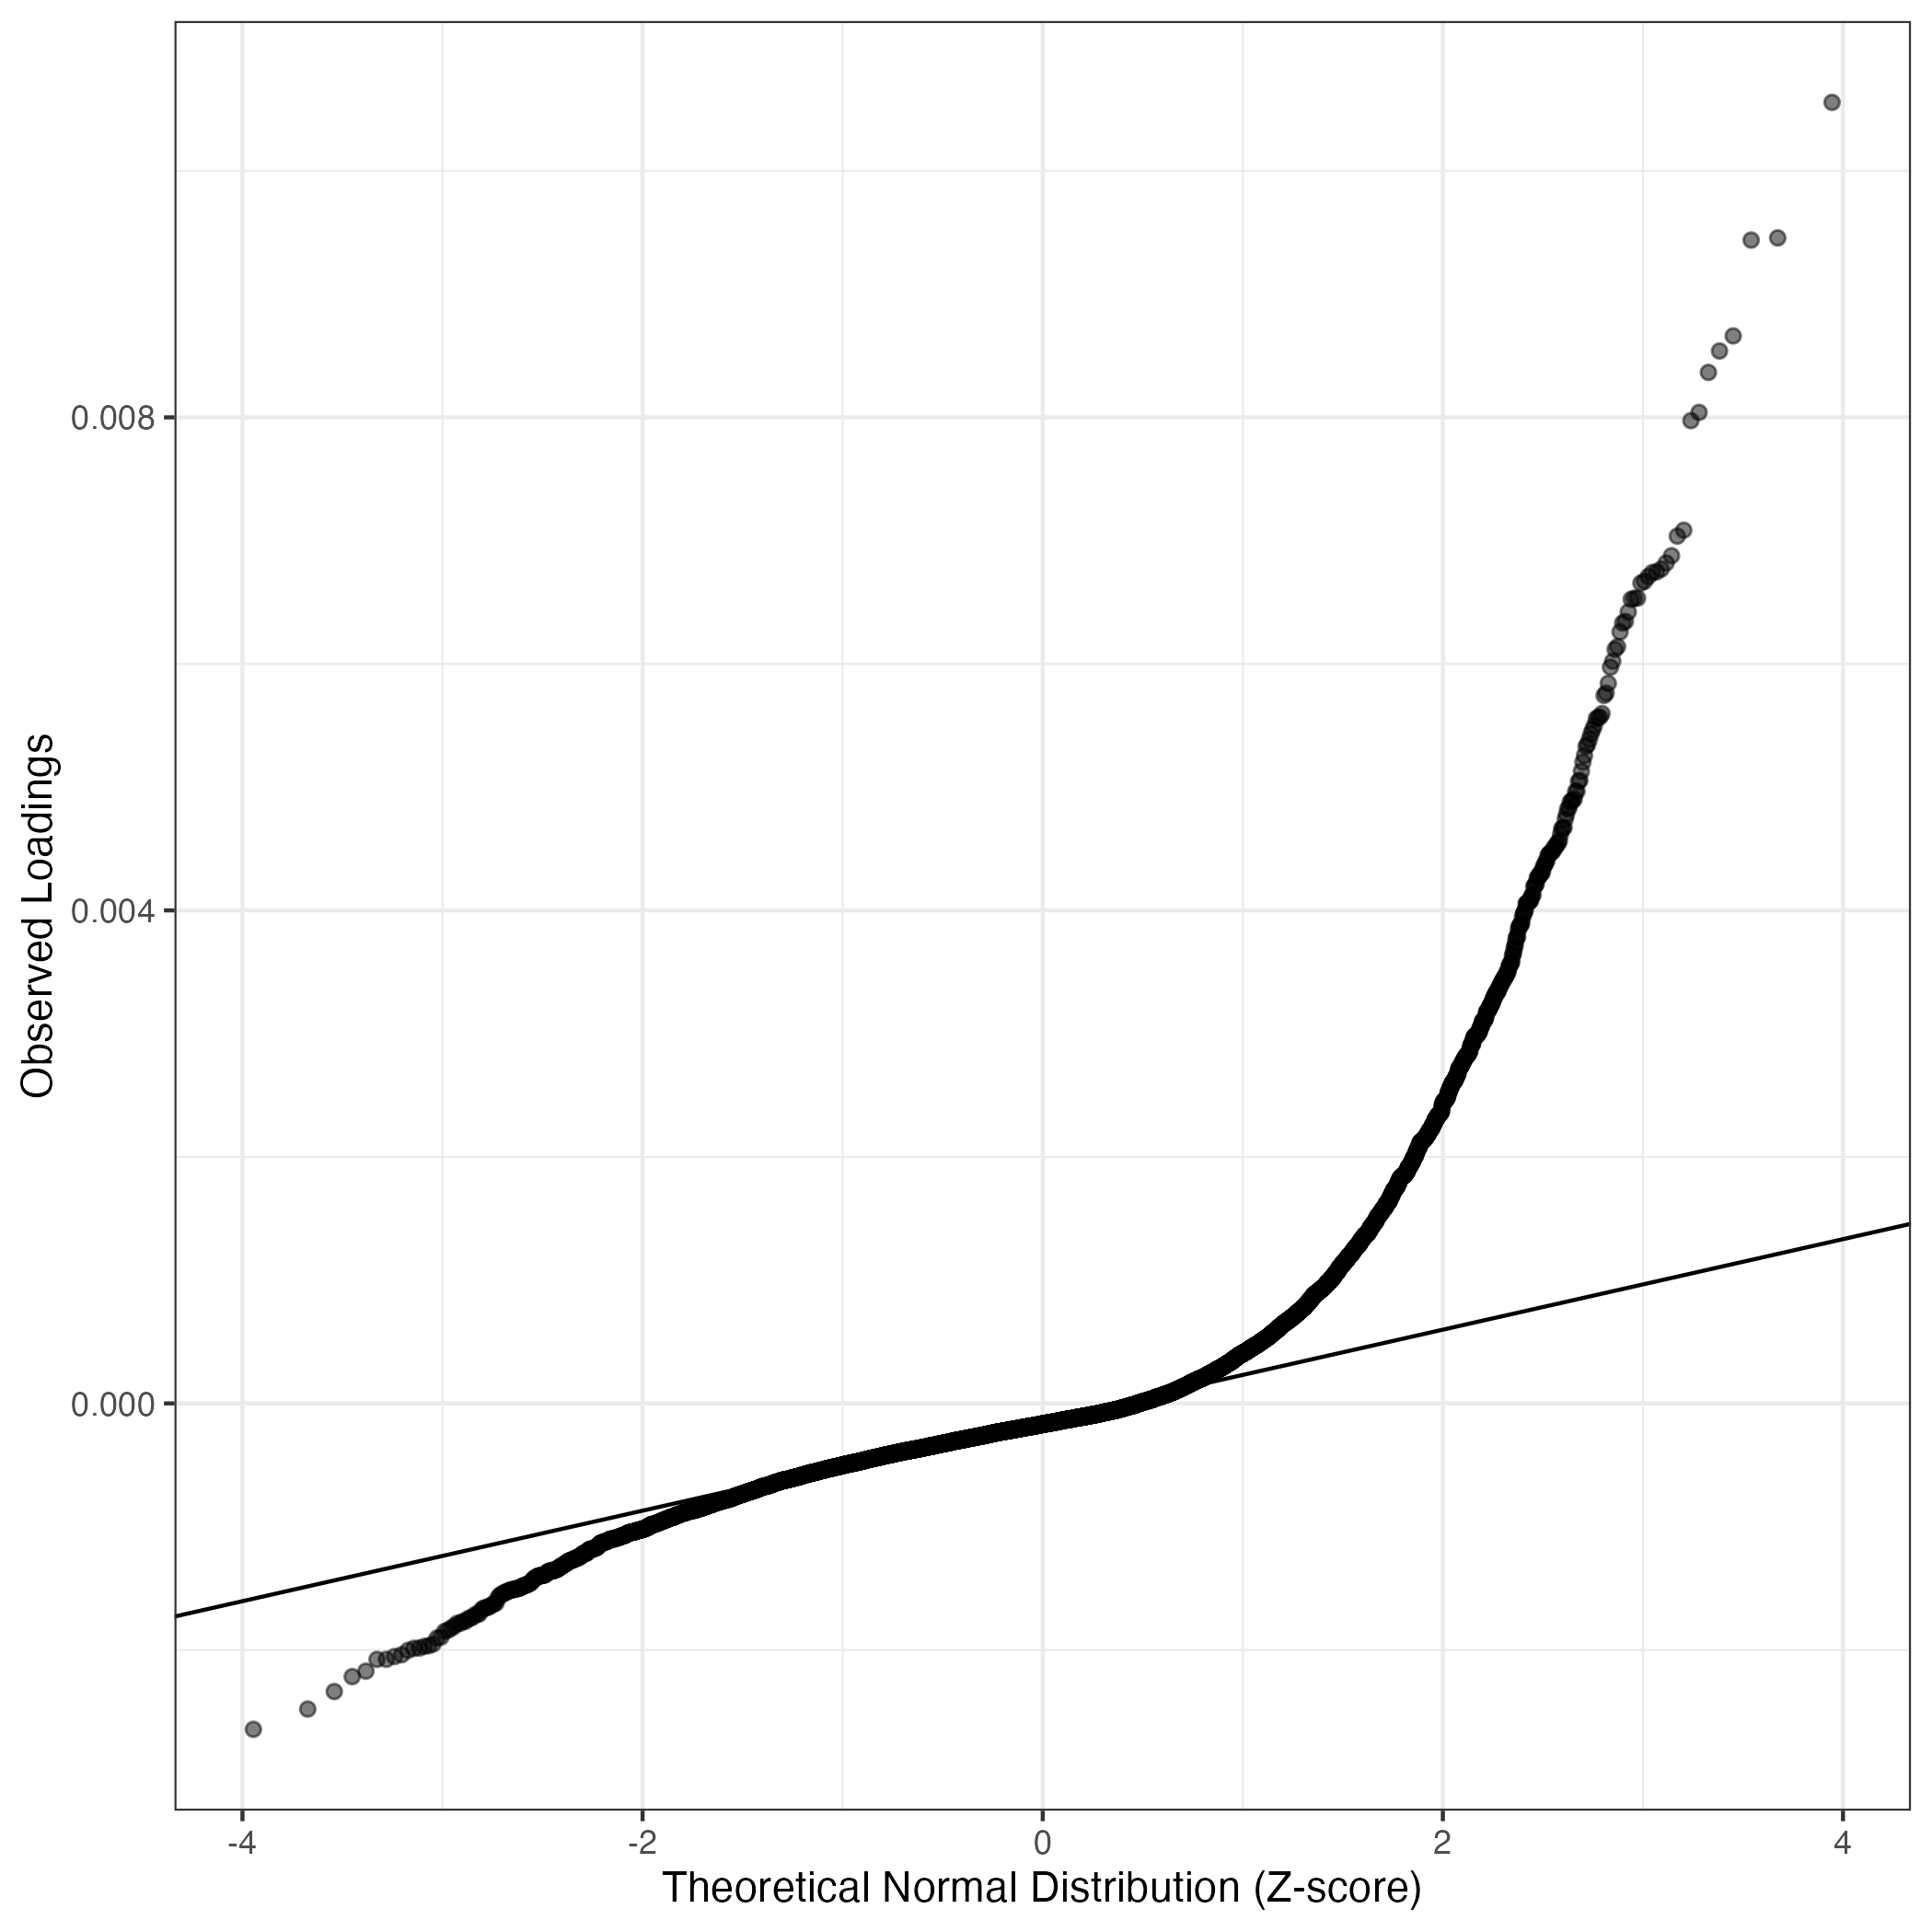
QQ-plot of gene loadings, averaged over both independent splits of the data
This plot highlights the relative contribution of each gene to the GEP
Top genes driving this program. Note: Decartes website is buggy, try refreshing. Also, Decartes fetal adrenal data have been collected at specific time points (89-122 days), all possible cell types of interest may not be represented, do not overinterpret. The Mean Count column shows the mean read count in cells scoring highly (H > 50) on this gene expression program (currently only calculated for the cells in the first 50/50 split of the data).
Note: Decartes website is buggy, try refreshing. Also, Decartes fetal adrenal data have been collected at specific time points (89-122 days), all possible cell types of interest may not be represented, do not overinterpret.
The Mean Count column shows the mean read count in cells scoring highly (H > 50) on this gene expression program.
| Gene | Loading | Gene.Name | GTEx | DepMap | Descartes | Mean.Counts | Mean.Tpm | |
|---|---|---|---|---|---|---|---|---|
| 1 | CYP1B1 | 0.0105560 | cytochrome P450 family 1 subfamily B member 1 | GTEx | DepMap | Descartes | 31.88 | 1734.29 |
| 2 | EMP1 | 0.0094562 | epithelial membrane protein 1 | GTEx | DepMap | Descartes | 39.52 | 1947.89 |
| 3 | SPRY2 | 0.0094386 | sprouty RTK signaling antagonist 2 | GTEx | DepMap | Descartes | 8.42 | 925.09 |
| 4 | LIF | 0.0086612 | LIF interleukin 6 family cytokine | GTEx | DepMap | Descartes | 15.10 | 1147.66 |
| 5 | HMOX1 | 0.0085386 | heme oxygenase 1 | GTEx | DepMap | Descartes | 17.55 | 3322.44 |
| 6 | DIO2 | 0.0083648 | iodothyronine deiodinase 2 | GTEx | DepMap | Descartes | 5.40 | 260.46 |
| 7 | CCL2 | 0.0080405 | C-C motif chemokine ligand 2 | GTEx | DepMap | Descartes | 69.43 | 21560.64 |
| 8 | LUM | 0.0079736 | lumican | GTEx | DepMap | Descartes | 48.81 | 4979.99 |
| 9 | F3 | 0.0070846 | coagulation factor III, tissue factor | GTEx | DepMap | Descartes | 6.59 | 888.37 |
| 10 | TXNRD1 | 0.0070366 | thioredoxin reductase 1 | GTEx | DepMap | Descartes | 6.87 | 475.12 |
| 11 | BHLHE41 | 0.0068776 | basic helix-loop-helix family member e41 | GTEx | DepMap | Descartes | 2.41 | 186.25 |
| 12 | FRMD6 | 0.0068186 | FERM domain containing 6 | GTEx | DepMap | Descartes | 4.72 | 234.68 |
| 13 | SLC4A7 | 0.0067690 | solute carrier family 4 member 7 | GTEx | DepMap | Descartes | 5.51 | 203.18 |
| 14 | CDC42EP2 | 0.0067468 | CDC42 effector protein 2 | GTEx | DepMap | Descartes | 1.70 | 232.69 |
| 15 | TENM2 | 0.0067411 | teneurin transmembrane protein 2 | GTEx | DepMap | Descartes | 4.03 | NA |
| 16 | THBS1 | 0.0067087 | thrombospondin 1 | GTEx | DepMap | Descartes | 38.07 | 1452.17 |
| 17 | S1PR3 | 0.0066703 | sphingosine-1-phosphate receptor 3 | GTEx | DepMap | Descartes | 6.04 | 202.18 |
| 18 | DCN | 0.0066557 | decorin | GTEx | DepMap | Descartes | 65.98 | 2707.49 |
| 19 | EGFR | 0.0065333 | epidermal growth factor receptor | GTEx | DepMap | Descartes | 6.70 | 211.65 |
| 20 | CLDN1 | 0.0065323 | claudin 1 | GTEx | DepMap | Descartes | 5.07 | 462.84 |
| 21 | LAMA2 | 0.0065236 | laminin subunit alpha 2 | GTEx | DepMap | Descartes | 6.35 | NA |
| 22 | FN1 | 0.0064211 | fibronectin 1 | GTEx | DepMap | Descartes | 26.36 | 784.78 |
| 23 | TNFRSF12A | 0.0063445 | TNF receptor superfamily member 12A | GTEx | DepMap | Descartes | 4.94 | 855.81 |
| 24 | TIPARP | 0.0063319 | TCDD inducible poly(ADP-ribose) polymerase | GTEx | DepMap | Descartes | 8.83 | 589.92 |
| 25 | FRMD4A | 0.0062592 | FERM domain containing 4A | GTEx | DepMap | Descartes | 3.68 | 132.51 |
| 26 | CFH | 0.0061403 | complement factor H | GTEx | DepMap | Descartes | 10.59 | 453.59 |
| 27 | SERPINE1 | 0.0061179 | serpin family E member 1 | GTEx | DepMap | Descartes | 32.71 | 2593.16 |
| 28 | PHLDA1 | 0.0060217 | pleckstrin homology like domain family A member 1 | GTEx | DepMap | Descartes | 15.09 | 474.22 |
| 29 | PRNP | 0.0059731 | prion protein | GTEx | DepMap | Descartes | 8.87 | 1037.29 |
| 30 | RTN4 | 0.0058423 | reticulon 4 | GTEx | DepMap | Descartes | 14.01 | 864.57 |
| 31 | MEST | 0.0057630 | mesoderm specific transcript | GTEx | DepMap | Descartes | 3.47 | 319.00 |
| 32 | GCLM | 0.0057439 | glutamate-cysteine ligase modifier subunit | GTEx | DepMap | Descartes | 4.15 | 254.81 |
| 33 | LIMA1 | 0.0055970 | LIM domain and actin binding 1 | GTEx | DepMap | Descartes | 4.05 | 279.62 |
| 34 | UGDH | 0.0055700 | UDP-glucose 6-dehydrogenase | GTEx | DepMap | Descartes | 6.68 | 645.30 |
| 35 | GSN | 0.0055647 | gelsolin | GTEx | DepMap | Descartes | 22.16 | 1025.64 |
| 36 | CHSY1 | 0.0055561 | chondroitin sulfate synthase 1 | GTEx | DepMap | Descartes | 4.79 | 292.61 |
| 37 | CTSL | 0.0055010 | cathepsin L | GTEx | DepMap | Descartes | 10.97 | NA |
| 38 | BMP8B | 0.0054665 | bone morphogenetic protein 8b | GTEx | DepMap | Descartes | 1.54 | 87.59 |
| 39 | CLMP | 0.0054332 | CXADR like membrane protein | GTEx | DepMap | Descartes | 2.20 | 130.18 |
| 40 | PAMR1 | 0.0053871 | peptidase domain containing associated with muscle regeneration 1 | GTEx | DepMap | Descartes | 2.29 | 159.92 |
| 41 | RND3 | 0.0053463 | Rho family GTPase 3 | GTEx | DepMap | Descartes | 8.73 | 884.18 |
| 42 | OLFML2B | 0.0053294 | olfactomedin like 2B | GTEx | DepMap | Descartes | 6.70 | 566.55 |
| 43 | FGFR1 | 0.0052568 | fibroblast growth factor receptor 1 | GTEx | DepMap | Descartes | 11.87 | 555.91 |
| 44 | OGN | 0.0052020 | osteoglycin | GTEx | DepMap | Descartes | 7.42 | 678.65 |
| 45 | TFPI | 0.0051289 | tissue factor pathway inhibitor | GTEx | DepMap | Descartes | 5.16 | 196.80 |
| 46 | TM4SF1 | 0.0050563 | transmembrane 4 L six family member 1 | GTEx | DepMap | Descartes | 19.49 | 1721.22 |
| 47 | GPC3 | 0.0050450 | glypican 3 | GTEx | DepMap | Descartes | 4.20 | 536.32 |
| 48 | KLHL21 | 0.0049656 | kelch like family member 21 | GTEx | DepMap | Descartes | 5.97 | 260.05 |
| 49 | ANXA1 | 0.0049648 | annexin A1 | GTEx | DepMap | Descartes | 19.94 | 2433.59 |
| 50 | ZBTB21 | 0.0049062 | zinc finger and BTB domain containing 21 | GTEx | DepMap | Descartes | 3.51 | NA |
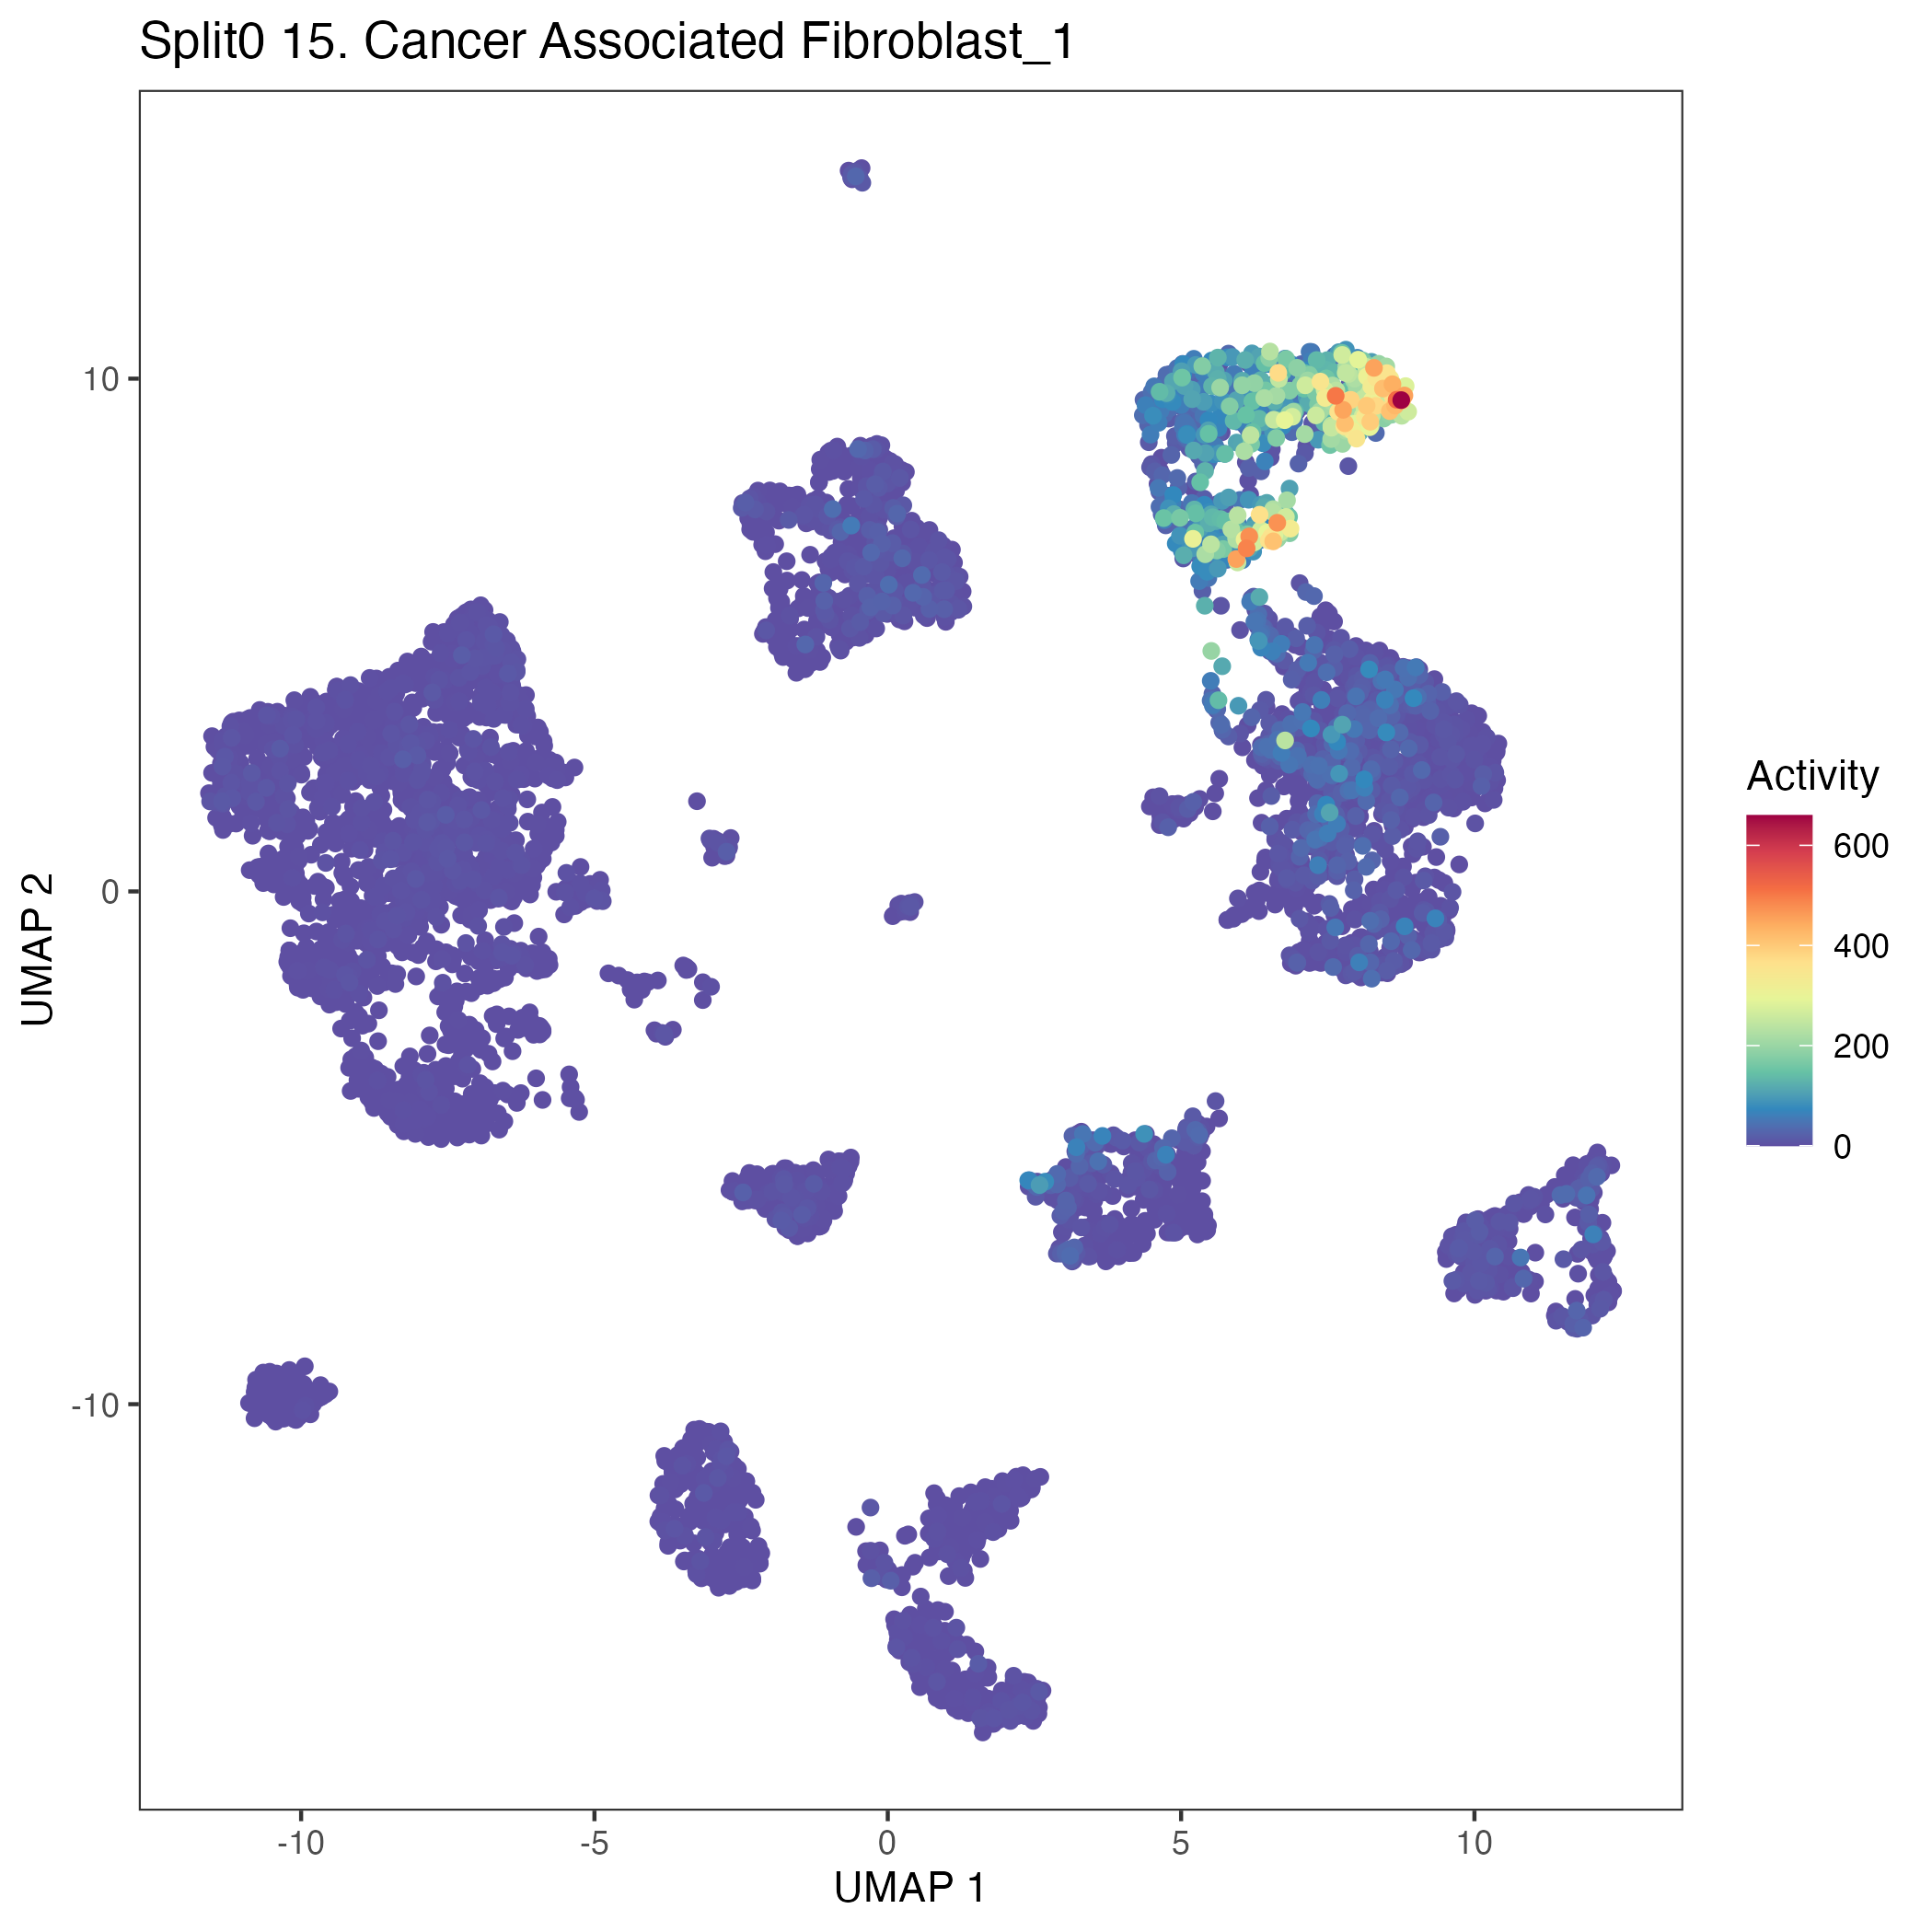
UMAP plots showing activity of gene expression program identified in community:15. Cancer Associated Fibroblast
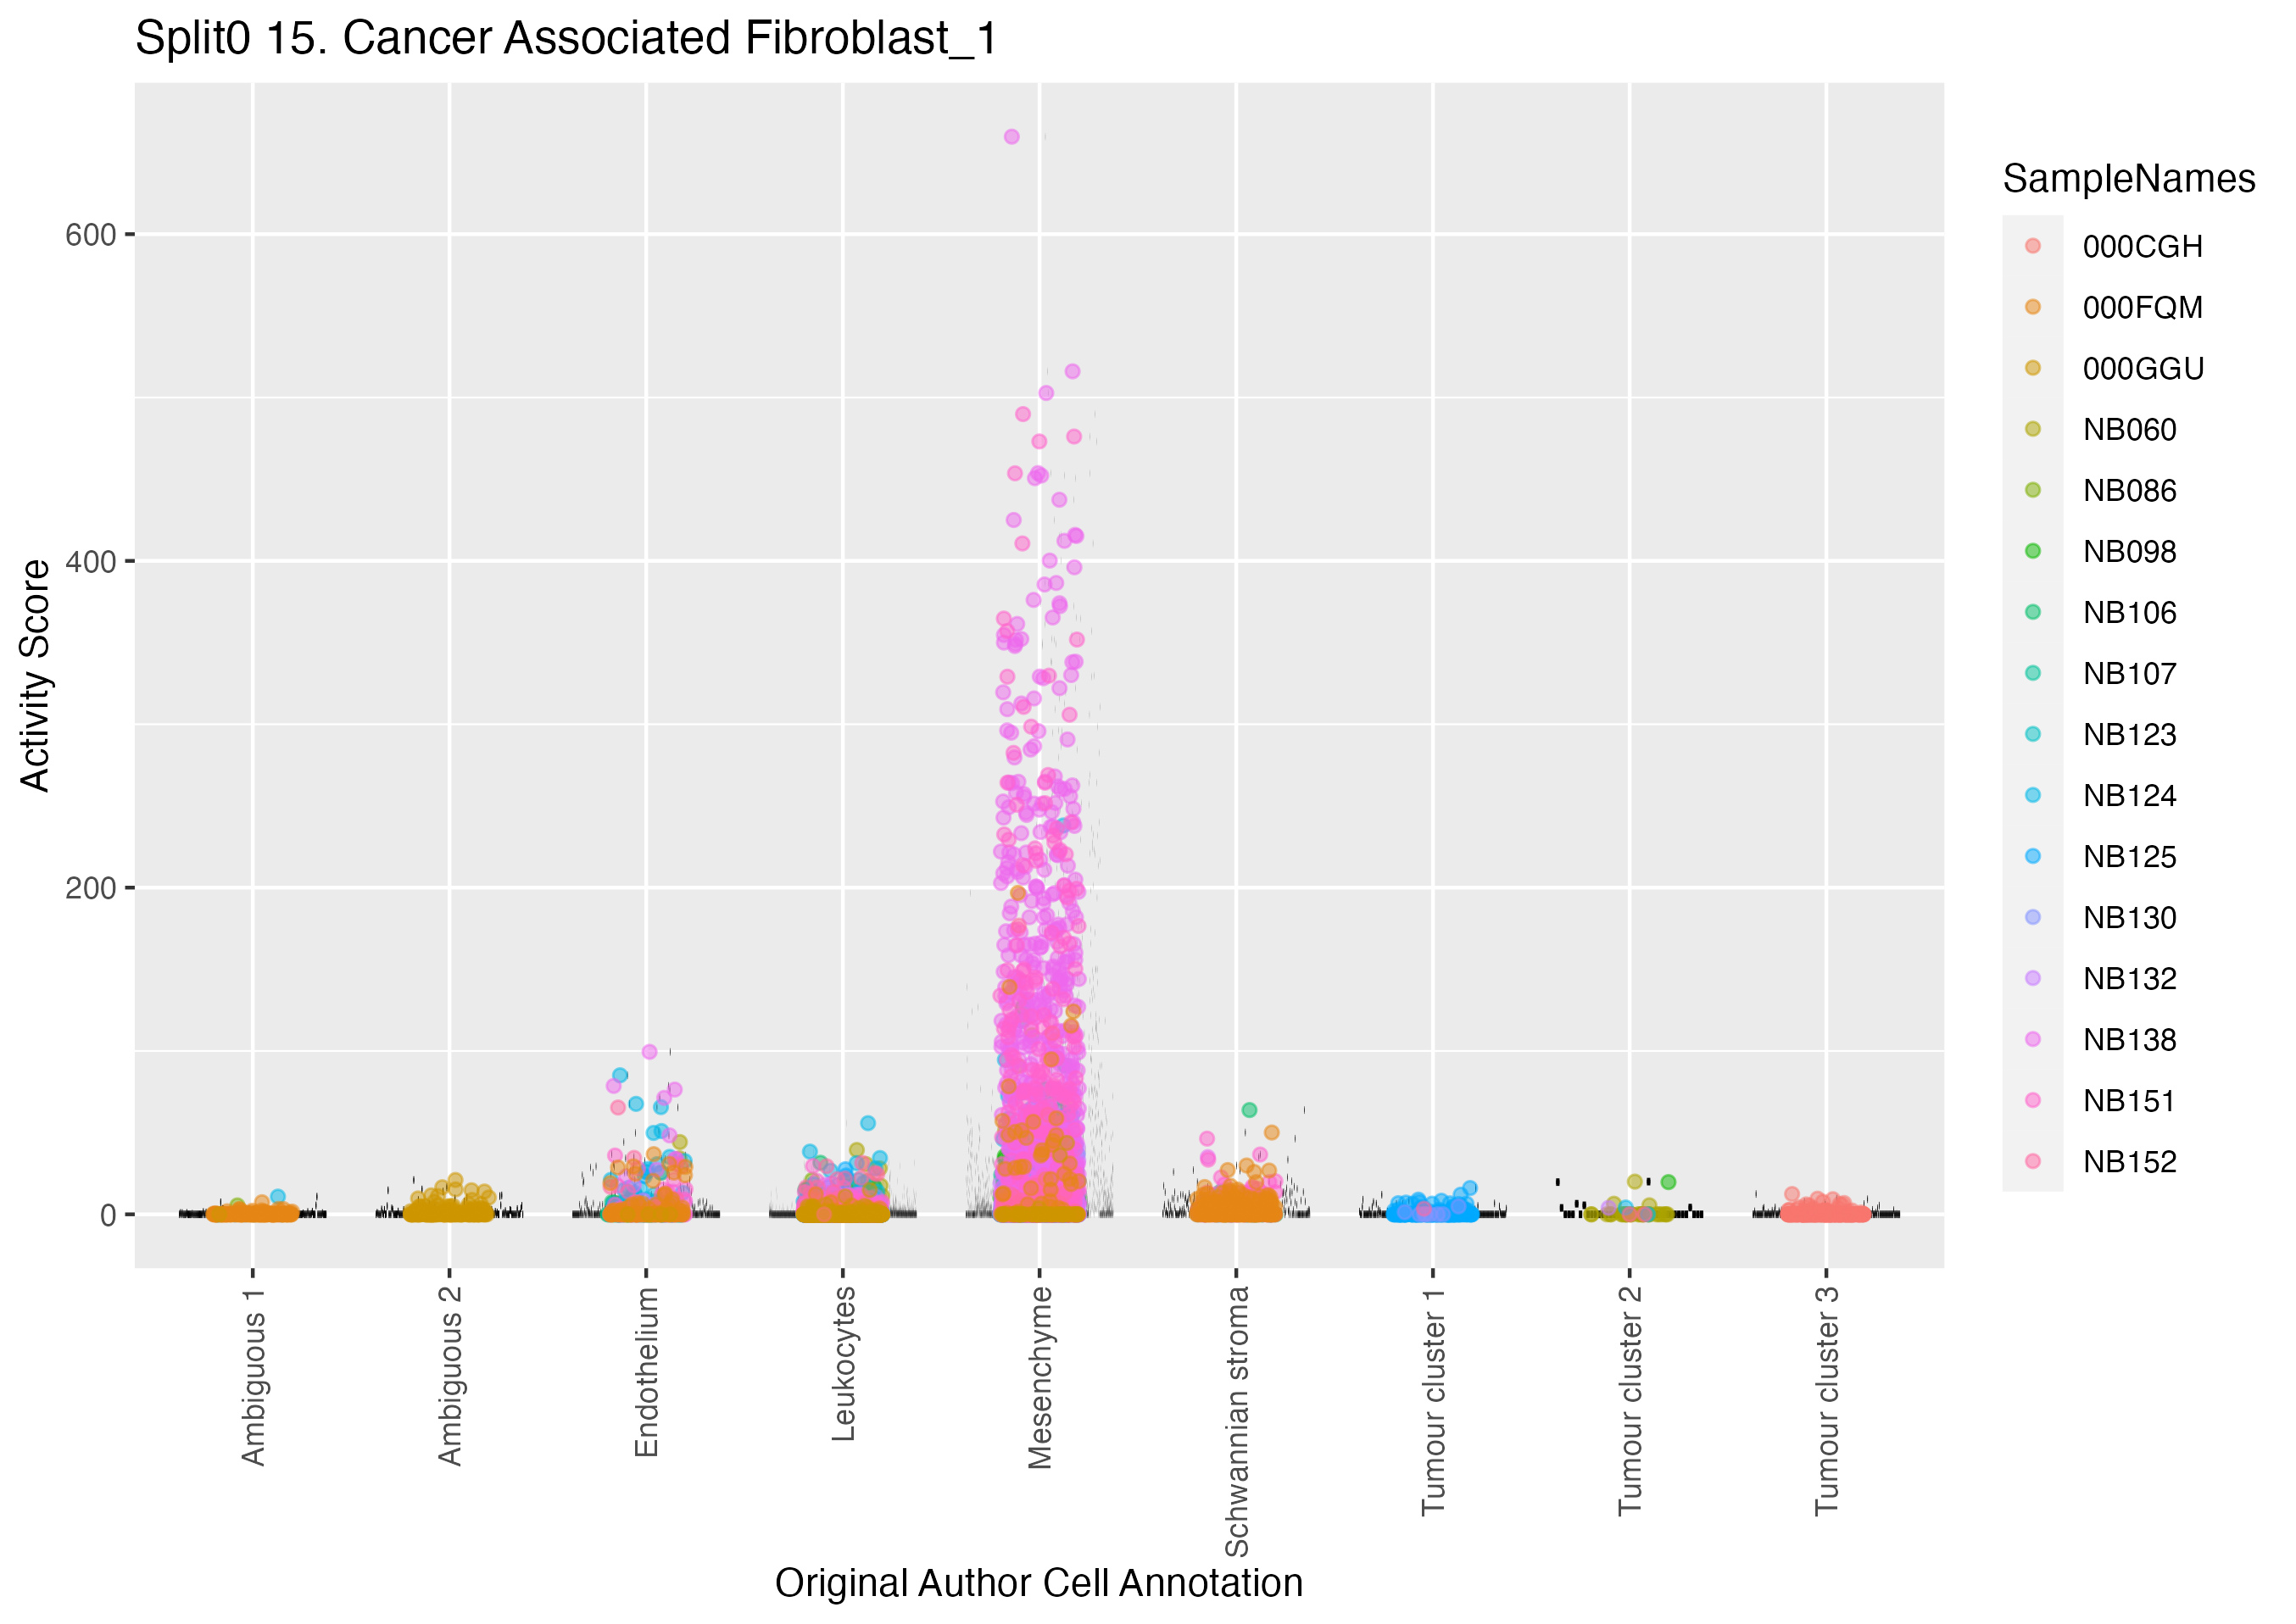
Boxlot showing activity of gene expression program identified in GEP 15. Cancer Associated Fibroblast:
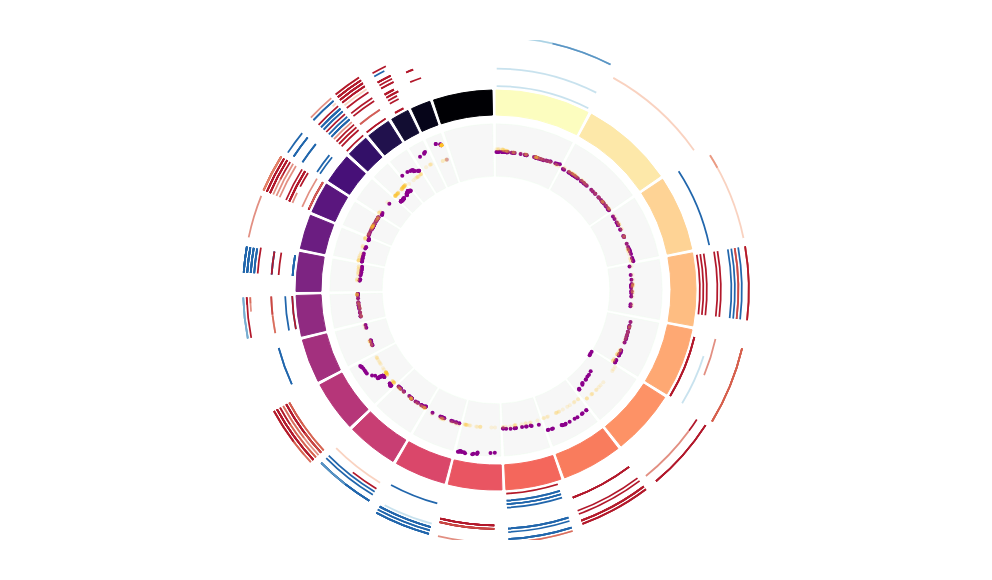
CNV Data procured from inferCNV.
Outer tracks are putative CNV regions (gains = red, losses = blue) for each patient
Inner track is expression data representing:
The top cells expressing this GEP (purple)
Random cells (n =50) from the reference set used in inferCNV (orange)
Gene set Enrichments for this program, caculated from top 50 genes
mSigDB Cell Types Gene Set:
| P-value | OR | Lower 95% CI | FDR | FWER | Genes Found | Gene Set Size | |
|---|---|---|---|---|---|---|---|
| TRAVAGLINI_LUNG_ADVENTITIAL_FIBROBLAST_CELL | 6.95e-19 | 27.66 | 14.57 | 4.66e-16 | 4.66e-16 | 19CYP1B1, EMP1, CCL2, LUM, F3, DCN, TNFRSF12A, TIPARP, CFH, RTN4, LIMA1, UGDH, GSN, CTSL, CLMP, PAMR1, FGFR1, OGN, ANXA1 |
296 |
| CUI_DEVELOPING_HEART_LEFT_VENTRICULAR_CARDIOMYOCYTE | 4.77e-07 | 39.59 | 11.58 | 3.18e-05 | 3.20e-04 | 5CCL2, PHLDA1, TFPI, TM4SF1, ANXA1 |
40 |
| RUBENSTEIN_SKELETAL_MUSCLE_FAP_CELLS | 3.15e-12 | 23.61 | 11.04 | 4.23e-10 | 2.12e-09 | 12EMP1, LUM, DCN, LAMA2, FN1, CFH, RTN4, LIMA1, GSN, RND3, TFPI, ANXA1 |
179 |
| AIZARANI_LIVER_C21_STELLATE_CELLS_1 | 1.71e-10 | 19.26 | 8.76 | 1.91e-08 | 1.15e-07 | 11EMP1, CCL2, LUM, THBS1, DCN, TIPARP, CFH, SERPINE1, PHLDA1, GSN, RND3 |
194 |
| GAO_STOMACH_24W_C4_PARIETAL_PROGENITOR | 4.28e-04 | 86.37 | 8.33 | 8.21e-03 | 2.88e-01 | 2CFH, ANXA1 |
8 |
| FAN_OVARY_CL1_GPRC5A_TNFRS12A_HIGH_SELECTABLE_FOLLICLE_STROMAL_CELL | 4.49e-13 | 16.16 | 8.25 | 7.53e-11 | 3.01e-10 | 16EMP1, LUM, TXNRD1, DCN, TNFRSF12A, CFH, PHLDA1, PRNP, RTN4, GCLM, UGDH, GSN, CTSL, FGFR1, OGN, GPC3 |
380 |
| MURARO_PANCREAS_MESENCHYMAL_STROMAL_CELL | 1.39e-13 | 12.63 | 6.76 | 3.10e-11 | 9.30e-11 | 20CYP1B1, EMP1, LIF, LUM, TXNRD1, FRMD6, SLC4A7, THBS1, S1PR3, DCN, LAMA2, FN1, TNFRSF12A, SERPINE1, PHLDA1, CHSY1, CTSL, RND3, TFPI, ANXA1 |
680 |
| HAY_BONE_MARROW_STROMAL | 9.34e-14 | 12.18 | 6.57 | 3.10e-11 | 6.26e-11 | 21CYP1B1, EMP1, CCL2, LUM, FRMD6, TENM2, S1PR3, DCN, EGFR, FN1, TNFRSF12A, FRMD4A, CFH, LIMA1, GSN, CLMP, RND3, OLFML2B, FGFR1, TFPI, TM4SF1 |
765 |
| GAO_LARGE_INTESTINE_24W_C1_DCLK1POS_PROGENITOR | 2.37e-06 | 18.31 | 6.23 | 1.14e-04 | 1.59e-03 | 6CCL2, LUM, DCN, LAMA2, PAMR1, OGN |
99 |
| HU_FETAL_RETINA_FIBROBLAST | 1.54e-09 | 11.81 | 5.71 | 1.48e-07 | 1.03e-06 | 13LUM, FRMD6, S1PR3, DCN, EGFR, FN1, FRMD4A, MEST, LIMA1, CLMP, FGFR1, OGN, TFPI |
385 |
| DURANTE_ADULT_OLFACTORY_NEUROEPITHELIUM_FIBROBLASTS_STROMAL_CELLS | 1.72e-05 | 18.02 | 5.44 | 5.87e-04 | 1.15e-02 | 5CYP1B1, CCL2, LUM, DCN, GSN |
82 |
| AIZARANI_LIVER_C39_EPCAM_POS_BILE_DUCT_CELLS_4 | 5.22e-07 | 13.53 | 5.40 | 3.18e-05 | 3.50e-04 | 8LIF, CCL2, THBS1, EGFR, CLDN1, TNFRSF12A, RTN4, TM4SF1 |
184 |
| DESCARTES_FETAL_EYE_STROMAL_CELLS | 2.69e-05 | 16.33 | 4.94 | 7.86e-04 | 1.81e-02 | 5LUM, THBS1, DCN, FN1, OGN |
90 |
| DESCARTES_FETAL_HEART_STROMAL_CELLS | 3.24e-04 | 25.71 | 4.86 | 6.82e-03 | 2.17e-01 | 3LUM, DCN, GPC3 |
34 |
| CUI_DEVELOPING_HEART_COMPACT_VENTRICULAR_CARDIOMYOCYTE | 1.24e-04 | 17.81 | 4.52 | 3.19e-03 | 8.31e-02 | 4LUM, DCN, FN1, OGN |
65 |
| DESCARTES_FETAL_THYMUS_STROMAL_CELLS | 1.53e-05 | 13.01 | 4.45 | 5.70e-04 | 1.03e-02 | 6LUM, S1PR3, DCN, MEST, OGN, GPC3 |
137 |
| TRAVAGLINI_LUNG_BASAL_CELL | 7.97e-06 | 11.24 | 4.21 | 3.57e-04 | 5.35e-03 | 7F3, DCN, EGFR, CLDN1, CFH, PRNP, GPC3 |
188 |
| TRAVAGLINI_LUNG_LIPOFIBROBLAST_CELL | 2.19e-05 | 12.17 | 4.17 | 6.99e-04 | 1.47e-02 | 6CYP1B1, SPRY2, TIPARP, PHLDA1, UGDH, RND3 |
146 |
| AIZARANI_LIVER_C20_LSECS_3 | 1.73e-06 | 9.59 | 4.06 | 9.65e-05 | 1.16e-03 | 9EMP1, SLC4A7, SERPINE1, LIMA1, CHSY1, CTSL, FGFR1, TFPI, TM4SF1 |
295 |
| FAN_EMBRYONIC_CTX_BRAIN_ENDOTHELIAL_2 | 2.14e-06 | 9.33 | 3.95 | 1.11e-04 | 1.44e-03 | 9LUM, FRMD6, S1PR3, DCN, LAMA2, FN1, CFH, LIMA1, TFPI |
303 |
Dowload full table
mSigDB Hallmark Gene Sets:
| P-value | OR | Lower 95% CI | FDR | FWER | Genes Found | Gene Set Size | |
|---|---|---|---|---|---|---|---|
| HALLMARK_COAGULATION | 1.05e-06 | 15.53 | 5.78 | 2.61e-05 | 5.23e-05 | 7F3, THBS1, FN1, CFH, SERPINE1, GSN, ANXA1 |
138 |
| HALLMARK_EPITHELIAL_MESENCHYMAL_TRANSITION | 9.73e-07 | 12.40 | 4.96 | 2.61e-05 | 4.87e-05 | 8LUM, THBS1, DCN, LAMA2, FN1, TNFRSF12A, SERPINE1, MEST |
200 |
| HALLMARK_APOPTOSIS | 2.90e-06 | 13.21 | 4.94 | 4.84e-05 | 1.45e-04 | 7EMP1, HMOX1, LUM, DCN, TNFRSF12A, GSN, ANXA1 |
161 |
| HALLMARK_HYPOXIA | 1.19e-05 | 10.54 | 3.95 | 1.48e-04 | 5.94e-04 | 7HMOX1, F3, DCN, EGFR, TIPARP, SERPINE1, GPC3 |
200 |
| HALLMARK_REACTIVE_OXYGEN_SPECIES_PATHWAY | 9.53e-04 | 17.32 | 3.33 | 6.00e-03 | 4.77e-02 | 3TXNRD1, PRNP, GCLM |
49 |
| HALLMARK_TNFA_SIGNALING_VIA_NFKB | 1.24e-04 | 8.78 | 3.02 | 1.24e-03 | 6.18e-03 | 6LIF, CCL2, F3, TIPARP, SERPINE1, PHLDA1 |
200 |
| HALLMARK_COMPLEMENT | 1.08e-03 | 7.12 | 2.18 | 6.00e-03 | 5.40e-02 | 5F3, FN1, CFH, SERPINE1, CTSL |
200 |
| HALLMARK_INFLAMMATORY_RESPONSE | 1.08e-03 | 7.12 | 2.18 | 6.00e-03 | 5.40e-02 | 5LIF, CCL2, F3, SERPINE1, GPC3 |
200 |
| HALLMARK_KRAS_SIGNALING_UP | 1.08e-03 | 7.12 | 2.18 | 6.00e-03 | 5.40e-02 | 5EMP1, SPRY2, LIF, CFH, TFPI |
200 |
| HALLMARK_UV_RESPONSE_DN | 2.44e-03 | 7.76 | 2.00 | 1.22e-02 | 1.22e-01 | 4F3, SERPINE1, RND3, TFPI |
144 |
| HALLMARK_ANGIOGENESIS | 8.94e-03 | 15.30 | 1.73 | 3.73e-02 | 4.47e-01 | 2LUM, FGFR1 |
36 |
| HALLMARK_IL2_STAT5_SIGNALING | 7.58e-03 | 5.57 | 1.44 | 3.44e-02 | 3.79e-01 | 4EMP1, LIF, PHLDA1, PRNP |
199 |
| HALLMARK_TGF_BETA_SIGNALING | 1.94e-02 | 10.01 | 1.15 | 7.45e-02 | 9.68e-01 | 2THBS1, SERPINE1 |
54 |
| HALLMARK_MYOGENESIS | 4.35e-02 | 4.05 | 0.80 | 1.21e-01 | 1.00e+00 | 3LAMA2, PRNP, GSN |
200 |
| HALLMARK_XENOBIOTIC_METABOLISM | 4.35e-02 | 4.05 | 0.80 | 1.21e-01 | 1.00e+00 | 3HMOX1, SERPINE1, UGDH |
200 |
| HALLMARK_GLYCOLYSIS | 4.35e-02 | 4.05 | 0.80 | 1.21e-01 | 1.00e+00 | 3DCN, EGFR, GPC3 |
200 |
| HALLMARK_P53_PATHWAY | 4.35e-02 | 4.05 | 0.80 | 1.21e-01 | 1.00e+00 | 3LIF, HMOX1, TM4SF1 |
200 |
| HALLMARK_ALLOGRAFT_REJECTION | 4.35e-02 | 4.05 | 0.80 | 1.21e-01 | 1.00e+00 | 3LIF, CCL2, EGFR |
200 |
| HALLMARK_IL6_JAK_STAT3_SIGNALING | 4.64e-02 | 6.13 | 0.71 | 1.22e-01 | 1.00e+00 | 2HMOX1, TNFRSF12A |
87 |
| HALLMARK_BILE_ACID_METABOLISM | 7.22e-02 | 4.73 | 0.55 | 1.81e-01 | 1.00e+00 | 2DIO2, GCLM |
112 |
Dowload full table
KEGG Pathways:
| P-value | OR | Lower 95% CI | FDR | FWER | Genes Found | Gene Set Size | |
|---|---|---|---|---|---|---|---|
| KEGG_COMPLEMENT_AND_COAGULATION_CASCADES | 1.56e-04 | 16.71 | 4.25 | 2.90e-02 | 2.90e-02 | 4F3, CFH, SERPINE1, TFPI |
69 |
| KEGG_ECM_RECEPTOR_INTERACTION | 4.44e-03 | 9.85 | 1.92 | 2.94e-01 | 8.25e-01 | 3THBS1, LAMA2, FN1 |
84 |
| KEGG_TGF_BETA_SIGNALING_PATHWAY | 4.74e-03 | 9.61 | 1.88 | 2.94e-01 | 8.81e-01 | 3THBS1, DCN, BMP8B |
86 |
| KEGG_BLADDER_CANCER | 1.20e-02 | 13.01 | 1.48 | 3.73e-01 | 1.00e+00 | 2THBS1, EGFR |
42 |
| KEGG_FOCAL_ADHESION | 7.58e-03 | 5.57 | 1.44 | 3.52e-01 | 1.00e+00 | 4THBS1, EGFR, LAMA2, FN1 |
199 |
| KEGG_REGULATION_OF_ACTIN_CYTOSKELETON | 9.54e-03 | 5.20 | 1.35 | 3.55e-01 | 1.00e+00 | 4EGFR, FN1, GSN, FGFR1 |
213 |
| KEGG_CYTOKINE_CYTOKINE_RECEPTOR_INTERACTION | 1.96e-02 | 4.16 | 1.08 | 5.20e-01 | 1.00e+00 | 4LIF, CCL2, EGFR, TNFRSF12A |
265 |
| KEGG_P53_SIGNALING_PATHWAY | 2.97e-02 | 7.89 | 0.91 | 6.26e-01 | 1.00e+00 | 2THBS1, SERPINE1 |
68 |
| KEGG_PATHWAYS_IN_CANCER | 3.70e-02 | 3.39 | 0.88 | 6.26e-01 | 1.00e+00 | 4EGFR, LAMA2, FN1, FGFR1 |
325 |
| KEGG_MELANOMA | 3.21e-02 | 7.55 | 0.87 | 6.26e-01 | 1.00e+00 | 2EGFR, FGFR1 |
71 |
| KEGG_ADHERENS_JUNCTION | 3.38e-02 | 7.33 | 0.85 | 6.26e-01 | 1.00e+00 | 2EGFR, FGFR1 |
73 |
| KEGG_SMALL_CELL_LUNG_CANCER | 4.36e-02 | 6.35 | 0.74 | 6.72e-01 | 1.00e+00 | 2LAMA2, FN1 |
84 |
| KEGG_PROSTATE_CANCER | 4.83e-02 | 5.98 | 0.69 | 6.72e-01 | 1.00e+00 | 2EGFR, FGFR1 |
89 |
| KEGG_CIRCADIAN_RHYTHM_MAMMAL | 5.05e-02 | 21.22 | 0.49 | 6.72e-01 | 1.00e+00 | 1BHLHE41 |
13 |
| KEGG_JAK_STAT_SIGNALING_PATHWAY | 1.24e-01 | 3.40 | 0.40 | 1.00e+00 | 1.00e+00 | 2SPRY2, LIF |
155 |
| KEGG_GLYCOSAMINOGLYCAN_BIOSYNTHESIS_CHONDROITIN_SULFATE | 8.40e-02 | 12.14 | 0.29 | 1.00e+00 | 1.00e+00 | 1CHSY1 |
22 |
| KEGG_DORSO_VENTRAL_AXIS_FORMATION | 9.13e-02 | 11.08 | 0.26 | 1.00e+00 | 1.00e+00 | 1EGFR |
24 |
| KEGG_ASCORBATE_AND_ALDARATE_METABOLISM | 9.49e-02 | 10.62 | 0.25 | 1.00e+00 | 1.00e+00 | 1UGDH |
25 |
| KEGG_MAPK_SIGNALING_PATHWAY | 2.80e-01 | 1.97 | 0.23 | 1.00e+00 | 1.00e+00 | 2EGFR, FGFR1 |
267 |
| KEGG_PENTOSE_AND_GLUCURONATE_INTERCONVERSIONS | 1.06e-01 | 9.44 | 0.23 | 1.00e+00 | 1.00e+00 | 1UGDH |
28 |
Dowload full table
CHR Positional Gene Sets:
| P-value | OR | Lower 95% CI | FDR | FWER | Genes Found | Gene Set Size | |
|---|---|---|---|---|---|---|---|
| chr12q21 | 1.40e-02 | 6.38 | 1.25 | 1.00e+00 | 1.00e+00 | 3LUM, DCN, PHLDA1 |
128 |
| chr3q25 | 1.20e-01 | 3.47 | 0.41 | 1.00e+00 | 1.00e+00 | 2TIPARP, TM4SF1 |
152 |
| chr9q22 | 1.64e-01 | 2.85 | 0.33 | 1.00e+00 | 1.00e+00 | 2S1PR3, OGN |
185 |
| chr9q21 | 1.68e-01 | 2.80 | 0.33 | 1.00e+00 | 1.00e+00 | 2CTSL, ANXA1 |
188 |
| chr22q12 | 2.03e-01 | 2.47 | 0.29 | 1.00e+00 | 1.00e+00 | 2LIF, HMOX1 |
213 |
| chr3q28 | 1.13e-01 | 8.79 | 0.21 | 1.00e+00 | 1.00e+00 | 1CLDN1 |
30 |
| chr5q34 | 1.41e-01 | 6.89 | 0.17 | 1.00e+00 | 1.00e+00 | 1TENM2 |
38 |
| chr2q23 | 1.84e-01 | 5.10 | 0.12 | 1.00e+00 | 1.00e+00 | 1RND3 |
51 |
| chr14q31 | 2.00e-01 | 4.64 | 0.11 | 1.00e+00 | 1.00e+00 | 1DIO2 |
56 |
| chr15q14 | 2.00e-01 | 4.64 | 0.11 | 1.00e+00 | 1.00e+00 | 1THBS1 |
56 |
| chr10p13 | 2.25e-01 | 4.05 | 0.10 | 1.00e+00 | 1.00e+00 | 1FRMD4A |
64 |
| chr4p14 | 2.25e-01 | 4.05 | 0.10 | 1.00e+00 | 1.00e+00 | 1UGDH |
64 |
| chr1q31 | 2.46e-01 | 3.64 | 0.09 | 1.00e+00 | 1.00e+00 | 1CFH |
71 |
| chr7p11 | 2.78e-01 | 3.15 | 0.08 | 1.00e+00 | 1.00e+00 | 1EGFR |
82 |
| chr14q22 | 3.01e-01 | 2.87 | 0.07 | 1.00e+00 | 1.00e+00 | 1FRMD6 |
90 |
| chr7q32 | 3.01e-01 | 2.87 | 0.07 | 1.00e+00 | 1.00e+00 | 1MEST |
90 |
| chr8p11 | 3.15e-01 | 2.71 | 0.07 | 1.00e+00 | 1.00e+00 | 1FGFR1 |
95 |
| chr13q31 | 3.20e-01 | 2.66 | 0.07 | 1.00e+00 | 1.00e+00 | 1SPRY2 |
97 |
| chr2p22 | 3.23e-01 | 2.63 | 0.06 | 1.00e+00 | 1.00e+00 | 1CYP1B1 |
98 |
| chr1p21 | 3.25e-01 | 2.60 | 0.06 | 1.00e+00 | 1.00e+00 | 1F3 |
99 |
Dowload full table
Transcription Factor Targets:
| P-value | OR | Lower 95% CI | FDR | FWER | Genes Found | Gene Set Size | |
|---|---|---|---|---|---|---|---|
| P300_01 | 4.58e-04 | 6.82 | 2.35 | 3.29e-01 | 5.19e-01 | 6EMP1, BHLHE41, TNFRSF12A, GSN, FGFR1, GPC3 |
256 |
| RACCACAR_AML_Q6 | 5.80e-04 | 6.51 | 2.25 | 3.29e-01 | 6.58e-01 | 6EMP1, LIF, CCL2, TNFRSF12A, CFH, FGFR1 |
268 |
| AHR_Q5 | 1.08e-02 | 5.01 | 1.30 | 1.00e+00 | 1.00e+00 | 4CYP1B1, LUM, BHLHE41, RTN4 |
221 |
| TTCYNRGAA_STAT5B_01 | 1.01e-02 | 4.13 | 1.27 | 1.00e+00 | 1.00e+00 | 5LIF, CCL2, FRMD6, LAMA2, FN1 |
341 |
| CDPCR1_01 | 1.42e-02 | 6.33 | 1.24 | 1.00e+00 | 1.00e+00 | 3EMP1, DIO2, BHLHE41 |
129 |
| POU1F1_Q6 | 1.42e-02 | 4.61 | 1.19 | 1.00e+00 | 1.00e+00 | 4DIO2, TNFRSF12A, RTN4, GPC3 |
240 |
| IRF_Q6 | 1.50e-02 | 4.53 | 1.17 | 1.00e+00 | 1.00e+00 | 4DIO2, F3, THBS1, RTN4 |
244 |
| STAT5B_01 | 1.73e-02 | 4.33 | 1.12 | 1.00e+00 | 1.00e+00 | 4LIF, CCL2, FRMD6, LAMA2 |
255 |
| STAT5A_01 | 1.82e-02 | 4.26 | 1.11 | 1.00e+00 | 1.00e+00 | 4LIF, CCL2, FRMD6, LAMA2 |
259 |
| DR4_Q2 | 1.98e-02 | 4.15 | 1.08 | 1.00e+00 | 1.00e+00 | 4TNFRSF12A, FRMD4A, OGN, ZBTB21 |
266 |
| LHX9_TARGET_GENES | 2.17e-02 | 2.27 | 1.05 | 1.00e+00 | 1.00e+00 | 11TXNRD1, FRMD6, SLC4A7, EGFR, TIPARP, FRMD4A, PHLDA1, PRNP, RTN4, LIMA1, GSN |
1563 |
| ATXN7L3_TARGET_GENES | 2.36e-02 | 3.92 | 1.02 | 1.00e+00 | 1.00e+00 | 4TXNRD1, PRNP, RTN4, UGDH |
281 |
| CTGCAGY_UNKNOWN | 2.53e-02 | 2.64 | 1.00 | 1.00e+00 | 1.00e+00 | 7DIO2, TNFRSF12A, FRMD4A, SERPINE1, RTN4, FGFR1, GPC3 |
779 |
| PSMB5_TARGET_GENES | 3.11e-02 | 3.59 | 0.93 | 1.00e+00 | 1.00e+00 | 4EMP1, THBS1, SERPINE1, RND3 |
307 |
| UBN1_TARGET_GENES | 5.07e-02 | 2.00 | 0.92 | 1.00e+00 | 1.00e+00 | 11CYP1B1, EMP1, DIO2, F3, THBS1, LAMA2, RTN4, UGDH, GSN, KLHL21, ANXA1 |
1779 |
| TP73_TARGET_GENES | 4.22e-02 | 2.35 | 0.89 | 1.00e+00 | 1.00e+00 | 7EMP1, TXNRD1, FRMD6, TIPARP, SERPINE1, LIMA1, PAMR1 |
875 |
| HES2_TARGET_GENES | 9.37e-02 | 1.95 | 0.83 | 1.00e+00 | 1.00e+00 | 9HMOX1, DIO2, TXNRD1, SERPINE1, MEST, GSN, FGFR1, TM4SF1, ANXA1 |
1420 |
| GREB1_TARGET_GENES | 8.38e-02 | 2.18 | 0.82 | 1.00e+00 | 1.00e+00 | 7CYP1B1, FRMD6, TIPARP, RTN4, GCLM, LIMA1, GSN |
941 |
| ZNF776_TARGET_GENES | 3.14e-02 | 36.29 | 0.79 | 1.00e+00 | 1.00e+00 | 1BHLHE41 |
8 |
| ZNF514_TARGET_GENES | 3.14e-02 | 36.29 | 0.79 | 1.00e+00 | 1.00e+00 | 1GSN |
8 |
Dowload full table
GO Biological Processes:
| P-value | OR | Lower 95% CI | FDR | FWER | Genes Found | Gene Set Size | |
|---|---|---|---|---|---|---|---|
| GOBP_NEGATIVE_REGULATION_OF_PLASMINOGEN_ACTIVATION | 2.31e-04 | 129.66 | 11.45 | 3.26e-02 | 1.00e+00 | 2THBS1, SERPINE1 |
6 |
| GOBP_POSITIVE_REGULATION_OF_TRANSFORMING_GROWTH_FACTOR_BETA1_PRODUCTION | 2.31e-04 | 129.66 | 11.45 | 3.26e-02 | 1.00e+00 | 2LUM, THBS1 |
6 |
| GOBP_PROLACTIN_SECRETION | 2.31e-04 | 129.66 | 11.45 | 3.26e-02 | 1.00e+00 | 2EGFR, ANXA1 |
6 |
| GOBP_PEPTIDE_CROSS_LINKING | 1.05e-05 | 34.98 | 8.63 | 4.93e-03 | 7.89e-02 | 4THBS1, DCN, FN1, ANXA1 |
35 |
| GOBP_POSITIVE_REGULATION_OF_WOUND_HEALING | 3.40e-06 | 25.67 | 7.66 | 3.18e-03 | 2.55e-02 | 5F3, THBS1, CLDN1, SERPINE1, ANXA1 |
59 |
| GOBP_REGULATION_OF_NITRIC_OXIDE_MEDIATED_SIGNAL_TRANSDUCTION | 5.49e-04 | 74.10 | 7.33 | 5.96e-02 | 1.00e+00 | 2THBS1, EGFR |
9 |
| GOBP_POSITIVE_REGULATION_OF_COAGULATION | 1.13e-04 | 37.87 | 7.01 | 2.35e-02 | 8.45e-01 | 3F3, THBS1, SERPINE1 |
24 |
| GOBP_CHONDROITIN_SULFATE_BIOSYNTHETIC_PROCESS | 1.28e-04 | 36.22 | 6.71 | 2.51e-02 | 9.57e-01 | 3DCN, UGDH, CHSY1 |
25 |
| GOBP_NEGATIVE_REGULATION_OF_FIBRINOLYSIS | 6.85e-04 | 64.86 | 6.55 | 6.83e-02 | 1.00e+00 | 2THBS1, SERPINE1 |
10 |
| GOBP_POSITIVE_REGULATION_OF_RESPONSE_TO_WOUNDING | 9.11e-06 | 20.72 | 6.22 | 4.76e-03 | 6.81e-02 | 5F3, THBS1, CLDN1, SERPINE1, ANXA1 |
72 |
| GOBP_NEGATIVE_REGULATION_OF_PROTEIN_MATURATION | 1.62e-04 | 33.18 | 6.19 | 2.81e-02 | 1.00e+00 | 3THBS1, SERPINE1, PRNP |
27 |
| GOBP_REGULATION_OF_WOUND_HEALING | 7.38e-07 | 16.40 | 6.10 | 1.60e-03 | 5.52e-03 | 7F3, THBS1, CLDN1, TNFRSF12A, SERPINE1, TFPI, ANXA1 |
131 |
| GOBP_PROTEIN_ACTIVATION_CASCADE | 1.81e-04 | 31.85 | 5.95 | 2.94e-02 | 1.00e+00 | 3F3, FN1, TFPI |
28 |
| GOBP_CHONDROITIN_SULFATE_PROTEOGLYCAN_BIOSYNTHETIC_PROCESS | 2.22e-04 | 29.50 | 5.54 | 3.26e-02 | 1.00e+00 | 3DCN, UGDH, CHSY1 |
30 |
| GOBP_REGULATION_OF_PHOSPHOLIPASE_A2_ACTIVITY | 9.99e-04 | 51.89 | 5.39 | 8.40e-02 | 1.00e+00 | 2EGFR, ANXA1 |
12 |
| GOBP_NEGATIVE_REGULATION_OF_CELL_ADHESION_MEDIATED_BY_INTEGRIN | 9.99e-04 | 51.89 | 5.39 | 8.40e-02 | 1.00e+00 | 2CYP1B1, SERPINE1 |
12 |
| GOBP_KERATAN_SULFATE_CATABOLIC_PROCESS | 9.99e-04 | 51.89 | 5.39 | 8.40e-02 | 1.00e+00 | 2LUM, OGN |
12 |
| GOBP_AMINOGLYCAN_BIOSYNTHETIC_PROCESS | 5.37e-06 | 15.77 | 5.38 | 3.39e-03 | 4.02e-02 | 6LUM, DCN, UGDH, CHSY1, OGN, GPC3 |
114 |
| GOBP_LIVER_REGENERATION | 2.46e-04 | 28.45 | 5.35 | 3.40e-02 | 1.00e+00 | 3HMOX1, EGFR, CLDN1 |
31 |
| GOBP_REGULATION_OF_PLASMINOGEN_ACTIVATION | 1.18e-03 | 47.19 | 4.96 | 9.08e-02 | 1.00e+00 | 2THBS1, SERPINE1 |
13 |
Dowload full table
Immunological Gene Sets:
| P-value | OR | Lower 95% CI | FDR | FWER | Genes Found | Gene Set Size | |
|---|---|---|---|---|---|---|---|
| GSE9988_ANTI_TREM1_VS_CTRL_TREATED_MONOCYTES_UP | 3.90e-09 | 16.62 | 7.30 | 1.90e-05 | 1.90e-05 | 10SPRY2, F3, TXNRD1, S1PR3, PHLDA1, GCLM, CHSY1, CTSL, KLHL21, ZBTB21 |
198 |
| GSE14769_UNSTIM_VS_60MIN_LPS_BMDM_DN | 9.73e-07 | 12.40 | 4.96 | 1.58e-03 | 4.74e-03 | 8SPRY2, F3, FRMD6, CDC42EP2, TIPARP, FRMD4A, PHLDA1, LIMA1 |
200 |
| GSE24634_TEFF_VS_TCONV_DAY7_IN_CULTURE_DN | 9.73e-07 | 12.40 | 4.96 | 1.58e-03 | 4.74e-03 | 8CYP1B1, SPRY2, HMOX1, F3, BHLHE41, SERPINE1, GSN, CTSL |
200 |
| GSE37605_FOXP3_FUSION_GFP_VS_IRES_GFP_TREG_C57BL6_UP | 7.19e-06 | 11.43 | 4.28 | 4.45e-03 | 3.50e-02 | 7SPRY2, CCL2, THBS1, EGFR, SERPINE1, RND3, TM4SF1 |
185 |
| GSE9988_ANTI_TREM1_VS_VEHICLE_TREATED_MONOCYTES_UP | 9.76e-06 | 10.88 | 4.08 | 4.45e-03 | 4.76e-02 | 7F3, TXNRD1, S1PR3, CHSY1, CTSL, KLHL21, ZBTB21 |
194 |
| GSE9988_LPS_VS_LPS_AND_ANTI_TREM1_MONOCYTE_DN | 9.76e-06 | 10.88 | 4.08 | 4.45e-03 | 4.76e-02 | 7SPRY2, S1PR3, TNFRSF12A, SERPINE1, CTSL, KLHL21, ZBTB21 |
194 |
| GSE9988_ANTI_TREM1_AND_LPS_VS_VEHICLE_TREATED_MONOCYTES_UP | 1.01e-05 | 10.82 | 4.05 | 4.45e-03 | 4.92e-02 | 7SPRY2, F3, TXNRD1, S1PR3, GCLM, CTSL, KLHL21 |
195 |
| GSE9988_ANTI_TREM1_VS_LPS_MONOCYTE_UP | 1.11e-05 | 10.65 | 3.99 | 4.45e-03 | 5.42e-02 | 7EMP1, SPRY2, S1PR3, TNFRSF12A, CHSY1, CTSL, ZBTB21 |
198 |
| GSE14769_UNSTIM_VS_80MIN_LPS_BMDM_DN | 1.15e-05 | 10.60 | 3.97 | 4.45e-03 | 5.60e-02 | 7DIO2, FRMD6, CDC42EP2, TIPARP, SERPINE1, PHLDA1, LIMA1 |
199 |
| GSE45365_NK_CELL_VS_CD11B_DC_DN | 1.15e-05 | 10.60 | 3.97 | 4.45e-03 | 5.60e-02 | 7LIF, S1PR3, TIPARP, SERPINE1, PHLDA1, CHSY1, TM4SF1 |
199 |
| GSE22601_IMMATURE_CD4_SINGLE_POSITIVE_VS_CD8_SINGLE_POSITIVE_THYMOCYTE_DN | 1.19e-05 | 10.54 | 3.95 | 4.45e-03 | 5.79e-02 | 7EMP1, LIF, TXNRD1, FRMD6, TIPARP, PRNP, CHSY1 |
200 |
| GSE5679_CTRL_VS_PPARG_LIGAND_ROSIGLITAZONE_AND_RARA_AGONIST_AM580_TREATED_DC_DN | 1.19e-05 | 10.54 | 3.95 | 4.45e-03 | 5.79e-02 | 7EMP1, DIO2, FRMD6, DCN, PRNP, FGFR1, ANXA1 |
200 |
| GSE22140_HEALTHY_VS_ARTHRITIC_GERMFREE_MOUSE_CD4_TCELL_DN | 1.19e-05 | 10.54 | 3.95 | 4.45e-03 | 5.79e-02 | 7EMP1, HMOX1, TXNRD1, THBS1, SERPINE1, GCLM, CTSL |
200 |
| GSE37605_TREG_VS_TCONV_NOD_FOXP3_FUSION_GFP_DN | 5.10e-05 | 10.39 | 3.57 | 1.77e-02 | 2.48e-01 | 6CCL2, TXNRD1, THBS1, PHLDA1, RTN4, ANXA1 |
170 |
| GSE9988_LOW_LPS_VS_ANTI_TREM1_AND_LPS_MONOCYTE_DN | 1.11e-04 | 8.97 | 3.09 | 2.08e-02 | 5.40e-01 | 6SPRY2, S1PR3, SERPINE1, CHSY1, CTSL, KLHL21 |
196 |
| GSE17974_0H_VS_1H_IN_VITRO_ACT_CD4_TCELL_DN | 1.14e-04 | 8.92 | 3.07 | 2.08e-02 | 5.55e-01 | 6LIF, TXNRD1, CLDN1, PHLDA1, CHSY1, CTSL |
197 |
| GSE17974_0H_VS_2H_IN_VITRO_ACT_CD4_TCELL_DN | 1.17e-04 | 8.88 | 3.05 | 2.08e-02 | 5.71e-01 | 6EMP1, LIF, CLDN1, PHLDA1, CHSY1, CTSL |
198 |
| GSE24634_TREG_VS_TCONV_POST_DAY7_IL4_CONVERSION_DN | 1.17e-04 | 8.88 | 3.05 | 2.08e-02 | 5.71e-01 | 6CYP1B1, CCL2, FN1, SERPINE1, GSN, CTSL |
198 |
| GSE360_L_DONOVANI_VS_B_MALAYI_HIGH_DOSE_MAC_UP | 1.20e-04 | 8.83 | 3.04 | 2.08e-02 | 5.86e-01 | 6CYP1B1, SPRY2, HMOX1, TIPARP, SERPINE1, CTSL |
199 |
| GSE19401_NAIVE_VS_IMMUNIZED_MOUSE_PLN_FOLLICULAR_DC_UP | 1.20e-04 | 8.83 | 3.04 | 2.08e-02 | 5.86e-01 | 6EMP1, HMOX1, TXNRD1, THBS1, TIPARP, SERPINE1 |
199 |
Top Ranked Transcription Factors for this Gene Expression Program:
| Gene Symbol | TF Rank | DNA Binding Domain | Motif Status | IUPAC PWM | GTEx | DepMap | Decartes |
|---|---|---|---|---|---|---|---|
| CYP1B1 | 1 | No | Unlikely to be sequence specific TF | Not a DNA binding protein | No motif | None | None |
| HMOX1 | 5 | No | Unlikely to be sequence specific TF | Not a DNA binding protein | No motif | None | Well characterized enzyme with no additional domains. Included only because GO lists it as a regulator of TFs. No support for DNA binding activity. |
| BHLHE41 | 11 | Yes | Known motif | Monomer or homomultimer | High-throughput in vitro | None | None |
| TIPARP | 24 | No | Unlikely to be sequence specific TF | Not a DNA binding protein | No motif | None | None |
| PRNP | 29 | No | Unlikely to be sequence specific TF | Not a DNA binding protein | No motif | None | None |
| ZBTB21 | 50 | Yes | Likely to be sequence specific TF | Monomer or homomultimer | No motif | None | Virtually nothing is known for this protein except that it has a decent cassette of znfC2H2 domains and a BTB homodimerization domain |
| TRIB1 | 53 | No | Unlikely to be sequence specific TF | Not a DNA binding protein | No motif | None | Associates with CEBPB and CEBPA and inhibits their activities (PMID: 17724128). This is probably achieved through control of their proteosomal degradation (PMID: 17576771) |
| EBF2 | 61 | Yes | Known motif | Monomer or homomultimer | In vivo/Misc source | Only known motifs are from Transfac or HocoMoco - origin is uncertain | EBF1 has a nice HT-SELEX model and based on this paper (PMID:23499423). EBF2 binds similar motif to control brown/beige fat cell identity. |
| FOSL1 | 63 | Yes | Known motif | Monomer or homomultimer | High-throughput in vitro | None | None |
| NRIP1 | 65 | No | Unlikely to be sequence specific TF | Not a DNA binding protein | No motif | None | Transcriptional cofactor |
| EGR3 | 71 | Yes | Known motif | Monomer or homomultimer | High-throughput in vitro | None | None |
| ATF4 | 74 | Yes | Known motif | Monomer or homomultimer | High-throughput in vitro | None | None |
| ETV1 | 84 | Yes | Known motif | Monomer or homomultimer | High-throughput in vitro | None | None |
| LARP6 | 87 | No | ssDNA/RNA binding | Not a DNA binding protein | No motif | None | Classic RNA binding protein |
| FZD1 | 98 | No | Unlikely to be sequence specific TF | Not a DNA binding protein | No motif | None | None |
| WWTR1 | 101 | No | Unlikely to be sequence specific TF | Not a DNA binding protein | No motif | None | Transcriptional co-activator that binds to TEADs (PMID: 19324877) and TBX5 (PMID: 16332960) |
| KLF5 | 111 | Yes | Known motif | Monomer or homomultimer | High-throughput in vitro | None | Binds as a monomer and as a dimer (PMID: 25575120). |
| CEBPB | 112 | Yes | Known motif | Monomer or homomultimer | High-throughput in vitro | None | None |
| NR3C1 | 119 | Yes | Known motif | Monomer or homomultimer | High-throughput in vitro | None | None |
| VGLL3 | 124 | No | Unlikely to be sequence specific TF | Not a DNA binding protein | No motif | None | (PMID: 23380592) describes this protein as a co-activator, and it doesnt seem to have a DBD (fig. 1) |
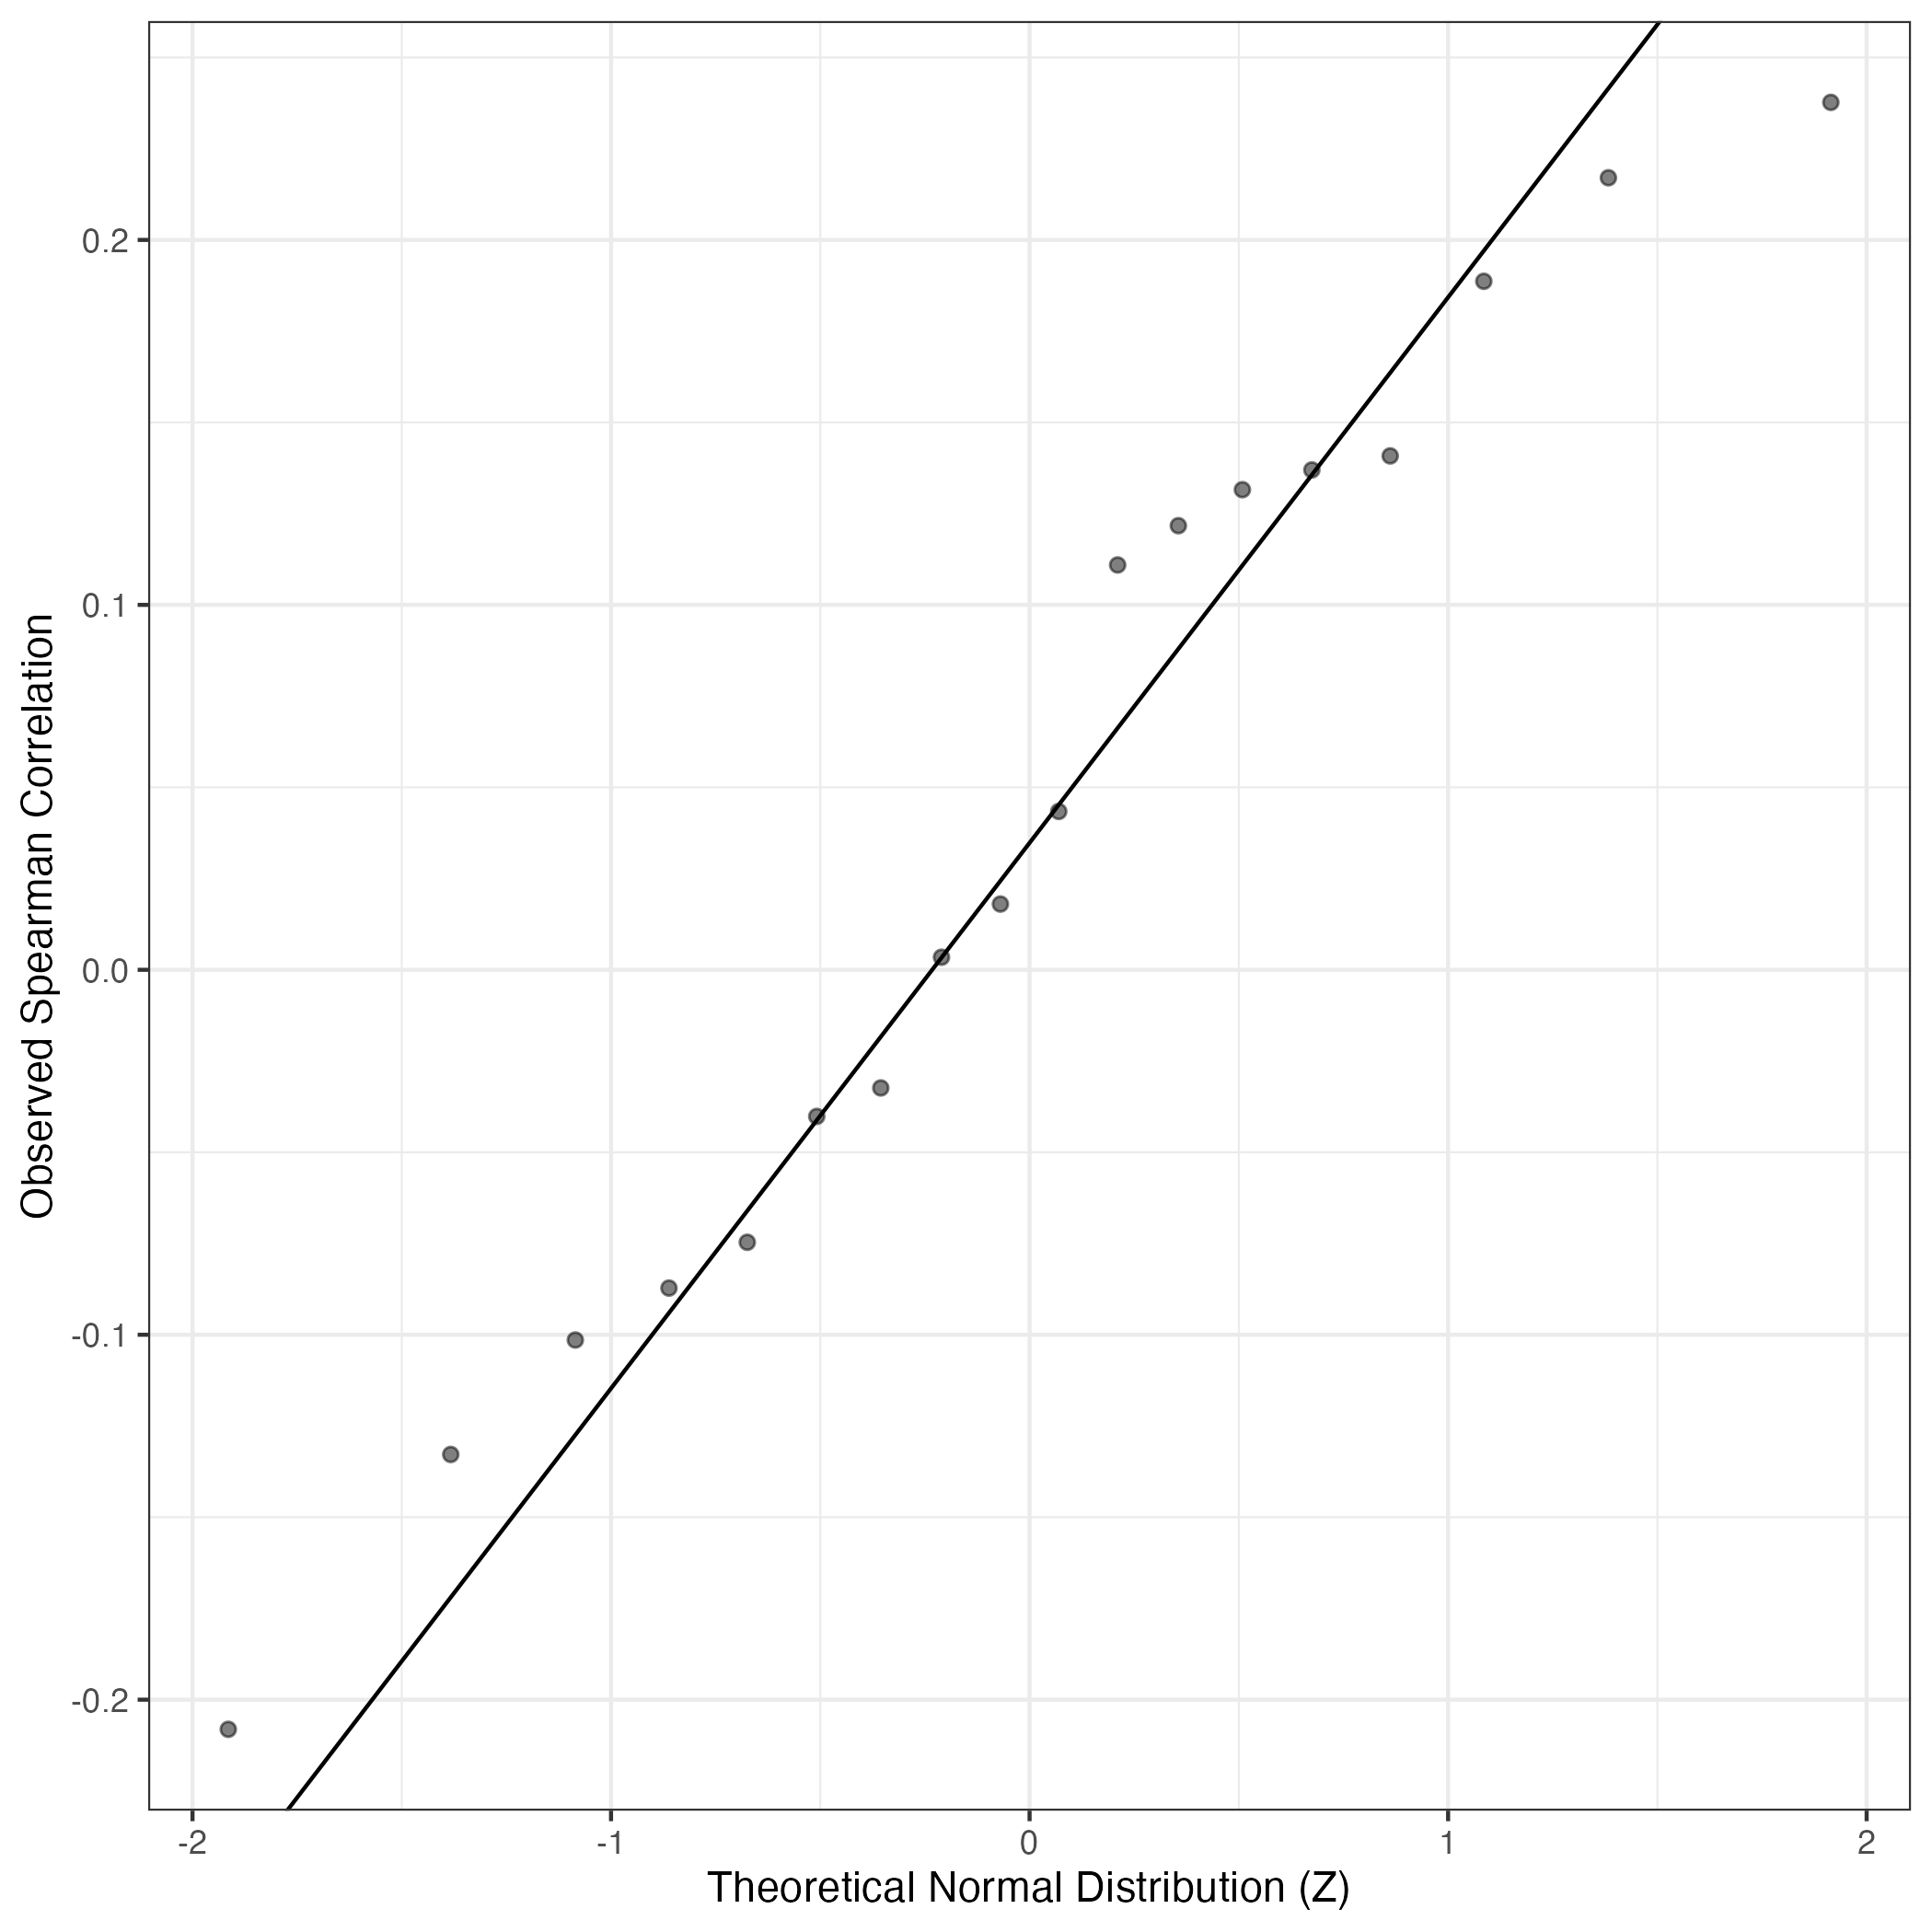
QQ Plot showing correlations with other GEPs in this dataset, calculated by Spearman correlation:
Interactive QQ-plot of gene loadings:
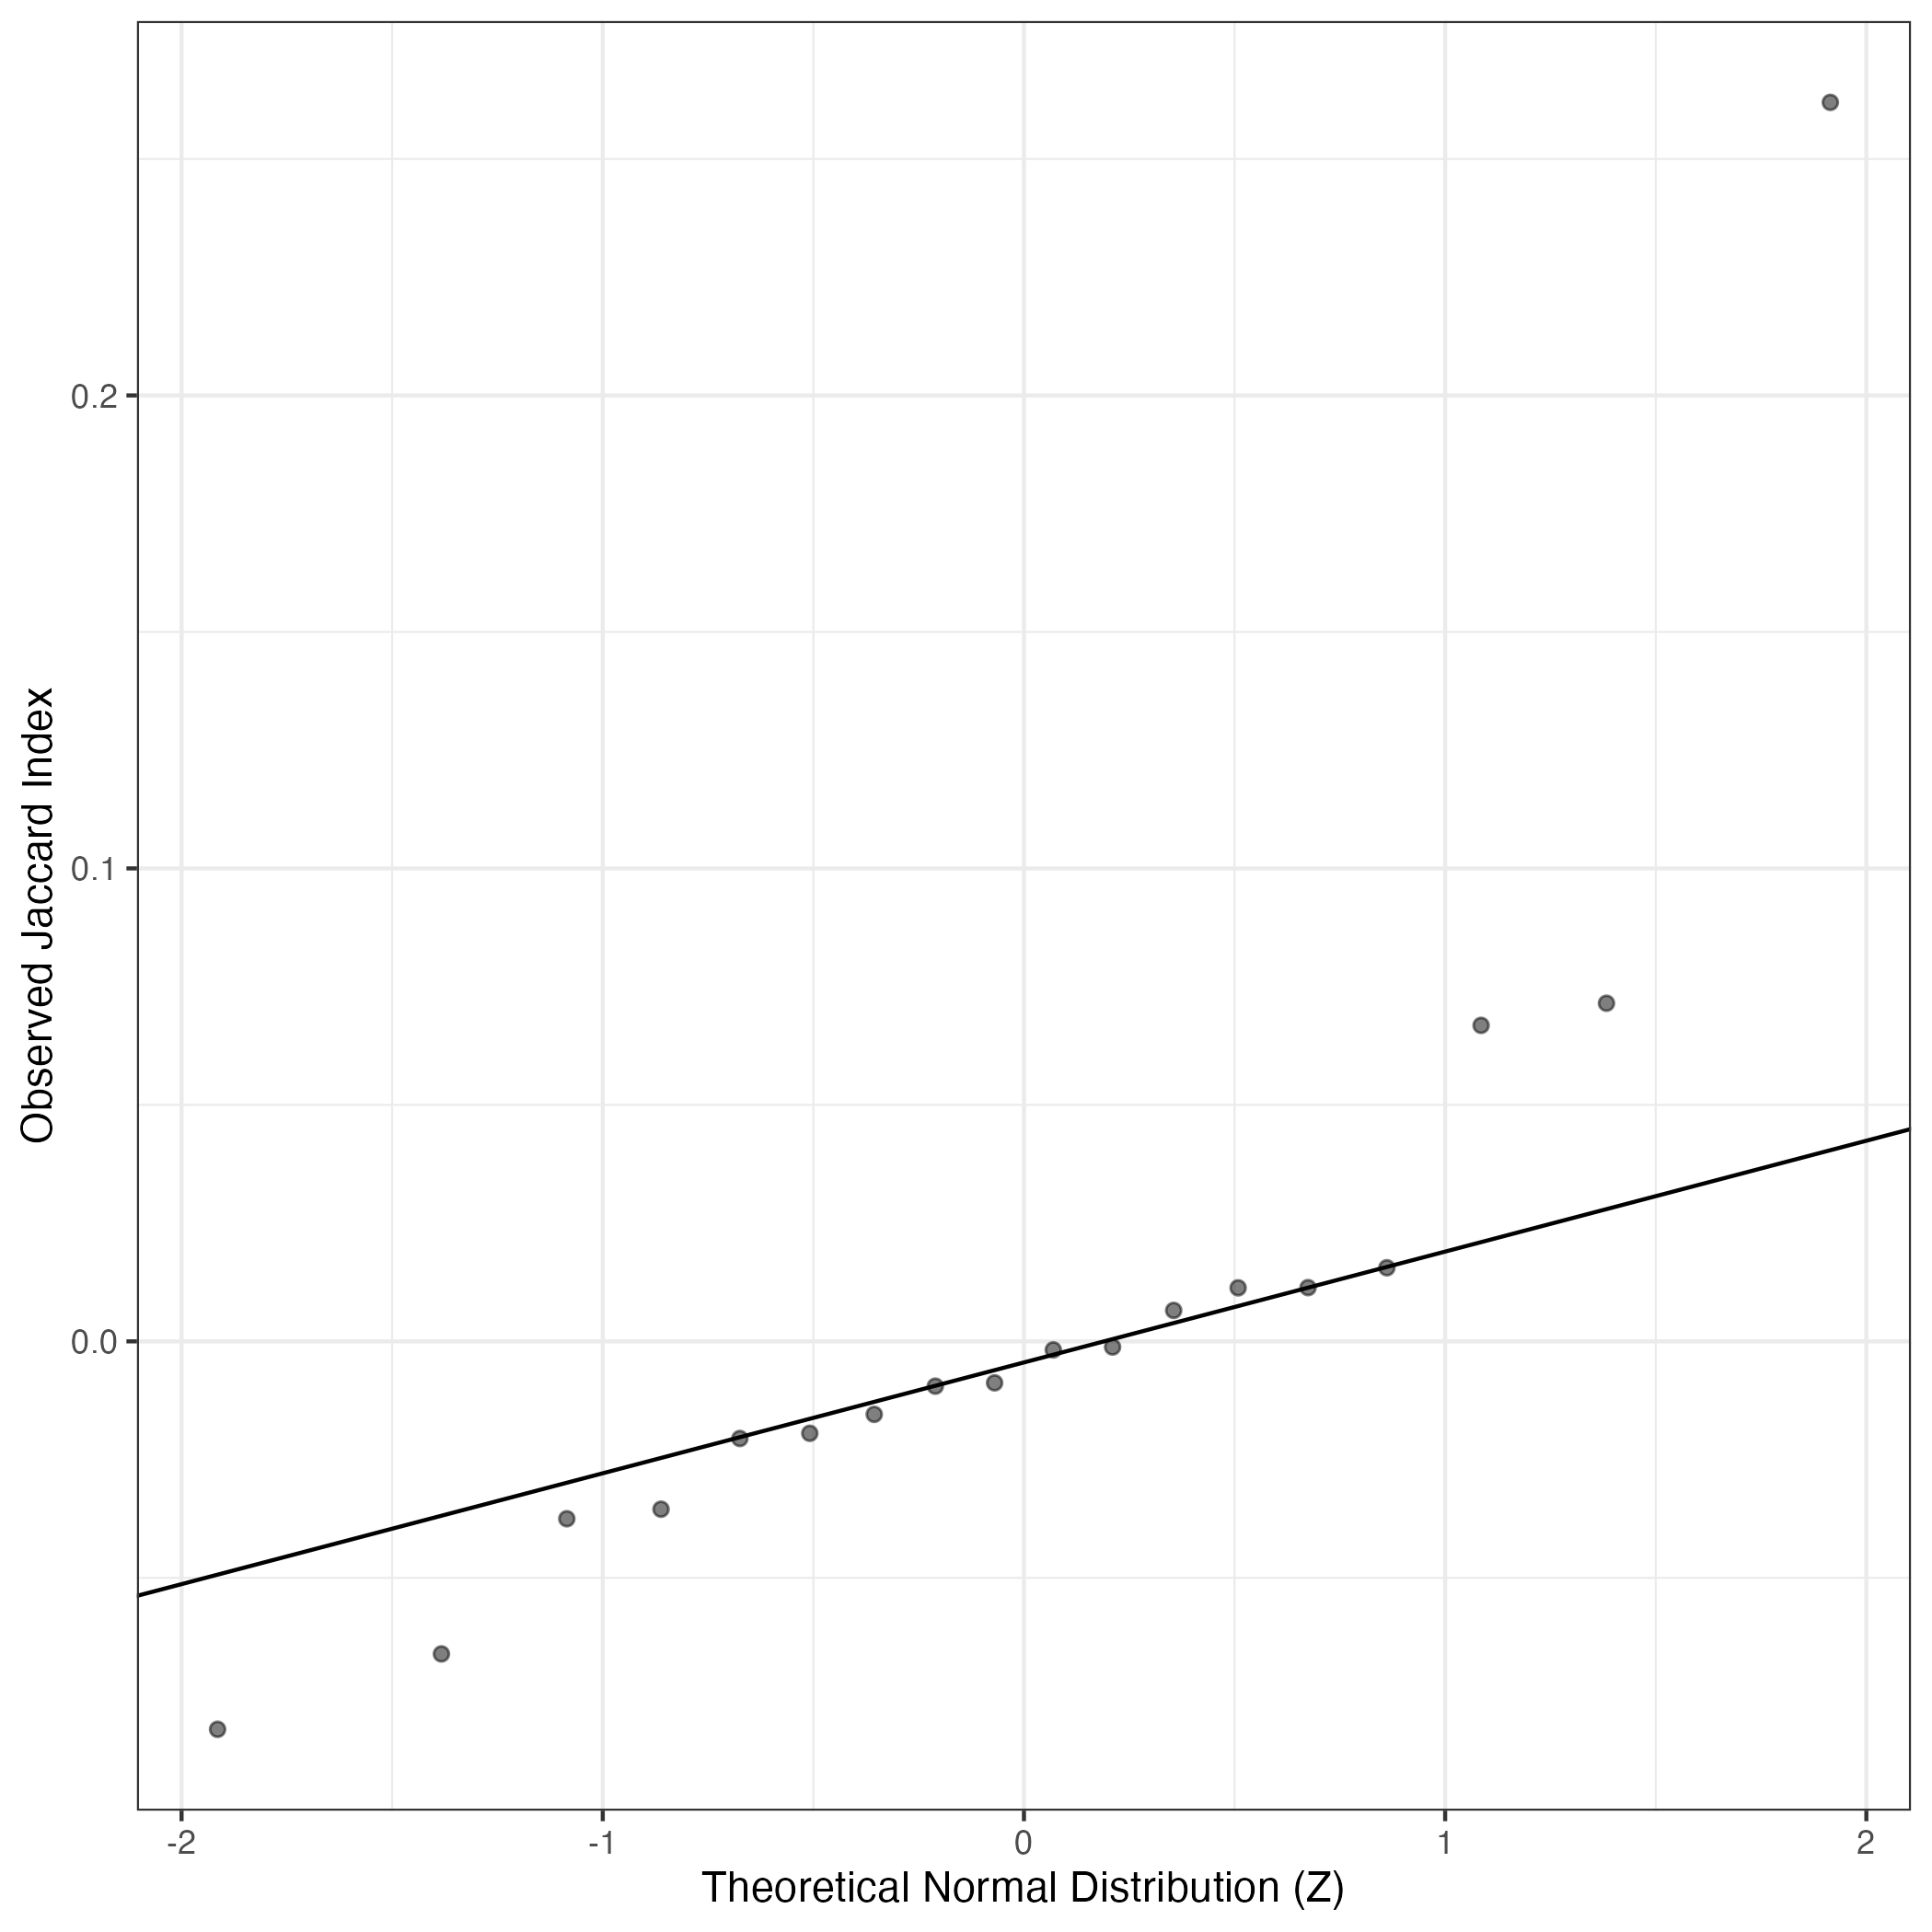
A similar QQ-plot as above, but only for instances where the H value is e.g. > 25, i.e. we are confident that the expression program is active above noise. Agreemenet between these binary vectors is tested using the Jaccard Index, with the P-values calculated by an exact test:
Interactive QQ-plot:
Singler cell type annotations for the top 50 cells on this program.
| Cell ID | Singler label | Singler Delta | Activity Score | Top Singler Raw Scores |
|---|---|---|---|---|
| WK050-I16 | Tissue_stem_cells:BM_MSC:BMP2 | 0.19 | 659.69 | Raw ScoresFibroblasts:breast: 0.48, iPS_cells:adipose_stem_cells: 0.47, Smooth_muscle_cells:vascular:IL-17: 0.47, Smooth_muscle_cells:vascular: 0.47, iPS_cells:CRL2097_foreskin: 0.47, Tissue_stem_cells:BM_MSC:TGFb3: 0.46, Smooth_muscle_cells:bronchial: 0.46, Chondrocytes:MSC-derived: 0.46, Tissue_stem_cells:BM_MSC:BMP2: 0.46, Osteoblasts: 0.46 |
| WK050-L9 | Chondrocytes:MSC-derived | 0.19 | 516.03 | Raw ScoresFibroblasts:breast: 0.47, iPS_cells:adipose_stem_cells: 0.47, Tissue_stem_cells:BM_MSC:TGFb3: 0.46, iPS_cells:CRL2097_foreskin: 0.46, Tissue_stem_cells:BM_MSC:BMP2: 0.46, Smooth_muscle_cells:vascular:IL-17: 0.46, Chondrocytes:MSC-derived: 0.46, Smooth_muscle_cells:vascular: 0.46, Osteoblasts: 0.45, Smooth_muscle_cells:bronchial: 0.45 |
| WK050-O22 | Tissue_stem_cells:BM_MSC:TGFb3 | 0.19 | 502.78 | Raw ScoresFibroblasts:breast: 0.46, iPS_cells:CRL2097_foreskin: 0.45, iPS_cells:adipose_stem_cells: 0.45, Smooth_muscle_cells:bronchial: 0.44, Osteoblasts: 0.44, Tissue_stem_cells:BM_MSC:TGFb3: 0.44, Chondrocytes:MSC-derived: 0.44, Smooth_muscle_cells:bronchial:vit_D: 0.44, Tissue_stem_cells:BM_MSC:BMP2: 0.44, Osteoblasts:BMP2: 0.44 |
| WK098-J15 | Smooth_muscle_cells:bronchial | 0.21 | 489.86 | Raw ScoresSmooth_muscle_cells:bronchial: 0.5, Tissue_stem_cells:BM_MSC:TGFb3: 0.49, Fibroblasts:breast: 0.49, Smooth_muscle_cells:bronchial:vit_D: 0.49, Chondrocytes:MSC-derived: 0.49, iPS_cells:CRL2097_foreskin: 0.49, Osteoblasts: 0.49, Smooth_muscle_cells:vascular: 0.48, Smooth_muscle_cells:vascular:IL-17: 0.48, Tissue_stem_cells:BM_MSC:BMP2: 0.48 |
| WK097-K14 | Tissue_stem_cells:BM_MSC:BMP2 | 0.19 | 476.13 | Raw ScoresFibroblasts:breast: 0.48, Smooth_muscle_cells:bronchial: 0.48, Smooth_muscle_cells:bronchial:vit_D: 0.48, Smooth_muscle_cells:vascular: 0.47, Smooth_muscle_cells:vascular:IL-17: 0.47, iPS_cells:adipose_stem_cells: 0.47, Chondrocytes:MSC-derived: 0.47, Osteoblasts: 0.47, Tissue_stem_cells:BM_MSC:TGFb3: 0.47, Tissue_stem_cells:BM_MSC:BMP2: 0.46 |
| WK098-N8 | Tissue_stem_cells:BM_MSC | 0.18 | 473.12 | Raw ScoresFibroblasts:breast: 0.51, Smooth_muscle_cells:vascular:IL-17: 0.51, Smooth_muscle_cells:vascular: 0.51, iPS_cells:adipose_stem_cells: 0.5, Osteoblasts: 0.5, iPS_cells:CRL2097_foreskin: 0.5, Smooth_muscle_cells:bronchial: 0.5, Chondrocytes:MSC-derived: 0.5, Tissue_stem_cells:BM_MSC:TGFb3: 0.5, Tissue_stem_cells:BM_MSC:BMP2: 0.5 |
| WK051-F14 | Smooth_muscle_cells:bronchial | 0.20 | 453.75 | Raw ScoresSmooth_muscle_cells:bronchial: 0.43, Smooth_muscle_cells:bronchial:vit_D: 0.42, Fibroblasts:breast: 0.42, iPS_cells:adipose_stem_cells: 0.41, Tissue_stem_cells:BM_MSC:TGFb3: 0.41, Tissue_stem_cells:BM_MSC:BMP2: 0.41, iPS_cells:CRL2097_foreskin: 0.41, Chondrocytes:MSC-derived: 0.41, Osteoblasts: 0.41, Smooth_muscle_cells:vascular: 0.41 |
| WK097-C15 | Chondrocytes:MSC-derived | 0.19 | 453.61 | Raw ScoresTissue_stem_cells:BM_MSC:TGFb3: 0.49, Chondrocytes:MSC-derived: 0.49, Fibroblasts:breast: 0.49, Smooth_muscle_cells:bronchial: 0.49, iPS_cells:adipose_stem_cells: 0.49, Smooth_muscle_cells:bronchial:vit_D: 0.49, Osteoblasts: 0.48, Smooth_muscle_cells:vascular:IL-17: 0.48, Tissue_stem_cells:BM_MSC:BMP2: 0.48, Smooth_muscle_cells:vascular: 0.48 |
| WK056-A7 | Chondrocytes:MSC-derived | 0.19 | 452.26 | Raw ScoresFibroblasts:breast: 0.45, iPS_cells:adipose_stem_cells: 0.44, Smooth_muscle_cells:vascular: 0.44, Smooth_muscle_cells:vascular:IL-17: 0.43, iPS_cells:CRL2097_foreskin: 0.43, Osteoblasts: 0.43, Chondrocytes:MSC-derived: 0.43, Smooth_muscle_cells:bronchial: 0.43, Tissue_stem_cells:BM_MSC:TGFb3: 0.43, Smooth_muscle_cells:bronchial:vit_D: 0.43 |
| WK057-K7 | Fibroblasts:breast | 0.20 | 450.64 | Raw ScoresFibroblasts:breast: 0.45, iPS_cells:CRL2097_foreskin: 0.44, iPS_cells:adipose_stem_cells: 0.44, Smooth_muscle_cells:vascular:IL-17: 0.43, Smooth_muscle_cells:vascular: 0.43, Osteoblasts: 0.43, Chondrocytes:MSC-derived: 0.43, Smooth_muscle_cells:bronchial: 0.43, Tissue_stem_cells:BM_MSC:TGFb3: 0.43, Smooth_muscle_cells:bronchial:vit_D: 0.43 |
| WK057-I23 | Chondrocytes:MSC-derived | 0.18 | 437.44 | Raw ScoresFibroblasts:breast: 0.41, iPS_cells:adipose_stem_cells: 0.4, iPS_cells:CRL2097_foreskin: 0.4, Smooth_muscle_cells:vascular:IL-17: 0.39, Osteoblasts: 0.39, Chondrocytes:MSC-derived: 0.39, Smooth_muscle_cells:bronchial: 0.39, Osteoblasts:BMP2: 0.39, Smooth_muscle_cells:vascular: 0.39, Smooth_muscle_cells:bronchial:vit_D: 0.39 |
| WK051-L17 | Fibroblasts:breast | 0.20 | 425.04 | Raw ScoresFibroblasts:breast: 0.42, iPS_cells:adipose_stem_cells: 0.41, iPS_cells:CRL2097_foreskin: 0.41, Smooth_muscle_cells:bronchial: 0.41, Osteoblasts: 0.4, Smooth_muscle_cells:bronchial:vit_D: 0.4, Chondrocytes:MSC-derived: 0.4, Smooth_muscle_cells:vascular:IL-17: 0.4, Tissue_stem_cells:BM_MSC:TGFb3: 0.4, Smooth_muscle_cells:vascular: 0.4 |
| WK055-I13 | Chondrocytes:MSC-derived | 0.18 | 415.91 | Raw ScoresFibroblasts:breast: 0.41, iPS_cells:adipose_stem_cells: 0.41, iPS_cells:CRL2097_foreskin: 0.4, Chondrocytes:MSC-derived: 0.4, Tissue_stem_cells:BM_MSC:TGFb3: 0.4, Osteoblasts: 0.4, Smooth_muscle_cells:vascular:IL-17: 0.4, Smooth_muscle_cells:bronchial: 0.4, Tissue_stem_cells:BM_MSC:BMP2: 0.4, Smooth_muscle_cells:bronchial:vit_D: 0.39 |
| WK055-G1 | Smooth_muscle_cells:vascular | 0.18 | 415.24 | Raw ScoresFibroblasts:breast: 0.45, iPS_cells:adipose_stem_cells: 0.44, Smooth_muscle_cells:vascular:IL-17: 0.43, Smooth_muscle_cells:vascular: 0.43, Tissue_stem_cells:BM_MSC:TGFb3: 0.43, Chondrocytes:MSC-derived: 0.43, iPS_cells:CRL2097_foreskin: 0.43, Smooth_muscle_cells:bronchial: 0.43, Osteoblasts: 0.43, Tissue_stem_cells:BM_MSC:BMP2: 0.43 |
| WK055-I1 | Tissue_stem_cells:BM_MSC:BMP2 | 0.18 | 412.27 | Raw ScoresFibroblasts:breast: 0.43, iPS_cells:adipose_stem_cells: 0.42, Smooth_muscle_cells:bronchial: 0.42, Tissue_stem_cells:BM_MSC:BMP2: 0.41, Chondrocytes:MSC-derived: 0.41, Osteoblasts: 0.41, Smooth_muscle_cells:vascular:IL-17: 0.41, Smooth_muscle_cells:bronchial:vit_D: 0.41, Smooth_muscle_cells:vascular: 0.41, Tissue_stem_cells:BM_MSC:TGFb3: 0.41 |
| WK098-F10 | Tissue_stem_cells:BM_MSC:TGFb3 | 0.17 | 410.68 | Raw ScoresChondrocytes:MSC-derived: 0.46, Fibroblasts:breast: 0.46, iPS_cells:adipose_stem_cells: 0.45, Tissue_stem_cells:BM_MSC:TGFb3: 0.45, Tissue_stem_cells:BM_MSC:BMP2: 0.45, iPS_cells:CRL2097_foreskin: 0.45, Smooth_muscle_cells:vascular:IL-17: 0.45, Osteoblasts: 0.45, Smooth_muscle_cells:bronchial: 0.45, Neurons:Schwann_cell: 0.45 |
| WK055-I14 | Smooth_muscle_cells:bronchial | 0.20 | 400.19 | Raw ScoresFibroblasts:breast: 0.45, iPS_cells:CRL2097_foreskin: 0.44, Smooth_muscle_cells:bronchial: 0.44, iPS_cells:adipose_stem_cells: 0.44, Smooth_muscle_cells:bronchial:vit_D: 0.43, Osteoblasts: 0.43, Tissue_stem_cells:BM_MSC:TGFb3: 0.43, Smooth_muscle_cells:vascular: 0.43, Smooth_muscle_cells:vascular:IL-17: 0.42, Chondrocytes:MSC-derived: 0.42 |
| WK056-J7 | Tissue_stem_cells:BM_MSC:BMP2 | 0.16 | 396.09 | Raw ScoresFibroblasts:breast: 0.42, iPS_cells:adipose_stem_cells: 0.42, Chondrocytes:MSC-derived: 0.41, iPS_cells:CRL2097_foreskin: 0.41, Smooth_muscle_cells:vascular:IL-17: 0.41, Smooth_muscle_cells:vascular: 0.41, Osteoblasts: 0.41, Tissue_stem_cells:BM_MSC:TGFb3: 0.41, Tissue_stem_cells:BM_MSC:BMP2: 0.4, Osteoblasts:BMP2: 0.4 |
| WK050-F7 | Tissue_stem_cells:BM_MSC:TGFb3 | 0.17 | 386.49 | Raw ScoresFibroblasts:breast: 0.41, Smooth_muscle_cells:vascular:IL-17: 0.4, Tissue_stem_cells:BM_MSC:TGFb3: 0.4, Tissue_stem_cells:BM_MSC:BMP2: 0.4, Chondrocytes:MSC-derived: 0.4, Osteoblasts: 0.4, iPS_cells:adipose_stem_cells: 0.4, Smooth_muscle_cells:vascular: 0.4, Osteoblasts:BMP2: 0.4, iPS_cells:CRL2097_foreskin: 0.39 |
| WK051-A17 | iPS_cells:adipose_stem_cells | 0.19 | 385.54 | Raw ScoresFibroblasts:breast: 0.43, iPS_cells:adipose_stem_cells: 0.42, iPS_cells:CRL2097_foreskin: 0.42, Smooth_muscle_cells:bronchial: 0.42, Chondrocytes:MSC-derived: 0.42, Smooth_muscle_cells:bronchial:vit_D: 0.42, Osteoblasts: 0.41, Tissue_stem_cells:BM_MSC:TGFb3: 0.41, Smooth_muscle_cells:vascular: 0.41, Smooth_muscle_cells:vascular:IL-17: 0.41 |
| WK055-J15 | Tissue_stem_cells:BM_MSC:TGFb3 | 0.19 | 376.11 | Raw ScoresFibroblasts:breast: 0.43, Smooth_muscle_cells:bronchial: 0.43, iPS_cells:adipose_stem_cells: 0.42, Smooth_muscle_cells:bronchial:vit_D: 0.42, iPS_cells:CRL2097_foreskin: 0.42, Chondrocytes:MSC-derived: 0.42, Osteoblasts: 0.42, Smooth_muscle_cells:vascular: 0.42, Tissue_stem_cells:BM_MSC:TGFb3: 0.42, Tissue_stem_cells:BM_MSC:BMP2: 0.42 |
| WK049-G11 | Tissue_stem_cells:BM_MSC:TGFb3 | 0.17 | 374.08 | Raw ScoresFibroblasts:breast: 0.4, Smooth_muscle_cells:bronchial: 0.4, Smooth_muscle_cells:bronchial:vit_D: 0.4, Smooth_muscle_cells:vascular:IL-17: 0.39, Tissue_stem_cells:BM_MSC:TGFb3: 0.39, iPS_cells:adipose_stem_cells: 0.39, Smooth_muscle_cells:vascular: 0.39, iPS_cells:CRL2097_foreskin: 0.39, Tissue_stem_cells:BM_MSC:BMP2: 0.39, Chondrocytes:MSC-derived: 0.39 |
| WK057-I1 | Osteoblasts | 0.19 | 372.30 | Raw ScoresFibroblasts:breast: 0.45, Osteoblasts: 0.44, Tissue_stem_cells:BM_MSC:TGFb3: 0.44, iPS_cells:CRL2097_foreskin: 0.44, Smooth_muscle_cells:bronchial: 0.44, iPS_cells:adipose_stem_cells: 0.44, Chondrocytes:MSC-derived: 0.44, Tissue_stem_cells:BM_MSC:BMP2: 0.44, Smooth_muscle_cells:bronchial:vit_D: 0.43, Osteoblasts:BMP2: 0.43 |
| WK057-M15 | Tissue_stem_cells:BM_MSC:TGFb3 | 0.18 | 365.36 | Raw ScoresFibroblasts:breast: 0.4, iPS_cells:adipose_stem_cells: 0.4, Smooth_muscle_cells:bronchial: 0.39, Tissue_stem_cells:BM_MSC:TGFb3: 0.39, Chondrocytes:MSC-derived: 0.39, iPS_cells:CRL2097_foreskin: 0.39, Osteoblasts: 0.39, Smooth_muscle_cells:bronchial:vit_D: 0.39, Smooth_muscle_cells:vascular:IL-17: 0.39, Tissue_stem_cells:BM_MSC:BMP2: 0.39 |
| WK059-I19 | Tissue_stem_cells:BM_MSC:BMP2 | 0.20 | 364.68 | Raw ScoresFibroblasts:breast: 0.48, Smooth_muscle_cells:vascular: 0.47, Osteoblasts: 0.47, Smooth_muscle_cells:vascular:IL-17: 0.47, iPS_cells:CRL2097_foreskin: 0.47, Tissue_stem_cells:BM_MSC:TGFb3: 0.47, iPS_cells:adipose_stem_cells: 0.47, Chondrocytes:MSC-derived: 0.47, Smooth_muscle_cells:bronchial: 0.46, Tissue_stem_cells:BM_MSC:BMP2: 0.46 |
| WK050-I15 | Tissue_stem_cells:BM_MSC:TGFb3 | 0.18 | 361.39 | Raw ScoresFibroblasts:breast: 0.44, Smooth_muscle_cells:vascular:IL-17: 0.43, iPS_cells:adipose_stem_cells: 0.43, Tissue_stem_cells:BM_MSC:TGFb3: 0.43, Smooth_muscle_cells:bronchial: 0.43, Smooth_muscle_cells:vascular: 0.43, Smooth_muscle_cells:bronchial:vit_D: 0.43, Chondrocytes:MSC-derived: 0.43, Tissue_stem_cells:BM_MSC:BMP2: 0.43, iPS_cells:CRL2097_foreskin: 0.43 |
| WK098-C4 | Tissue_stem_cells:BM_MSC:TGFb3 | 0.19 | 357.06 | Raw ScoresFibroblasts:breast: 0.47, Tissue_stem_cells:BM_MSC:TGFb3: 0.46, iPS_cells:CRL2097_foreskin: 0.46, Smooth_muscle_cells:bronchial: 0.46, iPS_cells:adipose_stem_cells: 0.46, Chondrocytes:MSC-derived: 0.46, Smooth_muscle_cells:bronchial:vit_D: 0.46, Tissue_stem_cells:BM_MSC:BMP2: 0.46, Smooth_muscle_cells:vascular:IL-17: 0.46, Osteoblasts: 0.45 |
| WK057-F3 | Smooth_muscle_cells:bronchial | 0.17 | 354.65 | Raw ScoresFibroblasts:breast: 0.4, iPS_cells:adipose_stem_cells: 0.39, iPS_cells:CRL2097_foreskin: 0.39, Smooth_muscle_cells:bronchial: 0.39, Tissue_stem_cells:BM_MSC:BMP2: 0.39, Chondrocytes:MSC-derived: 0.39, Tissue_stem_cells:BM_MSC:TGFb3: 0.39, Smooth_muscle_cells:vascular:IL-17: 0.39, Smooth_muscle_cells:bronchial:vit_D: 0.39, Smooth_muscle_cells:vascular: 0.38 |
| WK051-H4 | Smooth_muscle_cells:bronchial | 0.15 | 352.17 | Raw ScoresFibroblasts:breast: 0.37, Smooth_muscle_cells:vascular:IL-17: 0.37, iPS_cells:adipose_stem_cells: 0.37, Smooth_muscle_cells:vascular: 0.37, Smooth_muscle_cells:bronchial: 0.37, Smooth_muscle_cells:bronchial:vit_D: 0.37, Chondrocytes:MSC-derived: 0.37, Tissue_stem_cells:BM_MSC:BMP2: 0.37, iPS_cells:CRL2097_foreskin: 0.36, Tissue_stem_cells:BM_MSC:TGFb3: 0.36 |
| WK059-C5 | iPS_cells:adipose_stem_cells | 0.20 | 351.85 | Raw ScoresFibroblasts:breast: 0.47, iPS_cells:adipose_stem_cells: 0.46, iPS_cells:CRL2097_foreskin: 0.46, Smooth_muscle_cells:bronchial: 0.46, Smooth_muscle_cells:bronchial:vit_D: 0.45, Smooth_muscle_cells:vascular:IL-17: 0.45, Smooth_muscle_cells:vascular: 0.45, Osteoblasts: 0.45, Chondrocytes:MSC-derived: 0.45, Tissue_stem_cells:BM_MSC:TGFb3: 0.45 |
| WK051-M22 | Fibroblasts:breast | 0.20 | 351.64 | Raw ScoresFibroblasts:breast: 0.43, Smooth_muscle_cells:vascular:IL-17: 0.42, iPS_cells:adipose_stem_cells: 0.42, Osteoblasts: 0.41, Smooth_muscle_cells:vascular: 0.41, Chondrocytes:MSC-derived: 0.41, Tissue_stem_cells:BM_MSC:TGFb3: 0.41, iPS_cells:CRL2097_foreskin: 0.41, Smooth_muscle_cells:bronchial: 0.41, Smooth_muscle_cells:bronchial:vit_D: 0.41 |
| WK050-A16 | Smooth_muscle_cells:bronchial | 0.20 | 349.98 | Raw ScoresFibroblasts:breast: 0.46, iPS_cells:CRL2097_foreskin: 0.44, iPS_cells:adipose_stem_cells: 0.44, Smooth_muscle_cells:bronchial: 0.44, Smooth_muscle_cells:bronchial:vit_D: 0.44, Osteoblasts: 0.44, Tissue_stem_cells:BM_MSC:TGFb3: 0.43, Osteoblasts:BMP2: 0.43, Tissue_stem_cells:BM_MSC:BMP2: 0.43, Smooth_muscle_cells:vascular:IL-17: 0.43 |
| WK051-O22 | Tissue_stem_cells:BM_MSC:BMP2 | 0.15 | 349.09 | Raw ScoresiPS_cells:adipose_stem_cells: 0.41, Fibroblasts:breast: 0.41, Tissue_stem_cells:BM_MSC:BMP2: 0.4, Smooth_muscle_cells:bronchial: 0.4, Tissue_stem_cells:BM_MSC:TGFb3: 0.4, iPS_cells:CRL2097_foreskin: 0.4, Smooth_muscle_cells:bronchial:vit_D: 0.4, Chondrocytes:MSC-derived: 0.4, Osteoblasts: 0.4, Smooth_muscle_cells:vascular:IL-17: 0.4 |
| WK049-O21 | iPS_cells:CRL2097_foreskin | 0.18 | 347.89 | Raw ScoresFibroblasts:breast: 0.41, iPS_cells:CRL2097_foreskin: 0.41, iPS_cells:adipose_stem_cells: 0.4, Smooth_muscle_cells:bronchial: 0.4, Chondrocytes:MSC-derived: 0.4, Tissue_stem_cells:BM_MSC:TGFb3: 0.4, Smooth_muscle_cells:bronchial:vit_D: 0.4, Smooth_muscle_cells:vascular:IL-17: 0.4, Osteoblasts: 0.39, Tissue_stem_cells:BM_MSC:BMP2: 0.39 |
| WK051-F16 | Tissue_stem_cells:BM_MSC:BMP2 | 0.19 | 338.29 | Raw ScoresFibroblasts:breast: 0.44, iPS_cells:adipose_stem_cells: 0.44, iPS_cells:CRL2097_foreskin: 0.43, Smooth_muscle_cells:bronchial: 0.43, Chondrocytes:MSC-derived: 0.43, Tissue_stem_cells:BM_MSC:TGFb3: 0.43, Tissue_stem_cells:BM_MSC:BMP2: 0.43, Osteoblasts: 0.43, Smooth_muscle_cells:bronchial:vit_D: 0.43, Smooth_muscle_cells:vascular:IL-17: 0.43 |
| WK051-H5 | Tissue_stem_cells:BM_MSC:TGFb3 | 0.17 | 338.01 | Raw ScoresFibroblasts:breast: 0.43, iPS_cells:CRL2097_foreskin: 0.43, Smooth_muscle_cells:bronchial: 0.42, Chondrocytes:MSC-derived: 0.42, Smooth_muscle_cells:bronchial:vit_D: 0.42, Osteoblasts: 0.42, Tissue_stem_cells:BM_MSC:TGFb3: 0.42, Smooth_muscle_cells:vascular:IL-17: 0.42, iPS_cells:adipose_stem_cells: 0.42, Smooth_muscle_cells:vascular: 0.42 |
| WK051-M21 | Tissue_stem_cells:BM_MSC:BMP2 | 0.17 | 330.12 | Raw ScoresFibroblasts:breast: 0.44, iPS_cells:CRL2097_foreskin: 0.43, iPS_cells:adipose_stem_cells: 0.42, Chondrocytes:MSC-derived: 0.42, Tissue_stem_cells:BM_MSC:TGFb3: 0.42, Smooth_muscle_cells:vascular:IL-17: 0.42, Tissue_stem_cells:BM_MSC:BMP2: 0.42, Osteoblasts: 0.42, Smooth_muscle_cells:vascular: 0.42, Smooth_muscle_cells:bronchial: 0.42 |
| WK098-H12 | Tissue_stem_cells:BM_MSC:BMP2 | 0.16 | 329.75 | Raw ScoresNeurons:Schwann_cell: 0.43, Fibroblasts:breast: 0.43, Smooth_muscle_cells:vascular:IL-17: 0.43, Chondrocytes:MSC-derived: 0.43, Smooth_muscle_cells:vascular: 0.43, Tissue_stem_cells:BM_MSC:BMP2: 0.42, iPS_cells:adipose_stem_cells: 0.42, Tissue_stem_cells:BM_MSC:TGFb3: 0.42, Smooth_muscle_cells:bronchial: 0.42, iPS_cells:CRL2097_foreskin: 0.42 |
| WK050-F9 | Tissue_stem_cells:BM_MSC:TGFb3 | 0.17 | 329.17 | Raw ScoresFibroblasts:breast: 0.41, iPS_cells:adipose_stem_cells: 0.4, Tissue_stem_cells:BM_MSC:TGFb3: 0.4, iPS_cells:CRL2097_foreskin: 0.4, Smooth_muscle_cells:vascular:IL-17: 0.4, Chondrocytes:MSC-derived: 0.4, Smooth_muscle_cells:bronchial: 0.4, Smooth_muscle_cells:vascular: 0.4, Tissue_stem_cells:BM_MSC:BMP2: 0.4, Osteoblasts: 0.39 |
| WK098-C18 | Tissue_stem_cells:BM_MSC:BMP2 | 0.18 | 329.11 | Raw ScoresFibroblasts:breast: 0.46, iPS_cells:adipose_stem_cells: 0.45, Tissue_stem_cells:BM_MSC:TGFb3: 0.45, Tissue_stem_cells:BM_MSC:BMP2: 0.45, Smooth_muscle_cells:vascular:IL-17: 0.45, Smooth_muscle_cells:bronchial: 0.45, Smooth_muscle_cells:bronchial:vit_D: 0.45, iPS_cells:CRL2097_foreskin: 0.45, Osteoblasts: 0.45, Smooth_muscle_cells:vascular: 0.44 |
| WK051-M17 | Tissue_stem_cells:BM_MSC:BMP2 | 0.17 | 328.17 | Raw ScoresFibroblasts:breast: 0.39, Chondrocytes:MSC-derived: 0.38, Tissue_stem_cells:BM_MSC:TGFb3: 0.38, iPS_cells:CRL2097_foreskin: 0.38, Tissue_stem_cells:BM_MSC:BMP2: 0.38, Smooth_muscle_cells:vascular:IL-17: 0.38, Smooth_muscle_cells:bronchial: 0.38, Osteoblasts: 0.38, iPS_cells:adipose_stem_cells: 0.38, Smooth_muscle_cells:bronchial:vit_D: 0.38 |
| WK057-L11 | Tissue_stem_cells:BM_MSC:BMP2 | 0.16 | 322.10 | Raw ScoresFibroblasts:breast: 0.39, Smooth_muscle_cells:vascular:IL-17: 0.38, iPS_cells:adipose_stem_cells: 0.38, Smooth_muscle_cells:vascular: 0.38, Osteoblasts: 0.38, Chondrocytes:MSC-derived: 0.38, iPS_cells:CRL2097_foreskin: 0.38, Tissue_stem_cells:BM_MSC:BMP2: 0.37, Tissue_stem_cells:BM_MSC:TGFb3: 0.37, Osteoblasts:BMP2: 0.37 |
| WK056-G1 | Tissue_stem_cells:BM_MSC:TGFb3 | 0.16 | 319.55 | Raw ScoresFibroblasts:breast: 0.42, Smooth_muscle_cells:vascular:IL-17: 0.42, iPS_cells:CRL2097_foreskin: 0.42, Chondrocytes:MSC-derived: 0.42, Tissue_stem_cells:BM_MSC:TGFb3: 0.42, iPS_cells:adipose_stem_cells: 0.42, Smooth_muscle_cells:vascular: 0.41, Tissue_stem_cells:BM_MSC:BMP2: 0.41, Smooth_muscle_cells:bronchial: 0.41, Smooth_muscle_cells:bronchial:vit_D: 0.41 |
| WK055-F18 | Tissue_stem_cells:BM_MSC:BMP2 | 0.17 | 315.81 | Raw ScoresTissue_stem_cells:BM_MSC:TGFb3: 0.39, Fibroblasts:breast: 0.39, Smooth_muscle_cells:vascular:IL-17: 0.39, Chondrocytes:MSC-derived: 0.39, Tissue_stem_cells:BM_MSC:BMP2: 0.39, iPS_cells:CRL2097_foreskin: 0.38, Osteoblasts: 0.38, Smooth_muscle_cells:vascular: 0.38, iPS_cells:adipose_stem_cells: 0.38, Smooth_muscle_cells:bronchial: 0.38 |
| WK055-O4 | Tissue_stem_cells:BM_MSC:TGFb3 | 0.17 | 312.71 | Raw ScoresFibroblasts:breast: 0.45, iPS_cells:adipose_stem_cells: 0.44, Smooth_muscle_cells:bronchial: 0.43, Tissue_stem_cells:BM_MSC:TGFb3: 0.43, Chondrocytes:MSC-derived: 0.43, Smooth_muscle_cells:bronchial:vit_D: 0.43, Smooth_muscle_cells:vascular: 0.43, Smooth_muscle_cells:vascular:IL-17: 0.43, Osteoblasts: 0.43, iPS_cells:CRL2097_foreskin: 0.43 |
| WK101-J15 | Tissue_stem_cells:BM_MSC:BMP2 | 0.18 | 310.62 | Raw ScoresFibroblasts:breast: 0.45, Smooth_muscle_cells:bronchial: 0.45, iPS_cells:adipose_stem_cells: 0.44, Chondrocytes:MSC-derived: 0.44, iPS_cells:CRL2097_foreskin: 0.44, Smooth_muscle_cells:bronchial:vit_D: 0.44, Osteoblasts: 0.44, Smooth_muscle_cells:vascular:IL-17: 0.44, Tissue_stem_cells:BM_MSC:TGFb3: 0.44, Smooth_muscle_cells:vascular: 0.43 |
| WK051-N9 | Fibroblasts:breast | 0.19 | 309.23 | Raw ScoresFibroblasts:breast: 0.41, iPS_cells:CRL2097_foreskin: 0.41, Smooth_muscle_cells:vascular:IL-17: 0.41, iPS_cells:adipose_stem_cells: 0.4, Chondrocytes:MSC-derived: 0.4, Smooth_muscle_cells:vascular: 0.4, Osteoblasts: 0.39, Tissue_stem_cells:BM_MSC:TGFb3: 0.39, Smooth_muscle_cells:bronchial: 0.39, Osteoblasts:BMP2: 0.39 |
| WK097-B15 | Neurons:Schwann_cell | 0.14 | 305.85 | Raw ScoresFibroblasts:breast: 0.46, Chondrocytes:MSC-derived: 0.45, iPS_cells:adipose_stem_cells: 0.45, Smooth_muscle_cells:bronchial: 0.45, Tissue_stem_cells:BM_MSC:BMP2: 0.45, iPS_cells:CRL2097_foreskin: 0.45, Osteoblasts: 0.45, Smooth_muscle_cells:vascular: 0.45, Smooth_muscle_cells:vascular:IL-17: 0.45, Smooth_muscle_cells:bronchial:vit_D: 0.45 |
| WK098-O19 | Neurons:Schwann_cell | 0.18 | 298.54 | Raw ScoresFibroblasts:breast: 0.45, iPS_cells:adipose_stem_cells: 0.44, Osteoblasts: 0.44, Chondrocytes:MSC-derived: 0.44, iPS_cells:CRL2097_foreskin: 0.44, Smooth_muscle_cells:bronchial: 0.43, Tissue_stem_cells:BM_MSC:TGFb3: 0.43, Osteoblasts:BMP2: 0.43, Smooth_muscle_cells:vascular:IL-17: 0.43, Smooth_muscle_cells:vascular: 0.43 |
| WK055-D14 | Osteoblasts | 0.20 | 296.23 | Raw ScoresFibroblasts:breast: 0.44, Smooth_muscle_cells:bronchial: 0.43, iPS_cells:adipose_stem_cells: 0.43, iPS_cells:CRL2097_foreskin: 0.43, Smooth_muscle_cells:bronchial:vit_D: 0.42, Chondrocytes:MSC-derived: 0.42, Osteoblasts: 0.42, Tissue_stem_cells:BM_MSC:TGFb3: 0.42, Osteoblasts:BMP2: 0.42, Tissue_stem_cells:BM_MSC:BMP2: 0.41 |
Below shows the significant enrichments of this GEP for literature curated gene lists
This data was procured from existing single cell RNA-seq maps of neuroblastoma or related relevant data.
High ranks indicate this gene is a driver of this GEP.
These curated gene list are ranked by the P-value (on this GEP) of their constituent genes.
The Mean Count column shows the mean read count in cells scoring highly (H > 50) on this gene expression program.
Mesenchymal (Olsen)
Markers listed in on page 3 of the main text of Olsen et al. https://www.biorxiv.org/content/10.1101/2020.05.04.077057v1 - these markers are stated as being expressed in a group of mesenchymal-like cells (some at least claimed to be neuroblastoma cells) shown in their UMAP representation on Fig. 1D. They reference the two Nature Genetics paper.:
Wilcoxon ranksum test P-value for gene set overrepresentation: 4.46e-03
Mean rank of genes in gene set: 1539.25
Rank on gene expression program of genes in gene set:
| Genes | Weight | Rank | GTEx | DepMap | Decartes | Mean.Counts | Mean.TPM |
|---|---|---|---|---|---|---|---|
| DCN | 0.0066557 | 18 | GTEx | DepMap | Descartes | 65.98 | 2707.49 |
| PRRX1 | 0.0027156 | 236 | GTEx | DepMap | Descartes | 2.75 | 204.10 |
| PDGFRA | 0.0007088 | 1311 | GTEx | DepMap | Descartes | 1.19 | 45.86 |
| LEPR | -0.0000623 | 4592 | GTEx | DepMap | Descartes | 0.29 | 10.39 |
Inflammatory CAF
These marker genes were curated across cancer subtypes in multiple organ systems as reviewed in Lavie et. al. (PMID 35883004) and contain inflammatory specific CAF genes:
Wilcoxon ranksum test P-value for gene set overrepresentation: 6.76e-03
Mean rank of genes in gene set: 4487.2
Rank on gene expression program of genes in gene set:
| Genes | Weight | Rank | GTEx | DepMap | Decartes | Mean.Counts | Mean.TPM |
|---|---|---|---|---|---|---|---|
| LIF | 0.0086612 | 4 | GTEx | DepMap | Descartes | 15.10 | 1147.66 |
| CCL2 | 0.0080405 | 7 | GTEx | DepMap | Descartes | 69.43 | 21560.64 |
| SCARA5 | 0.0029524 | 197 | GTEx | DepMap | Descartes | 1.54 | 111.27 |
| HGF | 0.0026565 | 242 | GTEx | DepMap | Descartes | 1.02 | 47.26 |
| SCARA3 | 0.0023619 | 292 | GTEx | DepMap | Descartes | 1.45 | 118.87 |
| IGFBP6 | 0.0019957 | 398 | GTEx | DepMap | Descartes | 1.43 | 319.58 |
| PDGFRB | 0.0018848 | 429 | GTEx | DepMap | Descartes | 2.88 | 133.61 |
| SERPING1 | 0.0017595 | 482 | GTEx | DepMap | Descartes | 7.54 | 871.53 |
| IGF1 | 0.0017428 | 491 | GTEx | DepMap | Descartes | 3.75 | 109.48 |
| PDPN | 0.0013694 | 667 | GTEx | DepMap | Descartes | 0.91 | 65.50 |
| CFB | 0.0008895 | 1082 | GTEx | DepMap | Descartes | 0.12 | 8.99 |
| PDGFRA | 0.0007088 | 1311 | GTEx | DepMap | Descartes | 1.19 | 45.86 |
| CXCL12 | 0.0006585 | 1408 | GTEx | DepMap | Descartes | 3.73 | 288.17 |
| PDGFD | 0.0004320 | 1913 | GTEx | DepMap | Descartes | 0.62 | 38.64 |
| SOD2 | 0.0003152 | 2256 | GTEx | DepMap | Descartes | 12.67 | 203.88 |
| RGMA | 0.0000388 | 3634 | GTEx | DepMap | Descartes | 0.13 | 3.14 |
| IL1R1 | -0.0001073 | 5262 | GTEx | DepMap | Descartes | 1.71 | 72.27 |
| CXCL2 | -0.0002452 | 7538 | GTEx | DepMap | Descartes | 10.76 | 2079.77 |
| IL10 | -0.0005270 | 10749 | GTEx | DepMap | Descartes | 0.08 | 6.62 |
| IL33 | -0.0006483 | 11425 | GTEx | DepMap | Descartes | 0.36 | 31.43 |
| CFD | -0.0011825 | 12397 | GTEx | DepMap | Descartes | 0.69 | 132.73 |
| GPX3 | -0.0012700 | 12432 | GTEx | DepMap | Descartes | 0.36 | 34.50 |
| C3 | -0.0014669 | 12486 | GTEx | DepMap | Descartes | 4.57 | 181.77 |
| CXCL14 | -0.0019523 | 12535 | GTEx | DepMap | Descartes | 0.56 | 69.75 |
| C7 | -0.0020766 | 12543 | GTEx | DepMap | Descartes | 3.67 | 123.93 |
Bridge region mesencchymal (Olsen)
Marker genes shown in Fig. 3A of Olsen et al. https://www.biorxiv.org/content/10.1101/2020.05.04.077057v1 - Cells were ordered by pseudotime in the bridge region, this first group of cells were from the mesenchymal part of the trajectory.:
Wilcoxon ranksum test P-value for gene set overrepresentation: 9.26e-03
Mean rank of genes in gene set: 3909.92
Rank on gene expression program of genes in gene set:
| Genes | Weight | Rank | GTEx | DepMap | Decartes | Mean.Counts | Mean.TPM |
|---|---|---|---|---|---|---|---|
| LUM | 0.0079736 | 8 | GTEx | DepMap | Descartes | 48.81 | 4979.99 |
| MAFF | 0.0031030 | 173 | GTEx | DepMap | Descartes | 6.77 | 607.17 |
| PRRX1 | 0.0027156 | 236 | GTEx | DepMap | Descartes | 2.75 | 204.10 |
| MYC | 0.0018451 | 453 | GTEx | DepMap | Descartes | 2.85 | 240.71 |
| CALD1 | 0.0013753 | 660 | GTEx | DepMap | Descartes | 6.78 | 352.44 |
| FGF1 | 0.0008655 | 1112 | GTEx | DepMap | Descartes | 0.15 | 10.34 |
| PDGFRA | 0.0007088 | 1311 | GTEx | DepMap | Descartes | 1.19 | 45.86 |
| KLF4 | 0.0006225 | 1478 | GTEx | DepMap | Descartes | 4.80 | 494.47 |
| COL1A2 | 0.0000118 | 3867 | GTEx | DepMap | Descartes | 31.50 | 1208.43 |
| TNNT2 | -0.0002055 | 6889 | GTEx | DepMap | Descartes | 0.01 | 0.39 |
| NPNT | -0.0004989 | 10536 | GTEx | DepMap | Descartes | 0.05 | 1.60 |
| PODXL | -0.0006895 | 11573 | GTEx | DepMap | Descartes | 0.11 | 2.57 |
| BGN | -0.0018968 | 12533 | GTEx | DepMap | Descartes | 3.72 | 283.29 |
Below shows ranks on this GEP for literature curated gene lists for large gene sets
These include those reported as mesenchymal/adrenergic by Van Groningen et al.
High ranks indicate this gene is a driver of this GEP (note these results are not ordered).
The Mean Count column shows the mean read count in cells scoring highly (H > 50) on this gene expression program.
VanGroningen Adrenergic Genes
Adrenergic marker genes from Supplementary Table 2 of Van Groningen et al. Nature Genetics 2017. These genes were identified by differential expression analysis of mesenchymal-like and adrenergic-like neuroblastoma cell lines.
Wilcoxon ranksum test P-value for gene set overrepresentation: 1.00e+00
Mean rank of genes in gene set: 9065.18
Median rank of genes in gene set: 10708
Rank on gene expression program of top 30 genes in gene set:
| Genes | Weight | Rank | GTEx | DepMap | Descartes | Mean.Counts | Mean.TPM |
|---|---|---|---|---|---|---|---|
| TIAM1 | 0.0048898 | 52 | GTEx | DepMap | Descartes | 2.33 | 92.82 |
| MAP1B | 0.0045458 | 64 | GTEx | DepMap | Descartes | 14.86 | 337.30 |
| AKAP12 | 0.0041938 | 89 | GTEx | DepMap | Descartes | 5.64 | 179.79 |
| ATP6V1B2 | 0.0029639 | 196 | GTEx | DepMap | Descartes | 3.97 | 153.53 |
| HMGA1 | 0.0028138 | 216 | GTEx | DepMap | Descartes | 2.37 | 292.90 |
| RBMS3 | 0.0025319 | 265 | GTEx | DepMap | Descartes | 2.98 | 102.11 |
| BMP7 | 0.0023457 | 299 | GTEx | DepMap | Descartes | 0.54 | 36.11 |
| SLIT3 | 0.0023417 | 301 | GTEx | DepMap | Descartes | 3.70 | 101.61 |
| FOXO3 | 0.0022605 | 321 | GTEx | DepMap | Descartes | 4.27 | 166.32 |
| NFIL3 | 0.0020770 | 378 | GTEx | DepMap | Descartes | 2.51 | 353.14 |
| RGS17 | 0.0016233 | 537 | GTEx | DepMap | Descartes | 0.31 | 9.98 |
| HK2 | 0.0014701 | 607 | GTEx | DepMap | Descartes | 0.48 | 20.86 |
| TUBB4B | 0.0012717 | 734 | GTEx | DepMap | Descartes | 3.67 | 484.43 |
| HNRNPA0 | 0.0012237 | 766 | GTEx | DepMap | Descartes | 2.82 | 95.21 |
| FAM171B | 0.0012053 | 779 | GTEx | DepMap | Descartes | 0.67 | 37.90 |
| TACC2 | 0.0011700 | 806 | GTEx | DepMap | Descartes | 0.32 | 8.60 |
| CELF2 | 0.0011621 | 814 | GTEx | DepMap | Descartes | 2.49 | 90.68 |
| AHSA1 | 0.0007443 | 1258 | GTEx | DepMap | Descartes | 1.64 | 304.13 |
| TUBB2A | 0.0006734 | 1381 | GTEx | DepMap | Descartes | 2.14 | 328.30 |
| NCS1 | 0.0006168 | 1489 | GTEx | DepMap | Descartes | 0.48 | 24.68 |
| RUFY3 | 0.0006141 | 1492 | GTEx | DepMap | Descartes | 1.15 | 74.47 |
| TTC8 | 0.0004490 | 1867 | GTEx | DepMap | Descartes | 0.14 | 6.30 |
| ANK2 | 0.0003985 | 2017 | GTEx | DepMap | Descartes | 0.90 | 17.58 |
| SLC35G2 | 0.0003516 | 2146 | GTEx | DepMap | Descartes | 0.20 | NA |
| TDG | 0.0003141 | 2258 | GTEx | DepMap | Descartes | 0.50 | 43.64 |
| STRA6 | 0.0002936 | 2324 | GTEx | DepMap | Descartes | 0.05 | 4.62 |
| MAGI3 | 0.0002879 | 2351 | GTEx | DepMap | Descartes | 0.30 | 12.08 |
| PTS | 0.0002765 | 2392 | GTEx | DepMap | Descartes | 0.39 | 99.36 |
| DNER | 0.0002509 | 2490 | GTEx | DepMap | Descartes | 0.10 | 8.19 |
| EXOC5 | 0.0002189 | 2617 | GTEx | DepMap | Descartes | 0.64 | 16.66 |
VanGroningen Mesenchymal Genes
Mesenchymal marker genes from Supplementary Table 2 of Van Groningen et al. Nature Genetics 2017. These genes were identified by differential expression analysis of mesenchymal-like and adrenergic-like neuroblastoma cell lines.
Wilcoxon ranksum test P-value for gene set overrepresentation: 9.69e-46
Mean rank of genes in gene set: 3860.62
Median rank of genes in gene set: 1879
Rank on gene expression program of top 30 genes in gene set:
| Genes | Weight | Rank | GTEx | DepMap | Descartes | Mean.Counts | Mean.TPM |
|---|---|---|---|---|---|---|---|
| EMP1 | 0.0094562 | 2 | GTEx | DepMap | Descartes | 39.52 | 1947.89 |
| THBS1 | 0.0067087 | 16 | GTEx | DepMap | Descartes | 38.07 | 1452.17 |
| S1PR3 | 0.0066703 | 17 | GTEx | DepMap | Descartes | 6.04 | 202.18 |
| EGFR | 0.0065333 | 19 | GTEx | DepMap | Descartes | 6.70 | 211.65 |
| FN1 | 0.0064211 | 22 | GTEx | DepMap | Descartes | 26.36 | 784.78 |
| TNFRSF12A | 0.0063445 | 23 | GTEx | DepMap | Descartes | 4.94 | 855.81 |
| CFH | 0.0061403 | 26 | GTEx | DepMap | Descartes | 10.59 | 453.59 |
| MEST | 0.0057630 | 31 | GTEx | DepMap | Descartes | 3.47 | 319.00 |
| UGDH | 0.0055700 | 34 | GTEx | DepMap | Descartes | 6.68 | 645.30 |
| GSN | 0.0055647 | 35 | GTEx | DepMap | Descartes | 22.16 | 1025.64 |
| OLFML2B | 0.0053294 | 42 | GTEx | DepMap | Descartes | 6.70 | 566.55 |
| FGFR1 | 0.0052568 | 43 | GTEx | DepMap | Descartes | 11.87 | 555.91 |
| TFPI | 0.0051289 | 45 | GTEx | DepMap | Descartes | 5.16 | 196.80 |
| TM4SF1 | 0.0050563 | 46 | GTEx | DepMap | Descartes | 19.49 | 1721.22 |
| ANXA1 | 0.0049648 | 49 | GTEx | DepMap | Descartes | 19.94 | 2433.59 |
| FBN2 | 0.0048333 | 54 | GTEx | DepMap | Descartes | 0.83 | 20.71 |
| SDC2 | 0.0048237 | 55 | GTEx | DepMap | Descartes | 3.87 | 331.37 |
| EPS8 | 0.0047791 | 56 | GTEx | DepMap | Descartes | 3.03 | 174.18 |
| PXDC1 | 0.0046731 | 58 | GTEx | DepMap | Descartes | 3.65 | 555.38 |
| NID1 | 0.0044697 | 70 | GTEx | DepMap | Descartes | 4.64 | 198.49 |
| EGR3 | 0.0044632 | 71 | GTEx | DepMap | Descartes | 7.24 | 507.90 |
| DLC1 | 0.0044557 | 72 | GTEx | DepMap | Descartes | 5.21 | 200.32 |
| ANXA5 | 0.0043676 | 77 | GTEx | DepMap | Descartes | 14.01 | 2195.49 |
| SASH1 | 0.0041263 | 90 | GTEx | DepMap | Descartes | 4.20 | 153.71 |
| FZD1 | 0.0040583 | 98 | GTEx | DepMap | Descartes | 1.64 | 61.07 |
| FAT1 | 0.0040044 | 100 | GTEx | DepMap | Descartes | 2.59 | 46.20 |
| WWTR1 | 0.0039913 | 101 | GTEx | DepMap | Descartes | 3.82 | 190.89 |
| SRPX | 0.0039398 | 104 | GTEx | DepMap | Descartes | 5.59 | 797.19 |
| CALU | 0.0038769 | 108 | GTEx | DepMap | Descartes | 4.44 | 229.69 |
| NR3C1 | 0.0036295 | 119 | GTEx | DepMap | Descartes | 6.43 | 240.27 |
Descartes adrenocortical markers
Top 50 marker genes of adrenocortical cells in the Decartes fetal adrenal single cell map (https://atlas.brotmanbaty.org/bbi/human-gene-expression-during-development/cell/adrenocortical/in/adrenal)
Wilcoxon ranksum test P-value for gene set overrepresentation: 1.62e-02
Mean rank of genes in gene set: 4985
Median rank of genes in gene set: 4867.5
Rank on gene expression program of top 30 genes in gene set:
| Genes | Weight | Rank | GTEx | DepMap | Descartes | Mean.Counts | Mean.TPM |
|---|---|---|---|---|---|---|---|
| HMGCR | 0.0037450 | 114 | GTEx | DepMap | Descartes | 1.84 | 114.42 |
| LDLR | 0.0034994 | 127 | GTEx | DepMap | Descartes | 3.59 | 182.62 |
| HMGCS1 | 0.0032836 | 152 | GTEx | DepMap | Descartes | 2.09 | 118.81 |
| SH3BP5 | 0.0026634 | 241 | GTEx | DepMap | Descartes | 2.21 | 182.06 |
| MSMO1 | 0.0015933 | 546 | GTEx | DepMap | Descartes | 0.76 | 92.58 |
| DHCR24 | 0.0014687 | 609 | GTEx | DepMap | Descartes | 0.41 | 18.77 |
| PDE10A | 0.0013690 | 668 | GTEx | DepMap | Descartes | 0.28 | 9.12 |
| CLU | 0.0012535 | 748 | GTEx | DepMap | Descartes | 4.97 | 522.94 |
| POR | 0.0007118 | 1310 | GTEx | DepMap | Descartes | 0.82 | 86.47 |
| NPC1 | 0.0003845 | 2062 | GTEx | DepMap | Descartes | 0.56 | 31.01 |
| FDXR | 0.0002866 | 2356 | GTEx | DepMap | Descartes | 0.07 | 6.97 |
| PAPSS2 | 0.0002548 | 2468 | GTEx | DepMap | Descartes | 0.52 | 32.52 |
| DNER | 0.0002509 | 2490 | GTEx | DepMap | Descartes | 0.10 | 8.19 |
| IGF1R | 0.0002015 | 2693 | GTEx | DepMap | Descartes | 0.57 | 12.27 |
| FDPS | 0.0001855 | 2774 | GTEx | DepMap | Descartes | 0.58 | 66.72 |
| SLC1A2 | 0.0000877 | 3276 | GTEx | DepMap | Descartes | 0.11 | 2.12 |
| FDX1 | -0.0000713 | 4732 | GTEx | DepMap | Descartes | 0.24 | 20.63 |
| SCAP | -0.0000724 | 4750 | GTEx | DepMap | Descartes | 0.24 | 14.90 |
| SH3PXD2B | -0.0000903 | 4985 | GTEx | DepMap | Descartes | 0.25 | 7.03 |
| SGCZ | -0.0000961 | 5079 | GTEx | DepMap | Descartes | 0.00 | 0.00 |
| SLC16A9 | -0.0001259 | 5562 | GTEx | DepMap | Descartes | 0.06 | 4.81 |
| CYB5B | -0.0001300 | 5643 | GTEx | DepMap | Descartes | 0.44 | 30.96 |
| STAR | -0.0001551 | 6042 | GTEx | DepMap | Descartes | 0.01 | 0.64 |
| INHA | -0.0002049 | 6877 | GTEx | DepMap | Descartes | 0.00 | 0.00 |
| SCARB1 | -0.0002074 | 6924 | GTEx | DepMap | Descartes | 0.12 | 4.27 |
| FREM2 | -0.0002306 | 7321 | GTEx | DepMap | Descartes | 0.01 | 0.07 |
| BAIAP2L1 | -0.0002546 | 7662 | GTEx | DepMap | Descartes | 0.00 | 0.19 |
| FRMD5 | -0.0003021 | 8362 | GTEx | DepMap | Descartes | 0.03 | 1.32 |
| APOC1 | -0.0003295 | 8720 | GTEx | DepMap | Descartes | 0.22 | 93.75 |
| TM7SF2 | -0.0003348 | 8784 | GTEx | DepMap | Descartes | 0.02 | 1.85 |
Descartes chromaffin markers
Top 50 marker genes of chromaffin cells in the Decartes fetal adrenal single cell map (https://atlas.brotmanbaty.org/bbi/human-gene-expression-during-development/cell/chromaffin/in/adrenal)
Wilcoxon ranksum test P-value for gene set overrepresentation: 1.00e+00
Mean rank of genes in gene set: 8982.95
Median rank of genes in gene set: 10182
Rank on gene expression program of top 30 genes in gene set:
| Genes | Weight | Rank | GTEx | DepMap | Descartes | Mean.Counts | Mean.TPM |
|---|---|---|---|---|---|---|---|
| MAP1B | 0.0045458 | 64 | GTEx | DepMap | Descartes | 14.86 | 337.30 |
| RGMB | 0.0011498 | 823 | GTEx | DepMap | Descartes | 0.72 | 36.70 |
| TUBB2A | 0.0006734 | 1381 | GTEx | DepMap | Descartes | 2.14 | 328.30 |
| HS3ST5 | 0.0000920 | 3246 | GTEx | DepMap | Descartes | 0.02 | 1.09 |
| SYNPO2 | 0.0000140 | 3849 | GTEx | DepMap | Descartes | 0.92 | 16.94 |
| CNKSR2 | -0.0000064 | 4018 | GTEx | DepMap | Descartes | 0.11 | 4.37 |
| TMEM132C | -0.0001335 | 5710 | GTEx | DepMap | Descartes | 0.07 | 3.99 |
| GAL | -0.0001860 | 6553 | GTEx | DepMap | Descartes | 0.04 | 12.62 |
| EPHA6 | -0.0002100 | 6964 | GTEx | DepMap | Descartes | 0.00 | 0.00 |
| KCNB2 | -0.0002211 | 7149 | GTEx | DepMap | Descartes | 0.00 | 0.00 |
| PLXNA4 | -0.0002401 | 7469 | GTEx | DepMap | Descartes | 0.03 | 0.72 |
| ANKFN1 | -0.0002605 | 7740 | GTEx | DepMap | Descartes | 0.00 | 0.00 |
| EYA4 | -0.0003025 | 8372 | GTEx | DepMap | Descartes | 0.01 | 0.17 |
| TMEFF2 | -0.0003101 | 8464 | GTEx | DepMap | Descartes | 0.01 | 0.70 |
| MAB21L1 | -0.0003357 | 8799 | GTEx | DepMap | Descartes | 0.13 | 14.89 |
| RPH3A | -0.0003582 | 9080 | GTEx | DepMap | Descartes | 0.00 | 0.06 |
| ALK | -0.0003765 | 9317 | GTEx | DepMap | Descartes | 0.00 | 0.13 |
| NTRK1 | -0.0003912 | 9506 | GTEx | DepMap | Descartes | 0.00 | 0.21 |
| SLC44A5 | -0.0004133 | 9742 | GTEx | DepMap | Descartes | 0.00 | 0.10 |
| EYA1 | -0.0004516 | 10124 | GTEx | DepMap | Descartes | 0.00 | 0.13 |
| REEP1 | -0.0004584 | 10182 | GTEx | DepMap | Descartes | 0.07 | 4.17 |
| RBFOX1 | -0.0004861 | 10422 | GTEx | DepMap | Descartes | 0.00 | 0.12 |
| FAT3 | -0.0005108 | 10624 | GTEx | DepMap | Descartes | 0.00 | 0.04 |
| RYR2 | -0.0005152 | 10657 | GTEx | DepMap | Descartes | 0.01 | 0.23 |
| IL7 | -0.0005502 | 10903 | GTEx | DepMap | Descartes | 0.01 | 0.62 |
| GREM1 | -0.0005557 | 10936 | GTEx | DepMap | Descartes | 0.47 | 4.93 |
| NPY | -0.0005754 | 11061 | GTEx | DepMap | Descartes | 0.02 | 4.26 |
| SLC6A2 | -0.0005940 | 11151 | GTEx | DepMap | Descartes | 0.01 | 1.00 |
| PTCHD1 | -0.0006063 | 11218 | GTEx | DepMap | Descartes | 0.00 | 0.06 |
| CNTFR | -0.0006128 | 11260 | GTEx | DepMap | Descartes | 0.02 | 1.47 |
Descartes Vascular_endothelial markers
Top 50 marker genes of Vascular_endothelial cells in the Decartes fetal adrenal single cell map (https://atlas.brotmanbaty.org/bbi/human-gene-expression-during-development/cell/vascular_endothelial/in/adrenal)
Wilcoxon ranksum test P-value for gene set overrepresentation: 9.99e-01
Mean rank of genes in gene set: 8202.18
Median rank of genes in gene set: 9440
Rank on gene expression program of top 30 genes in gene set:
| Genes | Weight | Rank | GTEx | DepMap | Descartes | Mean.Counts | Mean.TPM |
|---|---|---|---|---|---|---|---|
| EFNB2 | 0.0037025 | 116 | GTEx | DepMap | Descartes | 2.08 | 111.75 |
| CYP26B1 | 0.0032324 | 158 | GTEx | DepMap | Descartes | 1.21 | 86.23 |
| ARHGAP29 | 0.0017707 | 479 | GTEx | DepMap | Descartes | 0.77 | 22.82 |
| ID1 | 0.0009214 | 1034 | GTEx | DepMap | Descartes | 2.02 | 523.70 |
| TMEM88 | -0.0000090 | 4034 | GTEx | DepMap | Descartes | 0.30 | 83.66 |
| CALCRL | -0.0000401 | 4337 | GTEx | DepMap | Descartes | 0.58 | 20.42 |
| SHE | -0.0000507 | 4443 | GTEx | DepMap | Descartes | 0.15 | 5.78 |
| EHD3 | -0.0000806 | 4843 | GTEx | DepMap | Descartes | 0.09 | 4.57 |
| F8 | -0.0001079 | 5273 | GTEx | DepMap | Descartes | 0.06 | 1.53 |
| CRHBP | -0.0001517 | 5988 | GTEx | DepMap | Descartes | 0.00 | 0.00 |
| SHANK3 | -0.0001785 | 6431 | GTEx | DepMap | Descartes | 0.28 | 7.55 |
| NR5A2 | -0.0001924 | 6668 | GTEx | DepMap | Descartes | 0.00 | 0.14 |
| GALNT15 | -0.0002089 | 6948 | GTEx | DepMap | Descartes | 0.05 | NA |
| ESM1 | -0.0002508 | 7615 | GTEx | DepMap | Descartes | 0.15 | 10.07 |
| IRX3 | -0.0003190 | 8576 | GTEx | DepMap | Descartes | 0.02 | 2.54 |
| NPR1 | -0.0003247 | 8637 | GTEx | DepMap | Descartes | 0.04 | 1.35 |
| HYAL2 | -0.0003562 | 9052 | GTEx | DepMap | Descartes | 0.14 | 7.99 |
| CEACAM1 | -0.0003674 | 9192 | GTEx | DepMap | Descartes | 0.02 | 0.79 |
| KDR | -0.0003831 | 9404 | GTEx | DepMap | Descartes | 0.12 | 3.02 |
| BTNL9 | -0.0003889 | 9476 | GTEx | DepMap | Descartes | 0.01 | 0.19 |
| CHRM3 | -0.0003922 | 9515 | GTEx | DepMap | Descartes | 0.02 | 0.37 |
| MYRIP | -0.0003960 | 9559 | GTEx | DepMap | Descartes | 0.01 | 0.37 |
| CLDN5 | -0.0004103 | 9709 | GTEx | DepMap | Descartes | 0.21 | 12.97 |
| RASIP1 | -0.0004288 | 9908 | GTEx | DepMap | Descartes | 0.08 | 4.02 |
| RAMP2 | -0.0005263 | 10743 | GTEx | DepMap | Descartes | 0.20 | 52.09 |
| KANK3 | -0.0005766 | 11067 | GTEx | DepMap | Descartes | 0.03 | 2.32 |
| FLT4 | -0.0006038 | 11207 | GTEx | DepMap | Descartes | 0.04 | 0.80 |
| NOTCH4 | -0.0006103 | 11247 | GTEx | DepMap | Descartes | 0.06 | 1.58 |
| TEK | -0.0006194 | 11292 | GTEx | DepMap | Descartes | 0.01 | 0.25 |
| ROBO4 | -0.0006208 | 11303 | GTEx | DepMap | Descartes | 0.05 | 1.39 |
Descartes stromal markers
Top 50 marker genes of stromal cells in the Decartes fetal adrenal single cell map (https://atlas.brotmanbaty.org/bbi/human-gene-expression-during-development/cell/stromal/in/adrenal)
Wilcoxon ranksum test P-value for gene set overrepresentation: 3.99e-02
Mean rank of genes in gene set: 5319.75
Median rank of genes in gene set: 2519
Rank on gene expression program of top 30 genes in gene set:
| Genes | Weight | Rank | GTEx | DepMap | Descartes | Mean.Counts | Mean.TPM |
|---|---|---|---|---|---|---|---|
| LUM | 0.0079736 | 8 | GTEx | DepMap | Descartes | 48.81 | 4979.99 |
| DCN | 0.0066557 | 18 | GTEx | DepMap | Descartes | 65.98 | 2707.49 |
| PAMR1 | 0.0053871 | 40 | GTEx | DepMap | Descartes | 2.29 | 159.92 |
| OGN | 0.0052020 | 44 | GTEx | DepMap | Descartes | 7.42 | 678.65 |
| ISLR | 0.0033808 | 141 | GTEx | DepMap | Descartes | 4.30 | 470.41 |
| SCARA5 | 0.0029524 | 197 | GTEx | DepMap | Descartes | 1.54 | 111.27 |
| BICC1 | 0.0028414 | 209 | GTEx | DepMap | Descartes | 1.38 | 65.41 |
| PRRX1 | 0.0027156 | 236 | GTEx | DepMap | Descartes | 2.75 | 204.10 |
| ABCA6 | 0.0026194 | 249 | GTEx | DepMap | Descartes | 1.27 | 44.05 |
| PCOLCE | 0.0024697 | 275 | GTEx | DepMap | Descartes | 5.34 | 912.55 |
| CDH11 | 0.0021802 | 343 | GTEx | DepMap | Descartes | 1.66 | 59.88 |
| COL6A3 | 0.0021504 | 353 | GTEx | DepMap | Descartes | 7.23 | 168.92 |
| EDNRA | 0.0018505 | 445 | GTEx | DepMap | Descartes | 0.98 | 58.96 |
| FREM1 | 0.0017889 | 473 | GTEx | DepMap | Descartes | 0.36 | 9.17 |
| CD248 | 0.0014656 | 612 | GTEx | DepMap | Descartes | 0.86 | 83.87 |
| PCDH18 | 0.0010619 | 892 | GTEx | DepMap | Descartes | 0.52 | 28.29 |
| GLI2 | 0.0008968 | 1072 | GTEx | DepMap | Descartes | 0.22 | 8.26 |
| PDGFRA | 0.0007088 | 1311 | GTEx | DepMap | Descartes | 1.19 | 45.86 |
| LAMC3 | 0.0004293 | 1922 | GTEx | DepMap | Descartes | 0.06 | 2.85 |
| COL12A1 | 0.0003769 | 2075 | GTEx | DepMap | Descartes | 2.10 | 48.96 |
| ADAMTSL3 | 0.0003261 | 2220 | GTEx | DepMap | Descartes | 0.31 | 11.63 |
| PRICKLE1 | 0.0003224 | 2232 | GTEx | DepMap | Descartes | 0.48 | 21.68 |
| LOX | 0.0001798 | 2806 | GTEx | DepMap | Descartes | 0.74 | 40.96 |
| IGFBP3 | 0.0000810 | 3320 | GTEx | DepMap | Descartes | 1.25 | 106.10 |
| COL1A2 | 0.0000118 | 3867 | GTEx | DepMap | Descartes | 31.50 | 1208.43 |
| LRRC17 | -0.0001086 | 5283 | GTEx | DepMap | Descartes | 0.18 | 18.31 |
| GAS2 | -0.0001417 | 5830 | GTEx | DepMap | Descartes | 0.01 | 1.08 |
| COL27A1 | -0.0004775 | 10340 | GTEx | DepMap | Descartes | 0.26 | 8.02 |
| DKK2 | -0.0004928 | 10488 | GTEx | DepMap | Descartes | 0.05 | 1.87 |
| HHIP | -0.0005083 | 10599 | GTEx | DepMap | Descartes | 0.06 | 1.53 |
Descartes sympathoblasts markers
Top 50 marker genes of sympathoblasts cells in the Decartes fetal adrenal single cell map (https://atlas.brotmanbaty.org/bbi/human-gene-expression-during-development/cell/sympathoblasts/in/adrenal)
Wilcoxon ranksum test P-value for gene set overrepresentation: 9.78e-01
Mean rank of genes in gene set: 7460.71
Median rank of genes in gene set: 7566
Rank on gene expression program of top 30 genes in gene set:
| Genes | Weight | Rank | GTEx | DepMap | Descartes | Mean.Counts | Mean.TPM |
|---|---|---|---|---|---|---|---|
| TIAM1 | 0.0048898 | 52 | GTEx | DepMap | Descartes | 2.33 | 92.82 |
| CNTN3 | 0.0024852 | 271 | GTEx | DepMap | Descartes | 0.27 | 16.52 |
| ARC | 0.0008395 | 1136 | GTEx | DepMap | Descartes | 1.98 | 192.59 |
| ROBO1 | 0.0004142 | 1964 | GTEx | DepMap | Descartes | 0.34 | 12.88 |
| PENK | 0.0000682 | 3409 | GTEx | DepMap | Descartes | 0.27 | 59.96 |
| GRM7 | 0.0000236 | 3756 | GTEx | DepMap | Descartes | 0.02 | 1.48 |
| SLC24A2 | -0.0000274 | 4215 | GTEx | DepMap | Descartes | 0.01 | 0.23 |
| GALNTL6 | -0.0000338 | 4275 | GTEx | DepMap | Descartes | 0.00 | 0.11 |
| CDH18 | -0.0000767 | 4799 | GTEx | DepMap | Descartes | 0.01 | 0.32 |
| PACRG | -0.0000783 | 4818 | GTEx | DepMap | Descartes | 0.01 | 2.03 |
| SLC35F3 | -0.0001140 | 5369 | GTEx | DepMap | Descartes | 0.00 | 0.11 |
| SORCS3 | -0.0001156 | 5404 | GTEx | DepMap | Descartes | 0.00 | 0.24 |
| SPOCK3 | -0.0001264 | 5572 | GTEx | DepMap | Descartes | 0.00 | 0.21 |
| AGBL4 | -0.0001391 | 5792 | GTEx | DepMap | Descartes | 0.00 | 0.24 |
| CDH12 | -0.0001665 | 6244 | GTEx | DepMap | Descartes | 0.00 | 0.00 |
| EML6 | -0.0001796 | 6448 | GTEx | DepMap | Descartes | 0.02 | 0.35 |
| TBX20 | -0.0001922 | 6665 | GTEx | DepMap | Descartes | 0.00 | 0.00 |
| GRID2 | -0.0002169 | 7081 | GTEx | DepMap | Descartes | 0.01 | 0.26 |
| CCSER1 | -0.0002420 | 7496 | GTEx | DepMap | Descartes | 0.01 | NA |
| ST18 | -0.0002528 | 7636 | GTEx | DepMap | Descartes | 0.00 | 0.07 |
| KSR2 | -0.0002863 | 8130 | GTEx | DepMap | Descartes | 0.00 | 0.05 |
| HTATSF1 | -0.0003199 | 8585 | GTEx | DepMap | Descartes | 0.42 | 39.28 |
| PCSK2 | -0.0003414 | 8858 | GTEx | DepMap | Descartes | 0.03 | 1.33 |
| FGF14 | -0.0004191 | 9809 | GTEx | DepMap | Descartes | 0.02 | 0.59 |
| TENM1 | -0.0004239 | 9857 | GTEx | DepMap | Descartes | 0.03 | NA |
| MGAT4C | -0.0004360 | 9974 | GTEx | DepMap | Descartes | 0.01 | 0.09 |
| SLC18A1 | -0.0004488 | 10100 | GTEx | DepMap | Descartes | 0.00 | 0.00 |
| DGKK | -0.0004533 | 10137 | GTEx | DepMap | Descartes | 0.00 | 0.03 |
| LAMA3 | -0.0004752 | 10316 | GTEx | DepMap | Descartes | 0.02 | 0.62 |
| KCTD16 | -0.0004958 | 10510 | GTEx | DepMap | Descartes | 0.01 | 0.12 |
Descartes erythroblasts markers
Top 50 marker genes of erythroblasts cells in the Decartes fetal adrenal single cell map (https://atlas.brotmanbaty.org/bbi/human-gene-expression-during-development/cell/erythroblasts/in/adrenal)
Wilcoxon ranksum test P-value for gene set overrepresentation: 6.42e-01
Mean rank of genes in gene set: 6519.38
Median rank of genes in gene set: 6067
Rank on gene expression program of top 30 genes in gene set:
| Genes | Weight | Rank | GTEx | DepMap | Descartes | Mean.Counts | Mean.TPM |
|---|---|---|---|---|---|---|---|
| TSPAN5 | 0.0045684 | 62 | GTEx | DepMap | Descartes | 1.88 | 135.01 |
| RGS6 | 0.0017426 | 492 | GTEx | DepMap | Descartes | 0.22 | 11.41 |
| GCLC | 0.0009265 | 1028 | GTEx | DepMap | Descartes | 0.55 | 44.55 |
| SOX6 | 0.0008991 | 1065 | GTEx | DepMap | Descartes | 0.38 | 12.66 |
| RAPGEF2 | 0.0006710 | 1384 | GTEx | DepMap | Descartes | 1.17 | 39.31 |
| ANK1 | 0.0002225 | 2602 | GTEx | DepMap | Descartes | 0.16 | 4.02 |
| SELENBP1 | 0.0000991 | 3201 | GTEx | DepMap | Descartes | 0.28 | 26.50 |
| SLC25A21 | 0.0000260 | 3741 | GTEx | DepMap | Descartes | 0.00 | 0.22 |
| SPECC1 | -0.0000089 | 4033 | GTEx | DepMap | Descartes | 0.18 | 6.50 |
| BLVRB | -0.0000626 | 4598 | GTEx | DepMap | Descartes | 0.23 | 44.79 |
| FECH | -0.0000801 | 4838 | GTEx | DepMap | Descartes | 0.08 | 3.44 |
| SLC4A1 | -0.0001270 | 5588 | GTEx | DepMap | Descartes | 0.00 | 0.00 |
| ALAS2 | -0.0001333 | 5705 | GTEx | DepMap | Descartes | 0.00 | 0.00 |
| RHD | -0.0001408 | 5819 | GTEx | DepMap | Descartes | 0.00 | 0.00 |
| TMCC2 | -0.0001566 | 6067 | GTEx | DepMap | Descartes | 0.02 | 1.76 |
| ABCB10 | -0.0001770 | 6402 | GTEx | DepMap | Descartes | 0.07 | 5.36 |
| TRAK2 | -0.0002156 | 7059 | GTEx | DepMap | Descartes | 0.23 | 9.71 |
| TFR2 | -0.0002649 | 7819 | GTEx | DepMap | Descartes | 0.00 | 0.48 |
| SPTB | -0.0003453 | 8911 | GTEx | DepMap | Descartes | 0.01 | 0.08 |
| XPO7 | -0.0004391 | 10005 | GTEx | DepMap | Descartes | 0.21 | 11.13 |
| DENND4A | -0.0004392 | 10009 | GTEx | DepMap | Descartes | 0.85 | 27.38 |
| CAT | -0.0004519 | 10125 | GTEx | DepMap | Descartes | 0.33 | 38.49 |
| CPOX | -0.0004626 | 10214 | GTEx | DepMap | Descartes | 0.07 | 6.41 |
| SLC25A37 | -0.0004902 | 10461 | GTEx | DepMap | Descartes | 0.61 | 31.66 |
| MARCH3 | -0.0005407 | 10838 | GTEx | DepMap | Descartes | 0.18 | NA |
| MICAL2 | -0.0006077 | 11230 | GTEx | DepMap | Descartes | 0.67 | 17.37 |
| SNCA | -0.0006203 | 11300 | GTEx | DepMap | Descartes | 0.02 | 1.34 |
| GYPC | -0.0009308 | 12161 | GTEx | DepMap | Descartes | 0.33 | 39.40 |
| EPB41 | -0.0010486 | 12305 | GTEx | DepMap | Descartes | 0.03 | 1.55 |
| NA | NA | NA | NA | NA | NA | NA | NA |
Descartes myeloid markers
Top 50 marker genes of myeloid cells in the Decartes fetal adrenal single cell map (https://atlas.brotmanbaty.org/bbi/human-gene-expression-during-development/cell/myeloid/in/adrenal)
Wilcoxon ranksum test P-value for gene set overrepresentation: 9.69e-01
Mean rank of genes in gene set: 7369.29
Median rank of genes in gene set: 8739.5
Rank on gene expression program of top 30 genes in gene set:
| Genes | Weight | Rank | GTEx | DepMap | Descartes | Mean.Counts | Mean.TPM |
|---|---|---|---|---|---|---|---|
| TGFBI | 0.0042758 | 83 | GTEx | DepMap | Descartes | 8.08 | 436.68 |
| AXL | 0.0018825 | 431 | GTEx | DepMap | Descartes | 1.87 | 111.22 |
| CST3 | 0.0014059 | 642 | GTEx | DepMap | Descartes | 12.58 | 935.19 |
| HRH1 | 0.0011427 | 828 | GTEx | DepMap | Descartes | 0.43 | 23.82 |
| RGL1 | 0.0010648 | 888 | GTEx | DepMap | Descartes | 0.88 | 44.53 |
| ABCA1 | 0.0005683 | 1576 | GTEx | DepMap | Descartes | 1.75 | 40.44 |
| SLC1A3 | 0.0003329 | 2197 | GTEx | DepMap | Descartes | 0.27 | 15.45 |
| IFNGR1 | 0.0002947 | 2318 | GTEx | DepMap | Descartes | 0.70 | 77.10 |
| FGL2 | 0.0001624 | 2889 | GTEx | DepMap | Descartes | 0.91 | 65.89 |
| SLCO2B1 | 0.0000965 | 3216 | GTEx | DepMap | Descartes | 0.32 | 14.29 |
| LGMN | 0.0000581 | 3480 | GTEx | DepMap | Descartes | 0.95 | 120.84 |
| PTPRE | -0.0000198 | 4145 | GTEx | DepMap | Descartes | 0.66 | 29.24 |
| MERTK | -0.0000737 | 4760 | GTEx | DepMap | Descartes | 0.07 | 5.31 |
| SPP1 | -0.0002365 | 7419 | GTEx | DepMap | Descartes | 0.02 | 1.67 |
| CD163L1 | -0.0002595 | 7724 | GTEx | DepMap | Descartes | 0.00 | 0.00 |
| ITPR2 | -0.0002948 | 8243 | GTEx | DepMap | Descartes | 0.37 | 7.54 |
| RBPJ | -0.0003053 | 8406 | GTEx | DepMap | Descartes | 1.61 | 71.85 |
| CD14 | -0.0003068 | 8430 | GTEx | DepMap | Descartes | 0.34 | 53.62 |
| ATP8B4 | -0.0003251 | 8645 | GTEx | DepMap | Descartes | 0.02 | 0.95 |
| FGD2 | -0.0003393 | 8834 | GTEx | DepMap | Descartes | 0.01 | 0.57 |
| SLC9A9 | -0.0003519 | 8997 | GTEx | DepMap | Descartes | 0.10 | 8.15 |
| ADAP2 | -0.0003954 | 9551 | GTEx | DepMap | Descartes | 0.02 | 1.52 |
| WWP1 | -0.0004036 | 9647 | GTEx | DepMap | Descartes | 0.22 | 11.47 |
| CTSB | -0.0004102 | 9706 | GTEx | DepMap | Descartes | 2.54 | 153.02 |
| CPVL | -0.0004354 | 9964 | GTEx | DepMap | Descartes | 0.09 | 8.94 |
| MS4A4A | -0.0004675 | 10254 | GTEx | DepMap | Descartes | 0.02 | 1.41 |
| MARCH1 | -0.0005106 | 10621 | GTEx | DepMap | Descartes | 0.02 | NA |
| HCK | -0.0005211 | 10702 | GTEx | DepMap | Descartes | 0.13 | 10.00 |
| CD163 | -0.0005307 | 10779 | GTEx | DepMap | Descartes | 0.05 | 0.97 |
| CSF1R | -0.0005416 | 10846 | GTEx | DepMap | Descartes | 0.05 | 2.48 |
Descartes Schwann markers
Top 50 marker genes of Schwann cells in the Decartes fetal adrenal single cell map (https://atlas.brotmanbaty.org/bbi/human-gene-expression-during-development/cell/schwann/in/adrenal)
Wilcoxon ranksum test P-value for gene set overrepresentation: 1.23e-01
Mean rank of genes in gene set: 5641.86
Median rank of genes in gene set: 5641
Rank on gene expression program of top 30 genes in gene set:
| Genes | Weight | Rank | GTEx | DepMap | Descartes | Mean.Counts | Mean.TPM |
|---|---|---|---|---|---|---|---|
| LAMB1 | 0.0034619 | 131 | GTEx | DepMap | Descartes | 4.74 | 203.89 |
| GAS7 | 0.0034531 | 133 | GTEx | DepMap | Descartes | 3.00 | 98.65 |
| LAMC1 | 0.0030630 | 178 | GTEx | DepMap | Descartes | 5.54 | 169.45 |
| VCAN | 0.0027457 | 228 | GTEx | DepMap | Descartes | 8.44 | 194.54 |
| DST | 0.0020120 | 393 | GTEx | DepMap | Descartes | 4.72 | 57.94 |
| VIM | 0.0019695 | 405 | GTEx | DepMap | Descartes | 47.43 | 5041.69 |
| SCN7A | 0.0018810 | 433 | GTEx | DepMap | Descartes | 1.60 | 64.59 |
| LAMA4 | 0.0016556 | 522 | GTEx | DepMap | Descartes | 2.61 | 93.16 |
| KCTD12 | 0.0015100 | 593 | GTEx | DepMap | Descartes | 3.50 | 165.45 |
| OLFML2A | 0.0011946 | 792 | GTEx | DepMap | Descartes | 1.06 | 48.89 |
| STARD13 | 0.0010691 | 886 | GTEx | DepMap | Descartes | 0.95 | 42.44 |
| SFRP1 | 0.0007126 | 1308 | GTEx | DepMap | Descartes | 1.78 | 109.51 |
| HMGA2 | 0.0006941 | 1343 | GTEx | DepMap | Descartes | 0.08 | 2.32 |
| MARCKS | 0.0006933 | 1344 | GTEx | DepMap | Descartes | 6.83 | 419.15 |
| EDNRB | 0.0006647 | 1394 | GTEx | DepMap | Descartes | 0.70 | 36.85 |
| SOX5 | 0.0004371 | 1897 | GTEx | DepMap | Descartes | 0.17 | 6.41 |
| EGFLAM | 0.0003426 | 2166 | GTEx | DepMap | Descartes | 0.37 | 22.24 |
| GRIK3 | 0.0002372 | 2547 | GTEx | DepMap | Descartes | 0.13 | 3.58 |
| COL5A2 | 0.0001650 | 2880 | GTEx | DepMap | Descartes | 2.22 | 75.32 |
| COL18A1 | 0.0000846 | 3293 | GTEx | DepMap | Descartes | 2.51 | 83.94 |
| PLCE1 | 0.0000206 | 3781 | GTEx | DepMap | Descartes | 0.19 | 4.27 |
| GFRA3 | -0.0001294 | 5630 | GTEx | DepMap | Descartes | 0.23 | 33.89 |
| IL1RAPL2 | -0.0001305 | 5652 | GTEx | DepMap | Descartes | 0.00 | 0.11 |
| COL25A1 | -0.0001554 | 6053 | GTEx | DepMap | Descartes | 0.02 | 0.36 |
| LRRTM4 | -0.0002554 | 7672 | GTEx | DepMap | Descartes | 0.00 | 0.20 |
| PTN | -0.0002728 | 7925 | GTEx | DepMap | Descartes | 0.27 | 54.82 |
| IL1RAPL1 | -0.0002780 | 8006 | GTEx | DepMap | Descartes | 0.02 | 1.02 |
| TRPM3 | -0.0002914 | 8198 | GTEx | DepMap | Descartes | 0.02 | 0.55 |
| MPZ | -0.0002955 | 8254 | GTEx | DepMap | Descartes | 0.07 | 7.02 |
| PMP22 | -0.0003213 | 8599 | GTEx | DepMap | Descartes | 1.49 | 192.30 |
Descartes Megakaryocytes markers
Top 50 marker genes of Megakaryocytes cells in the Decartes fetal adrenal single cell map (https://atlas.brotmanbaty.org/bbi/human-gene-expression-during-development/cell/megakaryocytes/in/adrenal)
Wilcoxon ranksum test P-value for gene set overrepresentation: 9.28e-01
Mean rank of genes in gene set: 7061.71
Median rank of genes in gene set: 8083
Rank on gene expression program of top 30 genes in gene set:
| Genes | Weight | Rank | GTEx | DepMap | Descartes | Mean.Counts | Mean.TPM |
|---|---|---|---|---|---|---|---|
| THBS1 | 0.0067087 | 16 | GTEx | DepMap | Descartes | 38.07 | 1452.17 |
| GSN | 0.0055647 | 35 | GTEx | DepMap | Descartes | 22.16 | 1025.64 |
| LTBP1 | 0.0025238 | 268 | GTEx | DepMap | Descartes | 1.72 | 78.81 |
| VCL | 0.0021222 | 368 | GTEx | DepMap | Descartes | 2.86 | 89.45 |
| MCTP1 | 0.0016860 | 510 | GTEx | DepMap | Descartes | 0.68 | 35.24 |
| UBASH3B | 0.0016804 | 514 | GTEx | DepMap | Descartes | 0.86 | 34.90 |
| PDE3A | 0.0015696 | 561 | GTEx | DepMap | Descartes | 0.74 | 25.38 |
| ZYX | 0.0012544 | 746 | GTEx | DepMap | Descartes | 3.78 | 441.93 |
| STOM | 0.0010760 | 880 | GTEx | DepMap | Descartes | 3.77 | 314.63 |
| ITGB3 | 0.0009173 | 1041 | GTEx | DepMap | Descartes | 0.08 | 3.53 |
| TPM4 | 0.0003139 | 2259 | GTEx | DepMap | Descartes | 4.16 | 197.28 |
| MED12L | 0.0003094 | 2271 | GTEx | DepMap | Descartes | 0.08 | 1.74 |
| SLC2A3 | 0.0001530 | 2930 | GTEx | DepMap | Descartes | 4.96 | 310.26 |
| ARHGAP6 | 0.0001249 | 3071 | GTEx | DepMap | Descartes | 0.11 | 4.78 |
| LIMS1 | 0.0000614 | 3462 | GTEx | DepMap | Descartes | 1.70 | 93.21 |
| TRPC6 | 0.0000523 | 3534 | GTEx | DepMap | Descartes | 0.05 | 2.92 |
| SLC24A3 | -0.0000830 | 4880 | GTEx | DepMap | Descartes | 0.04 | 2.04 |
| ANGPT1 | -0.0000978 | 5107 | GTEx | DepMap | Descartes | 0.11 | 7.10 |
| TUBB1 | -0.0001185 | 5457 | GTEx | DepMap | Descartes | 0.00 | 0.00 |
| STON2 | -0.0002005 | 6810 | GTEx | DepMap | Descartes | 0.05 | 3.23 |
| ITGA2B | -0.0002626 | 7776 | GTEx | DepMap | Descartes | 0.01 | 0.65 |
| RAP1B | -0.0002662 | 7837 | GTEx | DepMap | Descartes | 0.95 | 15.67 |
| PSTPIP2 | -0.0002832 | 8083 | GTEx | DepMap | Descartes | 0.05 | 4.28 |
| RAB27B | -0.0002995 | 8319 | GTEx | DepMap | Descartes | 0.00 | 0.00 |
| P2RX1 | -0.0003564 | 9054 | GTEx | DepMap | Descartes | 0.00 | 0.00 |
| HIPK2 | -0.0003825 | 9398 | GTEx | DepMap | Descartes | 0.83 | 12.41 |
| DOK6 | -0.0004027 | 9637 | GTEx | DepMap | Descartes | 0.05 | 1.06 |
| GP1BA | -0.0004858 | 10417 | GTEx | DepMap | Descartes | 0.00 | 0.31 |
| ACTN1 | -0.0005346 | 10803 | GTEx | DepMap | Descartes | 2.59 | 145.43 |
| MMRN1 | -0.0005568 | 10942 | GTEx | DepMap | Descartes | 0.06 | 1.45 |
Descartes Lyphoid markers
Top 50 marker genes of Lyphoid cells in the Decartes fetal adrenal single cell map (https://atlas.brotmanbaty.org/bbi/human-gene-expression-during-development/cell/lymphoid/in/adrenal)
Wilcoxon ranksum test P-value for gene set overrepresentation: 1.00e+00
Mean rank of genes in gene set: 10896.38
Median rank of genes in gene set: 12022.5
Rank on gene expression program of top 30 genes in gene set:
| Genes | Weight | Rank | GTEx | DepMap | Descartes | Mean.Counts | Mean.TPM |
|---|---|---|---|---|---|---|---|
| ARID5B | 0.0028071 | 218 | GTEx | DepMap | Descartes | 7.59 | 279.51 |
| CELF2 | 0.0011621 | 814 | GTEx | DepMap | Descartes | 2.49 | 90.68 |
| MBNL1 | 0.0000412 | 3618 | GTEx | DepMap | Descartes | 2.61 | 114.71 |
| NCALD | -0.0000624 | 4594 | GTEx | DepMap | Descartes | 0.31 | 20.03 |
| STK39 | -0.0003657 | 9171 | GTEx | DepMap | Descartes | 0.21 | 18.37 |
| ABLIM1 | -0.0003682 | 9199 | GTEx | DepMap | Descartes | 1.07 | 35.71 |
| BACH2 | -0.0004860 | 10421 | GTEx | DepMap | Descartes | 0.24 | 7.08 |
| MCTP2 | -0.0005123 | 10636 | GTEx | DepMap | Descartes | 0.02 | 0.38 |
| LEF1 | -0.0005289 | 10761 | GTEx | DepMap | Descartes | 0.37 | 25.29 |
| ITPKB | -0.0005362 | 10813 | GTEx | DepMap | Descartes | 0.61 | 23.66 |
| SAMD3 | -0.0005843 | 11108 | GTEx | DepMap | Descartes | 0.00 | 0.23 |
| SKAP1 | -0.0006168 | 11275 | GTEx | DepMap | Descartes | 0.00 | 0.43 |
| DOCK10 | -0.0006350 | 11372 | GTEx | DepMap | Descartes | 0.31 | 9.37 |
| ETS1 | -0.0006421 | 11401 | GTEx | DepMap | Descartes | 2.32 | 108.15 |
| SCML4 | -0.0006668 | 11490 | GTEx | DepMap | Descartes | 0.01 | 0.34 |
| CCND3 | -0.0006759 | 11530 | GTEx | DepMap | Descartes | 0.18 | 17.89 |
| RCSD1 | -0.0006960 | 11590 | GTEx | DepMap | Descartes | 0.02 | 1.34 |
| TOX | -0.0007520 | 11760 | GTEx | DepMap | Descartes | 0.02 | 0.94 |
| SP100 | -0.0007543 | 11769 | GTEx | DepMap | Descartes | 0.85 | 38.89 |
| SORL1 | -0.0008039 | 11902 | GTEx | DepMap | Descartes | 0.45 | 10.13 |
| RAP1GAP2 | -0.0008217 | 11944 | GTEx | DepMap | Descartes | 0.01 | 0.44 |
| ANKRD44 | -0.0008904 | 12101 | GTEx | DepMap | Descartes | 0.08 | 2.88 |
| PITPNC1 | -0.0008916 | 12102 | GTEx | DepMap | Descartes | 0.41 | 14.33 |
| GNG2 | -0.0009220 | 12144 | GTEx | DepMap | Descartes | 0.58 | 39.74 |
| BCL2 | -0.0010041 | 12245 | GTEx | DepMap | Descartes | 0.26 | 9.24 |
| PLEKHA2 | -0.0010661 | 12317 | GTEx | DepMap | Descartes | 0.43 | 21.57 |
| MSN | -0.0010887 | 12338 | GTEx | DepMap | Descartes | 1.36 | 90.14 |
| PDE3B | -0.0011089 | 12360 | GTEx | DepMap | Descartes | 0.02 | 0.66 |
| EVL | -0.0011242 | 12370 | GTEx | DepMap | Descartes | 0.56 | 37.42 |
| ARHGAP15 | -0.0011839 | 12400 | GTEx | DepMap | Descartes | 0.02 | 1.24 |
Below shows the ranks on this GEP for immune marker gene lists curated by CellTypist (https://www.celltypist.org/encyclopedia).
High ranks indicate this gene is a driver of this GEP.
These curated gene list are ranked by P-value (on this GEP) of their constituent genes.
The Mean Count column shows the mean read count in cells scoring highly (H > 50) on this gene expression program.
Fibroblasts: Fibroblasts (model markers)
the most common cells of connective tissues which synthesize the extracellular matrix and collagen to maintain tissue homeostasis:
Wilcoxon ranksum test P-value for gene set overrepresentation: 1.85e-04
Mean rank of genes in gene set: 1976.56
Rank on gene expression program of genes in gene set:
| Genes | Weight | Rank | GTEx | DepMap | Decartes | Mean.Counts | Mean.TPM |
|---|---|---|---|---|---|---|---|
| EBF2 | 0.0046187 | 61 | GTEx | DepMap | Descartes | 1.87 | 104.16 |
| SMOC2 | 0.0027843 | 222 | GTEx | DepMap | Descartes | 2.98 | 202.82 |
| PRRX1 | 0.0027156 | 236 | GTEx | DepMap | Descartes | 2.75 | 204.10 |
| NTRK2 | 0.0013617 | 675 | GTEx | DepMap | Descartes | 1.36 | 46.38 |
| SFRP1 | 0.0007126 | 1308 | GTEx | DepMap | Descartes | 1.78 | 109.51 |
| PDGFRA | 0.0007088 | 1311 | GTEx | DepMap | Descartes | 1.19 | 45.86 |
| F10 | 0.0007054 | 1316 | GTEx | DepMap | Descartes | 0.18 | 35.02 |
| OLFML1 | 0.0004582 | 1837 | GTEx | DepMap | Descartes | 0.42 | 38.32 |
| ANGPTL1 | -0.0005382 | 10823 | GTEx | DepMap | Descartes | 0.15 | 9.75 |
Macrophages: Kupffer cells (model markers)
resident macrophages in liver under non-inflammatory conditions which line the hepatic sinusoids and are involved in erythrocyte clearance:
Wilcoxon ranksum test P-value for gene set overrepresentation: 1.84e-02
Mean rank of genes in gene set: 2492.75
Rank on gene expression program of genes in gene set:
| Genes | Weight | Rank | GTEx | DepMap | Decartes | Mean.Counts | Mean.TPM |
|---|---|---|---|---|---|---|---|
| EGR2 | 0.0019928 | 400 | GTEx | DepMap | Descartes | 2.14 | 203.49 |
| ARRDC3 | 0.0018634 | 438 | GTEx | DepMap | Descartes | 2.00 | 142.61 |
| PENK | 0.0000682 | 3409 | GTEx | DepMap | Descartes | 0.27 | 59.96 |
| CD5L | -0.0001347 | 5724 | GTEx | DepMap | Descartes | 0.00 | 0.00 |
DC: Transitional DC (curated markers)
immature dendritic cells which follow dendritic cell precursors and are committed to the mature dendritic cells:
Wilcoxon ranksum test P-value for gene set overrepresentation: 1.89e-02
Mean rank of genes in gene set: 954.5
Rank on gene expression program of genes in gene set:
| Genes | Weight | Rank | GTEx | DepMap | Decartes | Mean.Counts | Mean.TPM |
|---|---|---|---|---|---|---|---|
| AXL | 0.0018825 | 431 | GTEx | DepMap | Descartes | 1.87 | 111.22 |
| KLF4 | 0.0006225 | 1478 | GTEx | DepMap | Descartes | 4.80 | 494.47 |