Program: 15. Megakaryocyte.
Submit a comment on this gene expression program’s interpretation: CLICK
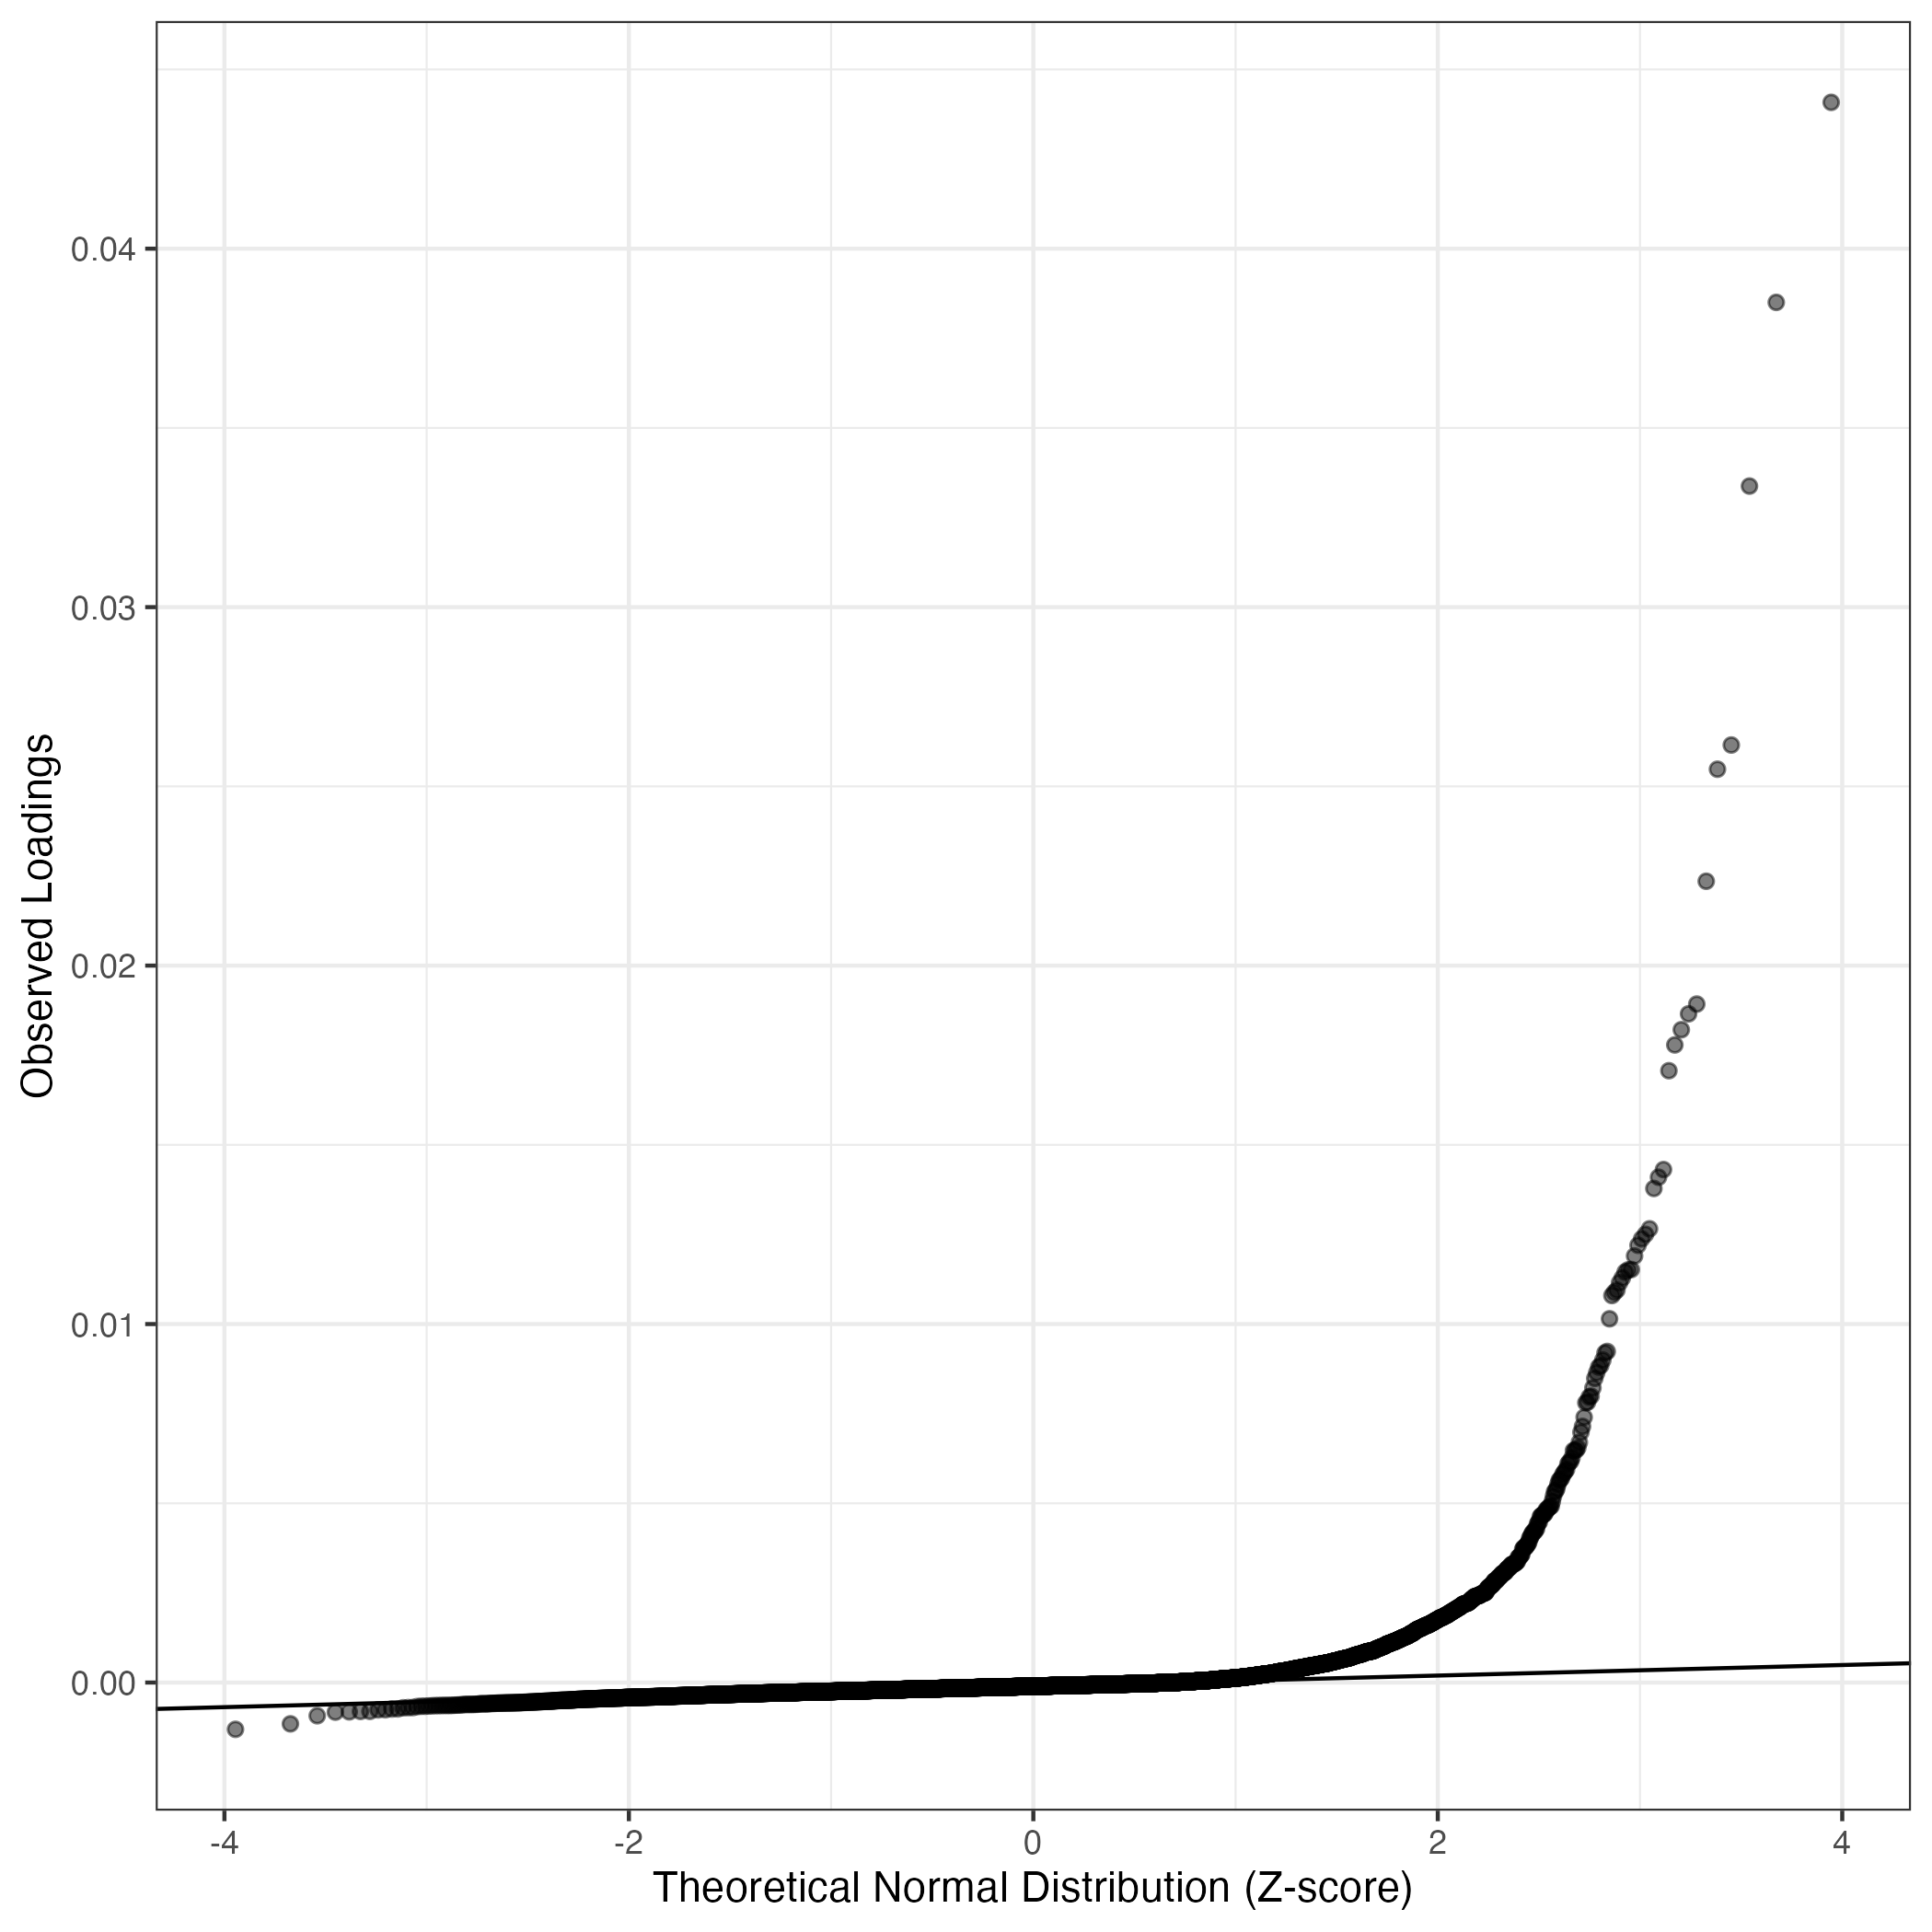
QQ-plot of gene loadings, averaged over both independent splits of the data
This plot highlights the relative contribution of each gene to the GEP
## Error in apply(allData[cellsHGreaterThan50, ], 2, mean): dim(X) must have a positive length
## Error in apply(allDataTpm[cellsHGreaterThan50, ], 2, mean): dim(X) must have a positive length
## Error in eval(expr, envir, enclos): object 'meanCountsHOver50' not found
## Error in eval(expr, envir, enclos): object 'meanTpmHOver50' not found
## Error in data.frame(Gene = geneCardsLink, Loading = dftoDisplay[, 2], : object 'countHighScoringCells' not found
## Error in rownames(dftForKable) <- rn: object 'dftForKable' not found
Top genes driving this program.
Note: Decartes website is buggy, try refreshing. Also, Decartes fetal adrenal data have been collected at specific time points (89-122 days), all possible cell types of interest may not be represented, do not overinterpret.
The Mean Count column shows the mean read count in cells scoring highly (H > 50) on this gene expression program.
## Error in kable(dftForKable[1:50, ], row.names = TRUE): object 'dftForKable' not found
## Error in eval(quote(list(...)), env): object 'countHighScoringCells' not found
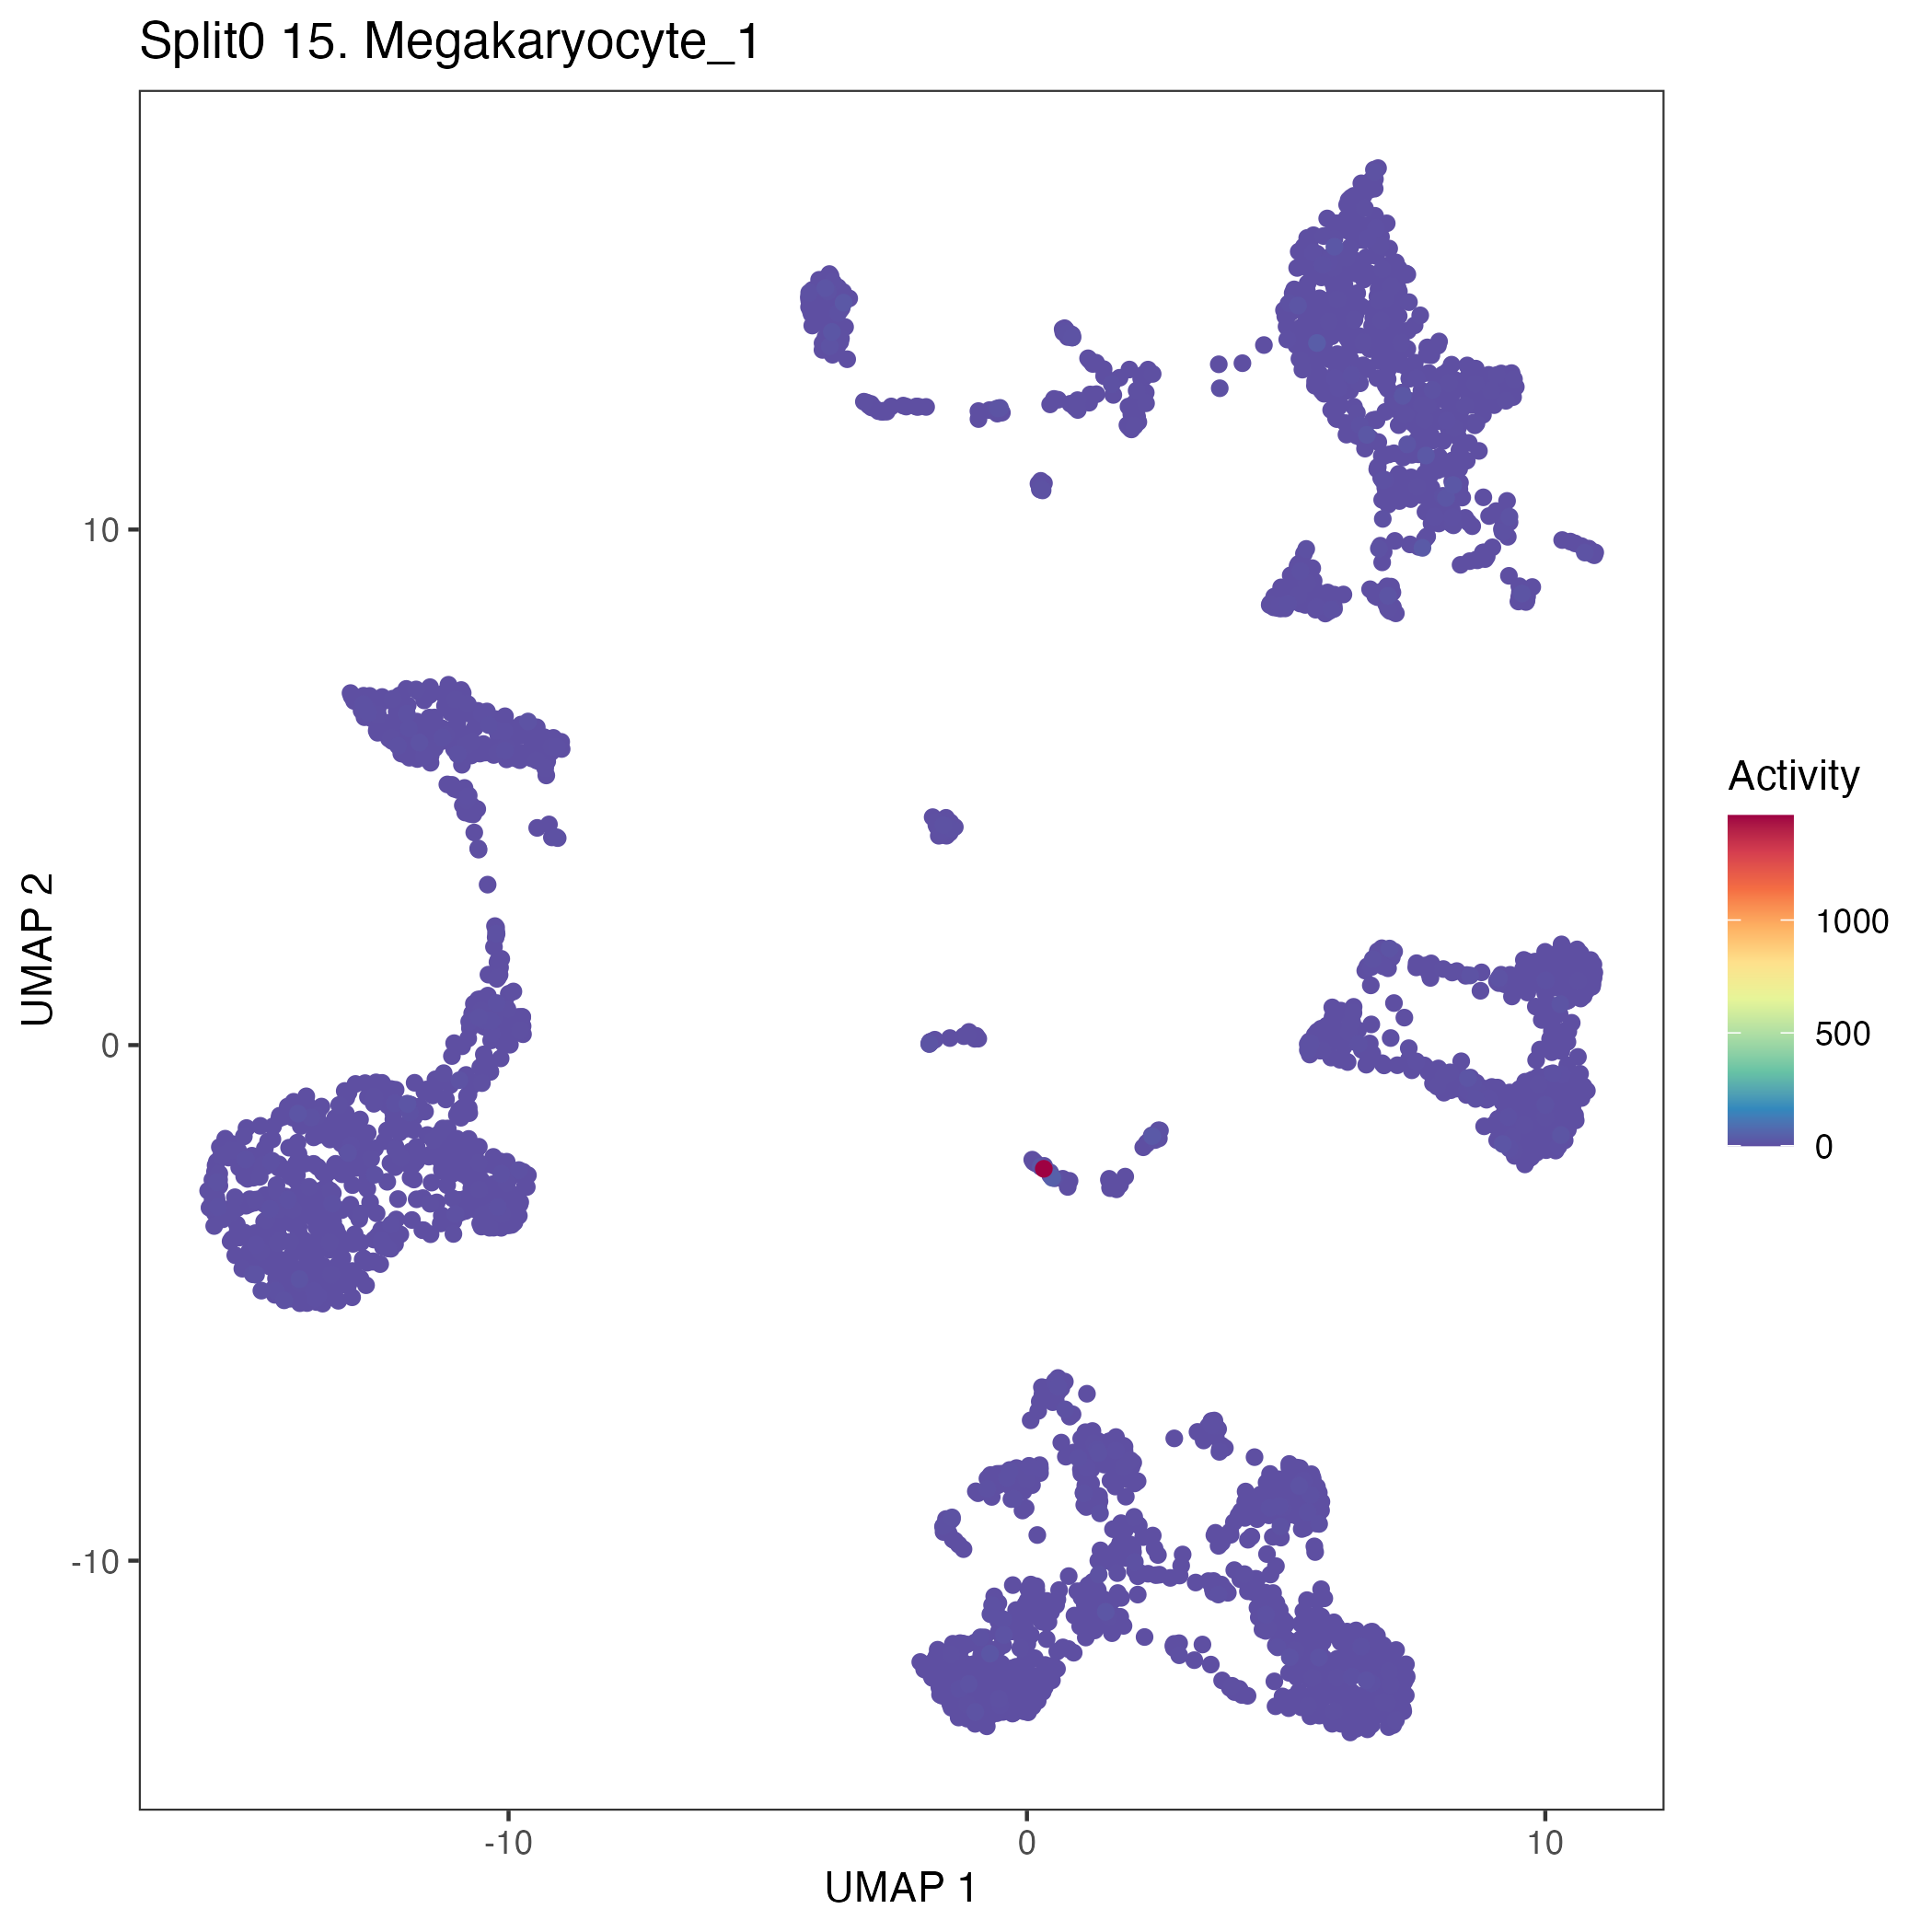
UMAP plots showing activity of gene expression program identified in GEP 15. Megakaryocyte:
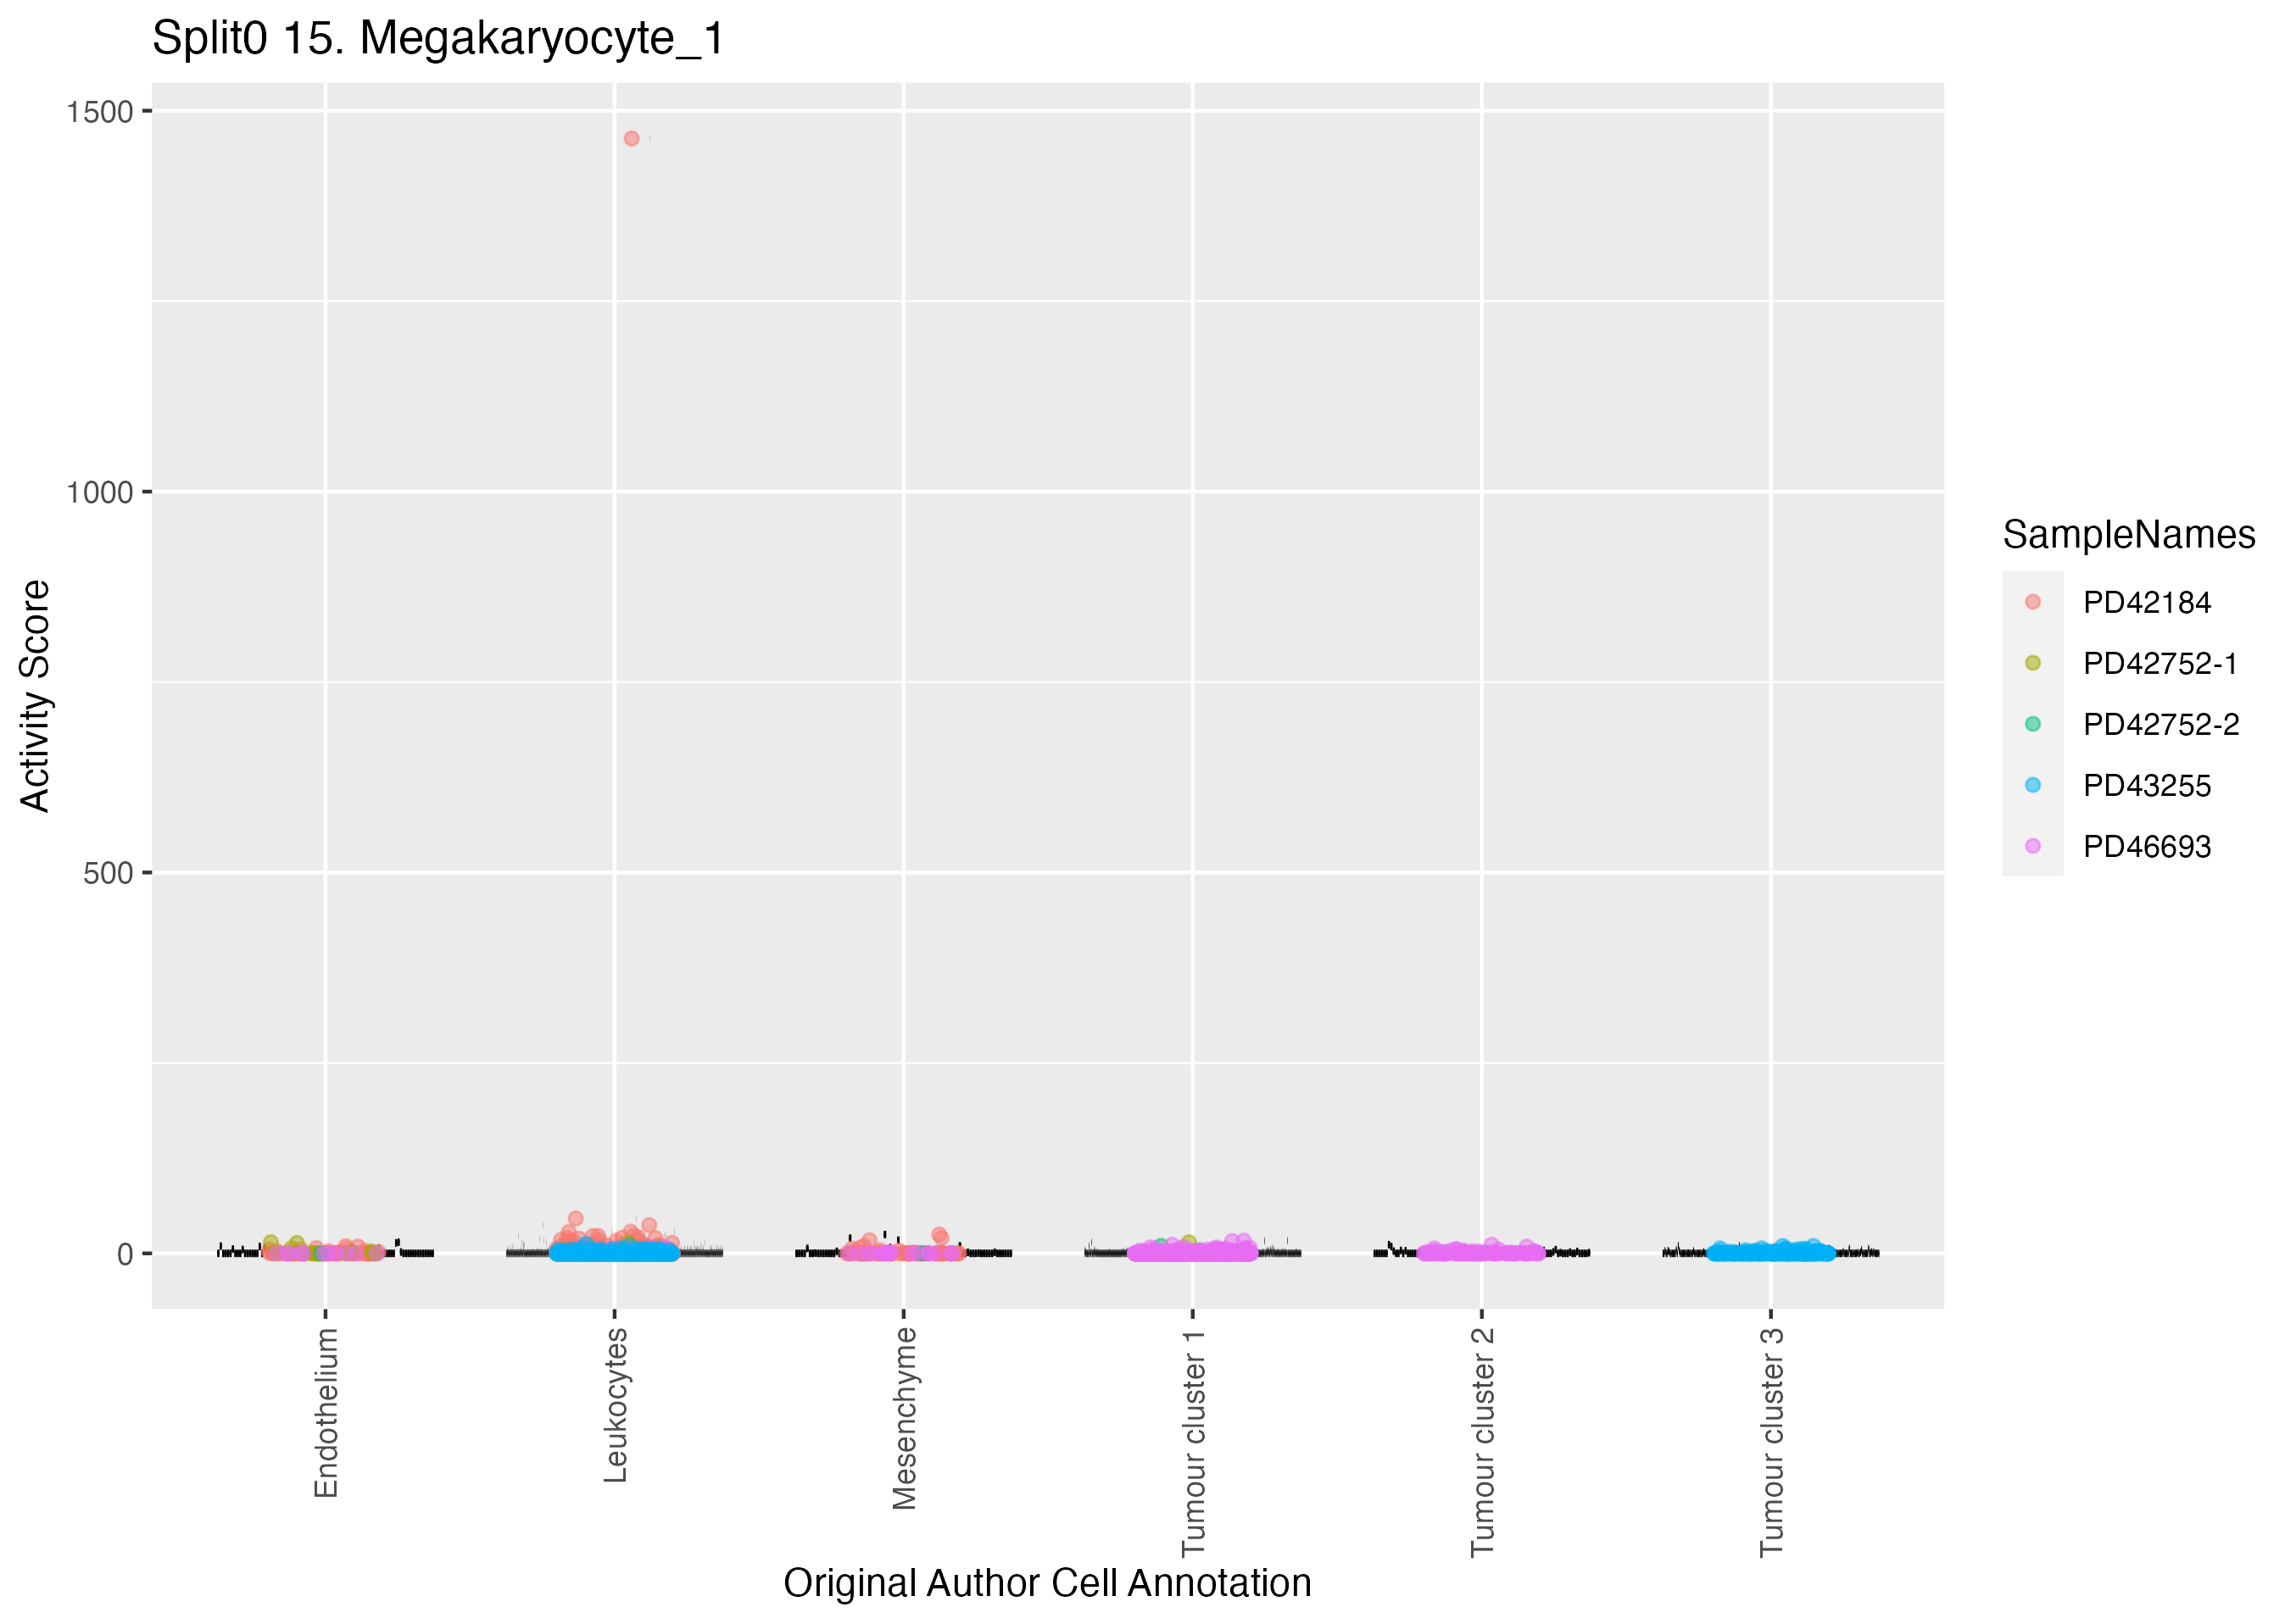
Boxlot showing activity of gene expression program identified in GEP 15. Megakaryocyte:
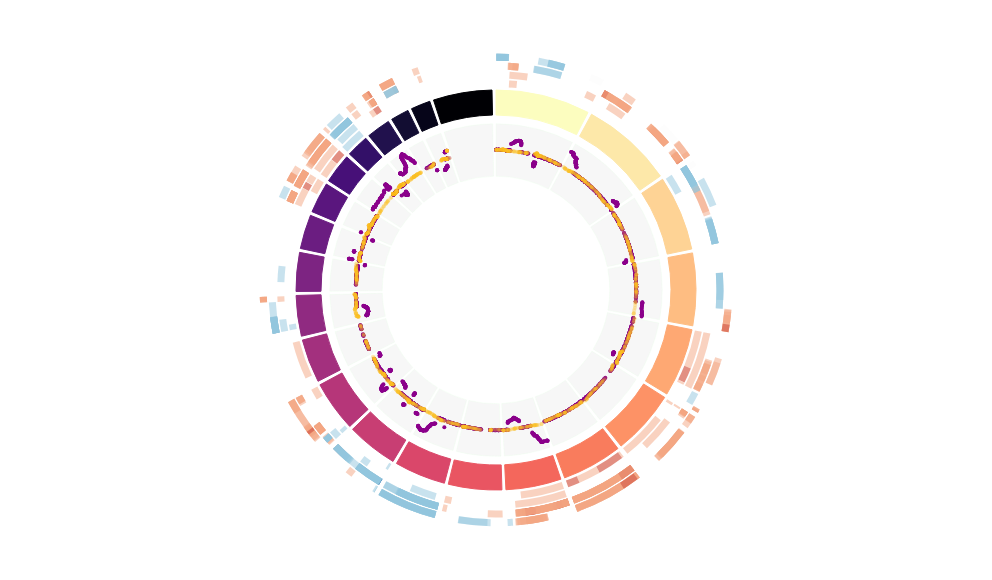
CNV Data procured from inferCNV.
Outer tracks are putative CNV regions (gains = red, losses = blue) for each patient
Inner track is expression data representing:
The top cells expressing this GEP (purple)
Random cells (n =50) from the reference set used in inferCNV (orange)
Gene set Enrichments for this program, caculated from top 50 genes
mSigDB Cell Types Gene Set:
| P-value | OR | Lower 95% CI | FDR | FWER | Genes Found | Gene Set Size | |
|---|---|---|---|---|---|---|---|
| HAY_BONE_MARROW_PLATELET | 2.02e-34 | 65.31 | 35.44 | 6.76e-32 | 1.35e-31 | 28CMTM5, TMEM40, LIPH, TUBB1, GMPR, NRGN, ENKUR, ALOX12, FRMD3, TSC22D1, ACRBP, SMIM5, ARHGAP6, PCYT1B, MFAP3L, SPOCD1, SMOX, CTTN, TRAPPC3L, TMEM140, TNFSF4, GNG11, RGS10, TRIM58, LURAP1L, FRMD4B, PDE5A, MMD |
272 |
| TRAVAGLINI_LUNG_PLATELET_MEGAKARYOCYTE_CELL | 6.69e-36 | 51.34 | 27.16 | 4.49e-33 | 4.49e-33 | 35CMTM5, TMEM40, TUBB1, TAL1, GMPR, NRGN, GFI1B, ENKUR, ALOX12, FRMD3, ITGA2B, TSC22D1, ACRBP, SMIM5, ARHGAP6, PCYT1B, MFAP3L, SPOCD1, SMOX, CTTN, TRAPPC3L, TMEM140, TNFSF4, GNG11, RGS10, TRIM58, ITGB5, FRMD4B, SNCA, PDE5A, MMD, RBPMS2, LTBP1, FHL2, IRX3 |
604 |
| ZHENG_CORD_BLOOD_C1_PUTATIVE_MEGAKARYOCYTE_PROGENITOR | 2.23e-15 | 45.82 | 21.07 | 2.99e-13 | 1.50e-12 | 12CMTM5, TMEM40, TUBB1, NRGN, GFI1B, ITGA2B, ARHGAP6, MFAP3L, CTTN, PDE5A, RBPMS2, LTBP1 |
98 |
| DESCARTES_FETAL_LUNG_MEGAKARYOCYTES | 3.22e-18 | 36.52 | 18.44 | 7.21e-16 | 2.16e-15 | 16CMTM5, TUBB1, TAL1, GMPR, NRGN, GFI1B, ITGA2B, ACRBP, MFAP3L, SMOX, TRAPPC3L, TNFSF4, XK, TRIM58, RBPMS2, LTBP1 |
177 |
| DESCARTES_FETAL_HEART_MEGAKARYOCYTES | 1.15e-14 | 39.46 | 18.21 | 1.29e-12 | 7.73e-12 | 12LIPH, TUBB1, TAL1, NRGN, GFI1B, ALOX12, ITGA2B, ACRBP, MFAP3L, TNFSF4, XK, TRIM58 |
112 |
| DESCARTES_FETAL_SPLEEN_MEGAKARYOCYTES | 4.80e-10 | 26.35 | 10.98 | 3.58e-08 | 3.22e-07 | 9TMEM40, LIPH, ALOX12, ITGA2B, CDC14B, MFAP3L, PDE5A, RBPMS2, LTBP1 |
113 |
| DESCARTES_FETAL_LIVER_MEGAKARYOCYTES | 2.04e-11 | 23.81 | 10.78 | 1.71e-09 | 1.37e-08 | 11CMTM5, TMEM40, LIPH, TUBB1, NRGN, ALOX12, ITGA2B, ACRBP, CDC14B, PDE5A, LTBP1 |
159 |
| DESCARTES_FETAL_CEREBRUM_MEGAKARYOCYTES | 4.96e-16 | 18.88 | 9.98 | 8.32e-14 | 3.33e-13 | 19CMTM5, TMEM40, LIPH, TUBB1, GMPR, NRGN, GFI1B, ALOX12, ITGA2B, ACRBP, SMIM5, ARHGAP6, MFAP3L, TNFSF4, XK, TRIM58, PDGFC, LTBP1, FHL2 |
425 |
| DESCARTES_MAIN_FETAL_MEGAKARYOCYTES | 1.71e-11 | 20.23 | 9.48 | 1.64e-09 | 1.15e-08 | 12CMTM5, TUBB1, NRGN, GFI1B, ALOX12, ITGA2B, ACRBP, ARHGAP6, MFAP3L, CTTN, PDE5A, LTBP1 |
207 |
| DESCARTES_FETAL_ADRENAL_MEGAKARYOCYTES | 1.41e-08 | 22.24 | 8.80 | 7.90e-07 | 9.48e-06 | 8TUBB1, NRGN, ALOX12, ITGA2B, ACRBP, ARHGAP6, RBPMS2, LTBP1 |
115 |
| DESCARTES_FETAL_KIDNEY_MEGAKARYOCYTES | 5.83e-09 | 19.45 | 8.15 | 3.56e-07 | 3.91e-06 | 9CMTM5, TMEM40, TUBB1, NRGN, ALOX12, ITGA2B, PCYT1B, MFAP3L, RBPMS2 |
150 |
| DESCARTES_FETAL_PLACENTA_MEGAKARYOCYTES | 4.29e-09 | 16.45 | 7.22 | 2.88e-07 | 2.88e-06 | 10TMEM40, TUBB1, TAL1, NRGN, ITGA2B, ACRBP, ARHGAP6, CDC14B, TRIM58, SNCA |
200 |
| DESCARTES_FETAL_MUSCLE_MEGAKARYOCYTES | 2.21e-08 | 13.71 | 6.04 | 1.14e-06 | 1.48e-05 | 10TMEM40, LIPH, TUBB1, NRGN, ALOX12, ITGA2B, MFAP3L, CTTN, TMEM140, LTBP1 |
238 |
| DESCARTES_FETAL_INTESTINE_ERYTHROBLASTS | 2.79e-06 | 13.30 | 4.97 | 1.25e-04 | 1.87e-03 | 7TUBB1, TAL1, GMPR, GFI1B, XK, TRIM58, SNCA |
160 |
| HAY_BONE_MARROW_CD34_POS_MKP | 1.10e-04 | 18.41 | 4.66 | 4.33e-03 | 7.35e-02 | 4ITGA2B, ANXA3, RBPMS2, LTBP1 |
63 |
| DESCARTES_FETAL_PANCREAS_ERYTHROBLASTS | 1.41e-05 | 13.21 | 4.52 | 5.90e-04 | 9.44e-03 | 6TAL1, GMPR, GFI1B, XK, TRIM58, SNCA |
135 |
| HU_FETAL_RETINA_BLOOD | 1.20e-06 | 10.05 | 4.25 | 5.74e-05 | 8.04e-04 | 9TUBB1, TAL1, GMPR, GFI1B, SMIM5, GNG11, XK, RGS10, SNCA |
282 |
| DESCARTES_FETAL_KIDNEY_ERYTHROBLASTS | 4.04e-03 | 6.71 | 1.73 | 1.51e-01 | 1.00e+00 | 4GFI1B, SMIM5, TRIM58, SNCA |
166 |
| DESCARTES_FETAL_STOMACH_ERYTHROBLASTS | 7.18e-03 | 8.22 | 1.61 | 2.54e-01 | 1.00e+00 | 3TUBB1, TRIM58, SNCA |
100 |
| CUI_DEVELOPING_HEART_5TH_WEEK_ATRIAL_CARDIOMYOCYTE | 1.31e-02 | 12.39 | 1.41 | 4.20e-01 | 1.00e+00 | 2FRMD3, IRX3 |
44 |
Dowload full table
mSigDB Hallmark Gene Sets:
| P-value | OR | Lower 95% CI | FDR | FWER | Genes Found | Gene Set Size | |
|---|---|---|---|---|---|---|---|
| HALLMARK_HEME_METABOLISM | 1.08e-03 | 7.12 | 2.18 | 5.40e-02 | 5.40e-02 | 5TAL1, SMOX, XK, TRIM58, SNCA |
200 |
| HALLMARK_INTERFERON_ALPHA_RESPONSE | 5.62e-02 | 5.48 | 0.64 | 9.89e-01 | 1.00e+00 | 2GMPR, TMEM140 |
97 |
| HALLMARK_ANDROGEN_RESPONSE | 5.93e-02 | 5.31 | 0.62 | 9.89e-01 | 1.00e+00 | 2TSC22D1, CDC14B |
100 |
| HALLMARK_UV_RESPONSE_DN | 1.10e-01 | 3.67 | 0.43 | 1.00e+00 | 1.00e+00 | 2LTBP1, FHL2 |
144 |
| HALLMARK_KRAS_SIGNALING_UP | 1.85e-01 | 2.63 | 0.31 | 1.00e+00 | 1.00e+00 | 2GNG11, MMD |
200 |
| HALLMARK_IL6_JAK_STAT3_SIGNALING | 2.93e-01 | 2.97 | 0.07 | 1.00e+00 | 1.00e+00 | 1PDGFC |
87 |
| HALLMARK_SPERMATOGENESIS | 4.15e-01 | 1.90 | 0.05 | 1.00e+00 | 1.00e+00 | 1ACRBP |
135 |
| HALLMARK_MITOTIC_SPINDLE | 5.45e-01 | 1.29 | 0.03 | 1.00e+00 | 1.00e+00 | 1CTTN |
199 |
| HALLMARK_TNFA_SIGNALING_VIA_NFKB | 5.47e-01 | 1.28 | 0.03 | 1.00e+00 | 1.00e+00 | 1TSC22D1 |
200 |
| HALLMARK_ESTROGEN_RESPONSE_EARLY | 5.47e-01 | 1.28 | 0.03 | 1.00e+00 | 1.00e+00 | 1FHL2 |
200 |
| HALLMARK_MYOGENESIS | 5.47e-01 | 1.28 | 0.03 | 1.00e+00 | 1.00e+00 | 1ITGB5 |
200 |
| HALLMARK_EPITHELIAL_MESENCHYMAL_TRANSITION | 5.47e-01 | 1.28 | 0.03 | 1.00e+00 | 1.00e+00 | 1ITGB5 |
200 |
| HALLMARK_XENOBIOTIC_METABOLISM | 5.47e-01 | 1.28 | 0.03 | 1.00e+00 | 1.00e+00 | 1SMOX |
200 |
| HALLMARK_P53_PATHWAY | 5.47e-01 | 1.28 | 0.03 | 1.00e+00 | 1.00e+00 | 1TSC22D1 |
200 |
| HALLMARK_HYPOXIA | 1.00e+00 | 0.00 | 0.00 | 1.00e+00 | 1.00e+00 | 0 |
200 |
| HALLMARK_CHOLESTEROL_HOMEOSTASIS | 1.00e+00 | 0.00 | 0.00 | 1.00e+00 | 1.00e+00 | 0 |
74 |
| HALLMARK_WNT_BETA_CATENIN_SIGNALING | 1.00e+00 | 0.00 | 0.00 | 1.00e+00 | 1.00e+00 | 0 |
42 |
| HALLMARK_TGF_BETA_SIGNALING | 1.00e+00 | 0.00 | 0.00 | 1.00e+00 | 1.00e+00 | 0 |
54 |
| HALLMARK_DNA_REPAIR | 1.00e+00 | 0.00 | 0.00 | 1.00e+00 | 1.00e+00 | 0 |
150 |
| HALLMARK_G2M_CHECKPOINT | 1.00e+00 | 0.00 | 0.00 | 1.00e+00 | 1.00e+00 | 0 |
200 |
Dowload full table
KEGG Pathways:
| P-value | OR | Lower 95% CI | FDR | FWER | Genes Found | Gene Set Size | |
|---|---|---|---|---|---|---|---|
| KEGG_PATHOGENIC_ESCHERICHIA_COLI_INFECTION | 2.07e-02 | 9.64 | 1.11 | 1.00e+00 | 1.00e+00 | 2TUBB1, CTTN |
56 |
| KEGG_ARRHYTHMOGENIC_RIGHT_VENTRICULAR_CARDIOMYOPATHY_ARVC | 3.47e-02 | 7.23 | 0.84 | 1.00e+00 | 1.00e+00 | 2ITGA2B, ITGB5 |
74 |
| KEGG_FOCAL_ADHESION | 4.30e-02 | 4.07 | 0.80 | 1.00e+00 | 1.00e+00 | 3ITGA2B, ITGB5, PDGFC |
199 |
| KEGG_REGULATION_OF_ACTIN_CYTOSKELETON | 5.07e-02 | 3.80 | 0.75 | 1.00e+00 | 1.00e+00 | 3ITGA2B, ITGB5, PDGFC |
213 |
| KEGG_HYPERTROPHIC_CARDIOMYOPATHY_HCM | 4.26e-02 | 6.43 | 0.74 | 1.00e+00 | 1.00e+00 | 2ITGA2B, ITGB5 |
83 |
| KEGG_ECM_RECEPTOR_INTERACTION | 4.36e-02 | 6.35 | 0.74 | 1.00e+00 | 1.00e+00 | 2ITGA2B, ITGB5 |
84 |
| KEGG_DILATED_CARDIOMYOPATHY | 4.93e-02 | 5.92 | 0.69 | 1.00e+00 | 1.00e+00 | 2ITGA2B, ITGB5 |
90 |
| KEGG_GAP_JUNCTION | 4.93e-02 | 5.92 | 0.69 | 1.00e+00 | 1.00e+00 | 2TUBB1, PDGFC |
90 |
| KEGG_PURINE_METABOLISM | 1.29e-01 | 3.32 | 0.39 | 1.00e+00 | 1.00e+00 | 2GMPR, PDE5A |
159 |
| KEGG_CYTOKINE_CYTOKINE_RECEPTOR_INTERACTION | 2.77e-01 | 1.98 | 0.23 | 1.00e+00 | 1.00e+00 | 2TNFSF4, PDGFC |
265 |
| KEGG_ARACHIDONIC_ACID_METABOLISM | 2.06e-01 | 4.47 | 0.11 | 1.00e+00 | 1.00e+00 | 1ALOX12 |
58 |
| KEGG_MELANOMA | 2.46e-01 | 3.64 | 0.09 | 1.00e+00 | 1.00e+00 | 1PDGFC |
71 |
| KEGG_GLYCEROPHOSPHOLIPID_METABOLISM | 2.64e-01 | 3.36 | 0.08 | 1.00e+00 | 1.00e+00 | 1PCYT1B |
77 |
| KEGG_SMALL_CELL_LUNG_CANCER | 2.84e-01 | 3.07 | 0.08 | 1.00e+00 | 1.00e+00 | 1ITGA2B |
84 |
| KEGG_TGF_BETA_SIGNALING_PATHWAY | 2.90e-01 | 3.00 | 0.07 | 1.00e+00 | 1.00e+00 | 1LTBP1 |
86 |
| KEGG_HEMATOPOIETIC_CELL_LINEAGE | 2.93e-01 | 2.97 | 0.07 | 1.00e+00 | 1.00e+00 | 1ITGA2B |
87 |
| KEGG_PROSTATE_CANCER | 2.98e-01 | 2.90 | 0.07 | 1.00e+00 | 1.00e+00 | 1PDGFC |
89 |
| KEGG_CELL_CYCLE | 3.91e-01 | 2.06 | 0.05 | 1.00e+00 | 1.00e+00 | 1CDC14B |
125 |
| KEGG_PARKINSONS_DISEASE | 4.03e-01 | 1.98 | 0.05 | 1.00e+00 | 1.00e+00 | 1SNCA |
130 |
| KEGG_TIGHT_JUNCTION | 4.08e-01 | 1.95 | 0.05 | 1.00e+00 | 1.00e+00 | 1CTTN |
132 |
Dowload full table
CHR Positional Gene Sets:
| P-value | OR | Lower 95% CI | FDR | FWER | Genes Found | Gene Set Size | |
|---|---|---|---|---|---|---|---|
| chr10p12 | 9.90e-02 | 3.92 | 0.46 | 1.00e+00 | 1.00e+00 | 2ENKUR, ARMC4 |
135 |
| chr4q33 | 5.43e-02 | 19.60 | 0.45 | 1.00e+00 | 1.00e+00 | 1MFAP3L |
14 |
| chr9p23 | 7.30e-02 | 14.16 | 0.33 | 1.00e+00 | 1.00e+00 | 1LURAP1L |
19 |
| chrXp22 | 2.31e-01 | 2.25 | 0.26 | 1.00e+00 | 1.00e+00 | 2ARHGAP6, PCYT1B |
233 |
| chr17p13 | 3.76e-01 | 1.56 | 0.18 | 1.00e+00 | 1.00e+00 | 2ALOX12, INCA1 |
336 |
| chr7q33 | 1.87e-01 | 5.00 | 0.12 | 1.00e+00 | 1.00e+00 | 1TMEM140 |
52 |
| chr4q26 | 1.90e-01 | 4.91 | 0.12 | 1.00e+00 | 1.00e+00 | 1PDE5A |
53 |
| chr1p33 | 2.13e-01 | 4.32 | 0.11 | 1.00e+00 | 1.00e+00 | 1TAL1 |
60 |
| chr4q22 | 2.43e-01 | 3.70 | 0.09 | 1.00e+00 | 1.00e+00 | 1SNCA |
70 |
| chr2q12 | 2.70e-01 | 3.27 | 0.08 | 1.00e+00 | 1.00e+00 | 1FHL2 |
79 |
| chrXp21 | 2.78e-01 | 3.15 | 0.08 | 1.00e+00 | 1.00e+00 | 1XK |
82 |
| chr17q22 | 2.90e-01 | 3.00 | 0.07 | 1.00e+00 | 1.00e+00 | 1MMD |
86 |
| chr14q22 | 3.01e-01 | 2.87 | 0.07 | 1.00e+00 | 1.00e+00 | 1CDKL1 |
90 |
| chr16q12 | 3.17e-01 | 2.68 | 0.07 | 1.00e+00 | 1.00e+00 | 1IRX3 |
96 |
| chr2p22 | 3.23e-01 | 2.63 | 0.06 | 1.00e+00 | 1.00e+00 | 1LTBP1 |
98 |
| chr4q32 | 3.62e-01 | 2.28 | 0.06 | 1.00e+00 | 1.00e+00 | 1PDGFC |
113 |
| chr3q27 | 3.67e-01 | 2.24 | 0.06 | 1.00e+00 | 1.00e+00 | 1LIPH |
115 |
| chr20p13 | 3.72e-01 | 2.20 | 0.05 | 1.00e+00 | 1.00e+00 | 1SMOX |
117 |
| chr6q22 | 3.77e-01 | 2.16 | 0.05 | 1.00e+00 | 1.00e+00 | 1TRAPPC3L |
119 |
| chr3p14 | 3.84e-01 | 2.11 | 0.05 | 1.00e+00 | 1.00e+00 | 1FRMD4B |
122 |
Dowload full table
Transcription Factor Targets:
| P-value | OR | Lower 95% CI | FDR | FWER | Genes Found | Gene Set Size | |
|---|---|---|---|---|---|---|---|
| ZNF584_TARGET_GENES | 5.68e-03 | 6.07 | 1.57 | 9.73e-01 | 1.00e+00 | 4TAL1, CTTN, TMEM140, LTBP1 |
183 |
| MIF1_01 | 6.01e-03 | 5.97 | 1.55 | 9.73e-01 | 1.00e+00 | 4NRGN, ENKUR, TSC22D1, LURAP1L |
186 |
| CP2_02 | 1.69e-02 | 4.37 | 1.13 | 1.00e+00 | 1.00e+00 | 4FRMD3, TSC22D1, LTBP1, IRX3 |
253 |
| ZNF589_TARGET_GENES | 1.42e-02 | 2.99 | 1.13 | 1.00e+00 | 1.00e+00 | 7TAL1, GFI1B, ENKUR, TSC22D1, ACRBP, MFAP3L, FHL2 |
688 |
| TCF11_01 | 1.80e-02 | 4.28 | 1.11 | 1.00e+00 | 1.00e+00 | 4PCYT1B, INCA1, LURAP1L, FHL2 |
258 |
| P53_DECAMER_Q2 | 1.80e-02 | 4.28 | 1.11 | 1.00e+00 | 1.00e+00 | 4TSC22D1, SMOX, TNFSF4, LTBP1 |
258 |
| AR_03 | 2.21e-02 | 9.30 | 1.07 | 1.00e+00 | 1.00e+00 | 2NRGN, SMOX |
58 |
| EFC_Q6 | 2.20e-02 | 4.01 | 1.04 | 1.00e+00 | 1.00e+00 | 4NRGN, ENKUR, TSC22D1, PCYT1B |
275 |
| MAFG_TARGET_GENES | 3.29e-02 | 2.10 | 1.00 | 1.00e+00 | 1.00e+00 | 12TMEM40, TUBB1, TSC22D1, PCYT1B, MFAP3L, ANXA3, CTTN, ITGB5, CRYM, CDKL1, LTBP1, FHL2 |
1893 |
| CTGRYYYNATT_UNKNOWN | 3.47e-02 | 7.23 | 0.84 | 1.00e+00 | 1.00e+00 | 2SMOX, TNFSF4 |
74 |
| WTTGKCTG_UNKNOWN | 4.74e-02 | 2.70 | 0.83 | 1.00e+00 | 1.00e+00 | 5GFI1B, TSC22D1, PCYT1B, SMOX, LTBP1 |
519 |
| CBFA2T2_TARGET_GENES | 8.08e-02 | 1.86 | 0.83 | 1.00e+00 | 1.00e+00 | 10TAL1, ENKUR, ITGA2B, ACRBP, MFAP3L, SPOCD1, CTTN, ITGB5, CDKL1, FHL2 |
1694 |
| GATTGGY_NFY_Q6_01 | 7.22e-02 | 2.04 | 0.82 | 1.00e+00 | 1.00e+00 | 8TAL1, NRGN, TSC22D1, CDC14B, SNCA, MMD, LTBP1, IRX3 |
1177 |
| ZNF490_TARGET_GENES | 4.62e-02 | 3.14 | 0.82 | 1.00e+00 | 1.00e+00 | 4SMOX, TMEM140, CRYM, CDKL1 |
350 |
| PHB2_TARGET_GENES | 4.25e-02 | 4.09 | 0.81 | 1.00e+00 | 1.00e+00 | 3GFI1B, ACRBP, MFAP3L |
198 |
| EGR2_01 | 4.25e-02 | 4.09 | 0.81 | 1.00e+00 | 1.00e+00 | 3NRGN, INCA1, XK |
198 |
| SRF_C | 5.18e-02 | 3.76 | 0.74 | 1.00e+00 | 1.00e+00 | 3XK, LTBP1, FHL2 |
215 |
| ZNF512B_TARGET_GENES | 5.36e-02 | 3.71 | 0.73 | 1.00e+00 | 1.00e+00 | 3GFI1B, ARMC4, MMD |
218 |
| GGATTA_PITX2_Q2 | 7.41e-02 | 2.36 | 0.73 | 1.00e+00 | 1.00e+00 | 5PCYT1B, XK, PDGFC, LTBP1, IRX3 |
594 |
| SUPT16H_TARGET_GENES | 2.07e-01 | 1.62 | 0.72 | 1.00e+00 | 1.00e+00 | 10CMTM5, TMEM40, ENKUR, SMOX, CTTN, RGS10, ITGB5, FRMD4B, PDGFC, PDE5A |
1944 |
Dowload full table
GO Biological Processes:
| P-value | OR | Lower 95% CI | FDR | FWER | Genes Found | Gene Set Size | |
|---|---|---|---|---|---|---|---|
| GOBP_POSITIVE_REGULATION_OF_CELL_DIVISION | 4.74e-03 | 9.61 | 1.88 | 1.00e+00 | 1.00e+00 | 3TAL1, CDC14B, PDGFC |
86 |
| GOBP_AMINE_BIOSYNTHETIC_PROCESS | 1.04e-02 | 14.07 | 1.60 | 1.00e+00 | 1.00e+00 | 2SMOX, SNCA |
39 |
| GOBP_SPERMINE_METABOLIC_PROCESS | 1.98e-02 | 63.54 | 1.27 | 1.00e+00 | 1.00e+00 | 1SMOX |
5 |
| GOBP_RESPONSE_TO_IRON_II_ION | 1.98e-02 | 63.54 | 1.27 | 1.00e+00 | 1.00e+00 | 1SNCA |
5 |
| GOBP_CGMP_CATABOLIC_PROCESS | 1.98e-02 | 63.54 | 1.27 | 1.00e+00 | 1.00e+00 | 1PDE5A |
5 |
| GOBP_PROXIMAL_DISTAL_PATTERN_FORMATION_INVOLVED_IN_NEPHRON_DEVELOPMENT | 1.98e-02 | 63.54 | 1.27 | 1.00e+00 | 1.00e+00 | 1IRX3 |
5 |
| GOBP_EPOXIDE_METABOLIC_PROCESS | 1.98e-02 | 63.54 | 1.27 | 1.00e+00 | 1.00e+00 | 1ALOX12 |
5 |
| GOBP_REGULATION_OF_T_CELL_COSTIMULATION | 1.98e-02 | 63.54 | 1.27 | 1.00e+00 | 1.00e+00 | 1TNFSF4 |
5 |
| GOBP_CELL_MATRIX_ADHESION | 1.23e-02 | 4.81 | 1.25 | 1.00e+00 | 1.00e+00 | 4ITGA2B, ARHGAP6, CTTN, ITGB5 |
230 |
| GOBP_PLATELET_DERIVED_GROWTH_FACTOR_RECEPTOR_SIGNALING_PATHWAY | 2.14e-02 | 9.46 | 1.09 | 1.00e+00 | 1.00e+00 | 2PDGFC, SNCA |
57 |
| GOBP_REGULATION_OF_ISOTYPE_SWITCHING_TO_IGE_ISOTYPES | 2.37e-02 | 50.83 | 1.06 | 1.00e+00 | 1.00e+00 | 1TNFSF4 |
6 |
| GOBP_MAST_CELL_DIFFERENTIATION | 2.37e-02 | 50.83 | 1.06 | 1.00e+00 | 1.00e+00 | 1TAL1 |
6 |
| GOBP_REGULATION_OF_MITOCHONDRIAL_ELECTRON_TRANSPORT_NADH_TO_UBIQUINONE | 2.37e-02 | 50.83 | 1.06 | 1.00e+00 | 1.00e+00 | 1SNCA |
6 |
| GOBP_PLATELET_AGGREGATION | 2.50e-02 | 8.68 | 1.00 | 1.00e+00 | 1.00e+00 | 2ALOX12, ITGA2B |
62 |
| GOBP_REGULATION_OF_CELL_DIVISION | 2.95e-02 | 4.75 | 0.94 | 1.00e+00 | 1.00e+00 | 3TAL1, CDC14B, PDGFC |
171 |
| GOBP_NEGATIVE_REGULATION_OF_T_HELPER_1_TYPE_IMMUNE_RESPONSE | 2.76e-02 | 42.41 | 0.91 | 1.00e+00 | 1.00e+00 | 1TNFSF4 |
7 |
| GOBP_CDP_CHOLINE_PATHWAY | 2.76e-02 | 42.41 | 0.91 | 1.00e+00 | 1.00e+00 | 1PCYT1B |
7 |
| GOBP_NEGATIVE_REGULATION_OF_REGULATORY_T_CELL_DIFFERENTIATION | 2.76e-02 | 42.41 | 0.91 | 1.00e+00 | 1.00e+00 | 1TNFSF4 |
7 |
| GOBP_POSITIVE_REGULATION_OF_T_HELPER_2_CELL_DIFFERENTIATION | 2.76e-02 | 42.41 | 0.91 | 1.00e+00 | 1.00e+00 | 1TNFSF4 |
7 |
| GOBP_MAINTENANCE_OF_PROTEIN_LOCATION_IN_EXTRACELLULAR_REGION | 2.76e-02 | 42.41 | 0.91 | 1.00e+00 | 1.00e+00 | 1LTBP1 |
7 |
Dowload full table
Immunological Gene Sets:
| P-value | OR | Lower 95% CI | FDR | FWER | Genes Found | Gene Set Size | |
|---|---|---|---|---|---|---|---|
| GSE9006_HEALTHY_VS_TYPE_1_DIABETES_PBMC_AT_DX_UP | 2.12e-10 | 18.85 | 8.57 | 1.03e-06 | 1.03e-06 | 11TUBB1, NRGN, ALOX12, ITGA2B, ARHGAP6, MFAP3L, CTTN, GNG11, XK, ITGB5, MMD |
198 |
| GSE9509_LPS_VS_LPS_AND_IL10_STIM_IL10_KO_MACROPHAGE_20MIN_UP | 9.76e-06 | 10.88 | 4.08 | 1.75e-02 | 4.76e-02 | 7TAL1, GMPR, GFI1B, ITGA2B, ACRBP, CDC14B, TMEM140 |
194 |
| GSE11057_PBMC_VS_MEM_CD4_TCELL_UP | 1.08e-05 | 10.71 | 4.01 | 1.75e-02 | 5.25e-02 | 7TMEM40, TUBB1, NRGN, ITGA2B, ACRBP, GNG11, PDGFC |
197 |
| GSE37605_TREG_VS_TCONV_NOD_FOXP3_FUSION_GFP_DN | 5.10e-05 | 10.39 | 3.57 | 6.21e-02 | 2.48e-01 | 6TUBB1, ALOX12, ITGA2B, GNG11, PDE5A, RBPMS2 |
170 |
| GSE45365_WT_VS_IFNAR_KO_BCELL_MCMV_INFECTION_DN | 1.08e-04 | 9.02 | 3.10 | 1.00e-01 | 5.25e-01 | 6CMTM5, NRGN, ITGA2B, ACRBP, SPOCD1, LTBP1 |
195 |
| GSE2405_0H_VS_3H_A_PHAGOCYTOPHILUM_STIM_NEUTROPHIL_UP | 1.24e-04 | 8.78 | 3.02 | 1.00e-01 | 6.03e-01 | 6LIPH, GMPR, TSC22D1, CACHD1, CTTN, GNG11 |
200 |
| GSE5455_HEALTHY_VS_TUMOR_BEARING_MOUSE_SPLEEN_MONOCYTE_UP | 1.01e-03 | 7.23 | 2.22 | 3.29e-01 | 1.00e+00 | 5NRGN, ANXA3, TMEM140, FRMD4B, MMD |
197 |
| GSE13485_DAY3_VS_DAY7_YF17D_VACCINE_PBMC_DN | 1.03e-03 | 7.19 | 2.20 | 3.29e-01 | 1.00e+00 | 5GMPR, FRMD3, SPOCD1, SMOX, FHL2 |
198 |
| GSE1432_1H_VS_24H_IFNG_MICROGLIA_UP | 1.08e-03 | 7.12 | 2.18 | 3.29e-01 | 1.00e+00 | 5TAL1, ALOX12, PDGFC, SNCA, MMD |
200 |
| GSE17721_CTRL_VS_PAM3CSK4_6H_BMDC_UP | 1.08e-03 | 7.12 | 2.18 | 3.29e-01 | 1.00e+00 | 5SMOX, TMEM140, RGS10, FRMD4B, MMD |
200 |
| GSE24142_EARLY_THYMIC_PROGENITOR_VS_DN2_THYMOCYTE_UP | 1.08e-03 | 7.12 | 2.18 | 3.29e-01 | 1.00e+00 | 5TAL1, GFI1B, TSC22D1, ANXA3, RGS10 |
200 |
| GSE24142_DN2_VS_DN3_THYMOCYTE_UP | 1.08e-03 | 7.12 | 2.18 | 3.29e-01 | 1.00e+00 | 5TMEM40, TAL1, NRGN, ITGA2B, ARHGAP6 |
200 |
| GSE2405_HEAT_KILLED_LYSATE_VS_LIVE_A_PHAGOCYTOPHILUM_STIM_NEUTROPHIL_24H_UP | 1.08e-03 | 7.12 | 2.18 | 3.29e-01 | 1.00e+00 | 5LIPH, GMPR, TSC22D1, CACHD1, GNG11 |
200 |
| GSE22601_IMMATURE_CD4_SINGLE_POSITIVE_VS_DOUBLE_POSITIVE_THYMOCYTE_DN | 1.08e-03 | 7.12 | 2.18 | 3.29e-01 | 1.00e+00 | 5TMEM40, ANXA3, TNFSF4, RGS10, FRMD4B |
200 |
| GSE21670_STAT3_KO_VS_WT_CD4_TCELL_IL6_TREATED_DN | 1.08e-03 | 7.12 | 2.18 | 3.29e-01 | 1.00e+00 | 5TMEM40, ALOX12, ITGA2B, TMEM140, GNG11 |
200 |
| GSE40068_BCL6_POS_VS_NEG_CXCR5_POS_TFH_UP | 1.08e-03 | 7.12 | 2.18 | 3.29e-01 | 1.00e+00 | 5TMEM140, RGS10, FRMD4B, MMD, FHL2 |
200 |
| GSE360_HIGH_VS_LOW_DOSE_B_MALAYI_DC_UP | 7.32e-03 | 5.63 | 1.46 | 8.54e-01 | 1.00e+00 | 4TSC22D1, TNFSF4, ITGB5, LTBP1 |
197 |
| GSE18281_PERIMEDULLARY_CORTICAL_REGION_VS_WHOLE_MEDULLA_THYMUS_DN | 7.32e-03 | 5.63 | 1.46 | 8.54e-01 | 1.00e+00 | 4FRMD3, ITGA2B, CTTN, FHL2 |
197 |
| GSE2770_IL12_AND_TGFB_ACT_VS_ACT_CD4_TCELL_6H_DN | 7.45e-03 | 5.60 | 1.45 | 8.54e-01 | 1.00e+00 | 4ANXA3, FRMD4B, SNCA, MMD |
198 |
| GSE13306_RA_VS_UNTREATED_TREG_UP | 7.58e-03 | 5.57 | 1.44 | 8.54e-01 | 1.00e+00 | 4NRGN, ENKUR, CTTN, MMD |
199 |
Top Ranked Transcription Factors for this Gene Expression Program:
| Gene Symbol | TF Rank | DNA Binding Domain | Motif Status | IUPAC PWM | GTEx | DepMap | Decartes |
|---|---|---|---|---|---|---|---|
| TAL1 | 5 | Yes | Known motif | Obligate heteromer | In vivo/Misc source | Only known motifs are from Transfac or HocoMoco - origin is uncertain | No motif yielded from PBMs or HT-SELEX. Binds DNA as heterodimer with TCF3 (PDB:2YPB and PDB:2YPA). |
| GFI1B | 8 | Yes | Known motif | Monomer or homomultimer | High-throughput in vitro | None | None |
| TSC22D1 | 15 | Yes | Likely to be sequence specific TF | Monomer or homomultimer | No motif | None | TSC22D1 appears to homo- and heterodimerize with other TFs to affect transcription (PMID: 10488076). In vitro, it has been shown to bind GC-rich DNA sequences (PMID: 9022669) |
| ANXA3 | 26 | No | Unlikely to be sequence specific TF | Not a DNA binding protein | No motif | None | Protein operates far upstream on the signaling cascade. |
| TNFSF4 | 32 | No | Unlikely to be sequence specific TF | Not a DNA binding protein | No motif | None | Extracellular signaling molecule. Included only because it regulates TFs. |
| FHL2 | 49 | No | Unlikely to be sequence specific TF | Not a DNA binding protein | No motif | None | LIM ZF proteins are unlikely to bind DNA. Experimental evidence does not support a role for FHL2 as a sequence-specific DNA-binding protein (PMID:10654935) |
| IRX3 | 50 | Yes | Known motif | Monomer or homomultimer | High-throughput in vitro | None | None |
| SPHK1 | 78 | No | Unlikely to be sequence specific TF | Not a DNA binding protein | No motif | None | None |
| INF2 | 82 | No | Unlikely to be sequence specific TF | Not a DNA binding protein | No motif | Has a putative AT-hook | None |
| MEIS1 | 88 | Yes | Known motif | Monomer or homomultimer | High-throughput in vitro | None | None |
| LBX2 | 99 | Yes | Known motif | Monomer or homomultimer | High-throughput in vitro | None | None |
| TGFB1I1 | 120 | No | Unlikely to be sequence specific TF | Not a DNA binding protein | No motif | None | Available evidence suggests that it acts as a co-factor |
| TGFB1 | 122 | No | Unlikely to be sequence specific TF | Not a DNA binding protein | No motif | None | None |
| NCOA4 | 127 | No | Unlikely to be sequence specific TF | Not a DNA binding protein | No motif | None | None |
| LYL1 | 134 | Yes | Inferred motif | Obligate heteromer | In vivo/Misc source | None | TAL1, TAL2 and LYL are very similar and have a basic region with a bulky tryptophan inserting into the cluster of the basic residues. Binds DNA as a heterodimer with TCF3 (PDB:2YPB and PDB:2YPA). |
| HIC1 | 144 | Yes | Known motif | Monomer or homomultimer | High-throughput in vitro | None | None |
| HMGA1 | 146 | Yes | Known motif | Monomer or homomultimer | In vivo/Misc source | Only known motifs are from Transfac or HocoMoco - origin is uncertain | None |
| LMO4 | 155 | No | Unlikely to be sequence specific TF | Not a DNA binding protein | No motif | None | None |
| CD36 | 165 | No | Unlikely to be sequence specific TF | Not a DNA binding protein | No motif | None | None |
| PBX1 | 177 | Yes | Known motif | Monomer or homomultimer | High-throughput in vitro | None | None |
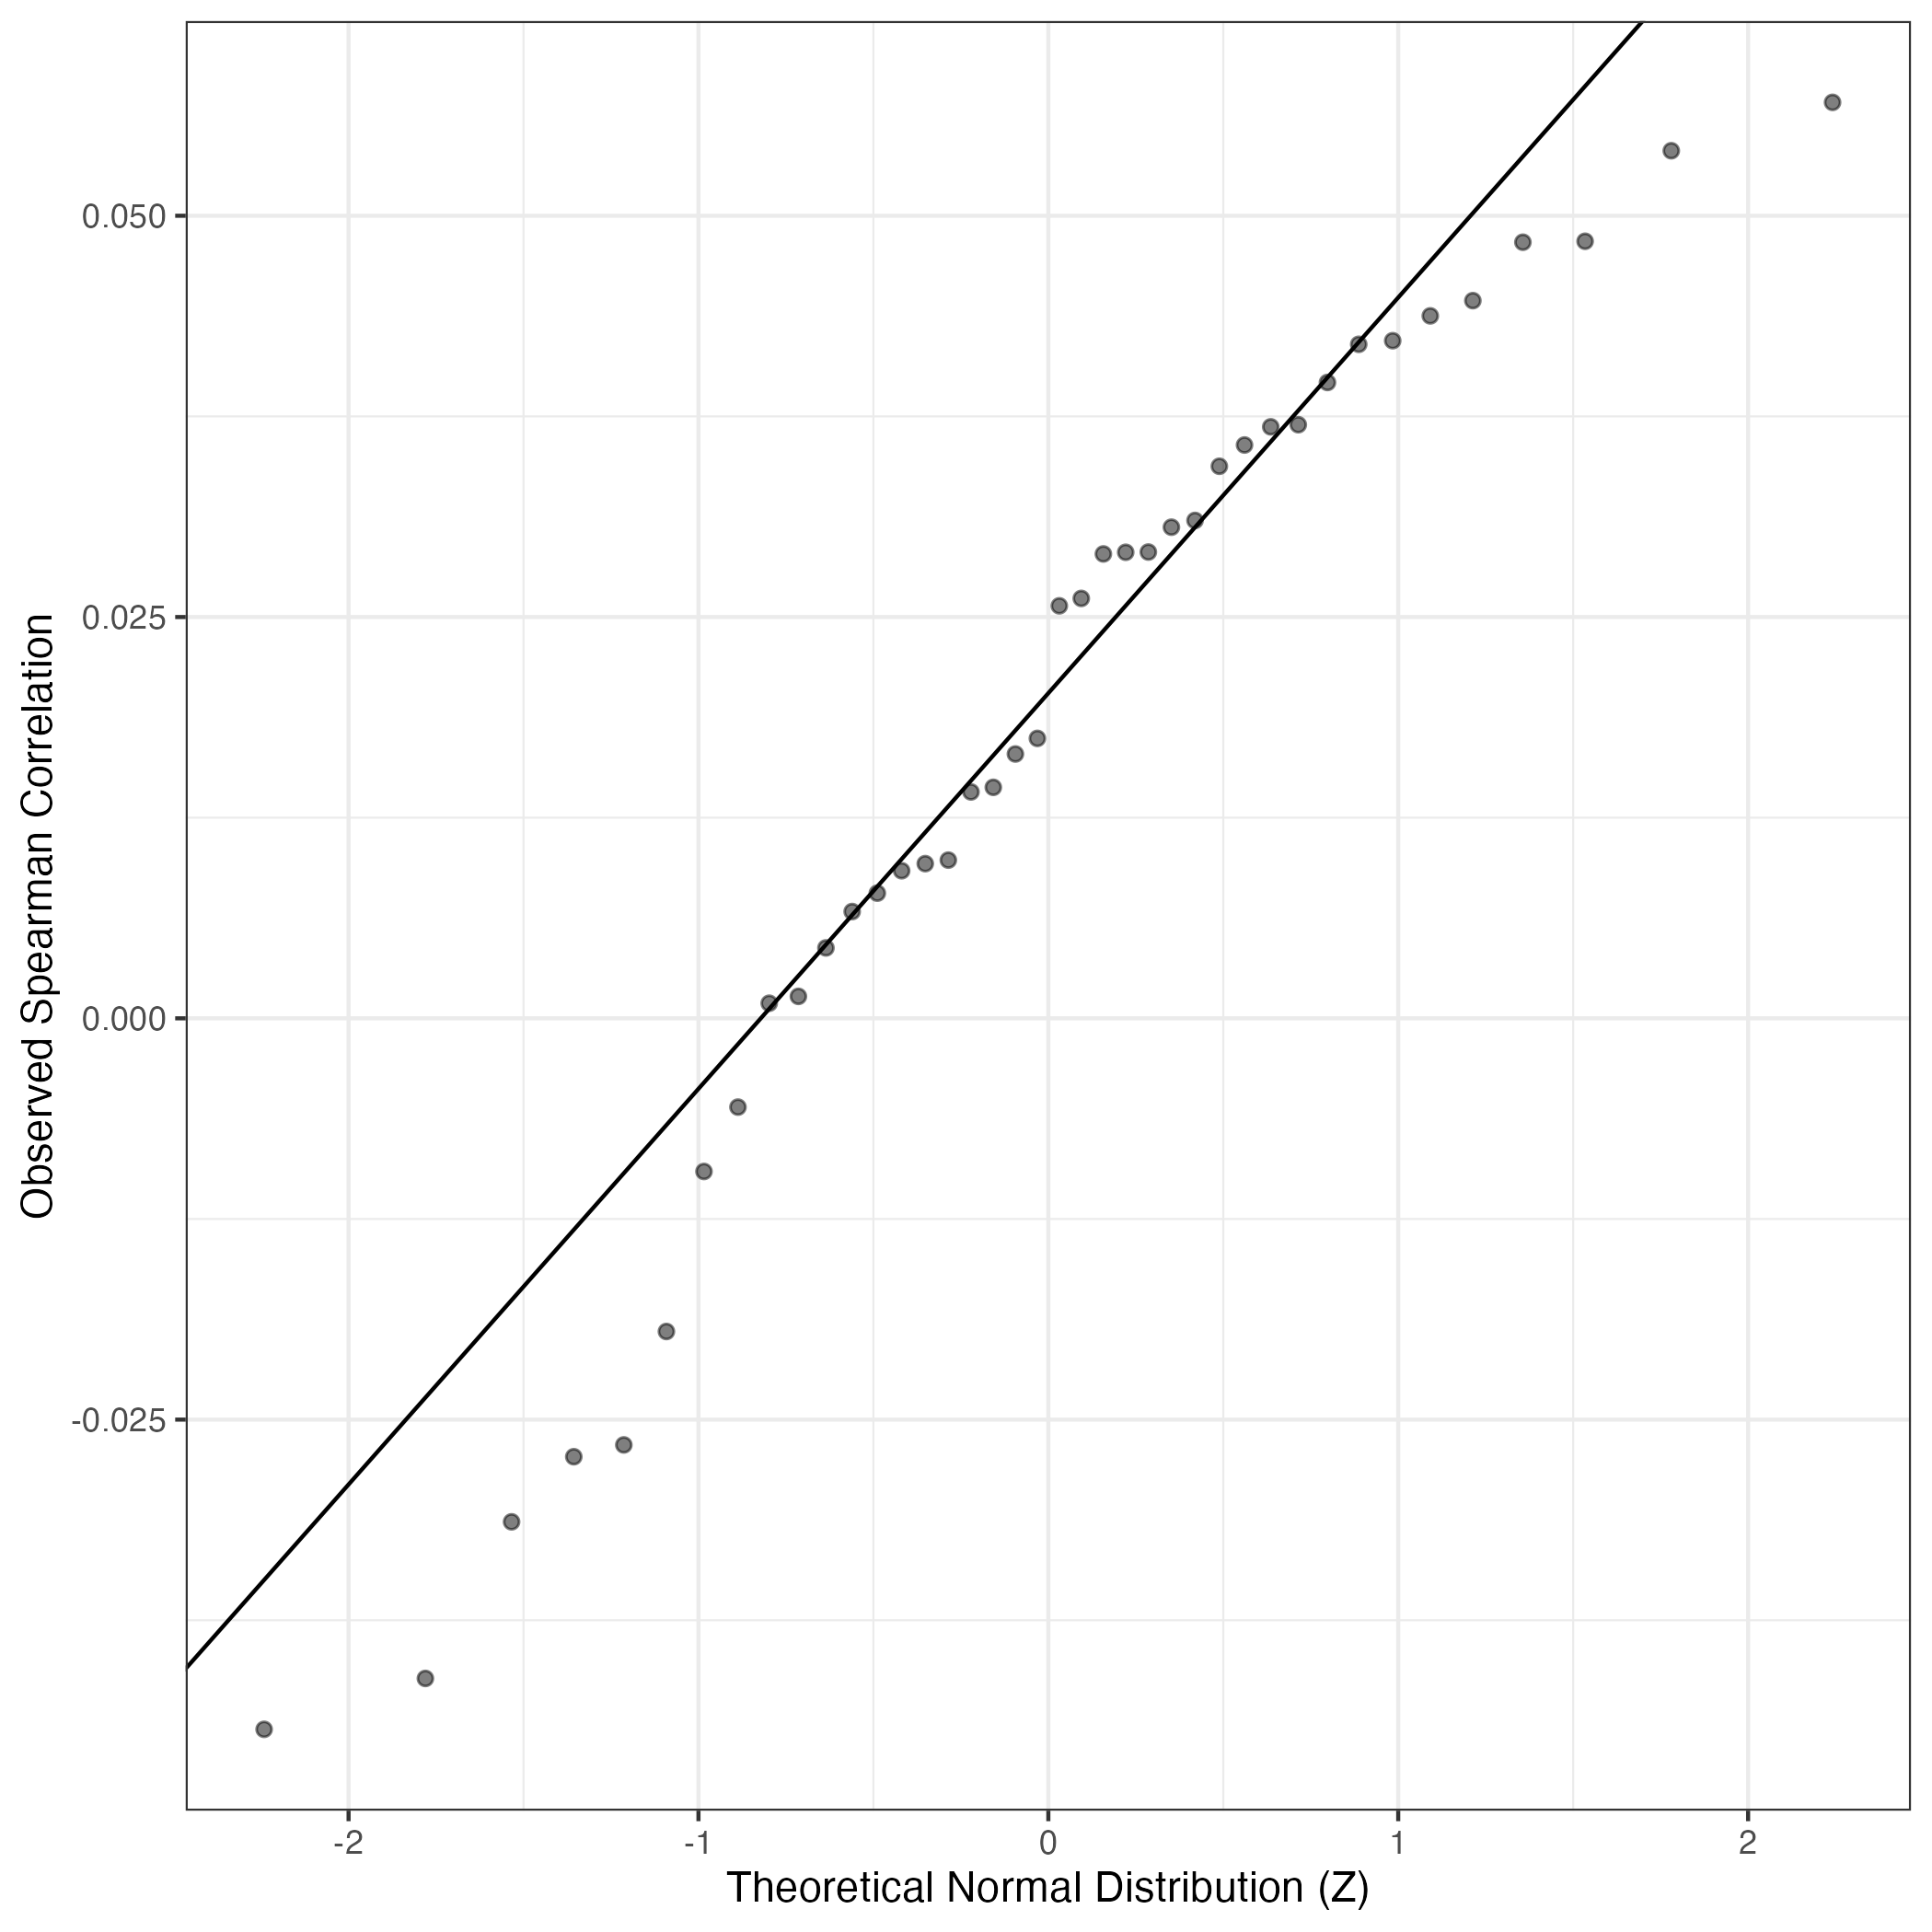
QQ Plot showing correlations with other GEPs in this dataset, calculated by Spearman correlation:
Interactive QQ-plot of gene loadings:
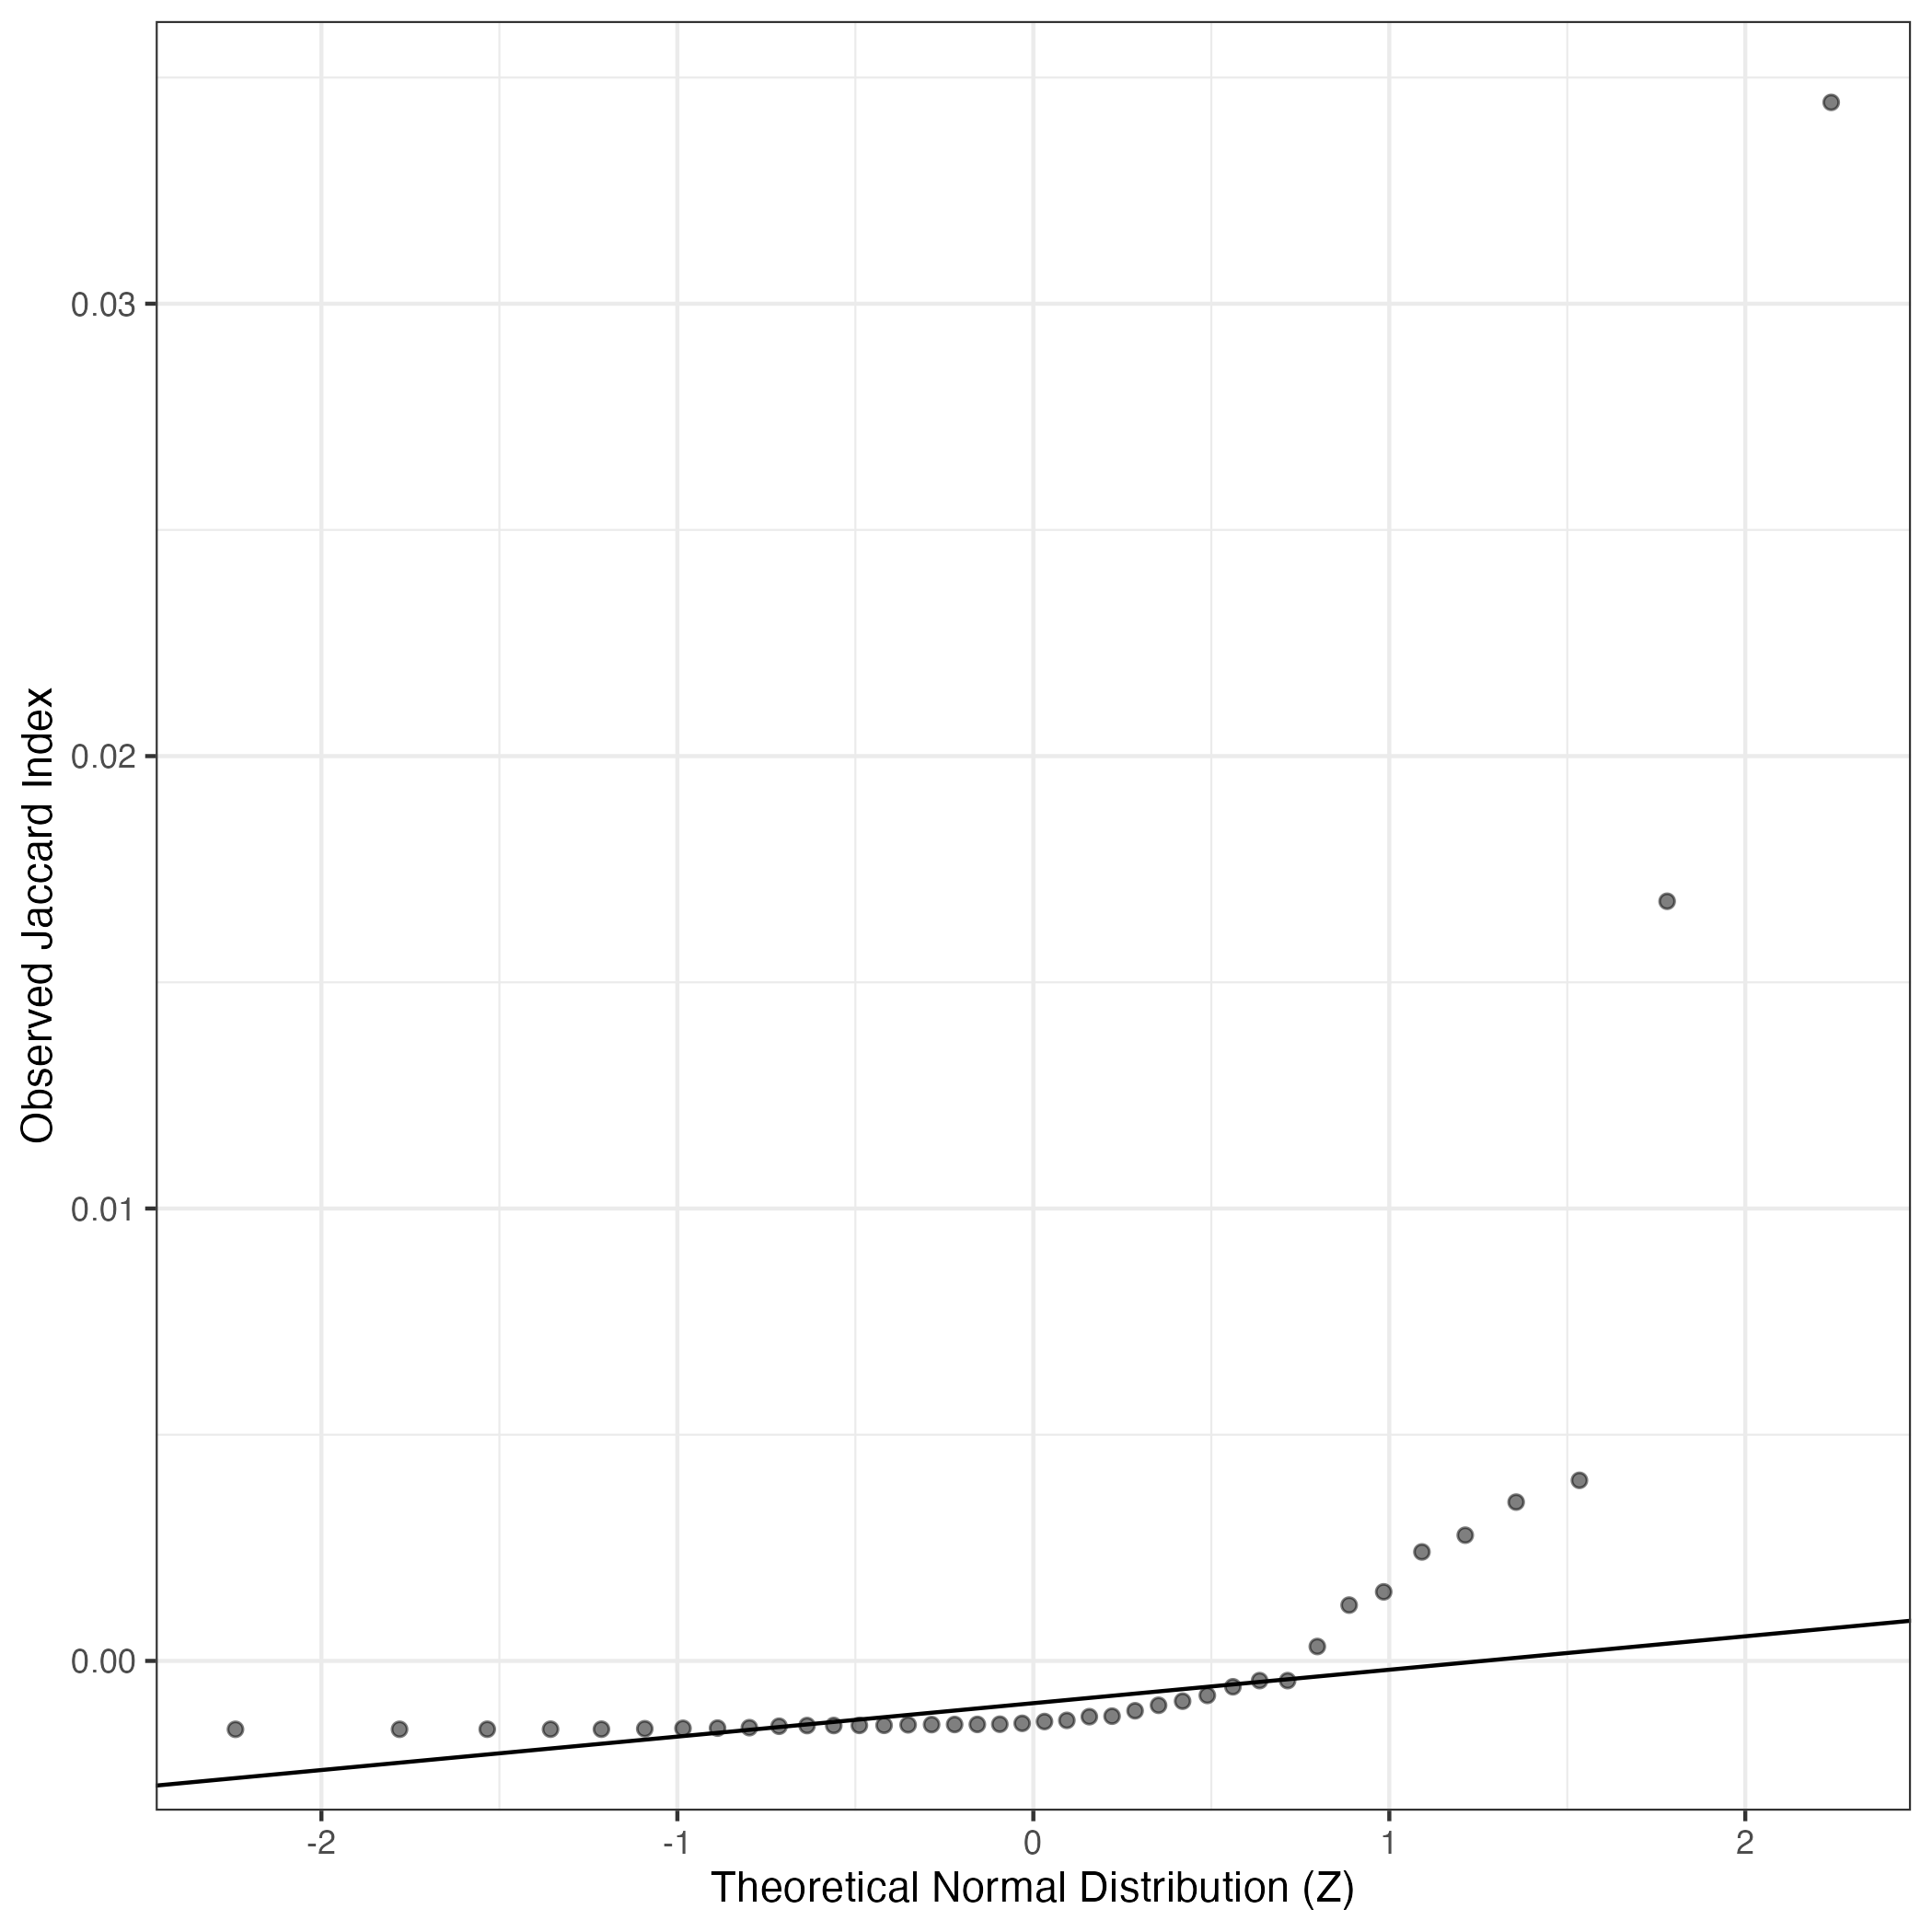
A similar QQ-plot as above, but only for instances where the H value is e.g. > 25, i.e. we are confident that the expression program is active above noise. Agreemenet between these binary vectors is tested using the Jaccard Index, with the P-values calculated by an exact test:
Interactive QQ-plot:
Singler cell type annotations for the top 50 cells on this program.
## Error in 1:nrow(topCellsAnnotMat): argument of length 0
| Cell ID | Singler label | Singler Delta | Activity Score | Top Singler Raw Scores |
|---|---|---|---|---|
| STDY7685342_GCACATATCTCATTCA | Platelets | 0.1 | 1463.49 | Raw Scores |
Below shows the significant enrichments of this GEP for literature curated gene lists
This data was procured from existing single cell RNA-seq maps of neuroblastoma or related relevant data.
High ranks indicate this gene is a driver of this GEP.
These curated gene list are ranked by the P-value (on this GEP) of their constituent genes.
The Mean Count column shows the mean read count in cells scoring highly (H > 50) on this gene expression program.
Immune (Hanemaaijer)
Marker genes obtained from Supplementary Table SD of Hanemaaijer et al (PMID 33500353). The authors generated single-cell RNA-seq data (sort-seq, 2,229 cells total) from mouse adrenal glads at E13.5, E14.5, E17.5, E18.5, P1 and P5. These were marker genes that matched with a similar dataset generated by Furlan et al (PMID 28684471). This particular set of markers are for the broad Immune cluster:
Wilcoxon ranksum test P-value for gene set overrepresentation: 1.31e-02
Mean rank of genes in gene set: 583.5
Rank on gene expression program of genes in gene set:
## Error in data.frame(Genes = geneCardsLinkSmallGsets, Weight = theseGenes, : object 'countHighScoringCells' not found