Program: 4. M2 Macrophage.
Submit a comment on this gene expression program’s interpretation: CLICK
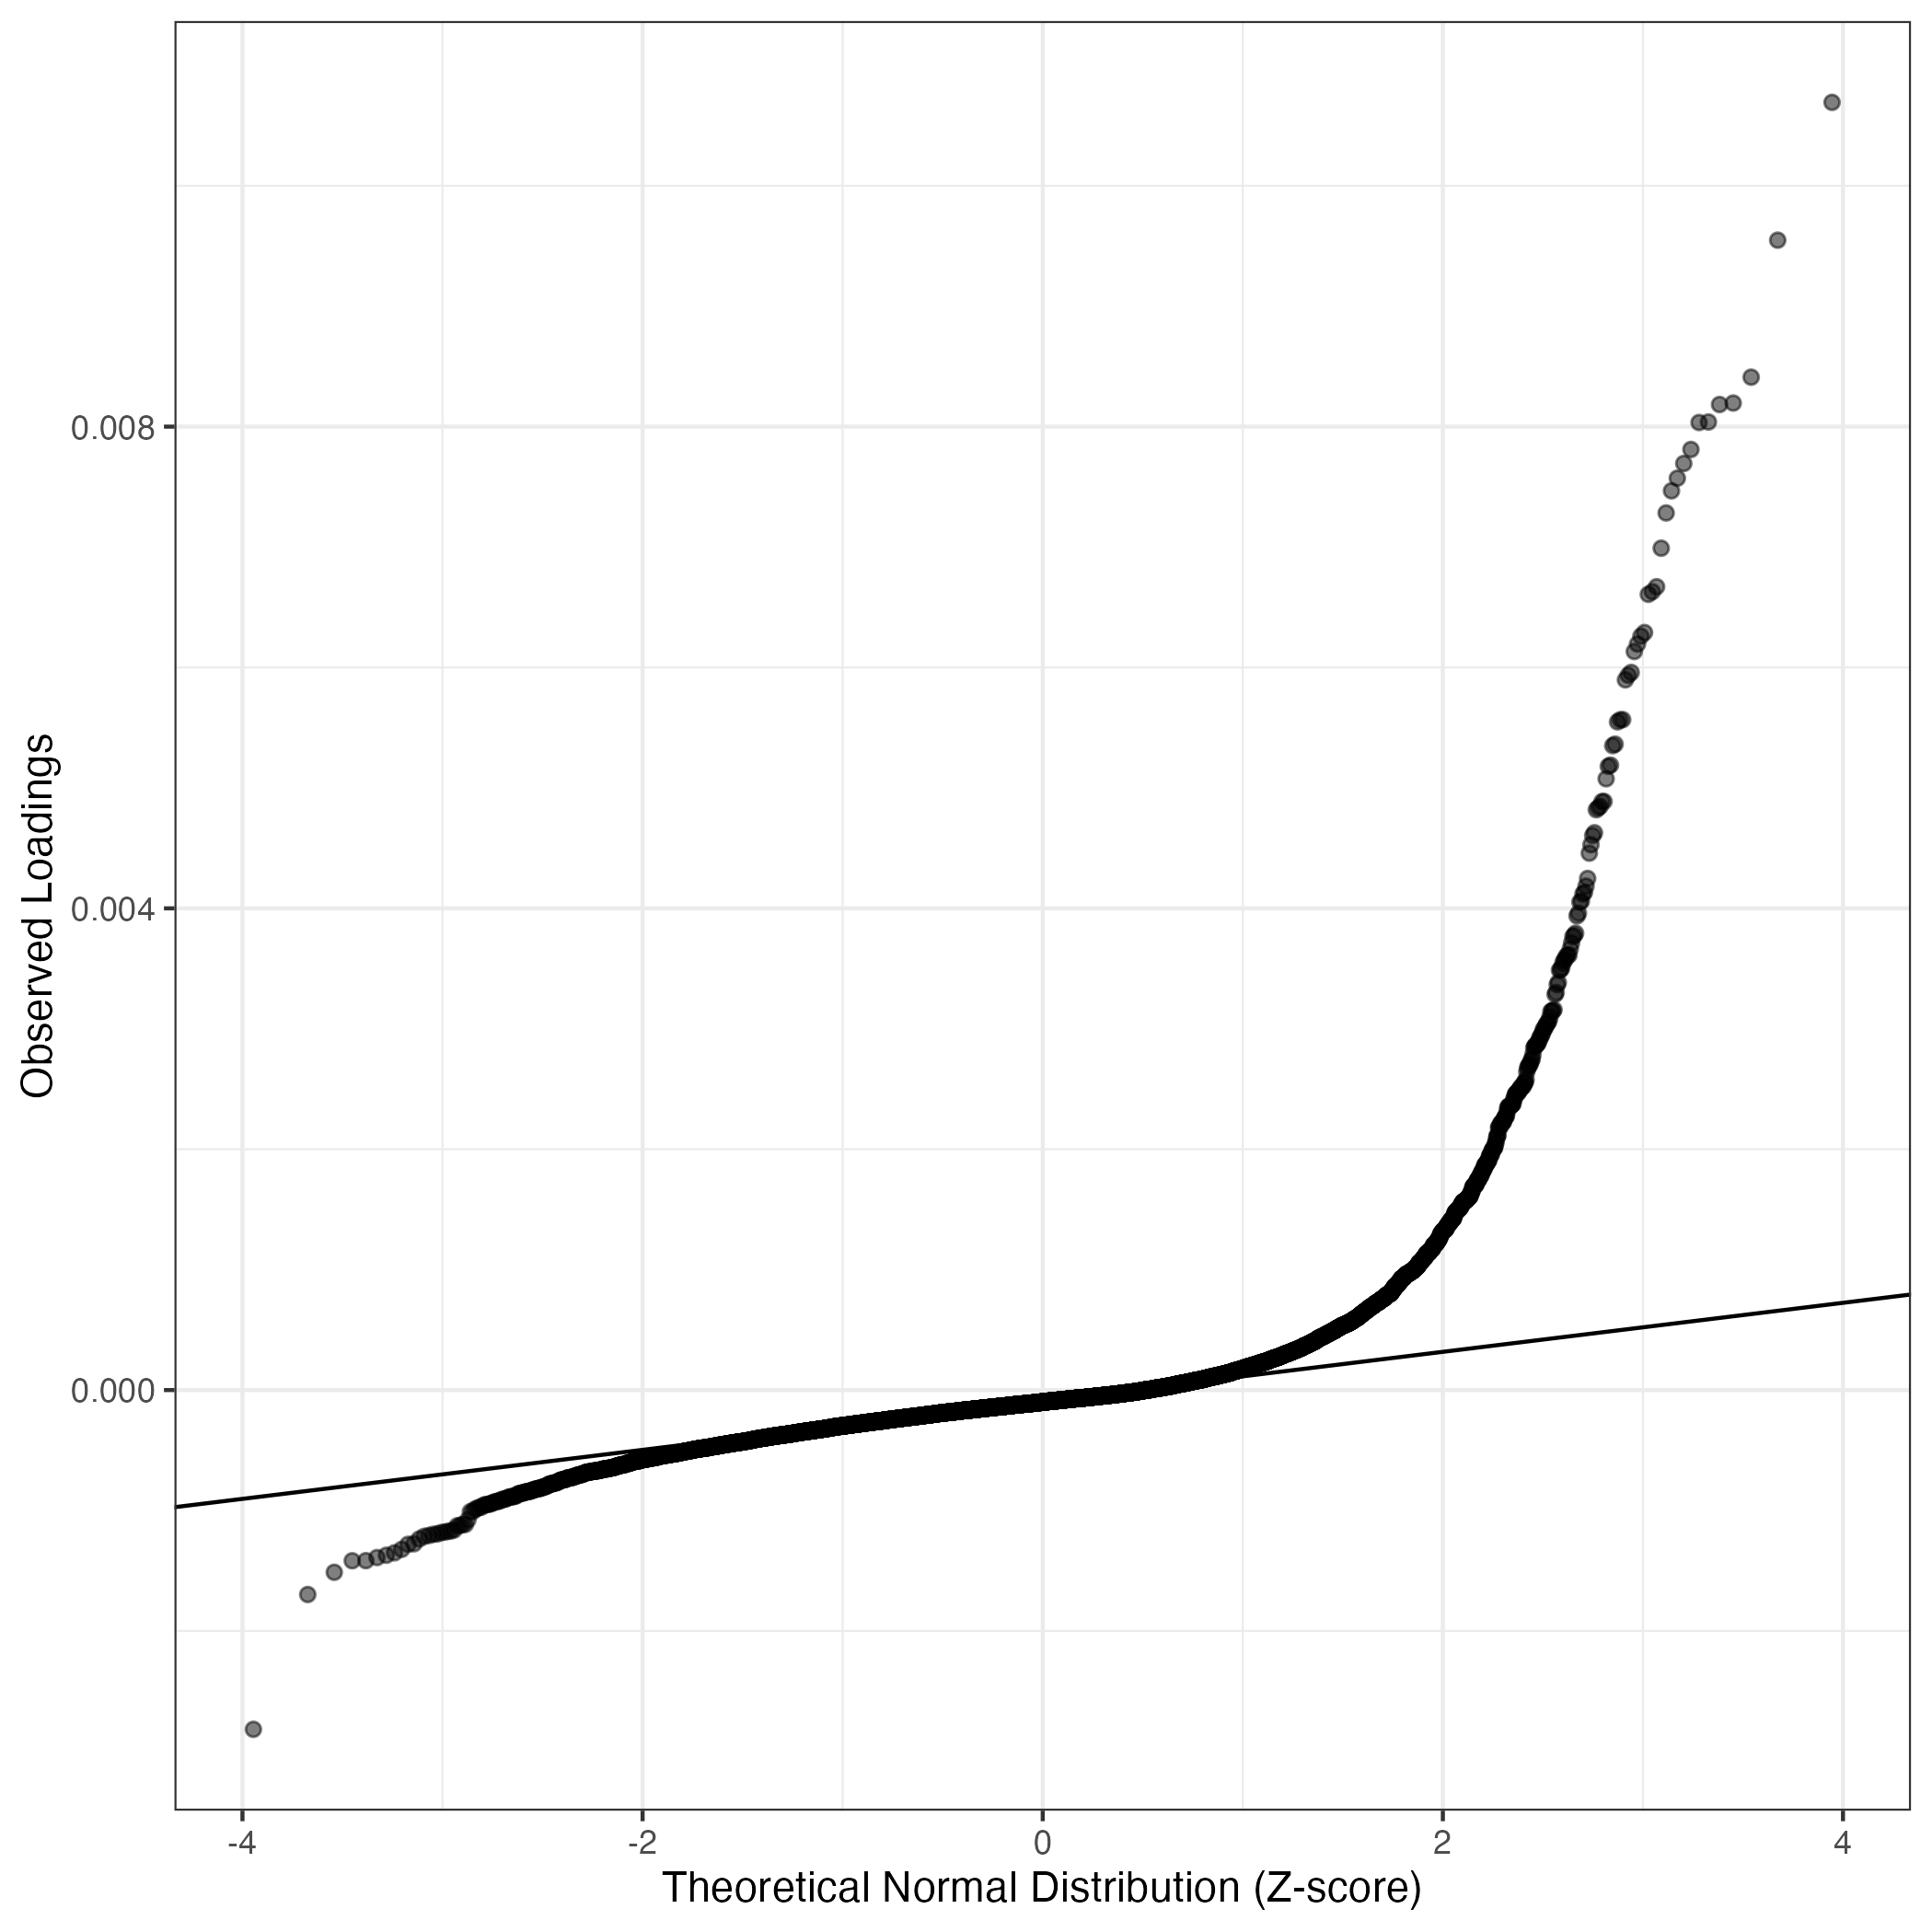
QQ-plot of gene loadings, averaged over both independent splits of the data
This plot highlights the relative contribution of each gene to the GEP
Top genes driving this program. Note: Decartes website is buggy, try refreshing. Also, Decartes fetal adrenal data have been collected at specific time points (89-122 days), all possible cell types of interest may not be represented, do not overinterpret. The Mean Count column shows the mean read count in cells scoring highly (H > 50) on this gene expression program (currently only calculated for the cells in the first 50/50 split of the data).
Note: Decartes website is buggy, try refreshing. Also, Decartes fetal adrenal data have been collected at specific time points (89-122 days), all possible cell types of interest may not be represented, do not overinterpret.
The Mean Count column shows the mean read count in cells scoring highly (H > 50) on this gene expression program.
| Gene | Loading | Gene.Name | GTEx | DepMap | Descartes | Mean.Counts | Mean.Tpm | |
|---|---|---|---|---|---|---|---|---|
| 1 | LIPA | 0.0106928 | lipase A, lysosomal acid type | GTEx | DepMap | Descartes | 7.20 | 701.83 |
| 2 | APOE | 0.0095484 | apolipoprotein E | GTEx | DepMap | Descartes | 34.27 | 7483.78 |
| 3 | LGMN | 0.0084108 | legumain | GTEx | DepMap | Descartes | 7.74 | 951.93 |
| 4 | CTSB | 0.0081959 | cathepsin B | GTEx | DepMap | Descartes | 24.48 | 1833.57 |
| 5 | PSAP | 0.0081839 | prosaposin | GTEx | DepMap | Descartes | 44.86 | 3703.97 |
| 6 | APOC1 | 0.0080386 | apolipoprotein C1 | GTEx | DepMap | Descartes | 8.05 | 2748.16 |
| 7 | CTSD | 0.0080343 | cathepsin D | GTEx | DepMap | Descartes | 19.69 | 2418.32 |
| 8 | GPNMB | 0.0078106 | glycoprotein nmb | GTEx | DepMap | Descartes | 11.84 | 1032.70 |
| 9 | SLC40A1 | 0.0076944 | solute carrier family 40 member 1 | GTEx | DepMap | Descartes | 3.76 | 464.59 |
| 10 | CD68 | 0.0075716 | CD68 molecule | GTEx | DepMap | Descartes | 6.61 | 1049.94 |
| 11 | CD163 | 0.0074670 | CD163 molecule | GTEx | DepMap | Descartes | 4.24 | 245.25 |
| 12 | SLCO2B1 | 0.0072832 | solute carrier organic anion transporter family member 2B1 | GTEx | DepMap | Descartes | 2.32 | 130.09 |
| 13 | CSF1R | 0.0069906 | colony stimulating factor 1 receptor | GTEx | DepMap | Descartes | 3.69 | 298.03 |
| 14 | IGSF6 | 0.0066704 | immunoglobulin superfamily member 6 | GTEx | DepMap | Descartes | 2.55 | 257.16 |
| 15 | MS4A4A | 0.0066294 | membrane spanning 4-domains A4A | GTEx | DepMap | Descartes | 2.58 | 495.21 |
| 16 | ASAH1 | 0.0066077 | N-acylsphingosine amidohydrolase 1 | GTEx | DepMap | Descartes | 6.65 | 302.28 |
| 17 | CD5L | 0.0062905 | CD5 molecule like | GTEx | DepMap | Descartes | 2.20 | 249.66 |
| 18 | CTSS | 0.0062604 | cathepsin S | GTEx | DepMap | Descartes | 9.08 | 567.56 |
| 19 | CD14 | 0.0061947 | CD14 molecule | GTEx | DepMap | Descartes | 4.69 | 1018.07 |
| 20 | GRN | 0.0061328 | granulin precursor | GTEx | DepMap | Descartes | 11.60 | 1336.07 |
| 21 | C2 | 0.0059589 | complement C2 | GTEx | DepMap | Descartes | 1.62 | 167.22 |
| 22 | CPVL | 0.0059359 | carboxypeptidase vitellogenic like | GTEx | DepMap | Descartes | 3.99 | 467.94 |
| 23 | TYROBP | 0.0058975 | transmembrane immune signaling adaptor TYROBP | GTEx | DepMap | Descartes | 14.30 | 6850.13 |
| 24 | PLD3 | 0.0055671 | phospholipase D family member 3 | GTEx | DepMap | Descartes | 4.00 | 557.29 |
| 25 | CD74 | 0.0055652 | CD74 molecule | GTEx | DepMap | Descartes | 174.08 | 14110.95 |
| 26 | CD163L1 | 0.0055483 | CD163 molecule like 1 | GTEx | DepMap | Descartes | 0.66 | 54.05 |
| 27 | MRC1 | 0.0053636 | mannose receptor C-type 1 | GTEx | DepMap | Descartes | 2.31 | 175.36 |
| 28 | NPL | 0.0053510 | N-acetylneuraminate pyruvate lyase | GTEx | DepMap | Descartes | 1.39 | 148.66 |
| 29 | NPC2 | 0.0051896 | NPC intracellular cholesterol transporter 2 | GTEx | DepMap | Descartes | 6.10 | 1166.07 |
| 30 | ADAP2 | 0.0051791 | ArfGAP with dual PH domains 2 | GTEx | DepMap | Descartes | 1.43 | 204.01 |
| 31 | FGL2 | 0.0050760 | fibrinogen like 2 | GTEx | DepMap | Descartes | 6.40 | 400.16 |
| 32 | AIF1 | 0.0048874 | allograft inflammatory factor 1 | GTEx | DepMap | Descartes | 3.18 | 726.55 |
| 33 | FUCA1 | 0.0048867 | alpha-L-fucosidase 1 | GTEx | DepMap | Descartes | 1.27 | 170.55 |
| 34 | CYBB | 0.0048465 | cytochrome b-245 beta chain | GTEx | DepMap | Descartes | 3.33 | 209.94 |
| 35 | ACP5 | 0.0048350 | acid phosphatase 5, tartrate resistant | GTEx | DepMap | Descartes | 1.27 | 147.24 |
| 36 | CTSC | 0.0048188 | cathepsin C | GTEx | DepMap | Descartes | 4.31 | 237.27 |
| 37 | CD4 | 0.0046277 | CD4 molecule | GTEx | DepMap | Descartes | 5.75 | 446.65 |
| 38 | FCGRT | 0.0046043 | Fc gamma receptor and transporter | GTEx | DepMap | Descartes | 4.54 | 549.81 |
| 39 | PLA2G7 | 0.0045287 | phospholipase A2 group VII | GTEx | DepMap | Descartes | 1.55 | 176.12 |
| 40 | TMEM37 | 0.0044583 | transmembrane protein 37 | GTEx | DepMap | Descartes | 0.30 | 53.46 |
| 41 | CD84 | 0.0042484 | CD84 molecule | GTEx | DepMap | Descartes | 3.49 | 133.38 |
| 42 | GM2A | 0.0041844 | GM2 ganglioside activator | GTEx | DepMap | Descartes | 3.20 | 195.03 |
| 43 | MFSD1 | 0.0041332 | major facilitator superfamily domain containing 1 | GTEx | DepMap | Descartes | 2.10 | 252.80 |
| 44 | IL18 | 0.0041192 | interleukin 18 | GTEx | DepMap | Descartes | 1.61 | 240.07 |
| 45 | CREG1 | 0.0040593 | cellular repressor of E1A stimulated genes 1 | GTEx | DepMap | Descartes | 4.39 | 532.32 |
| 46 | MSR1 | 0.0040519 | macrophage scavenger receptor 1 | GTEx | DepMap | Descartes | 2.37 | 226.77 |
| 47 | MERTK | 0.0039596 | MER proto-oncogene, tyrosine kinase | GTEx | DepMap | Descartes | 0.54 | 35.26 |
| 48 | TPP1 | 0.0039374 | tripeptidyl peptidase 1 | GTEx | DepMap | Descartes | 5.63 | 297.03 |
| 49 | LAIR1 | 0.0037938 | leukocyte associated immunoglobulin like receptor 1 | GTEx | DepMap | Descartes | 1.77 | 94.77 |
| 50 | SLAMF8 | 0.0037766 | SLAM family member 8 | GTEx | DepMap | Descartes | 0.46 | 41.77 |
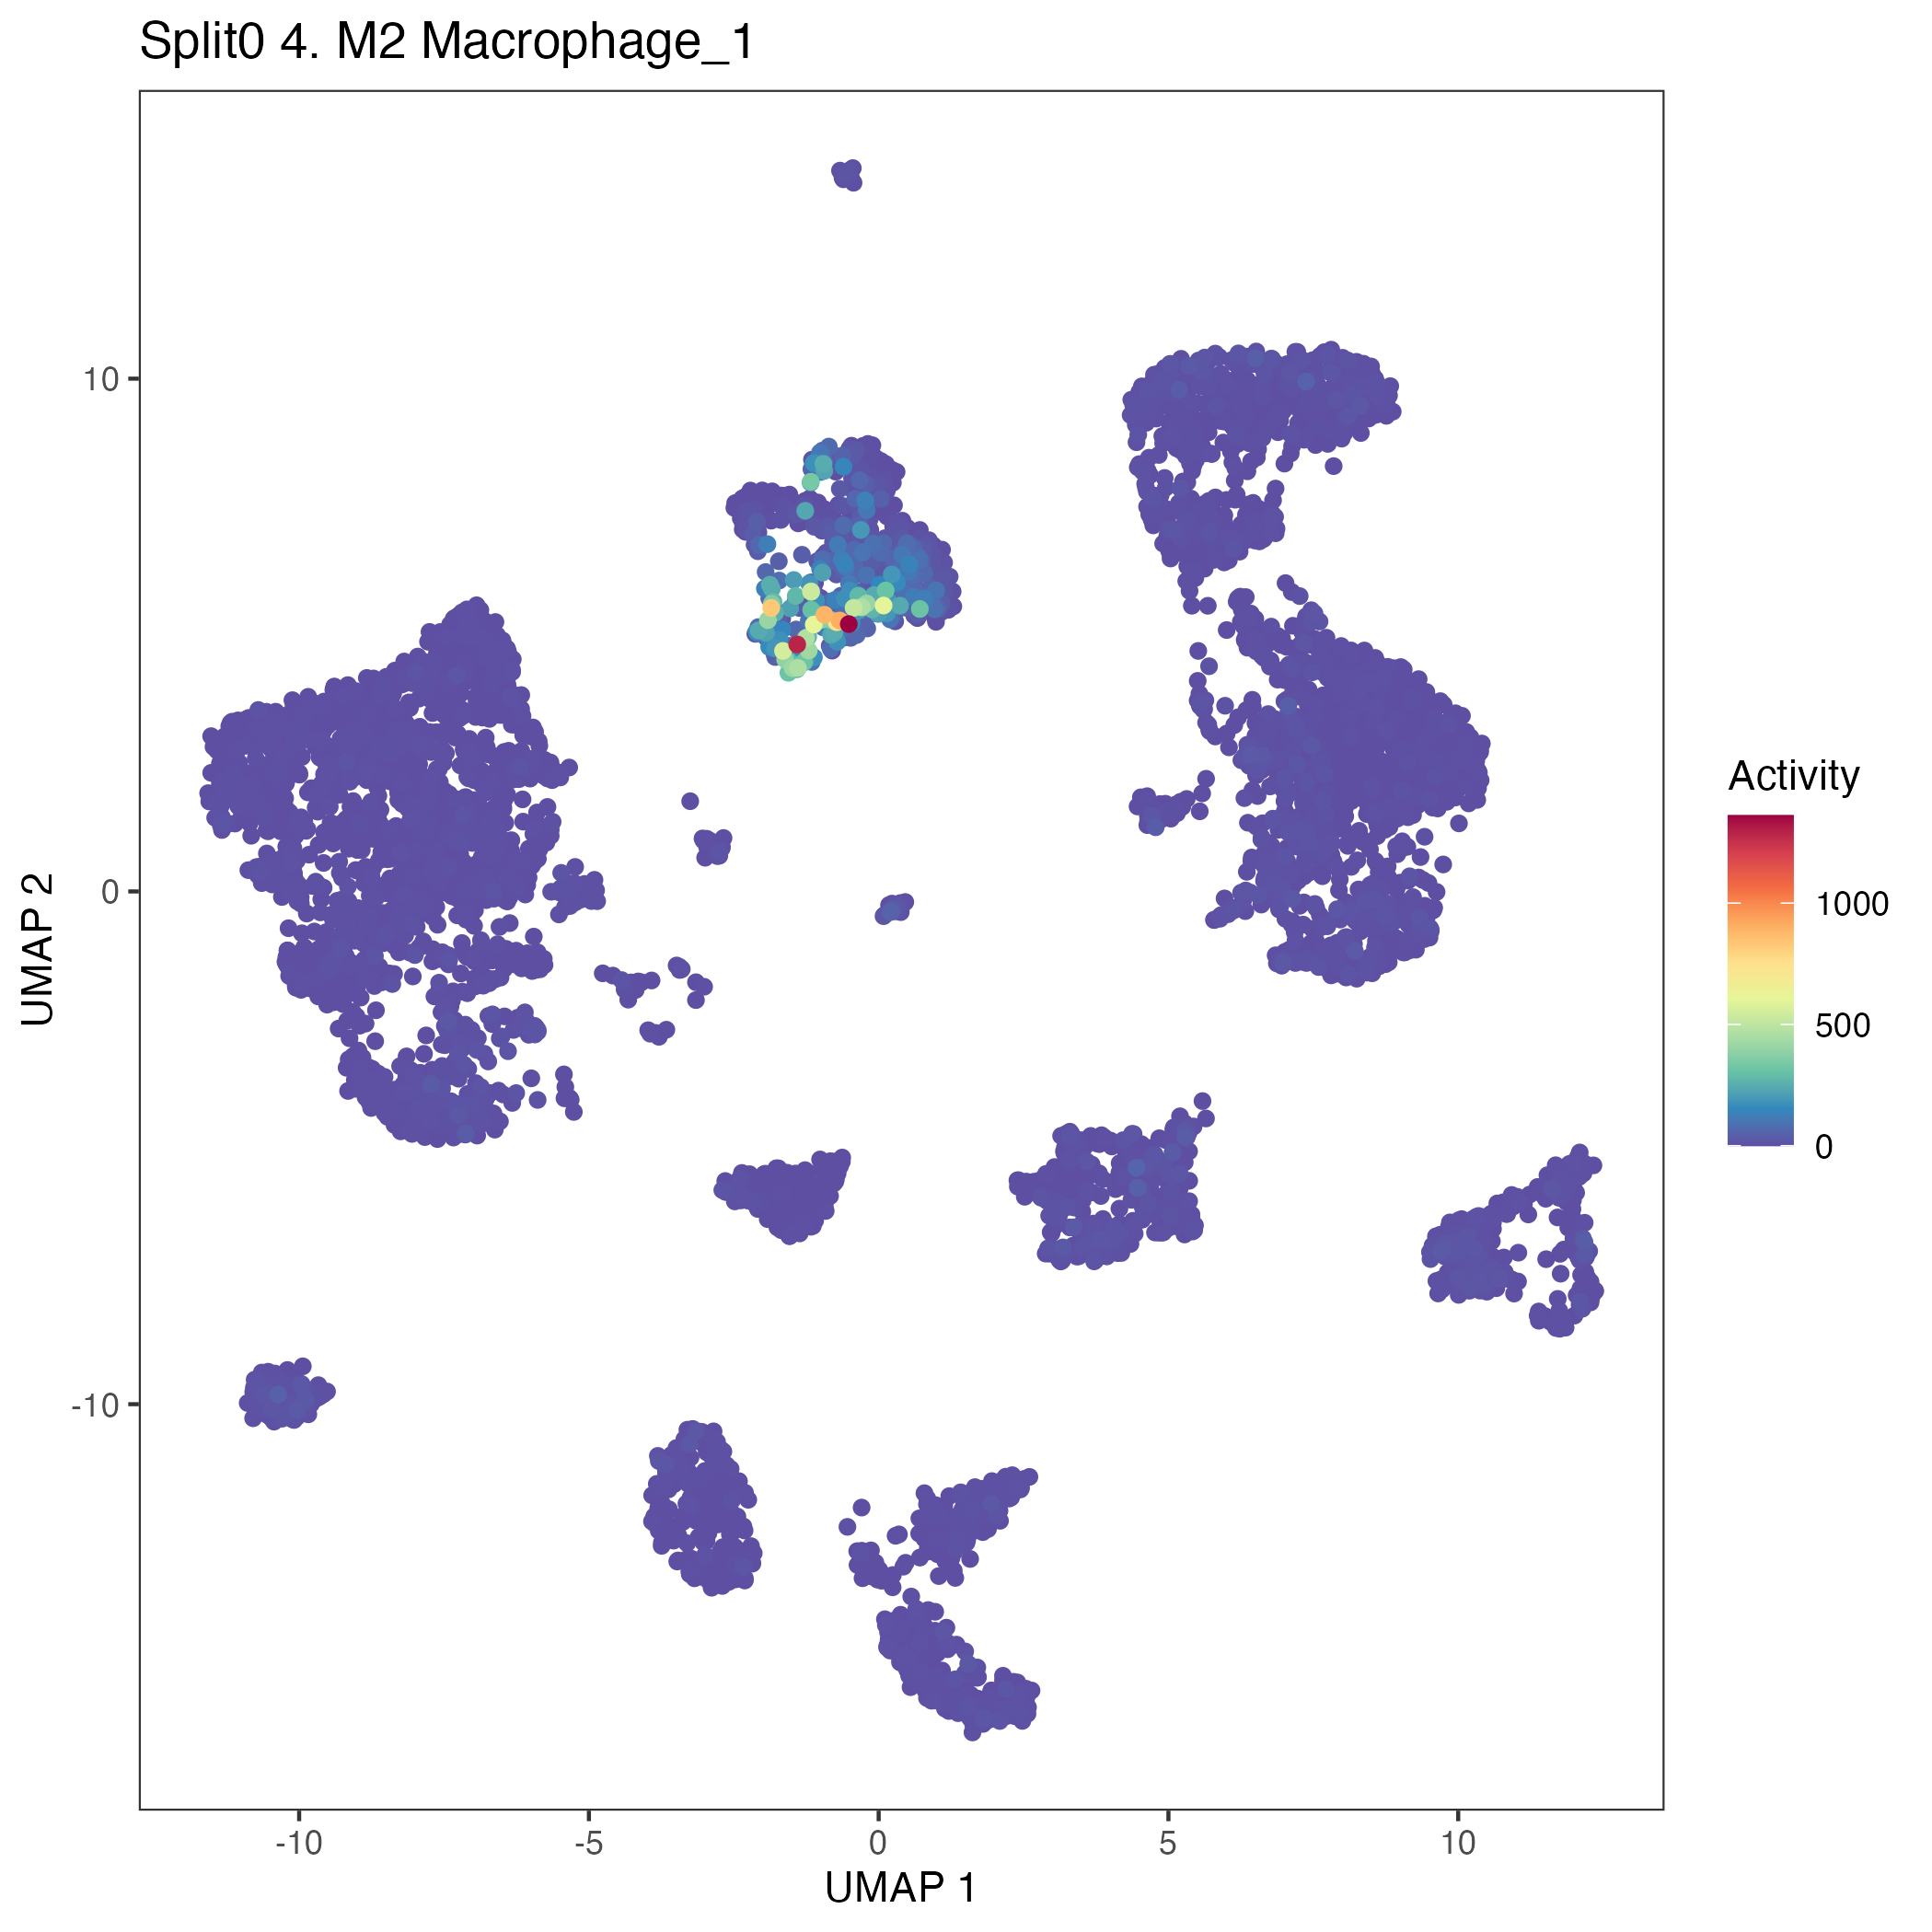
UMAP plots showing activity of gene expression program identified in community:4. M2 Macrophage
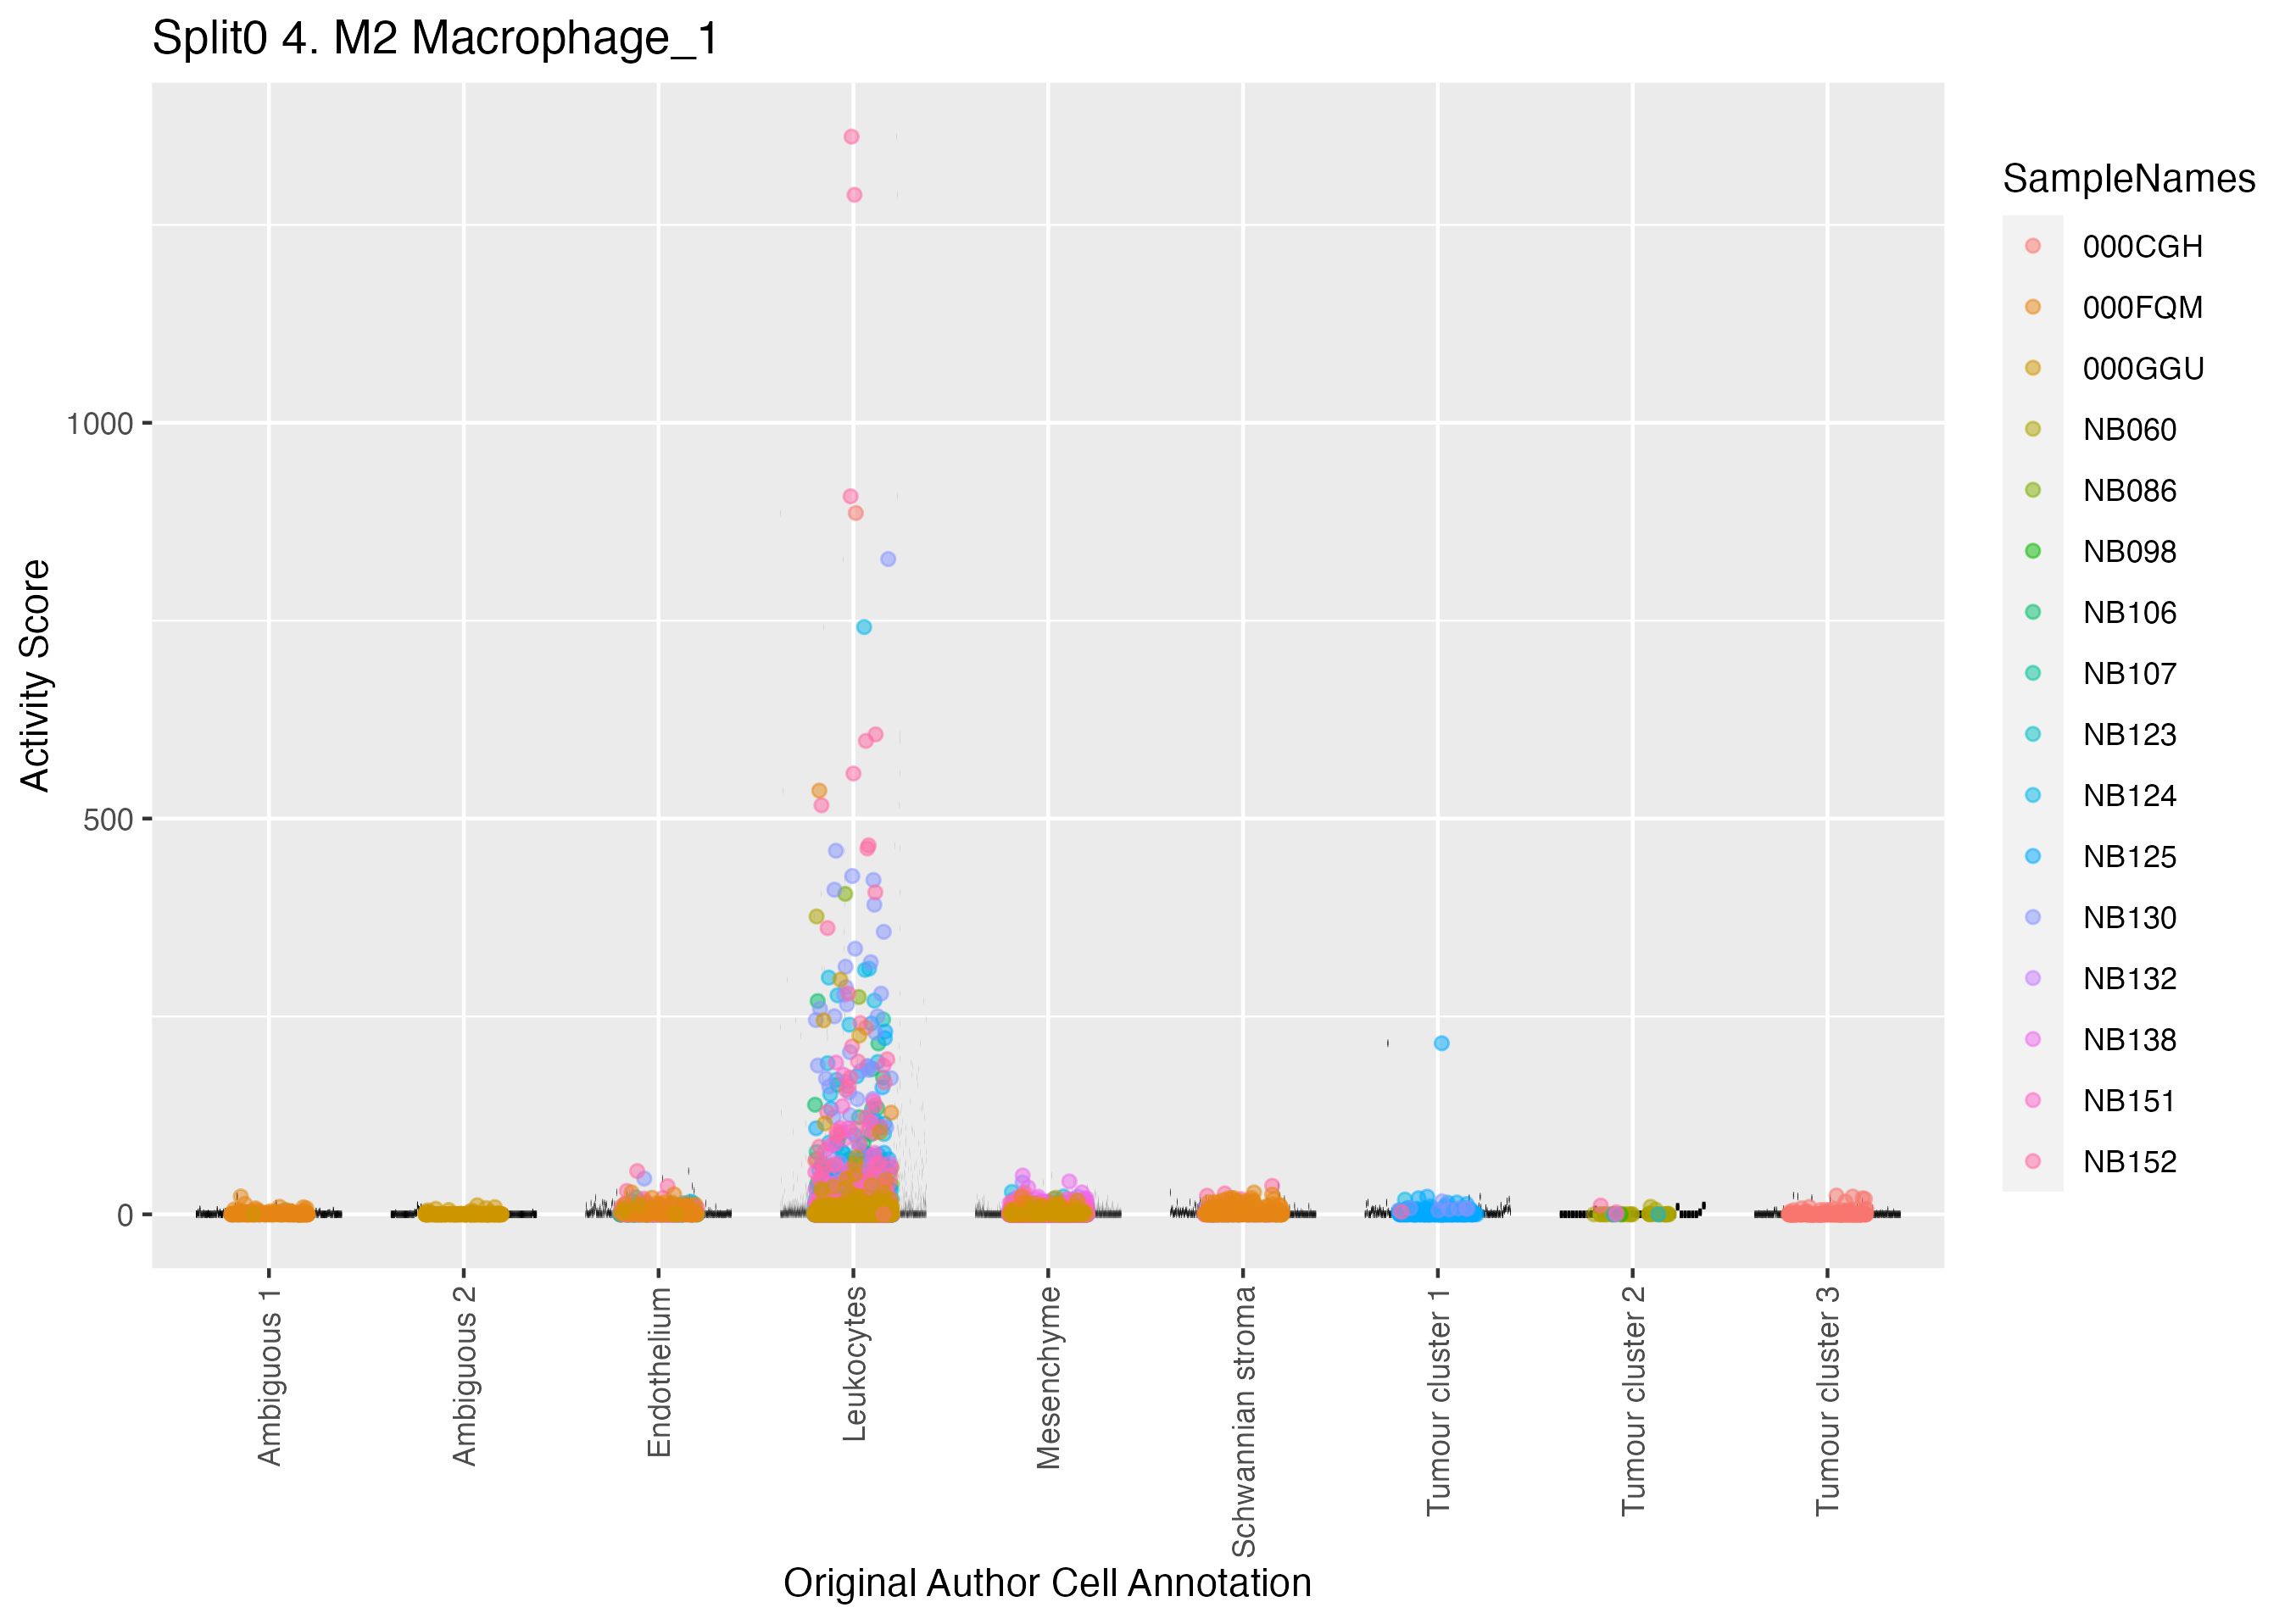
Boxlot showing activity of gene expression program identified in GEP 4. M2 Macrophage:
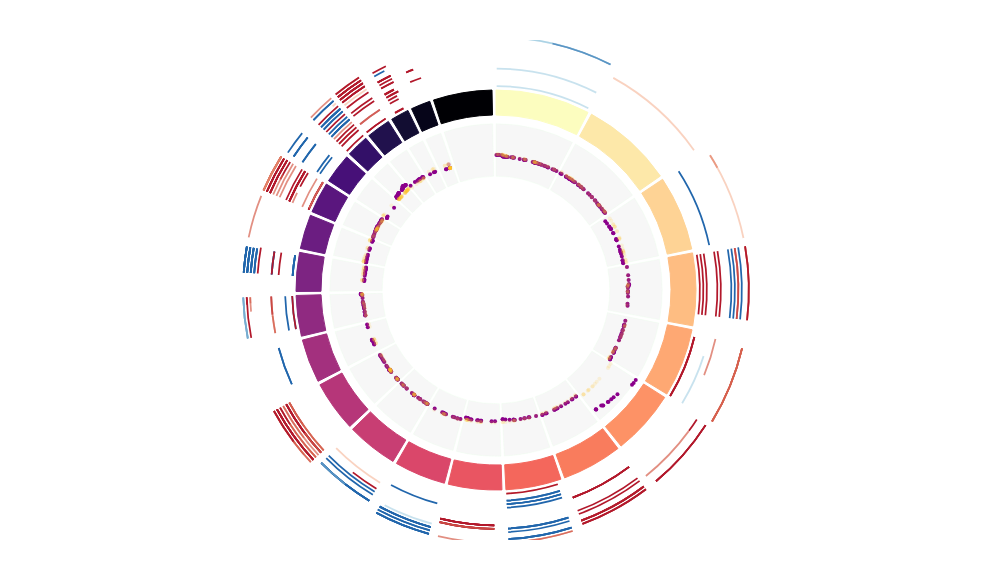
CNV Data procured from inferCNV.
Outer tracks are putative CNV regions (gains = red, losses = blue) for each patient
Inner track is expression data representing:
The top cells expressing this GEP (purple)
Random cells (n =50) from the reference set used in inferCNV (orange)
Gene set Enrichments for this program, caculated from top 50 genes
mSigDB Cell Types Gene Set:
| P-value | OR | Lower 95% CI | FDR | FWER | Genes Found | Gene Set Size | |
|---|---|---|---|---|---|---|---|
| AIZARANI_LIVER_C6_KUPFFER_CELLS_2 | 2.84e-55 | 185.86 | 94.91 | 1.90e-52 | 1.90e-52 | 37LIPA, LGMN, CTSB, PSAP, CTSD, GPNMB, SLC40A1, CD163, SLCO2B1, CSF1R, IGSF6, MS4A4A, ASAH1, CD5L, CTSS, CD14, GRN, CPVL, TYROBP, PLD3, MRC1, NPC2, ADAP2, FGL2, AIF1, CYBB, CTSC, CD4, FCGRT, CD84, MFSD1, IL18, CREG1, MSR1, MERTK, TPP1, LAIR1 |
228 |
| FAN_EMBRYONIC_CTX_MICROGLIA_3 | 1.89e-17 | 246.99 | 85.69 | 6.05e-16 | 1.27e-14 | 9LGMN, CTSB, CTSD, CD68, SLCO2B1, ASAH1, CTSC, CREG1, MERTK |
20 |
| TRAVAGLINI_LUNG_TREM2_DENDRITIC_CELL | 5.00e-52 | 145.49 | 64.43 | 1.68e-49 | 3.36e-49 | 43LIPA, APOE, LGMN, CTSB, PSAP, APOC1, CTSD, GPNMB, SLC40A1, CD68, SLCO2B1, CSF1R, IGSF6, MS4A4A, ASAH1, CTSS, CD14, GRN, C2, CPVL, TYROBP, PLD3, CD74, MRC1, NPL, NPC2, AIF1, FUCA1, CYBB, ACP5, CTSC, CD4, FCGRT, PLA2G7, CD84, GM2A, MFSD1, IL18, CREG1, MSR1, TPP1, LAIR1, SLAMF8 |
572 |
| FAN_EMBRYONIC_CTX_BIG_GROUPS_MICROGLIA | 3.69e-45 | 95.96 | 49.97 | 8.26e-43 | 2.48e-42 | 36LIPA, APOE, LGMN, CTSB, PSAP, APOC1, CTSD, CD68, SLCO2B1, CSF1R, IGSF6, ASAH1, CTSS, CD14, GRN, C2, CPVL, TYROBP, PLD3, CD74, MRC1, NPL, NPC2, ADAP2, AIF1, CYBB, CTSC, CD4, FCGRT, CD84, GM2A, MFSD1, CREG1, MERTK, TPP1, LAIR1 |
371 |
| ZHONG_PFC_MAJOR_TYPES_MICROGLIA | 1.80e-44 | 88.81 | 45.71 | 3.02e-42 | 1.21e-41 | 37LIPA, APOE, LGMN, CTSB, PSAP, APOC1, CTSD, CD68, SLCO2B1, CSF1R, IGSF6, ASAH1, CTSS, CD14, GRN, C2, CPVL, TYROBP, PLD3, CD74, MRC1, NPL, NPC2, ADAP2, AIF1, CYBB, CTSC, CD4, FCGRT, PLA2G7, CD84, GM2A, MFSD1, CREG1, MERTK, TPP1, LAIR1 |
438 |
| CUI_DEVELOPING_HEART_C8_MACROPHAGE | 5.65e-38 | 76.36 | 41.38 | 6.31e-36 | 3.79e-35 | 30LGMN, CTSB, PSAP, CTSD, CD68, CD163, SLCO2B1, CSF1R, IGSF6, MS4A4A, CTSS, CD14, GRN, CPVL, TYROBP, CD74, MRC1, NPC2, ADAP2, FGL2, AIF1, CYBB, CTSC, CD4, FCGRT, MFSD1, CREG1, MSR1, TPP1, LAIR1 |
275 |
| DURANTE_ADULT_OLFACTORY_NEUROEPITHELIUM_MACROPHAGES | 6.13e-22 | 81.04 | 39.11 | 2.74e-20 | 4.11e-19 | 15APOE, APOC1, SLC40A1, CD68, CSF1R, IGSF6, CTSS, CD14, GRN, TYROBP, CD74, NPC2, FGL2, AIF1, MSR1 |
81 |
| GAO_LARGE_INTESTINE_24W_C11_PANETH_LIKE_CELL | 1.38e-37 | 69.39 | 37.52 | 1.32e-35 | 9.24e-35 | 31LIPA, LGMN, CD68, CD163, SLCO2B1, CSF1R, IGSF6, MS4A4A, CD14, C2, CPVL, TYROBP, CD74, CD163L1, MRC1, NPL, ADAP2, FGL2, AIF1, CYBB, ACP5, CTSC, CD4, PLA2G7, CD84, GM2A, MFSD1, CREG1, MERTK, TPP1, SLAMF8 |
325 |
| MANNO_MIDBRAIN_NEUROTYPES_HMGL | 6.15e-42 | 73.48 | 37.39 | 8.25e-40 | 4.12e-39 | 38LIPA, APOE, LGMN, CTSB, APOC1, CTSD, GPNMB, CD68, CD163, SLCO2B1, CSF1R, IGSF6, MS4A4A, ASAH1, CD5L, CTSS, CD14, GRN, CPVL, TYROBP, CD74, MRC1, NPL, NPC2, ADAP2, FGL2, CYBB, CTSC, CD4, FCGRT, CD84, GM2A, MFSD1, IL18, CREG1, MERTK, TPP1, LAIR1 |
577 |
| AIZARANI_LIVER_C2_KUPFFER_CELLS_1 | 3.75e-27 | 55.14 | 29.44 | 2.51e-25 | 2.51e-24 | 22LIPA, CTSB, PSAP, CD163, SLCO2B1, CSF1R, IGSF6, MS4A4A, CTSS, GRN, CPVL, TYROBP, MRC1, NPC2, FGL2, AIF1, CYBB, CD84, MFSD1, IL18, MSR1, TPP1 |
200 |
| TRAVAGLINI_LUNG_MACROPHAGE_CELL | 4.19e-27 | 54.83 | 29.28 | 2.56e-25 | 2.81e-24 | 22APOE, CTSB, PSAP, APOC1, CTSD, GPNMB, CD163, SLCO2B1, IGSF6, MS4A4A, ASAH1, CTSS, GRN, TYROBP, CD74, MRC1, NPC2, CYBB, ACP5, CTSC, FCGRT, MSR1 |
201 |
| HU_FETAL_RETINA_MICROGLIA | 5.84e-32 | 48.92 | 26.66 | 4.90e-30 | 3.92e-29 | 29LIPA, LGMN, CTSB, PSAP, CTSD, SLCO2B1, CSF1R, IGSF6, CTSS, CD14, GRN, CPVL, TYROBP, CD74, NPL, NPC2, ADAP2, FGL2, AIF1, CYBB, CTSC, CD4, FCGRT, CD84, GM2A, MFSD1, CREG1, MERTK, LAIR1 |
382 |
| DESCARTES_FETAL_LIVER_MYELOID_CELLS | 5.09e-25 | 48.13 | 25.58 | 2.85e-23 | 3.42e-22 | 21LIPA, LGMN, CTSB, CD68, CD163, CSF1R, IGSF6, MS4A4A, CD5L, CTSS, CPVL, TYROBP, CD163L1, ADAP2, FGL2, FUCA1, CYBB, PLA2G7, CREG1, MSR1, MERTK |
209 |
| DESCARTES_FETAL_STOMACH_MYELOID_CELLS | 5.49e-15 | 54.12 | 23.93 | 1.47e-13 | 3.68e-12 | 11IGSF6, CD14, CPVL, TYROBP, CD74, CD163L1, ADAP2, CYBB, CD4, CD84, MERTK |
76 |
| DESCARTES_FETAL_ADRENAL_MYELOID_CELLS | 3.55e-21 | 42.59 | 22.03 | 1.49e-19 | 2.38e-18 | 18LGMN, CD68, CD163, SLCO2B1, CSF1R, IGSF6, MS4A4A, CD5L, CD14, CPVL, CD163L1, ADAP2, CYBB, CD4, PLA2G7, MSR1, MERTK, SLAMF8 |
183 |
| DESCARTES_FETAL_MUSCLE_MYELOID_CELLS | 4.76e-17 | 41.82 | 20.29 | 1.45e-15 | 3.20e-14 | 14CD163, CSF1R, IGSF6, MS4A4A, CTSS, CD14, C2, CD74, CD163L1, ADAP2, AIF1, CYBB, PLA2G7, MERTK |
130 |
| DESCARTES_FETAL_PLACENTA_MYELOID_CELLS | 6.24e-18 | 40.86 | 20.21 | 2.09e-16 | 4.19e-15 | 15LGMN, CD163, IGSF6, CD5L, CD14, CPVL, TYROBP, CD74, CD163L1, ADAP2, FGL2, CYBB, ACP5, LAIR1, SLAMF8 |
146 |
| DESCARTES_FETAL_THYMUS_ANTIGEN_PRESENTING_CELLS | 2.03e-18 | 37.68 | 19.01 | 7.58e-17 | 1.36e-15 | 16LGMN, CD68, IGSF6, CTSS, CD14, CPVL, TYROBP, CD74, CD163L1, ADAP2, FGL2, FUCA1, CYBB, CD84, IL18, SLAMF8 |
172 |
| DESCARTES_FETAL_CEREBELLUM_MICROGLIA | 1.27e-28 | 33.43 | 18.17 | 9.47e-27 | 8.52e-26 | 31APOE, LGMN, CTSB, APOC1, GPNMB, CD68, CD163, CSF1R, IGSF6, MS4A4A, CD5L, CTSS, CD14, C2, CPVL, TYROBP, CD74, NPL, ADAP2, AIF1, CYBB, CTSC, CD4, PLA2G7, CD84, GM2A, MFSD1, IL18, CREG1, MERTK, LAIR1 |
642 |
| DESCARTES_FETAL_HEART_MYELOID_CELLS | 2.88e-15 | 36.26 | 17.24 | 8.04e-14 | 1.93e-12 | 13LGMN, CD163, SLCO2B1, CSF1R, IGSF6, MS4A4A, CD14, TYROBP, CD74, CD163L1, CYBB, PLA2G7, SLAMF8 |
134 |
Dowload full table
mSigDB Hallmark Gene Sets:
| P-value | OR | Lower 95% CI | FDR | FWER | Genes Found | Gene Set Size | |
|---|---|---|---|---|---|---|---|
| HALLMARK_COMPLEMENT | 6.91e-08 | 14.37 | 6.05 | 3.45e-06 | 3.45e-06 | 9LIPA, LGMN, CTSB, APOC1, CTSD, CTSS, C2, CTSC, PLA2G7 |
200 |
| HALLMARK_ALLOGRAFT_REJECTION | 1.24e-04 | 8.78 | 3.02 | 3.09e-03 | 6.18e-03 | 6IGSF6, CTSS, C2, CD74, CD4, IL18 |
200 |
| HALLMARK_COAGULATION | 2.09e-03 | 8.11 | 2.09 | 3.49e-02 | 1.05e-01 | 4LGMN, CTSB, APOC1, C2 |
138 |
| HALLMARK_INFLAMMATORY_RESPONSE | 7.71e-03 | 5.55 | 1.44 | 9.64e-02 | 3.85e-01 | 4CD14, CYBB, IL18, MSR1 |
200 |
| HALLMARK_MTORC1_SIGNALING | 4.35e-02 | 4.05 | 0.80 | 3.11e-01 | 1.00e+00 | 3LGMN, FGL2, CTSC |
200 |
| HALLMARK_P53_PATHWAY | 4.35e-02 | 4.05 | 0.80 | 3.11e-01 | 1.00e+00 | 3CTSD, FUCA1, GM2A |
200 |
| HALLMARK_KRAS_SIGNALING_UP | 4.35e-02 | 4.05 | 0.80 | 3.11e-01 | 1.00e+00 | 3GPNMB, CTSS, FUCA1 |
200 |
| HALLMARK_APOPTOSIS | 1.32e-01 | 3.28 | 0.38 | 8.25e-01 | 1.00e+00 | 2CD14, IL18 |
161 |
| HALLMARK_INTERFERON_GAMMA_RESPONSE | 1.85e-01 | 2.63 | 0.31 | 9.24e-01 | 1.00e+00 | 2CD74, FGL2 |
200 |
| HALLMARK_HEME_METABOLISM | 1.85e-01 | 2.63 | 0.31 | 9.24e-01 | 1.00e+00 | 2CTSB, ACP5 |
200 |
| HALLMARK_CHOLESTEROL_HOMEOSTASIS | 2.55e-01 | 3.49 | 0.09 | 1.00e+00 | 1.00e+00 | 1LGMN |
74 |
| HALLMARK_IL6_JAK_STAT3_SIGNALING | 2.93e-01 | 2.97 | 0.07 | 1.00e+00 | 1.00e+00 | 1CD14 |
87 |
| HALLMARK_PROTEIN_SECRETION | 3.17e-01 | 2.68 | 0.07 | 1.00e+00 | 1.00e+00 | 1CTSC |
96 |
| HALLMARK_INTERFERON_ALPHA_RESPONSE | 3.20e-01 | 2.66 | 0.07 | 1.00e+00 | 1.00e+00 | 1CD74 |
97 |
| HALLMARK_ANDROGEN_RESPONSE | 3.28e-01 | 2.58 | 0.06 | 1.00e+00 | 1.00e+00 | 1MERTK |
100 |
| HALLMARK_UV_RESPONSE_UP | 4.66e-01 | 1.62 | 0.04 | 1.00e+00 | 1.00e+00 | 1CREG1 |
158 |
| HALLMARK_IL2_STAT5_SIGNALING | 5.45e-01 | 1.29 | 0.03 | 1.00e+00 | 1.00e+00 | 1FGL2 |
199 |
| HALLMARK_TNFA_SIGNALING_VIA_NFKB | 5.47e-01 | 1.28 | 0.03 | 1.00e+00 | 1.00e+00 | 1IL18 |
200 |
| HALLMARK_ADIPOGENESIS | 5.47e-01 | 1.28 | 0.03 | 1.00e+00 | 1.00e+00 | 1APOE |
200 |
| HALLMARK_EPITHELIAL_MESENCHYMAL_TRANSITION | 5.47e-01 | 1.28 | 0.03 | 1.00e+00 | 1.00e+00 | 1FUCA1 |
200 |
Dowload full table
KEGG Pathways:
| P-value | OR | Lower 95% CI | FDR | FWER | Genes Found | Gene Set Size | |
|---|---|---|---|---|---|---|---|
| KEGG_LYSOSOME | 1.71e-17 | 45.36 | 21.95 | 3.17e-15 | 3.17e-15 | 14LIPA, LGMN, CTSB, PSAP, CTSD, CD68, ASAH1, CTSS, NPC2, FUCA1, ACP5, CTSC, GM2A, TPP1 |
121 |
| KEGG_ANTIGEN_PROCESSING_AND_PRESENTATION | 2.42e-05 | 16.72 | 5.05 | 2.25e-03 | 4.50e-03 | 5LGMN, CTSB, CTSS, CD74, CD4 |
88 |
| KEGG_HEMATOPOIETIC_CELL_LINEAGE | 4.89e-03 | 9.50 | 1.85 | 3.03e-01 | 9.10e-01 | 3CSF1R, CD14, CD4 |
87 |
| KEGG_OTHER_GLYCAN_DEGRADATION | 6.18e-02 | 16.98 | 0.40 | 1.00e+00 | 1.00e+00 | 1FUCA1 |
16 |
| KEGG_RIBOFLAVIN_METABOLISM | 6.18e-02 | 16.98 | 0.40 | 1.00e+00 | 1.00e+00 | 1ACP5 |
16 |
| KEGG_STEROID_BIOSYNTHESIS | 6.56e-02 | 15.93 | 0.37 | 1.00e+00 | 1.00e+00 | 1LIPA |
17 |
| KEGG_CYTOKINE_CYTOKINE_RECEPTOR_INTERACTION | 2.77e-01 | 1.98 | 0.23 | 1.00e+00 | 1.00e+00 | 2CSF1R, IL18 |
265 |
| KEGG_ETHER_LIPID_METABOLISM | 1.23e-01 | 7.97 | 0.19 | 1.00e+00 | 1.00e+00 | 1PLA2G7 |
33 |
| KEGG_PRIMARY_IMMUNODEFICIENCY | 1.30e-01 | 7.50 | 0.18 | 1.00e+00 | 1.00e+00 | 1CD4 |
35 |
| KEGG_SPHINGOLIPID_METABOLISM | 1.44e-01 | 6.71 | 0.16 | 1.00e+00 | 1.00e+00 | 1ASAH1 |
39 |
| KEGG_AMINO_SUGAR_AND_NUCLEOTIDE_SUGAR_METABOLISM | 1.61e-01 | 5.93 | 0.14 | 1.00e+00 | 1.00e+00 | 1NPL |
44 |
| KEGG_CYTOSOLIC_DNA_SENSING_PATHWAY | 1.97e-01 | 4.72 | 0.12 | 1.00e+00 | 1.00e+00 | 1IL18 |
55 |
| KEGG_PATHOGENIC_ESCHERICHIA_COLI_INFECTION | 2.00e-01 | 4.64 | 0.11 | 1.00e+00 | 1.00e+00 | 1CD14 |
56 |
| KEGG_NOD_LIKE_RECEPTOR_SIGNALING_PATHWAY | 2.19e-01 | 4.18 | 0.10 | 1.00e+00 | 1.00e+00 | 1IL18 |
62 |
| KEGG_COMPLEMENT_AND_COAGULATION_CASCADES | 2.40e-01 | 3.75 | 0.09 | 1.00e+00 | 1.00e+00 | 1C2 |
69 |
| KEGG_TOLL_LIKE_RECEPTOR_SIGNALING_PATHWAY | 3.33e-01 | 2.53 | 0.06 | 1.00e+00 | 1.00e+00 | 1CD14 |
102 |
| KEGG_T_CELL_RECEPTOR_SIGNALING_PATHWAY | 3.49e-01 | 2.38 | 0.06 | 1.00e+00 | 1.00e+00 | 1CD4 |
108 |
| KEGG_LEUKOCYTE_TRANSENDOTHELIAL_MIGRATION | 3.69e-01 | 2.22 | 0.05 | 1.00e+00 | 1.00e+00 | 1CYBB |
116 |
| KEGG_CELL_ADHESION_MOLECULES_CAMS | 4.10e-01 | 1.93 | 0.05 | 1.00e+00 | 1.00e+00 | 1CD4 |
133 |
| KEGG_NATURAL_KILLER_CELL_MEDIATED_CYTOTOXICITY | 4.20e-01 | 1.88 | 0.05 | 1.00e+00 | 1.00e+00 | 1TYROBP |
137 |
Dowload full table
CHR Positional Gene Sets:
| P-value | OR | Lower 95% CI | FDR | FWER | Genes Found | Gene Set Size | |
|---|---|---|---|---|---|---|---|
| chr8p22 | 1.37e-02 | 12.10 | 1.38 | 1.00e+00 | 1.00e+00 | 2ASAH1, MSR1 |
45 |
| chr1q23 | 5.30e-02 | 3.73 | 0.74 | 1.00e+00 | 1.00e+00 | 3CD5L, CD84, SLAMF8 |
217 |
| chr5q33 | 6.89e-02 | 4.87 | 0.57 | 1.00e+00 | 1.00e+00 | 2CD74, GM2A |
109 |
| chr19q13 | 3.15e-01 | 1.47 | 0.51 | 1.00e+00 | 1.00e+00 | 6APOE, APOC1, TYROBP, PLD3, FCGRT, LAIR1 |
1165 |
| chr12p13 | 1.39e-01 | 2.42 | 0.48 | 1.00e+00 | 1.00e+00 | 3CD163, CD163L1, CD4 |
333 |
| chr6p21 | 7.00e-01 | 1.12 | 0.13 | 1.00e+00 | 1.00e+00 | 2C2, AIF1 |
467 |
| chr2q13 | 2.09e-01 | 4.40 | 0.11 | 1.00e+00 | 1.00e+00 | 1MERTK |
59 |
| chrXp21 | 2.78e-01 | 3.15 | 0.08 | 1.00e+00 | 1.00e+00 | 1CYBB |
82 |
| chr7p15 | 3.17e-01 | 2.68 | 0.07 | 1.00e+00 | 1.00e+00 | 1GPNMB |
96 |
| chr2q32 | 3.49e-01 | 2.38 | 0.06 | 1.00e+00 | 1.00e+00 | 1SLC40A1 |
108 |
| chr1q24 | 3.87e-01 | 2.09 | 0.05 | 1.00e+00 | 1.00e+00 | 1CREG1 |
123 |
| chr10p12 | 4.15e-01 | 1.90 | 0.05 | 1.00e+00 | 1.00e+00 | 1MRC1 |
135 |
| chr11q14 | 4.29e-01 | 1.82 | 0.04 | 1.00e+00 | 1.00e+00 | 1CTSC |
141 |
| chr3q25 | 4.53e-01 | 1.69 | 0.04 | 1.00e+00 | 1.00e+00 | 1MFSD1 |
152 |
| chr2q14 | 4.57e-01 | 1.67 | 0.04 | 1.00e+00 | 1.00e+00 | 1TMEM37 |
154 |
| chr1q25 | 4.70e-01 | 1.60 | 0.04 | 1.00e+00 | 1.00e+00 | 1NPL |
160 |
| chr17q11 | 4.72e-01 | 1.59 | 0.04 | 1.00e+00 | 1.00e+00 | 1ADAP2 |
161 |
| chr7p14 | 4.76e-01 | 1.57 | 0.04 | 1.00e+00 | 1.00e+00 | 1CPVL |
163 |
| chr16p12 | 4.78e-01 | 1.56 | 0.04 | 1.00e+00 | 1.00e+00 | 1IGSF6 |
164 |
| chr10q23 | 5.29e-01 | 1.35 | 0.03 | 1.00e+00 | 1.00e+00 | 1LIPA |
190 |
Dowload full table
Transcription Factor Targets:
| P-value | OR | Lower 95% CI | FDR | FWER | Genes Found | Gene Set Size | |
|---|---|---|---|---|---|---|---|
| TCANNTGAY_SREBP1_01 | 4.34e-04 | 5.06 | 2.04 | 4.92e-01 | 4.92e-01 | 8PSAP, CTSD, GPNMB, CD5L, CTSS, GRN, C2, TPP1 |
479 |
| ZNF354B_TARGET_GENES | 8.25e-03 | 5.43 | 1.41 | 1.00e+00 | 1.00e+00 | 4CTSD, GRN, MFSD1, TPP1 |
204 |
| GGGNNTTTCC_NFKB_Q6_01 | 1.57e-02 | 6.09 | 1.20 | 1.00e+00 | 1.00e+00 | 3CSF1R, CD74, SLAMF8 |
134 |
| TFEB_TARGET_GENES | 1.42e-02 | 2.56 | 1.18 | 1.00e+00 | 1.00e+00 | 11CTSB, CTSD, CD68, CD5L, GRN, C2, PLD3, ACP5, FCGRT, MFSD1, TPP1 |
1387 |
| PEA3_Q6 | 1.91e-02 | 4.20 | 1.09 | 1.00e+00 | 1.00e+00 | 4CTSS, FUCA1, CD84, IL18 |
263 |
| ZNF768_TARGET_GENES | 2.60e-02 | 2.34 | 1.04 | 1.00e+00 | 1.00e+00 | 10APOE, SLCO2B1, ASAH1, CTSS, GRN, CPVL, TYROBP, CTSC, TMEM37, SLAMF8 |
1346 |
| CBFA2T2_TARGET_GENES | 4.41e-02 | 2.10 | 0.97 | 1.00e+00 | 1.00e+00 | 11CTSB, APOC1, CTSD, GPNMB, SLC40A1, GRN, PLD3, NPL, ACP5, MFSD1, TPP1 |
1694 |
| ZNF410_TARGET_GENES | 2.97e-02 | 2.76 | 0.96 | 1.00e+00 | 1.00e+00 | 6CTSD, SLC40A1, GRN, PLD3, MFSD1, TPP1 |
623 |
| ZNF507_TARGET_GENES | 3.58e-02 | 2.64 | 0.91 | 1.00e+00 | 1.00e+00 | 6CTSD, GPNMB, GRN, PLD3, MFSD1, TPP1 |
653 |
| BACH2_TARGET_GENES | 9.82e-02 | 1.78 | 0.82 | 1.00e+00 | 1.00e+00 | 11PSAP, GPNMB, CD68, SLCO2B1, CSF1R, ASAH1, PLD3, FGL2, TMEM37, CD84, MSR1 |
1998 |
| TBX3_TARGET_GENES | 4.66e-02 | 3.13 | 0.81 | 1.00e+00 | 1.00e+00 | 4CD68, C2, PLD3, TPP1 |
351 |
| ADNP_TARGET_GENES | 5.32e-02 | 5.66 | 0.66 | 1.00e+00 | 1.00e+00 | 2CTSS, FCGRT |
94 |
| LCORL_TARGET_GENES | 9.69e-02 | 2.41 | 0.63 | 1.00e+00 | 1.00e+00 | 4CTSB, SLCO2B1, C2, PLD3 |
455 |
| MAFG_TARGET_GENES | 2.94e-01 | 1.46 | 0.62 | 1.00e+00 | 1.00e+00 | 9PSAP, APOC1, GPNMB, SLCO2B1, PLD3, CD163L1, NPL, FCGRT, TMEM37 |
1893 |
| CREL_01 | 7.87e-02 | 3.14 | 0.62 | 1.00e+00 | 1.00e+00 | 3CSF1R, CD74, SLAMF8 |
257 |
| TERF1_TARGET_GENES | 1.07e-01 | 2.73 | 0.54 | 1.00e+00 | 1.00e+00 | 3CTSS, CD74, TPP1 |
295 |
| IRF9_TARGET_GENES | 5.23e-01 | 1.29 | 0.52 | 1.00e+00 | 1.00e+00 | 8CTSB, SLCO2B1, CSF1R, NPL, NPC2, FUCA1, MFSD1, SLAMF8 |
1857 |
| ZBTB24_TARGET_GENES | 5.01e-01 | 1.28 | 0.49 | 1.00e+00 | 1.00e+00 | 7CTSB, GPNMB, ASAH1, CPVL, ADAP2, GM2A, CREG1 |
1595 |
| ZNF549_TARGET_GENES | 2.87e-01 | 1.84 | 0.48 | 1.00e+00 | 1.00e+00 | 4LIPA, GRN, PLD3, ADAP2 |
594 |
| ZNF213_TARGET_GENES | 2.88e-01 | 1.84 | 0.48 | 1.00e+00 | 1.00e+00 | 4LIPA, GRN, ADAP2, FCGRT |
595 |
Dowload full table
GO Biological Processes:
| P-value | OR | Lower 95% CI | FDR | FWER | Genes Found | Gene Set Size | |
|---|---|---|---|---|---|---|---|
| GOBP_REGULATION_OF_DENDRITIC_CELL_ANTIGEN_PROCESSING_AND_PRESENTATION | 9.58e-06 | 99.16 | 16.45 | 3.98e-03 | 7.17e-02 | 3CD68, CD74, FGL2 |
11 |
| GOBP_NEGATIVE_REGULATION_OF_RESPIRATORY_BURST_INVOLVED_IN_INFLAMMATORY_RESPONSE | 1.54e-04 | 172.68 | 14.09 | 3.04e-02 | 1.00e+00 | 2GRN, SLAMF8 |
5 |
| GOBP_DENDRITIC_CELL_ANTIGEN_PROCESSING_AND_PRESENTATION | 2.61e-05 | 66.24 | 11.62 | 8.87e-03 | 1.95e-01 | 3CD68, CD74, FGL2 |
15 |
| GOBP_REGULATION_OF_MONOCYTE_CHEMOTAXIS | 3.63e-06 | 47.11 | 11.40 | 1.81e-03 | 2.71e-02 | 4LGMN, AIF1, PLA2G7, SLAMF8 |
27 |
| GOBP_RESPIRATORY_BURST_INVOLVED_IN_INFLAMMATORY_RESPONSE | 3.22e-04 | 103.49 | 9.64 | 4.61e-02 | 1.00e+00 | 2GRN, SLAMF8 |
7 |
| GOBP_GLYCOLIPID_TRANSPORT | 3.22e-04 | 103.49 | 9.64 | 4.61e-02 | 1.00e+00 | 2PSAP, NPC2 |
7 |
| GOBP_REGULATION_OF_ANTIGEN_PROCESSING_AND_PRESENTATION | 6.44e-05 | 46.77 | 8.51 | 1.51e-02 | 4.82e-01 | 3CD68, CD74, FGL2 |
20 |
| GOBP_POSITIVE_REGULATION_OF_MONOCYTE_CHEMOTAXIS | 6.44e-05 | 46.77 | 8.51 | 1.51e-02 | 4.82e-01 | 3LGMN, AIF1, PLA2G7 |
20 |
| GOBP_TRIGLYCERIDE_RICH_LIPOPROTEIN_PARTICLE_CLEARANCE | 4.28e-04 | 86.37 | 8.33 | 5.62e-02 | 1.00e+00 | 2APOE, APOC1 |
8 |
| GOBP_MYELOID_LEUKOCYTE_ACTIVATION | 5.74e-15 | 14.20 | 7.65 | 4.30e-11 | 4.30e-11 | 21CTSB, PSAP, CTSD, CD68, ASAH1, CTSS, CD14, GRN, TYROBP, CD74, NPC2, FGL2, AIF1, FUCA1, CYBB, CTSC, CD84, GM2A, IL18, CREG1, LAIR1 |
659 |
| GOBP_NEGATIVE_REGULATION_OF_ANTIGEN_PROCESSING_AND_PRESENTATION | 5.49e-04 | 74.10 | 7.33 | 6.63e-02 | 1.00e+00 | 2CD68, FGL2 |
9 |
| GOBP_POSITIVE_REGULATION_OF_CHOLESTEROL_ESTERIFICATION | 5.49e-04 | 74.10 | 7.33 | 6.63e-02 | 1.00e+00 | 2APOE, APOC1 |
9 |
| GOBP_MYELOID_LEUKOCYTE_MEDIATED_IMMUNITY | 6.46e-13 | 13.23 | 6.94 | 1.21e-09 | 4.83e-09 | 18CTSB, PSAP, CTSD, CD68, ASAH1, CTSS, CD14, GRN, TYROBP, NPC2, FGL2, FUCA1, CYBB, CTSC, CD84, GM2A, CREG1, LAIR1 |
550 |
| GOBP_PLASMA_LIPOPROTEIN_PARTICLE_CLEARANCE | 5.50e-06 | 23.11 | 6.92 | 2.57e-03 | 4.12e-02 | 5LIPA, APOE, APOC1, NPC2, MSR1 |
65 |
| GOBP_VERY_LOW_DENSITY_LIPOPROTEIN_PARTICLE_CLEARANCE | 6.85e-04 | 64.86 | 6.55 | 7.88e-02 | 1.00e+00 | 2APOE, APOC1 |
10 |
| GOBP_CELL_ACTIVATION_INVOLVED_IN_IMMUNE_RESPONSE | 4.01e-13 | 11.88 | 6.36 | 9.99e-10 | 3.00e-09 | 20CTSB, PSAP, CTSD, CD68, ASAH1, CTSS, CD14, GRN, TYROBP, CD74, NPC2, FGL2, FUCA1, CYBB, CTSC, CD84, GM2A, IL18, CREG1, LAIR1 |
722 |
| GOBP_MICROGLIAL_CELL_ACTIVATION | 3.46e-05 | 25.26 | 6.32 | 1.03e-02 | 2.58e-01 | 4GRN, TYROBP, AIF1, CTSC |
47 |
| GOBP_REGULATION_OF_PLASMA_LIPOPROTEIN_PARTICLE_LEVELS | 2.67e-06 | 17.93 | 6.10 | 1.43e-03 | 2.00e-02 | 6LIPA, APOE, APOC1, NPC2, PLA2G7, MSR1 |
101 |
| GOBP_POSITIVE_REGULATION_OF_MONOCYTE_DIFFERENTIATION | 8.35e-04 | 57.69 | 5.91 | 8.42e-02 | 1.00e+00 | 2CD74, CD4 |
11 |
| GOBP_POSITIVE_REGULATION_BY_SYMBIONT_OF_ENTRY_INTO_HOST | 8.35e-04 | 57.69 | 5.91 | 8.42e-02 | 1.00e+00 | 2CD74, CD4 |
11 |
Dowload full table
Immunological Gene Sets:
| P-value | OR | Lower 95% CI | FDR | FWER | Genes Found | Gene Set Size | |
|---|---|---|---|---|---|---|---|
| GSE24634_TREG_VS_TCONV_POST_DAY10_IL4_CONVERSION_DN | 1.99e-25 | 50.47 | 26.84 | 9.70e-22 | 9.70e-22 | 21LIPA, CTSB, PSAP, APOC1, CD163, CSF1R, IGSF6, MS4A4A, CD14, GRN, C2, TYROBP, MRC1, NPC2, FGL2, FUCA1, CTSC, FCGRT, CREG1, MERTK, SLAMF8 |
200 |
| GSE24634_TREG_VS_TCONV_POST_DAY7_IL4_CONVERSION_DN | 3.58e-22 | 42.78 | 22.37 | 7.05e-19 | 1.75e-18 | 19LIPA, CTSB, PSAP, CD68, CD163, ASAH1, CTSS, CD14, TYROBP, NPL, FGL2, CYBB, ACP5, CTSC, FCGRT, PLA2G7, GM2A, IL18, CREG1 |
198 |
| GSE10325_LUPUS_CD4_TCELL_VS_LUPUS_MYELOID_DN | 4.34e-22 | 42.31 | 22.14 | 7.05e-19 | 2.12e-18 | 19CTSB, PSAP, CTSD, CSF1R, IGSF6, ASAH1, CD14, GRN, TYROBP, CD74, NPL, ADAP2, FGL2, AIF1, CYBB, FCGRT, GM2A, CREG1, TPP1 |
200 |
| GSE22886_NAIVE_CD8_TCELL_VS_MONOCYTE_DN | 6.65e-19 | 35.18 | 18.04 | 5.40e-16 | 3.24e-15 | 17CTSB, PSAP, CSF1R, IGSF6, ASAH1, CTSS, CD14, GRN, CPVL, TYROBP, NPL, NPC2, ADAP2, FGL2, CYBB, MFSD1, CREG1 |
200 |
| GSE24634_TEFF_VS_TCONV_DAY3_IN_CULTURE_DN | 6.65e-19 | 35.18 | 18.04 | 5.40e-16 | 3.24e-15 | 17LIPA, CD68, CD163, MS4A4A, CD14, C2, CPVL, NPL, ADAP2, FGL2, CYBB, FCGRT, CD84, MFSD1, MERTK, LAIR1, SLAMF8 |
200 |
| GSE21670_STAT3_KO_VS_WT_CD4_TCELL_TGFB_IL6_TREATED_DN | 6.65e-19 | 35.18 | 18.04 | 5.40e-16 | 3.24e-15 | 17CTSB, PSAP, GPNMB, ASAH1, CTSS, GRN, CPVL, PLD3, NPL, FGL2, FUCA1, ACP5, CD4, CREG1, MSR1, TPP1, LAIR1 |
200 |
| GSE29618_MONOCYTE_VS_MDC_DAY7_FLU_VACCINE_UP | 2.27e-17 | 31.95 | 16.17 | 1.58e-14 | 1.10e-13 | 16CTSB, PSAP, CTSD, CD68, CD163, ASAH1, CTSS, CD14, NPL, NPC2, AIF1, FUCA1, CYBB, PLA2G7, CREG1, LAIR1 |
200 |
| GSE34156_UNTREATED_VS_6H_TLR1_TLR2_LIGAND_TREATED_MONOCYTE_UP | 5.62e-16 | 29.42 | 14.66 | 3.04e-13 | 2.74e-12 | 15PSAP, CD163, CSF1R, IGSF6, ASAH1, CD14, GRN, NPC2, CYBB, FCGRT, GM2A, MFSD1, CREG1, MSR1, TPP1 |
197 |
| GSE34156_TLR1_TLR2_LIGAND_VS_NOD2_AND_TLR1_TLR2_LIGAND_24H_TREATED_MONOCYTE_UP | 5.62e-16 | 29.42 | 14.66 | 3.04e-13 | 2.74e-12 | 15PSAP, CTSD, CD163, CSF1R, IGSF6, ASAH1, CD14, GRN, TYROBP, CYBB, FCGRT, GM2A, CREG1, MSR1, MERTK |
197 |
| GSE22886_NAIVE_TCELL_VS_MONOCYTE_DN | 7.03e-16 | 28.93 | 14.43 | 3.11e-13 | 3.43e-12 | 15CTSB, PSAP, IGSF6, ASAH1, CD14, GRN, CPVL, NPL, NPC2, ADAP2, FGL2, CYBB, MFSD1, CREG1, TPP1 |
200 |
| GSE29618_MONOCYTE_VS_MDC_UP | 7.03e-16 | 28.93 | 14.43 | 3.11e-13 | 3.43e-12 | 15CTSB, PSAP, CTSD, CD68, CD163, ASAH1, CTSS, CD14, TYROBP, NPL, NPC2, AIF1, CYBB, PLA2G7, CREG1 |
200 |
| GSE24634_TREG_VS_TCONV_POST_DAY5_IL4_CONVERSION_DN | 1.72e-14 | 26.41 | 12.93 | 6.88e-12 | 8.39e-11 | 14LIPA, CTSB, CD68, CSF1R, IGSF6, CTSS, GRN, TYROBP, NPC2, CYBB, ACP5, FCGRT, CD84, CREG1 |
198 |
| GSE6259_33D1_POS_DC_VS_CD4_TCELL_DN | 9.87e-14 | 26.92 | 12.88 | 3.20e-11 | 4.81e-10 | 13APOE, LGMN, GPNMB, SLCO2B1, TYROBP, PLD3, NPL, ACP5, CD4, CD84, MERTK, TPP1, LAIR1 |
176 |
| GSE22886_NAIVE_CD4_TCELL_VS_MONOCYTE_DN | 1.98e-14 | 26.13 | 12.79 | 6.88e-12 | 9.64e-11 | 14CTSB, PSAP, IGSF6, ASAH1, CTSS, CD14, GRN, NPC2, ADAP2, FGL2, CYBB, MFSD1, CREG1, TPP1 |
200 |
| GSE24634_IL4_VS_CTRL_TREATED_NAIVE_CD4_TCELL_DAY5_UP | 1.98e-14 | 26.13 | 12.79 | 6.88e-12 | 9.64e-11 | 14LGMN, CD68, SLCO2B1, CSF1R, IGSF6, MS4A4A, CPVL, MRC1, NPL, NPC2, FUCA1, PLA2G7, CREG1, LAIR1 |
200 |
| GSE10325_LUPUS_BCELL_VS_LUPUS_MYELOID_DN | 5.03e-13 | 23.47 | 11.26 | 1.44e-10 | 2.45e-09 | 13CTSB, PSAP, CTSD, CD163, CSF1R, IGSF6, TYROBP, NPL, ADAP2, FGL2, AIF1, FCGRT, CREG1 |
200 |
| GSE19401_PAM2CSK4_VS_RETINOIC_ACID_AND_PAM2CSK4_STIM_FOLLICULAR_DC_DN | 5.03e-13 | 23.47 | 11.26 | 1.44e-10 | 2.45e-09 | 13LIPA, APOE, APOC1, CTSD, GPNMB, CD163, SLCO2B1, ASAH1, GRN, MRC1, ACP5, GM2A, LAIR1 |
200 |
| GSE24634_TEFF_VS_TCONV_DAY7_IN_CULTURE_DN | 1.15e-11 | 20.99 | 9.83 | 2.67e-09 | 5.60e-08 | 12LIPA, CTSB, PSAP, CTSS, TYROBP, NPC2, AIF1, ACP5, FCGRT, PLA2G7, CD84, GM2A |
200 |
| GSE29618_BCELL_VS_MONOCYTE_DAY7_FLU_VACCINE_DN | 1.15e-11 | 20.99 | 9.83 | 2.67e-09 | 5.60e-08 | 12PSAP, CTSD, CD68, CD163, CSF1R, CD14, GRN, TYROBP, NPL, CD4, FCGRT, CREG1 |
200 |
| GSE21670_UNTREATED_VS_IL6_TREATED_STAT3_KO_CD4_TCELL_UP | 1.15e-11 | 20.99 | 9.83 | 2.67e-09 | 5.60e-08 | 12PSAP, CSF1R, CTSS, PLD3, FGL2, CYBB, ACP5, CD4, GM2A, CREG1, TPP1, LAIR1 |
200 |
Top Ranked Transcription Factors for this Gene Expression Program:
| Gene Symbol | TF Rank | DNA Binding Domain | Motif Status | IUPAC PWM | GTEx | DepMap | Decartes |
|---|---|---|---|---|---|---|---|
| CREG1 | 45 | No | Unlikely to be sequence specific TF | Not a DNA binding protein | No motif | None | Regulates transcription in tethering assays (PMID: 9710587). Unlikely to be a TF, based on the lack of a canonical DBD |
| SGK1 | 53 | No | Unlikely to be sequence specific TF | Not a DNA binding protein | No motif | None | None |
| ITGB2 | 56 | No | Unlikely to be sequence specific TF | Not a DNA binding protein | No motif | None | None |
| MAFB | 70 | Yes | Known motif | Monomer or homomultimer | 100 perc ID - in vitro | None | PDB:2WTY is a homodimer crystallised with TAATTGCTGACTCAGCAAAT sequence |
| NR1H3 | 77 | Yes | Inferred motif | Obligate heteromer | In vivo/Misc source | None | Binds as an obligate heterodimer with RXR-proteins. (PDB: 2ACL) is a crystal structure of the two proteins without DNA |
| LGALS9 | 81 | No | Unlikely to be sequence specific TF | Not a DNA binding protein | No motif | None | None |
| SYK | 91 | No | Unlikely to be sequence specific TF | Not a DNA binding protein | No motif | None | Known co-factor |
| STAT1 | 95 | Yes | Known motif | Monomer or homomultimer | In vivo/Misc source | None | Structure PDB:1BF5 is Tyrosine phosphorylated |
| SPI1 | 106 | Yes | Known motif | Monomer or homomultimer | High-throughput in vitro | None | None |
| CEBPA | 125 | Yes | Known motif | Monomer or homomultimer | 100 perc ID - in vitro | None | None |
| TLR4 | 129 | No | Unlikely to be sequence specific TF | Not a DNA binding protein | No motif | None | None |
| NFAM1 | 140 | No | Unlikely to be sequence specific TF | Not a DNA binding protein | No motif | None | NFAM1 modulates B cell signaling through its immunoreceptor tyrosine-based activation motif, which regulates B cell development (PMID: 15143214) |
| HCK | 144 | No | Unlikely to be sequence specific TF | Not a DNA binding protein | No motif | None | Inhibits TP73-mediated transcription activation (PMID: 17535448) |
| PYCARD | 174 | No | Unlikely to be sequence specific TF | Not a DNA binding protein | No motif | None | None |
| CREBL2 | 183 | Yes | Inferred motif | Monomer or homomultimer | High-throughput in vitro | None | None |
| TRIM14 | 208 | No | Unlikely to be sequence specific TF | Not a DNA binding protein | No motif | None | None |
| CIITA | 217 | No | Unlikely to be sequence specific TF | Not a DNA binding protein | No motif | None | Chromatin modifier |
| NR4A2 | 235 | Yes | Known motif | Monomer or homomultimer | High-throughput in vitro | None | None |
| CMKLR1 | 246 | No | Unlikely to be sequence specific TF | Not a DNA binding protein | No motif | None | Protein is a G protein-coupled receptor for the chemoattractant adipokine chemerin |
| NCOA4 | 269 | No | Unlikely to be sequence specific TF | Not a DNA binding protein | No motif | None | None |
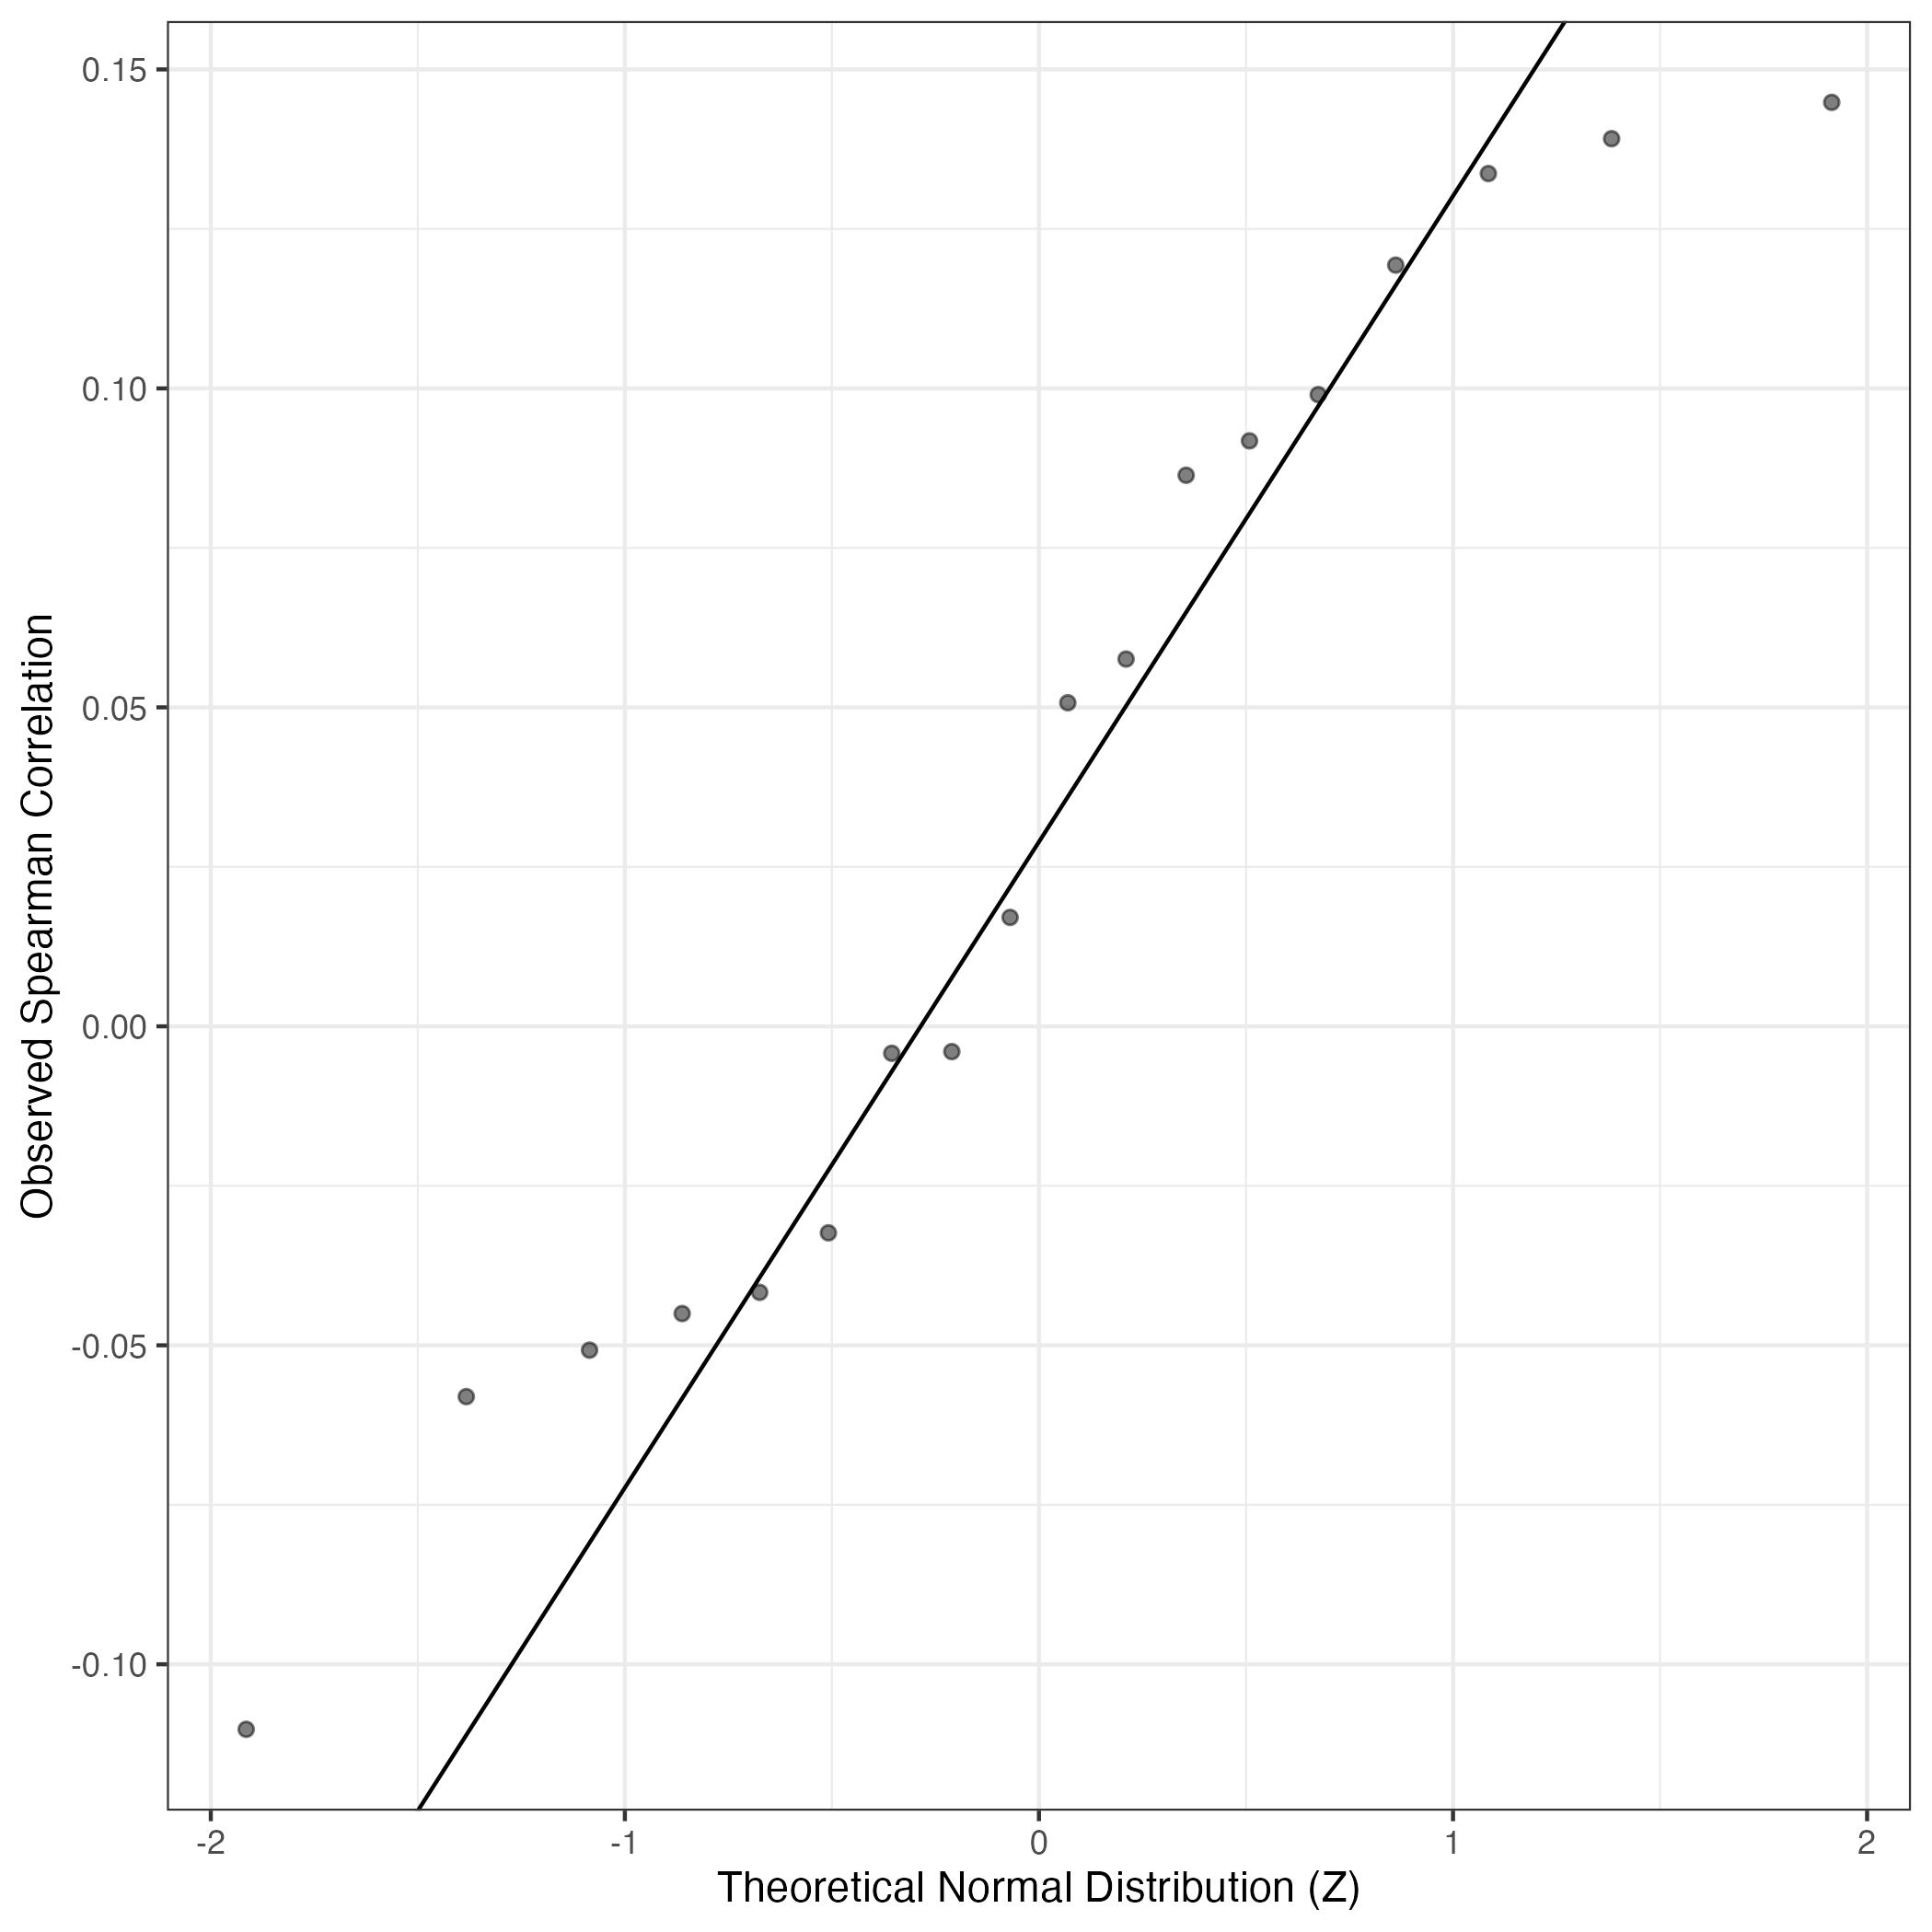
QQ Plot showing correlations with other GEPs in this dataset, calculated by Spearman correlation:
Interactive QQ-plot of gene loadings:
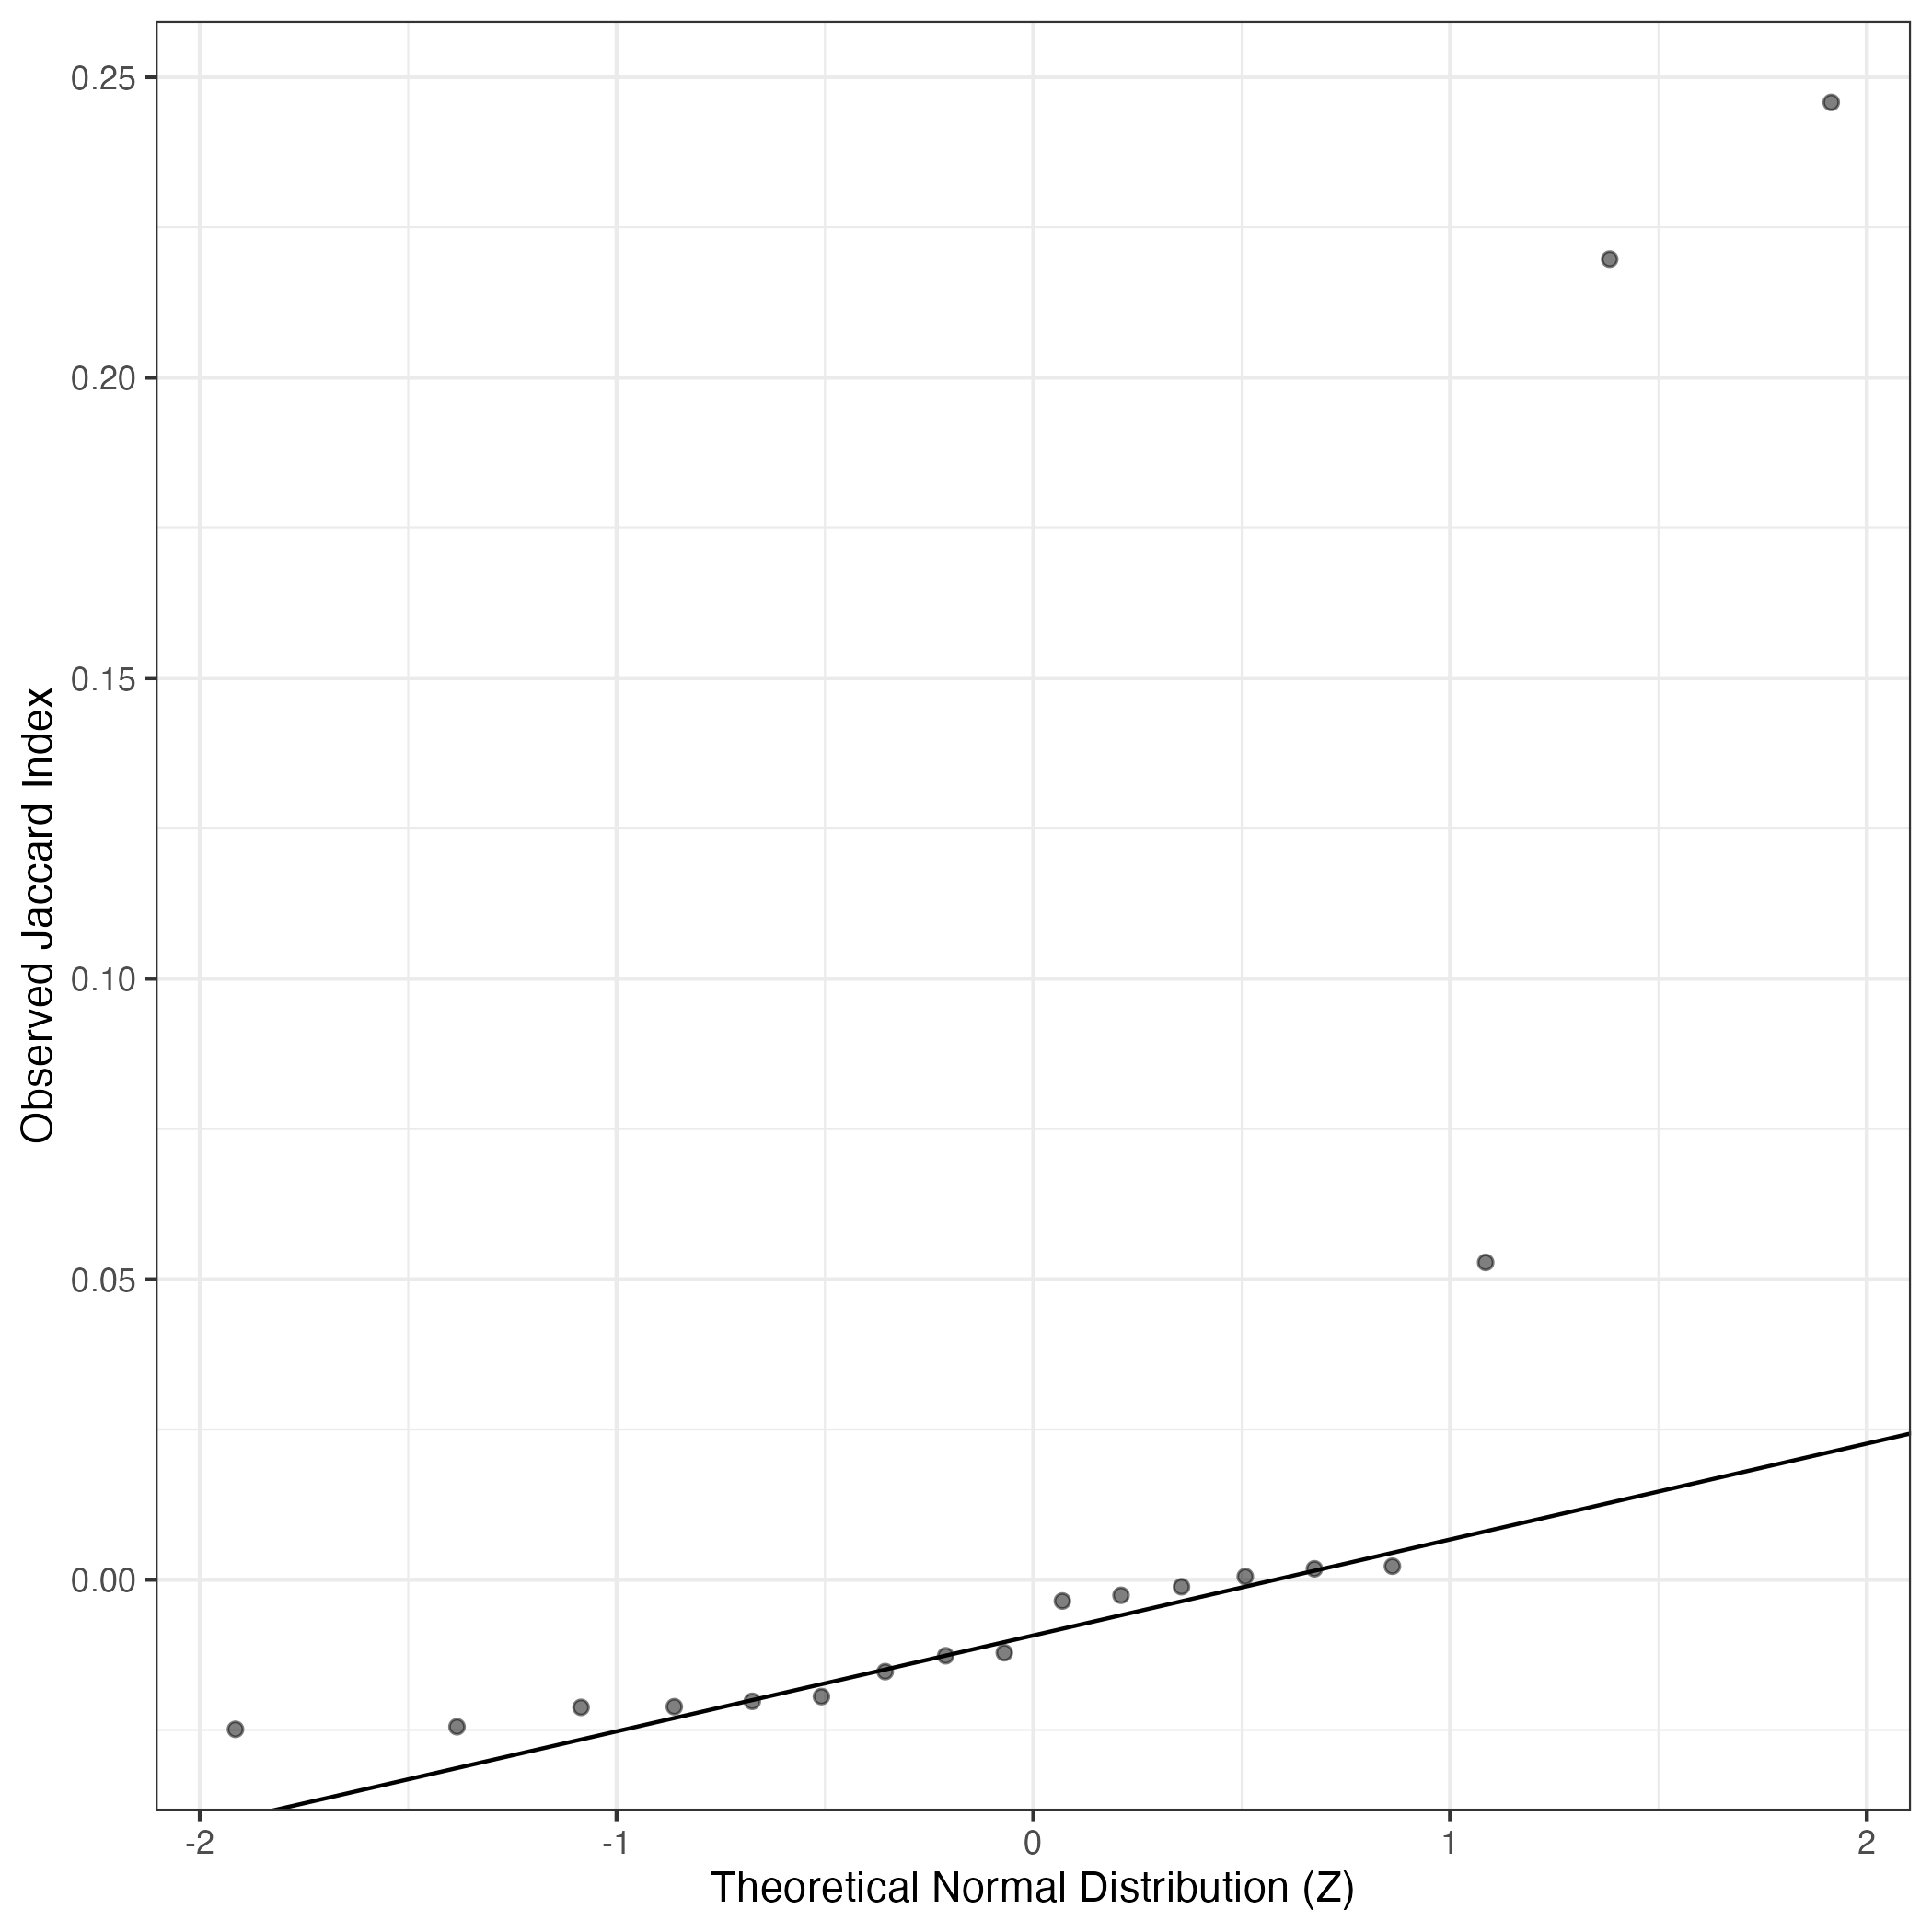
A similar QQ-plot as above, but only for instances where the H value is e.g. > 25, i.e. we are confident that the expression program is active above noise. Agreemenet between these binary vectors is tested using the Jaccard Index, with the P-values calculated by an exact test:
Interactive QQ-plot:
Singler cell type annotations for the top 50 cells on this program.
| Cell ID | Singler label | Singler Delta | Activity Score | Top Singler Raw Scores |
|---|---|---|---|---|
| WK067-G18 | Macrophage:monocyte-derived:M-CSF | 0.20 | 1361.46 | Raw ScoresMacrophage:monocyte-derived:M-CSF: 0.5, DC:monocyte-derived:anti-DC-SIGN_2h: 0.5, Macrophage:monocyte-derived:IL-4/Dex/TGFb: 0.49, DC:monocyte-derived:A._fumigatus_germ_tubes_6h: 0.49, Macrophage:monocyte-derived:IL-4/Dex/cntrl: 0.49, Macrophage:monocyte-derived:M-CSF/IFNg: 0.49, Monocyte:leukotriene_D4: 0.49, DC:monocyte-derived:antiCD40/VAF347: 0.48, DC:monocyte-derived: 0.48, Macrophage:monocyte-derived:M-CSF/IFNg/Pam3Cys: 0.48 |
| WK071-B16 | Monocyte:CD16+ | 0.15 | 1287.99 | Raw ScoresMacrophage:monocyte-derived:M-CSF: 0.48, Macrophage:monocyte-derived:IL-4/Dex/TGFb: 0.47, Macrophage:monocyte-derived:IL-4/Dex/cntrl: 0.47, Monocyte:leukotriene_D4: 0.47, Macrophage:monocyte-derived:M-CSF/IFNg: 0.46, Monocyte:CD16+: 0.46, Monocyte: 0.46, DC:monocyte-derived:anti-DC-SIGN_2h: 0.46, DC:monocyte-derived:AEC-conditioned: 0.46, Monocyte:anti-FcgRIIB: 0.46 |
| WK069-F4 | DC:monocyte-derived:anti-DC-SIGN_2h | 0.16 | 907.06 | Raw ScoresMacrophage:monocyte-derived:M-CSF: 0.44, Macrophage:monocyte-derived:M-CSF/IFNg/Pam3Cys: 0.44, DC:monocyte-derived:anti-DC-SIGN_2h: 0.43, Macrophage:monocyte-derived:M-CSF/Pam3Cys: 0.43, DC:monocyte-derived:A._fumigatus_germ_tubes_6h: 0.43, DC:monocyte-derived:antiCD40/VAF347: 0.43, Macrophage:monocyte-derived:IL-4/Dex/TGFb: 0.43, Macrophage:monocyte-derived:IL-4/Dex/cntrl: 0.42, DC:monocyte-derived: 0.42, Macrophage:monocyte-derived:M-CSF/IFNg: 0.42 |
| KK002-L23 | Macrophage:monocyte-derived:M-CSF | 0.21 | 886.03 | Raw ScoresMacrophage:monocyte-derived:M-CSF: 0.57, Monocyte:leukotriene_D4: 0.56, Macrophage:monocyte-derived:M-CSF/IFNg: 0.55, Macrophage:monocyte-derived:IL-4/Dex/TGFb: 0.55, Monocyte: 0.55, DC:monocyte-derived:Galectin-1: 0.55, DC:monocyte-derived:LPS: 0.55, Macrophage:monocyte-derived:M-CSF/IFNg/Pam3Cys: 0.55, Macrophage:monocyte-derived:IL-4/Dex/cntrl: 0.55, Macrophage:monocyte-derived: 0.55 |
| WK024-A19 | Macrophage:monocyte-derived:M-CSF/IFNg | 0.21 | 827.85 | Raw ScoresMacrophage:monocyte-derived:M-CSF/IFNg: 0.5, Macrophage:monocyte-derived:IL-4/cntrl: 0.5, Macrophage:monocyte-derived:IL-4/TGFb: 0.5, Macrophage:monocyte-derived:IL-4/Dex/cntrl: 0.5, Macrophage:monocyte-derived:M-CSF: 0.5, Macrophage:monocyte-derived:IL-4/Dex/TGFb: 0.49, Macrophage:monocyte-derived:IFNa: 0.49, DC:monocyte-derived:AEC-conditioned: 0.48, DC:monocyte-derived: 0.48, Macrophage:monocyte-derived: 0.48 |
| WK014-C17 | Macrophage:monocyte-derived:M-CSF | 0.21 | 741.96 | Raw ScoresMacrophage:monocyte-derived:M-CSF: 0.52, Macrophage:monocyte-derived:IL-4/Dex/cntrl: 0.52, Macrophage:monocyte-derived:IL-4/Dex/TGFb: 0.52, Macrophage:monocyte-derived:IL-4/cntrl: 0.5, Macrophage:monocyte-derived:IL-4/TGFb: 0.5, Macrophage:monocyte-derived: 0.5, DC:monocyte-derived:anti-DC-SIGN_2h: 0.5, DC:monocyte-derived: 0.49, Monocyte:leukotriene_D4: 0.49, DC:monocyte-derived:antiCD40/VAF347: 0.49 |
| WK074-O1 | DC:monocyte-derived:anti-DC-SIGN_2h | 0.16 | 606.33 | Raw ScoresDC:monocyte-derived:anti-DC-SIGN_2h: 0.42, Macrophage:monocyte-derived:M-CSF: 0.42, DC:monocyte-derived:antiCD40/VAF347: 0.42, Macrophage:monocyte-derived:IL-4/Dex/TGFb: 0.42, DC:monocyte-derived:A._fumigatus_germ_tubes_6h: 0.42, Macrophage:monocyte-derived:IL-4/Dex/cntrl: 0.42, DC:monocyte-derived: 0.41, Macrophage:monocyte-derived:M-CSF/Pam3Cys: 0.41, Macrophage:monocyte-derived:M-CSF/IFNg/Pam3Cys: 0.41, DC:monocyte-derived:Galectin-1: 0.41 |
| WK073-P9 | Macrophage:monocyte-derived:M-CSF | 0.16 | 598.09 | Raw ScoresDC:monocyte-derived:A._fumigatus_germ_tubes_6h: 0.43, Macrophage:monocyte-derived:M-CSF/IFNg/Pam3Cys: 0.43, Macrophage:monocyte-derived:M-CSF: 0.43, Macrophage:monocyte-derived:M-CSF/Pam3Cys: 0.43, DC:monocyte-derived:antiCD40/VAF347: 0.43, Macrophage:monocyte-derived:IL-4/Dex/TGFb: 0.42, Monocyte:anti-FcgRIIB: 0.42, DC:monocyte-derived:anti-DC-SIGN_2h: 0.42, Macrophage:monocyte-derived:IL-4/Dex/cntrl: 0.42, Monocyte:S._typhimurium_flagellin: 0.42 |
| WK074-M5 | Macrophage:monocyte-derived:IL-4/Dex/TGFb | 0.17 | 556.86 | Raw ScoresMacrophage:monocyte-derived:M-CSF: 0.4, Macrophage:monocyte-derived:IL-4/Dex/TGFb: 0.4, Macrophage:monocyte-derived:IL-4/Dex/cntrl: 0.4, Macrophage:monocyte-derived:M-CSF/IFNg: 0.38, DC:monocyte-derived:anti-DC-SIGN_2h: 0.38, Monocyte:leukotriene_D4: 0.38, Monocyte: 0.38, Monocyte:anti-FcgRIIB: 0.37, Macrophage:monocyte-derived:IL-4/TGFb: 0.37, DC:monocyte-derived:immature: 0.37 |
| KK053-N11 | Macrophage:monocyte-derived:M-CSF | 0.18 | 535.29 | Raw ScoresDC:monocyte-derived:antiCD40/VAF347: 0.51, Macrophage:monocyte-derived:M-CSF/Pam3Cys: 0.51, Macrophage:monocyte-derived:M-CSF: 0.51, DC:monocyte-derived: 0.5, Macrophage:monocyte-derived:IL-4/Dex/TGFb: 0.5, Macrophage:monocyte-derived:M-CSF/IFNg/Pam3Cys: 0.5, DC:monocyte-derived:LPS: 0.5, DC:monocyte-derived:Galectin-1: 0.5, Macrophage:monocyte-derived:IL-4/TGFb: 0.5, DC:monocyte-derived:anti-DC-SIGN_2h: 0.5 |
| WK073-L16 | DC:monocyte-derived:antiCD40/VAF347 | 0.17 | 516.81 | Raw ScoresDC:monocyte-derived:A._fumigatus_germ_tubes_6h: 0.46, Macrophage:monocyte-derived:M-CSF/Pam3Cys: 0.46, Macrophage:monocyte-derived:M-CSF/IFNg/Pam3Cys: 0.46, DC:monocyte-derived:antiCD40/VAF347: 0.46, Monocyte:S._typhimurium_flagellin: 0.45, Macrophage:monocyte-derived:M-CSF: 0.45, Macrophage:monocyte-derived:S._aureus: 0.45, Monocyte:anti-FcgRIIB: 0.44, DC:monocyte-derived:LPS: 0.44, DC:monocyte-derived:Galectin-1: 0.44 |
| WK065-E2 | Macrophage:monocyte-derived:M-CSF/IFNg/Pam3Cys | 0.13 | 466.21 | Raw ScoresMonocyte:leukotriene_D4: 0.51, Monocyte:anti-FcgRIIB: 0.49, Monocyte: 0.49, DC:monocyte-derived:anti-DC-SIGN_2h: 0.48, Macrophage:monocyte-derived:M-CSF/IFNg: 0.48, Macrophage:monocyte-derived:M-CSF/IFNg/Pam3Cys: 0.48, Macrophage:monocyte-derived:M-CSF: 0.48, Macrophage:monocyte-derived:IFNa: 0.48, Pre-B_cell_CD34-: 0.48, Monocyte:CD16+: 0.47 |
| WK073-O22 | Macrophage:monocyte-derived:M-CSF/IFNg/Pam3Cys | 0.20 | 462.23 | Raw ScoresMacrophage:monocyte-derived:M-CSF/IFNg/Pam3Cys: 0.51, Macrophage:monocyte-derived:M-CSF/Pam3Cys: 0.5, DC:monocyte-derived:A._fumigatus_germ_tubes_6h: 0.49, DC:monocyte-derived:antiCD40/VAF347: 0.49, Macrophage:monocyte-derived:M-CSF/IFNg: 0.49, Macrophage:monocyte-derived:S._aureus: 0.49, Macrophage:monocyte-derived:M-CSF: 0.49, DC:monocyte-derived:LPS: 0.49, DC:monocyte-derived:Galectin-1: 0.49, Macrophage:Alveolar:B._anthacis_spores: 0.49 |
| WK024-P3 | Macrophage:monocyte-derived:M-CSF/IFNg | 0.17 | 459.32 | Raw ScoresMacrophage:monocyte-derived:M-CSF/IFNg: 0.39, Macrophage:monocyte-derived:M-CSF: 0.38, Macrophage:monocyte-derived:IL-4/Dex/cntrl: 0.38, Macrophage:monocyte-derived:IL-4/Dex/TGFb: 0.38, DC:monocyte-derived:anti-DC-SIGN_2h: 0.38, Monocyte:leukotriene_D4: 0.37, DC:monocyte-derived: 0.37, DC:monocyte-derived:AEC-conditioned: 0.37, Monocyte:anti-FcgRIIB: 0.36, Monocyte: 0.36 |
| WK024-K7 | Macrophage:monocyte-derived:IL-4/Dex/TGFb | 0.15 | 427.40 | Raw ScoresMacrophage:monocyte-derived:IL-4/Dex/cntrl: 0.37, Macrophage:monocyte-derived:IL-4/Dex/TGFb: 0.37, Macrophage:monocyte-derived:M-CSF: 0.37, DC:monocyte-derived:anti-DC-SIGN_2h: 0.37, Macrophage:monocyte-derived:M-CSF/IFNg: 0.36, Monocyte:leukotriene_D4: 0.36, DC:monocyte-derived:AEC-conditioned: 0.36, DC:monocyte-derived: 0.35, DC:monocyte-derived:LPS: 0.35, Monocyte:anti-FcgRIIB: 0.35 |
| WK024-O21 | Macrophage:monocyte-derived:IL-4/Dex/TGFb | 0.17 | 422.41 | Raw ScoresMacrophage:monocyte-derived:IL-4/Dex/cntrl: 0.37, Macrophage:monocyte-derived:IL-4/Dex/TGFb: 0.37, Macrophage:monocyte-derived:M-CSF: 0.37, DC:monocyte-derived:anti-DC-SIGN_2h: 0.36, Macrophage:monocyte-derived:M-CSF/IFNg: 0.36, DC:monocyte-derived: 0.36, Macrophage:monocyte-derived:IL-4/TGFb: 0.35, Macrophage:monocyte-derived:IL-4/cntrl: 0.35, DC:monocyte-derived:AEC-conditioned: 0.35, Monocyte:leukotriene_D4: 0.35 |
| WK024-I21 | Macrophage:monocyte-derived:M-CSF/IFNg | 0.17 | 410.13 | Raw ScoresMacrophage:monocyte-derived:M-CSF: 0.4, Macrophage:monocyte-derived:M-CSF/IFNg: 0.4, Macrophage:monocyte-derived:IL-4/Dex/cntrl: 0.4, Macrophage:monocyte-derived:IL-4/Dex/TGFb: 0.39, Macrophage:monocyte-derived:IL-4/cntrl: 0.39, Macrophage:monocyte-derived:IL-4/TGFb: 0.38, DC:monocyte-derived:AEC-conditioned: 0.38, DC:monocyte-derived:immature: 0.38, Monocyte:leukotriene_D4: 0.38, DC:monocyte-derived:anti-DC-SIGN_2h: 0.38 |
| WK074-E23 | Macrophage:monocyte-derived:S._aureus | 0.15 | 406.78 | Raw ScoresDC:monocyte-derived:A._fumigatus_germ_tubes_6h: 0.46, DC:monocyte-derived:antiCD40/VAF347: 0.45, Macrophage:monocyte-derived:M-CSF/Pam3Cys: 0.45, Macrophage:monocyte-derived:S._aureus: 0.45, Macrophage:monocyte-derived:M-CSF/IFNg/Pam3Cys: 0.44, DC:monocyte-derived:Galectin-1: 0.44, DC:monocyte-derived:LPS: 0.44, Macrophage:Alveolar:B._anthacis_spores: 0.43, DC:monocyte-derived: 0.43, DC:monocyte-derived:Schuler_treatment: 0.43 |
| TM96-D4 | DC:monocyte-derived:antiCD40/VAF347 | 0.17 | 404.86 | Raw ScoresDC:monocyte-derived:antiCD40/VAF347: 0.56, Macrophage:monocyte-derived:S._aureus: 0.55, Macrophage:monocyte-derived: 0.55, DC:monocyte-derived:A._fumigatus_germ_tubes_6h: 0.55, DC:monocyte-derived:Galectin-1: 0.55, Macrophage:monocyte-derived:M-CSF/Pam3Cys: 0.54, DC:monocyte-derived: 0.54, Macrophage:monocyte-derived:M-CSF/IFNg/Pam3Cys: 0.54, DC:monocyte-derived:LPS: 0.54, DC:monocyte-derived:CD40L: 0.54 |
| WK024-P21 | Macrophage:monocyte-derived:IL-4/Dex/cntrl | 0.16 | 391.19 | Raw ScoresMacrophage:monocyte-derived:IL-4/Dex/cntrl: 0.31, Macrophage:monocyte-derived:IL-4/Dex/TGFb: 0.31, Macrophage:monocyte-derived:M-CSF: 0.3, DC:monocyte-derived:immature: 0.29, Macrophage:monocyte-derived: 0.29, Macrophage:monocyte-derived:IL-4/cntrl: 0.29, DC:monocyte-derived:anti-DC-SIGN_2h: 0.29, Macrophage:monocyte-derived:M-CSF/IFNg: 0.28, DC:monocyte-derived: 0.28, Macrophage:monocyte-derived:IL-4/TGFb: 0.28 |
| TM37-E5 | Macrophage:monocyte-derived:IL-4/Dex/TGFb | 0.18 | 376.30 | Raw ScoresMacrophage:monocyte-derived:M-CSF: 0.46, Macrophage:monocyte-derived:M-CSF/Pam3Cys: 0.45, Macrophage:monocyte-derived:IL-4/Dex/TGFb: 0.45, DC:monocyte-derived:antiCD40/VAF347: 0.45, Macrophage:monocyte-derived:IL-4/Dex/cntrl: 0.45, Macrophage:monocyte-derived:M-CSF/IFNg/Pam3Cys: 0.44, Monocyte:leukotriene_D4: 0.44, Monocyte:anti-FcgRIIB: 0.44, DC:monocyte-derived:A._fumigatus_germ_tubes_6h: 0.44, DC:monocyte-derived: 0.44 |
| WK073-N11 | DC:monocyte-derived:A._fumigatus_germ_tubes_6h | 0.17 | 361.69 | Raw ScoresMacrophage:monocyte-derived:M-CSF: 0.45, DC:monocyte-derived:anti-DC-SIGN_2h: 0.44, DC:monocyte-derived:A._fumigatus_germ_tubes_6h: 0.44, Macrophage:monocyte-derived:IL-4/Dex/TGFb: 0.44, Macrophage:monocyte-derived:IL-4/Dex/cntrl: 0.44, Monocyte:leukotriene_D4: 0.43, DC:monocyte-derived: 0.43, Macrophage:monocyte-derived:M-CSF/IFNg/Pam3Cys: 0.43, DC:monocyte-derived:antiCD40/VAF347: 0.43, Macrophage:monocyte-derived:M-CSF/Pam3Cys: 0.43 |
| WK024-H21 | Monocyte:CD16+ | 0.17 | 356.92 | Raw ScoresMacrophage:monocyte-derived:M-CSF/IFNg: 0.43, Macrophage:monocyte-derived:M-CSF: 0.43, Monocyte:CD16-: 0.42, Macrophage:monocyte-derived:IL-4/Dex/cntrl: 0.42, Monocyte:CD14+: 0.42, Monocyte:CD16+: 0.42, Macrophage:monocyte-derived:IL-4/Dex/TGFb: 0.42, Monocyte: 0.41, Monocyte:leukotriene_D4: 0.41, Monocyte:anti-FcgRIIB: 0.41 |
| WK024-H8 | Monocyte:CD16+ | 0.14 | 335.57 | Raw ScoresMonocyte:leukotriene_D4: 0.48, Monocyte:CD16+: 0.47, Monocyte: 0.47, Macrophage:monocyte-derived:M-CSF/IFNg: 0.47, Monocyte:anti-FcgRIIB: 0.47, Monocyte:CD14+: 0.46, HSC_-G-CSF: 0.46, Monocyte:CD16-: 0.46, Pre-B_cell_CD34-: 0.46, Macrophage:monocyte-derived:M-CSF: 0.45 |
| WK024-M22 | Macrophage:monocyte-derived:IL-4/Dex/TGFb | 0.16 | 318.55 | Raw ScoresMacrophage:monocyte-derived:M-CSF: 0.34, Macrophage:monocyte-derived:IL-4/Dex/TGFb: 0.34, Macrophage:monocyte-derived:IL-4/Dex/cntrl: 0.34, DC:monocyte-derived:anti-DC-SIGN_2h: 0.33, Monocyte:leukotriene_D4: 0.33, Macrophage:monocyte-derived:M-CSF/IFNg: 0.32, DC:monocyte-derived: 0.32, DC:monocyte-derived:AEC-conditioned: 0.32, Monocyte: 0.32, Monocyte:anti-FcgRIIB: 0.32 |
| WK024-N23 | Macrophage:monocyte-derived:IL-4/Dex/cntrl | 0.14 | 312.88 | Raw ScoresMacrophage:monocyte-derived:M-CSF: 0.34, Macrophage:monocyte-derived:M-CSF/IFNg: 0.33, Macrophage:monocyte-derived:IL-4/Dex/cntrl: 0.33, Macrophage:monocyte-derived:IL-4/Dex/TGFb: 0.33, DC:monocyte-derived:anti-DC-SIGN_2h: 0.32, Monocyte:leukotriene_D4: 0.32, DC:monocyte-derived: 0.32, DC:monocyte-derived:immature: 0.32, Macrophage:monocyte-derived:IL-4/cntrl: 0.32, DC:monocyte-derived:AEC-conditioned: 0.32 |
| WK012-C9 | Macrophage:monocyte-derived:M-CSF/Pam3Cys | 0.19 | 310.37 | Raw ScoresDC:monocyte-derived:antiCD40/VAF347: 0.46, DC:monocyte-derived:A._fumigatus_germ_tubes_6h: 0.46, Macrophage:monocyte-derived:M-CSF/Pam3Cys: 0.46, Monocyte:S._typhimurium_flagellin: 0.45, DC:monocyte-derived:anti-DC-SIGN_2h: 0.44, Macrophage:monocyte-derived:S._aureus: 0.44, Macrophage:monocyte-derived:M-CSF/IFNg/Pam3Cys: 0.44, Macrophage:monocyte-derived:M-CSF: 0.44, Monocyte:anti-FcgRIIB: 0.43, DC:monocyte-derived:Galectin-1: 0.43 |
| WK014-F23 | DC:monocyte-derived:antiCD40/VAF347 | 0.19 | 308.88 | Raw ScoresDC:monocyte-derived:A._fumigatus_germ_tubes_6h: 0.47, DC:monocyte-derived:antiCD40/VAF347: 0.47, Macrophage:monocyte-derived:M-CSF/Pam3Cys: 0.47, Macrophage:monocyte-derived:M-CSF/IFNg/Pam3Cys: 0.46, DC:monocyte-derived:anti-DC-SIGN_2h: 0.46, Macrophage:monocyte-derived:S._aureus: 0.46, DC:monocyte-derived: 0.46, Monocyte:S._typhimurium_flagellin: 0.46, Macrophage:monocyte-derived:M-CSF: 0.46, DC:monocyte-derived:Galectin-1: 0.46 |
| WK012-O10 | Macrophage:monocyte-derived:M-CSF | 0.17 | 299.10 | Raw ScoresMacrophage:monocyte-derived:M-CSF: 0.42, Macrophage:monocyte-derived:M-CSF/Pam3Cys: 0.42, DC:monocyte-derived:antiCD40/VAF347: 0.42, Macrophage:monocyte-derived:IL-4/Dex/cntrl: 0.42, Macrophage:monocyte-derived:IL-4/Dex/TGFb: 0.42, DC:monocyte-derived:A._fumigatus_germ_tubes_6h: 0.41, Macrophage:monocyte-derived:M-CSF/IFNg/Pam3Cys: 0.41, Macrophage:Alveolar:B._anthacis_spores: 0.41, DC:monocyte-derived:anti-DC-SIGN_2h: 0.41, DC:monocyte-derived: 0.41 |
| KK055-N5 | Macrophage:monocyte-derived:M-CSF | 0.15 | 296.56 | Raw ScoresMacrophage:monocyte-derived:M-CSF: 0.47, Monocyte:leukotriene_D4: 0.47, DC:monocyte-derived:anti-DC-SIGN_2h: 0.46, Monocyte:anti-FcgRIIB: 0.46, Macrophage:monocyte-derived:IL-4/Dex/cntrl: 0.46, Monocyte: 0.46, Macrophage:monocyte-derived:IL-4/Dex/TGFb: 0.46, DC:monocyte-derived:LPS: 0.46, Macrophage:monocyte-derived:M-CSF/IFNg: 0.46, DC:monocyte-derived:Galectin-1: 0.46 |
| WK024-M16 | Macrophage:monocyte-derived:IL-4/Dex/TGFb | 0.14 | 286.94 | Raw ScoresMacrophage:monocyte-derived:M-CSF: 0.32, Macrophage:monocyte-derived:IL-4/Dex/cntrl: 0.32, DC:monocyte-derived:anti-DC-SIGN_2h: 0.31, Macrophage:monocyte-derived:IL-4/Dex/TGFb: 0.31, Macrophage:monocyte-derived:M-CSF/IFNg: 0.31, Monocyte:leukotriene_D4: 0.31, DC:monocyte-derived:AEC-conditioned: 0.3, DC:monocyte-derived: 0.3, Monocyte: 0.3, Monocyte:anti-FcgRIIB: 0.3 |
| WK073-L8 | DC:monocyte-derived:antiCD40/VAF347 | 0.18 | 279.04 | Raw ScoresDC:monocyte-derived:antiCD40/VAF347: 0.45, Macrophage:monocyte-derived:M-CSF/IFNg/Pam3Cys: 0.45, DC:monocyte-derived:A._fumigatus_germ_tubes_6h: 0.45, Macrophage:monocyte-derived:M-CSF/Pam3Cys: 0.45, Monocyte:S._typhimurium_flagellin: 0.45, Macrophage:monocyte-derived:S._aureus: 0.44, DC:monocyte-derived:LPS: 0.44, DC:monocyte-derived:Schuler_treatment: 0.43, DC:monocyte-derived:Galectin-1: 0.43, DC:monocyte-derived:Poly(IC): 0.43 |
| WK024-B21 | Macrophage:monocyte-derived:IL-4/Dex/cntrl | 0.15 | 278.80 | Raw ScoresMacrophage:monocyte-derived:IL-4/Dex/cntrl: 0.34, Macrophage:monocyte-derived:IL-4/Dex/TGFb: 0.34, Macrophage:monocyte-derived:M-CSF: 0.34, DC:monocyte-derived:anti-DC-SIGN_2h: 0.33, DC:monocyte-derived: 0.32, Macrophage:monocyte-derived:M-CSF/IFNg: 0.32, DC:monocyte-derived:immature: 0.32, DC:monocyte-derived:AEC-conditioned: 0.32, Monocyte:leukotriene_D4: 0.32, Macrophage:monocyte-derived:IL-4/cntrl: 0.32 |
| WK024-H12 | Macrophage:monocyte-derived:M-CSF/IFNg | 0.16 | 277.36 | Raw ScoresMacrophage:monocyte-derived:M-CSF/IFNg: 0.4, Macrophage:monocyte-derived:M-CSF: 0.39, Monocyte:leukotriene_D4: 0.39, Monocyte:CD16-: 0.38, Monocyte: 0.38, Monocyte:anti-FcgRIIB: 0.38, Monocyte:CD16+: 0.38, Macrophage:monocyte-derived:M-CSF/IFNg/Pam3Cys: 0.38, DC:monocyte-derived:AEC-conditioned: 0.38, Monocyte:CD14+: 0.38 |
| WK012-F20 | Macrophage:monocyte-derived:IL-4/Dex/TGFb | 0.18 | 276.75 | Raw ScoresMacrophage:monocyte-derived:IL-4/Dex/TGFb: 0.43, Macrophage:monocyte-derived:M-CSF: 0.43, Macrophage:monocyte-derived:IL-4/Dex/cntrl: 0.43, Monocyte:leukotriene_D4: 0.41, Macrophage:monocyte-derived:IL-4/TGFb: 0.41, Macrophage:monocyte-derived:IL-4/cntrl: 0.41, Macrophage:monocyte-derived:M-CSF/IFNg: 0.41, DC:monocyte-derived:anti-DC-SIGN_2h: 0.41, DC:monocyte-derived: 0.4, DC:monocyte-derived:antiCD40/VAF347: 0.4 |
| TM96-C13 | Macrophage:monocyte-derived | 0.12 | 274.56 | Raw ScoresDC:monocyte-derived:antiCD40/VAF347: 0.45, Macrophage:monocyte-derived:IL-4/Dex/TGFb: 0.45, Macrophage:monocyte-derived:M-CSF: 0.45, Macrophage:monocyte-derived:M-CSF/Pam3Cys: 0.45, DC:monocyte-derived: 0.45, DC:monocyte-derived:A._fumigatus_germ_tubes_6h: 0.44, Macrophage:monocyte-derived:S._aureus: 0.44, Macrophage:monocyte-derived: 0.44, Macrophage:monocyte-derived:M-CSF/IFNg/Pam3Cys: 0.44, Macrophage:monocyte-derived:IL-4/Dex/cntrl: 0.44 |
| WK032-B13 | DC:monocyte-derived:antiCD40/VAF347 | 0.18 | 269.97 | Raw ScoresMacrophage:monocyte-derived:M-CSF/IFNg/Pam3Cys: 0.48, DC:monocyte-derived:antiCD40/VAF347: 0.48, Macrophage:monocyte-derived:M-CSF/Pam3Cys: 0.48, Macrophage:monocyte-derived:S._aureus: 0.48, Macrophage:Alveolar:B._anthacis_spores: 0.47, DC:monocyte-derived:A._fumigatus_germ_tubes_6h: 0.47, DC:monocyte-derived:Galectin-1: 0.47, DC:monocyte-derived:LPS: 0.47, Macrophage:Alveolar: 0.47, DC:monocyte-derived:CD40L: 0.46 |
| WMK004-J2 | Macrophage:monocyte-derived:M-CSF/IFNg | 0.16 | 269.36 | Raw ScoresMacrophage:monocyte-derived:M-CSF/IFNg/Pam3Cys: 0.41, Macrophage:monocyte-derived:M-CSF/IFNg: 0.41, Monocyte:leukotriene_D4: 0.41, Macrophage:monocyte-derived:M-CSF: 0.41, DC:monocyte-derived:antiCD40/VAF347: 0.41, DC:monocyte-derived:LPS: 0.4, DC:monocyte-derived:anti-DC-SIGN_2h: 0.4, Monocyte:anti-FcgRIIB: 0.4, DC:monocyte-derived:Galectin-1: 0.4, Monocyte: 0.4 |
| WK024-M19 | Macrophage:monocyte-derived:IL-4/Dex/cntrl | 0.14 | 265.27 | Raw ScoresMacrophage:monocyte-derived:M-CSF: 0.32, Macrophage:monocyte-derived:IL-4/Dex/cntrl: 0.32, Macrophage:monocyte-derived:IL-4/Dex/TGFb: 0.31, Macrophage:monocyte-derived:M-CSF/IFNg: 0.31, DC:monocyte-derived:anti-DC-SIGN_2h: 0.31, Monocyte:leukotriene_D4: 0.3, DC:monocyte-derived:AEC-conditioned: 0.3, DC:monocyte-derived: 0.3, Macrophage:monocyte-derived:M-CSF/IFNg/Pam3Cys: 0.3, Monocyte: 0.3 |
| WK027-C6 | Macrophage:monocyte-derived:IL-4/Dex/cntrl | 0.12 | 259.52 | Raw ScoresMacrophage:monocyte-derived:M-CSF/IFNg: 0.37, Macrophage:monocyte-derived:M-CSF: 0.36, Macrophage:monocyte-derived:IL-4/Dex/cntrl: 0.35, Monocyte:leukotriene_D4: 0.35, DC:monocyte-derived:AEC-conditioned: 0.35, Macrophage:monocyte-derived:IL-4/Dex/TGFb: 0.35, Monocyte: 0.35, Monocyte:anti-FcgRIIB: 0.35, Macrophage:monocyte-derived: 0.35, Macrophage:monocyte-derived:IFNa: 0.34 |
| WK024-M15 | Macrophage:monocyte-derived:IL-4/Dex/TGFb | 0.14 | 250.23 | Raw ScoresMacrophage:monocyte-derived:M-CSF: 0.32, Macrophage:monocyte-derived:IL-4/Dex/cntrl: 0.31, Macrophage:monocyte-derived:IL-4/Dex/TGFb: 0.31, Macrophage:monocyte-derived:M-CSF/IFNg: 0.3, DC:monocyte-derived:AEC-conditioned: 0.3, Monocyte:leukotriene_D4: 0.3, Macrophage:monocyte-derived:IL-4/TGFb: 0.29, Macrophage:monocyte-derived:IL-4/cntrl: 0.29, DC:monocyte-derived: 0.29, DC:monocyte-derived:anti-DC-SIGN_2h: 0.29 |
| WK024-L20 | Monocyte:CD16- | 0.16 | 250.22 | Raw ScoresMonocyte:CD16-: 0.43, Monocyte:CD14+: 0.43, Macrophage:monocyte-derived:M-CSF: 0.42, Macrophage:monocyte-derived:M-CSF/IFNg: 0.42, Monocyte:leukotriene_D4: 0.42, Monocyte: 0.42, Monocyte:CD16+: 0.42, Monocyte:anti-FcgRIIB: 0.41, Macrophage:monocyte-derived:IL-4/Dex/cntrl: 0.41, Macrophage:monocyte-derived:IL-4/Dex/TGFb: 0.41 |
| WMK006-D1 | Macrophage:monocyte-derived:M-CSF | 0.15 | 246.18 | Raw ScoresMacrophage:monocyte-derived:M-CSF: 0.38, DC:monocyte-derived:anti-DC-SIGN_2h: 0.38, DC:monocyte-derived:A._fumigatus_germ_tubes_6h: 0.37, Macrophage:monocyte-derived:M-CSF/Pam3Cys: 0.37, Macrophage:monocyte-derived:M-CSF/IFNg/Pam3Cys: 0.37, DC:monocyte-derived:antiCD40/VAF347: 0.37, Macrophage:monocyte-derived:IL-4/Dex/cntrl: 0.37, DC:monocyte-derived:LPS: 0.37, Macrophage:monocyte-derived:IL-4/Dex/TGFb: 0.37, Macrophage:monocyte-derived:IFNa: 0.37 |
| WK024-B15 | Monocyte:CD16+ | 0.16 | 245.46 | Raw ScoresMonocyte:CD16-: 0.46, Monocyte:CD16+: 0.45, Macrophage:monocyte-derived:M-CSF/IFNg: 0.45, Macrophage:monocyte-derived:M-CSF: 0.45, Monocyte:leukotriene_D4: 0.45, Monocyte: 0.45, Monocyte:CD14+: 0.45, Monocyte:anti-FcgRIIB: 0.45, Macrophage:monocyte-derived:M-CSF/IFNg/Pam3Cys: 0.43, DC:monocyte-derived:AEC-conditioned: 0.43 |
| KK057-F17 | T_cell:CD4+ | 0.08 | 245.07 | Raw ScoresMonocyte:leukotriene_D4: 0.51, DC:monocyte-derived:anti-DC-SIGN_2h: 0.51, Monocyte: 0.51, Monocyte:CD16+: 0.51, Pre-B_cell_CD34-: 0.51, Monocyte:CD16-: 0.51, NK_cell: 0.51, Monocyte:CD14+: 0.5, B_cell:Memory: 0.5, Macrophage:monocyte-derived:M-CSF/IFNg: 0.5 |
| WK074-C18 | DC:monocyte-derived:antiCD40/VAF347 | 0.19 | 241.73 | Raw ScoresDC:monocyte-derived:antiCD40/VAF347: 0.46, DC:monocyte-derived:A._fumigatus_germ_tubes_6h: 0.46, Macrophage:monocyte-derived:M-CSF/Pam3Cys: 0.46, Macrophage:monocyte-derived:M-CSF/IFNg/Pam3Cys: 0.46, Monocyte:S._typhimurium_flagellin: 0.45, Macrophage:monocyte-derived:S._aureus: 0.44, DC:monocyte-derived:Galectin-1: 0.44, DC:monocyte-derived:LPS: 0.44, DC:monocyte-derived:Schuler_treatment: 0.44, DC:monocyte-derived:CD40L: 0.44 |
| WK016-N23 | Tissue_stem_cells:BM_MSC:BMP2 | 0.07 | 241.16 | Raw ScoresMacrophage:monocyte-derived:S._aureus: 0.34, DC:monocyte-derived:AEC-conditioned: 0.34, Tissue_stem_cells:BM_MSC:BMP2: 0.34, iPS_cells:adipose_stem_cells: 0.34, DC:monocyte-derived:A._fumigatus_germ_tubes_6h: 0.33, DC:monocyte-derived:antiCD40/VAF347: 0.33, DC:monocyte-derived:mature: 0.33, Smooth_muscle_cells:vascular:IL-17: 0.33, DC:monocyte-derived:LPS: 0.33, Tissue_stem_cells:BM_MSC:TGFb3: 0.33 |
| WK012-C10 | DC:monocyte-derived:antiCD40/VAF347 | 0.19 | 239.62 | Raw ScoresDC:monocyte-derived:antiCD40/VAF347: 0.43, Macrophage:monocyte-derived:M-CSF/Pam3Cys: 0.43, DC:monocyte-derived:A._fumigatus_germ_tubes_6h: 0.43, Macrophage:monocyte-derived:M-CSF/IFNg/Pam3Cys: 0.42, DC:monocyte-derived:anti-DC-SIGN_2h: 0.42, Monocyte:S._typhimurium_flagellin: 0.42, Macrophage:monocyte-derived:M-CSF: 0.41, Macrophage:monocyte-derived:IL-4/Dex/TGFb: 0.41, DC:monocyte-derived:Galectin-1: 0.41, DC:monocyte-derived:LPS: 0.41 |
| KK002-H6 | Macrophage:monocyte-derived:IL-4/Dex/TGFb | 0.13 | 235.95 | Raw ScoresDC:monocyte-derived:anti-DC-SIGN_2h: 0.4, Macrophage:monocyte-derived:M-CSF: 0.4, Macrophage:monocyte-derived:IL-4/Dex/TGFb: 0.4, Macrophage:monocyte-derived:IL-4/Dex/cntrl: 0.4, DC:monocyte-derived:antiCD40/VAF347: 0.4, DC:monocyte-derived:AEC-conditioned: 0.4, DC:monocyte-derived: 0.4, Macrophage:monocyte-derived:M-CSF/IFNg/Pam3Cys: 0.4, Macrophage:monocyte-derived: 0.4, Macrophage:monocyte-derived:IL-4/TGFb: 0.4 |
| WK016-M1 | DC:monocyte-derived:antiCD40/VAF347 | 0.16 | 230.88 | Raw ScoresMacrophage:monocyte-derived:M-CSF/Pam3Cys: 0.39, Macrophage:monocyte-derived:M-CSF/IFNg/Pam3Cys: 0.38, DC:monocyte-derived:antiCD40/VAF347: 0.38, DC:monocyte-derived:A._fumigatus_germ_tubes_6h: 0.37, Monocyte:S._typhimurium_flagellin: 0.37, Macrophage:monocyte-derived:S._aureus: 0.37, DC:monocyte-derived:LPS: 0.37, Macrophage:Alveolar:B._anthacis_spores: 0.37, DC:monocyte-derived:Galectin-1: 0.37, Macrophage:monocyte-derived:M-CSF: 0.37 |
Below shows the significant enrichments of this GEP for literature curated gene lists
This data was procured from existing single cell RNA-seq maps of neuroblastoma or related relevant data.
High ranks indicate this gene is a driver of this GEP.
These curated gene list are ranked by the P-value (on this GEP) of their constituent genes.
The Mean Count column shows the mean read count in cells scoring highly (H > 50) on this gene expression program.
HSCs and immune cells (Kameneva)
Marker gene were obtained from Fig. 1D of Kameneva et al (PMID 33833454). These genes were used by the authors to annotate each cell type in their human fetal adrenal scRNA-seq data obtained 6, 8, 9, 11, 12 and 14 weeks post conception.:
Wilcoxon ranksum test P-value for gene set overrepresentation: 1.74e-03
Mean rank of genes in gene set: 164
Rank on gene expression program of genes in gene set:
| Genes | Weight | Rank | GTEx | DepMap | Decartes | Mean.Counts | Mean.TPM |
|---|---|---|---|---|---|---|---|
| CD163 | 0.0074670 | 11 | GTEx | DepMap | Descartes | 4.24 | 245.25 |
| AIF1 | 0.0048874 | 32 | GTEx | DepMap | Descartes | 3.18 | 726.55 |
| RGS10 | 0.0009311 | 449 | GTEx | DepMap | Descartes | 1.24 | 390.57 |
Protein maturation (Kinker)
These marker genes were obtained in a pan cancer cell lines NMF analysis of scRNA-eq data in Kinker et al (PMID 33128048) - 10 metaprograms were recovered that manifest across cancers.:
Wilcoxon ranksum test P-value for gene set overrepresentation: 4.56e-03
Mean rank of genes in gene set: 821.33
Rank on gene expression program of genes in gene set:
| Genes | Weight | Rank | GTEx | DepMap | Decartes | Mean.Counts | Mean.TPM |
|---|---|---|---|---|---|---|---|
| RPN2 | 0.0008935 | 471 | GTEx | DepMap | Descartes | 1.58 | 174.99 |
| OS9 | 0.0006076 | 718 | GTEx | DepMap | Descartes | 1.40 | 102.14 |
| PDIA3 | 0.0003379 | 1275 | GTEx | DepMap | Descartes | 1.71 | 108.93 |
Stress response (Dong)
Markers obtained in computationally inferred meta program (by NMF applied to their neuroblastoma sc-RNA-seq data) from Fig. 5(a) of Dong et al. (PMID 32946775).:
Wilcoxon ranksum test P-value for gene set overrepresentation: 5.02e-03
Mean rank of genes in gene set: 890.33
Rank on gene expression program of genes in gene set:
| Genes | Weight | Rank | GTEx | DepMap | Decartes | Mean.Counts | Mean.TPM |
|---|---|---|---|---|---|---|---|
| FOS | 0.0009879 | 407 | GTEx | DepMap | Descartes | 13.71 | 1782.22 |
| JUN | 0.0005878 | 749 | GTEx | DepMap | Descartes | 5.65 | 458.25 |
| JUNB | 0.0002707 | 1515 | GTEx | DepMap | Descartes | 9.74 | 1334.75 |
Below shows ranks on this GEP for literature curated gene lists for large gene sets
These include those reported as mesenchymal/adrenergic by Van Groningen et al.
High ranks indicate this gene is a driver of this GEP (note these results are not ordered).
The Mean Count column shows the mean read count in cells scoring highly (H > 50) on this gene expression program.
VanGroningen Adrenergic Genes
Adrenergic marker genes from Supplementary Table 2 of Van Groningen et al. Nature Genetics 2017. These genes were identified by differential expression analysis of mesenchymal-like and adrenergic-like neuroblastoma cell lines.
Wilcoxon ranksum test P-value for gene set overrepresentation: 1.00e+00
Mean rank of genes in gene set: 8806.19
Median rank of genes in gene set: 9895
Rank on gene expression program of top 30 genes in gene set:
| Genes | Weight | Rank | GTEx | DepMap | Descartes | Mean.Counts | Mean.TPM |
|---|---|---|---|---|---|---|---|
| UCP2 | 0.0023577 | 123 | GTEx | DepMap | Descartes | 2.33 | 296.92 |
| DAPK1 | 0.0022188 | 137 | GTEx | DepMap | Descartes | 1.02 | 42.17 |
| ATP6V1B2 | 0.0014798 | 244 | GTEx | DepMap | Descartes | 4.53 | 169.10 |
| MYO5A | 0.0009333 | 447 | GTEx | DepMap | Descartes | 0.80 | 15.20 |
| LYN | 0.0009312 | 448 | GTEx | DepMap | Descartes | 2.28 | 92.58 |
| ST3GAL6 | 0.0008896 | 473 | GTEx | DepMap | Descartes | 0.92 | 66.83 |
| GLRX | 0.0007968 | 525 | GTEx | DepMap | Descartes | 1.29 | 90.13 |
| AP1S2 | 0.0007368 | 580 | GTEx | DepMap | Descartes | 1.53 | 103.21 |
| DPYSL2 | 0.0003976 | 1116 | GTEx | DepMap | Descartes | 1.43 | 76.32 |
| NARS2 | 0.0003768 | 1167 | GTEx | DepMap | Descartes | 0.09 | 7.31 |
| LSM4 | 0.0003222 | 1326 | GTEx | DepMap | Descartes | 0.44 | 64.21 |
| PBX3 | 0.0003088 | 1373 | GTEx | DepMap | Descartes | 0.62 | 58.59 |
| RPS6KA2 | 0.0002809 | 1475 | GTEx | DepMap | Descartes | 0.23 | 8.44 |
| MMD | 0.0002722 | 1507 | GTEx | DepMap | Descartes | 0.30 | 31.78 |
| CELF2 | 0.0002218 | 1748 | GTEx | DepMap | Descartes | 1.64 | 58.40 |
| RALGDS | 0.0002063 | 1828 | GTEx | DepMap | Descartes | 1.46 | 57.27 |
| GGCT | 0.0001934 | 1900 | GTEx | DepMap | Descartes | 0.18 | 27.04 |
| TBC1D30 | 0.0001363 | 2257 | GTEx | DepMap | Descartes | 0.06 | 1.99 |
| QDPR | 0.0001336 | 2276 | GTEx | DepMap | Descartes | 0.20 | 34.50 |
| CETN3 | 0.0001226 | 2369 | GTEx | DepMap | Descartes | 0.06 | 11.81 |
| TIAM1 | 0.0001209 | 2383 | GTEx | DepMap | Descartes | 0.66 | 22.88 |
| EVL | 0.0001036 | 2539 | GTEx | DepMap | Descartes | 1.08 | 89.20 |
| BEND4 | 0.0001003 | 2568 | GTEx | DepMap | Descartes | 0.05 | 1.12 |
| NANOS1 | 0.0000858 | 2693 | GTEx | DepMap | Descartes | 0.02 | 1.47 |
| PARP6 | 0.0000845 | 2713 | GTEx | DepMap | Descartes | 0.42 | 29.00 |
| CHML | 0.0000744 | 2827 | GTEx | DepMap | Descartes | 0.56 | 17.18 |
| ATP6V0E2 | 0.0000672 | 2898 | GTEx | DepMap | Descartes | 0.10 | 11.20 |
| ARL6IP1 | 0.0000647 | 2925 | GTEx | DepMap | Descartes | 1.95 | 205.46 |
| IRS2 | 0.0000606 | 2974 | GTEx | DepMap | Descartes | 1.15 | 40.00 |
| TMTC4 | 0.0000489 | 3125 | GTEx | DepMap | Descartes | 0.03 | 3.03 |
VanGroningen Mesenchymal Genes
Mesenchymal marker genes from Supplementary Table 2 of Van Groningen et al. Nature Genetics 2017. These genes were identified by differential expression analysis of mesenchymal-like and adrenergic-like neuroblastoma cell lines.
Wilcoxon ranksum test P-value for gene set overrepresentation: 1.00e+00
Mean rank of genes in gene set: 7462.75
Median rank of genes in gene set: 8929
Rank on gene expression program of top 30 genes in gene set:
| Genes | Weight | Rank | GTEx | DepMap | Descartes | Mean.Counts | Mean.TPM |
|---|---|---|---|---|---|---|---|
| LIPA | 0.0106928 | 1 | GTEx | DepMap | Descartes | 7.20 | 701.83 |
| APOE | 0.0095484 | 2 | GTEx | DepMap | Descartes | 34.27 | 7483.78 |
| CTSB | 0.0081959 | 4 | GTEx | DepMap | Descartes | 24.48 | 1833.57 |
| GRN | 0.0061328 | 20 | GTEx | DepMap | Descartes | 11.60 | 1336.07 |
| NPC2 | 0.0051896 | 29 | GTEx | DepMap | Descartes | 6.10 | 1166.07 |
| CTSC | 0.0048188 | 36 | GTEx | DepMap | Descartes | 4.31 | 237.27 |
| CREG1 | 0.0040593 | 45 | GTEx | DepMap | Descartes | 4.39 | 532.32 |
| SGK1 | 0.0036634 | 53 | GTEx | DepMap | Descartes | 7.94 | 376.57 |
| HNMT | 0.0031470 | 69 | GTEx | DepMap | Descartes | 0.83 | 88.97 |
| ITM2B | 0.0030321 | 75 | GTEx | DepMap | Descartes | 13.89 | 416.14 |
| PPT1 | 0.0028685 | 86 | GTEx | DepMap | Descartes | 3.94 | 222.74 |
| STAT1 | 0.0026967 | 95 | GTEx | DepMap | Descartes | 2.26 | 183.90 |
| A2M | 0.0024697 | 111 | GTEx | DepMap | Descartes | 5.03 | 343.78 |
| GNS | 0.0022265 | 134 | GTEx | DepMap | Descartes | 2.58 | 123.99 |
| TSPAN4 | 0.0021844 | 141 | GTEx | DepMap | Descartes | 0.84 | 95.17 |
| SLC38A6 | 0.0021800 | 143 | GTEx | DepMap | Descartes | 0.66 | 81.53 |
| KCTD12 | 0.0019091 | 162 | GTEx | DepMap | Descartes | 3.33 | 167.66 |
| LAMP1 | 0.0018991 | 164 | GTEx | DepMap | Descartes | 2.35 | 118.02 |
| SCPEP1 | 0.0016967 | 196 | GTEx | DepMap | Descartes | 0.60 | 104.24 |
| RGL1 | 0.0016938 | 197 | GTEx | DepMap | Descartes | 0.83 | 53.95 |
| B2M | 0.0014314 | 251 | GTEx | DepMap | Descartes | 61.41 | 7139.16 |
| CYFIP1 | 0.0014153 | 258 | GTEx | DepMap | Descartes | 1.50 | 59.29 |
| ATP1B1 | 0.0013960 | 261 | GTEx | DepMap | Descartes | 2.90 | 266.23 |
| HEXB | 0.0013638 | 271 | GTEx | DepMap | Descartes | 1.25 | 156.78 |
| CD63 | 0.0013272 | 281 | GTEx | DepMap | Descartes | 5.95 | 1292.01 |
| IL13RA1 | 0.0013214 | 285 | GTEx | DepMap | Descartes | 0.90 | 60.85 |
| PDGFC | 0.0012595 | 299 | GTEx | DepMap | Descartes | 0.29 | 19.59 |
| ARPC1B | 0.0011670 | 327 | GTEx | DepMap | Descartes | 1.54 | 203.89 |
| SNAP23 | 0.0011142 | 350 | GTEx | DepMap | Descartes | 0.74 | 75.52 |
| PYGL | 0.0010861 | 361 | GTEx | DepMap | Descartes | 0.35 | 36.34 |
Descartes adrenocortical markers
Top 50 marker genes of adrenocortical cells in the Decartes fetal adrenal single cell map (https://atlas.brotmanbaty.org/bbi/human-gene-expression-during-development/cell/adrenocortical/in/adrenal)
Wilcoxon ranksum test P-value for gene set overrepresentation: 7.92e-01
Mean rank of genes in gene set: 6765.58
Median rank of genes in gene set: 6738.5
Rank on gene expression program of top 30 genes in gene set:
| Genes | Weight | Rank | GTEx | DepMap | Descartes | Mean.Counts | Mean.TPM |
|---|---|---|---|---|---|---|---|
| APOC1 | 0.0080386 | 6 | GTEx | DepMap | Descartes | 8.05 | 2748.16 |
| SCARB1 | 0.0013544 | 274 | GTEx | DepMap | Descartes | 0.41 | 22.91 |
| SH3BP5 | 0.0006666 | 658 | GTEx | DepMap | Descartes | 1.47 | 119.20 |
| PAPSS2 | 0.0005551 | 797 | GTEx | DepMap | Descartes | 0.86 | 50.54 |
| NPC1 | 0.0004547 | 994 | GTEx | DepMap | Descartes | 0.72 | 39.09 |
| POR | 0.0002730 | 1503 | GTEx | DepMap | Descartes | 0.78 | 84.09 |
| SH3PXD2B | 0.0001821 | 1967 | GTEx | DepMap | Descartes | 0.26 | 7.87 |
| FDX1 | 0.0000603 | 2975 | GTEx | DepMap | Descartes | 0.27 | 21.95 |
| ERN1 | 0.0000583 | 3000 | GTEx | DepMap | Descartes | 0.80 | 27.59 |
| GRAMD1B | 0.0000087 | 3657 | GTEx | DepMap | Descartes | 0.34 | 11.50 |
| FDXR | -0.0000154 | 4053 | GTEx | DepMap | Descartes | 0.04 | 5.07 |
| INHA | -0.0000444 | 4724 | GTEx | DepMap | Descartes | 0.00 | 0.00 |
| SGCZ | -0.0000544 | 4981 | GTEx | DepMap | Descartes | 0.00 | 0.00 |
| STAR | -0.0000775 | 5651 | GTEx | DepMap | Descartes | 0.00 | 0.00 |
| DNER | -0.0000900 | 6005 | GTEx | DepMap | Descartes | 0.01 | 1.18 |
| SLC16A9 | -0.0000940 | 6133 | GTEx | DepMap | Descartes | 0.00 | 0.60 |
| TM7SF2 | -0.0001025 | 6357 | GTEx | DepMap | Descartes | 0.03 | 2.15 |
| CYB5B | -0.0001120 | 6634 | GTEx | DepMap | Descartes | 0.36 | 23.05 |
| FRMD5 | -0.0001194 | 6843 | GTEx | DepMap | Descartes | 0.02 | 1.48 |
| FREM2 | -0.0001379 | 7358 | GTEx | DepMap | Descartes | 0.03 | 0.29 |
| SCAP | -0.0001663 | 8097 | GTEx | DepMap | Descartes | 0.17 | 11.48 |
| BAIAP2L1 | -0.0001680 | 8148 | GTEx | DepMap | Descartes | 0.00 | 0.40 |
| DHCR7 | -0.0001832 | 8525 | GTEx | DepMap | Descartes | 0.09 | 7.19 |
| DHCR24 | -0.0001966 | 8825 | GTEx | DepMap | Descartes | 0.04 | 2.72 |
| GSTA4 | -0.0002740 | 10220 | GTEx | DepMap | Descartes | 0.06 | 6.02 |
| JAKMIP2 | -0.0002959 | 10530 | GTEx | DepMap | Descartes | 0.05 | 0.58 |
| PDE10A | -0.0003084 | 10695 | GTEx | DepMap | Descartes | 0.02 | 0.39 |
| MSMO1 | -0.0003131 | 10738 | GTEx | DepMap | Descartes | 0.16 | 18.68 |
| SLC1A2 | -0.0003330 | 10950 | GTEx | DepMap | Descartes | 0.04 | 0.80 |
| HMGCR | -0.0003531 | 11160 | GTEx | DepMap | Descartes | 0.20 | 12.78 |
Descartes chromaffin markers
Top 50 marker genes of chromaffin cells in the Decartes fetal adrenal single cell map (https://atlas.brotmanbaty.org/bbi/human-gene-expression-during-development/cell/chromaffin/in/adrenal)
Wilcoxon ranksum test P-value for gene set overrepresentation: 1.00e+00
Mean rank of genes in gene set: 9464.12
Median rank of genes in gene set: 10242
Rank on gene expression program of top 30 genes in gene set:
| Genes | Weight | Rank | GTEx | DepMap | Descartes | Mean.Counts | Mean.TPM |
|---|---|---|---|---|---|---|---|
| RYR2 | 0.0001326 | 2283 | GTEx | DepMap | Descartes | 0.08 | 3.84 |
| REEP1 | -0.0000338 | 4449 | GTEx | DepMap | Descartes | 0.07 | 5.50 |
| HS3ST5 | -0.0000472 | 4787 | GTEx | DepMap | Descartes | 0.03 | 0.90 |
| ANKFN1 | -0.0000646 | 5258 | GTEx | DepMap | Descartes | 0.00 | 0.16 |
| EPHA6 | -0.0001050 | 6422 | GTEx | DepMap | Descartes | 0.00 | 0.00 |
| KCNB2 | -0.0001132 | 6670 | GTEx | DepMap | Descartes | 0.00 | 0.00 |
| ALK | -0.0001153 | 6723 | GTEx | DepMap | Descartes | 0.02 | 2.04 |
| GAL | -0.0001266 | 7047 | GTEx | DepMap | Descartes | 0.01 | 2.13 |
| PLXNA4 | -0.0001475 | 7626 | GTEx | DepMap | Descartes | 0.00 | 0.10 |
| TMEFF2 | -0.0001528 | 7768 | GTEx | DepMap | Descartes | 0.03 | 0.76 |
| MAB21L2 | -0.0001679 | 8147 | GTEx | DepMap | Descartes | 0.04 | 2.20 |
| PTCHD1 | -0.0001737 | 8302 | GTEx | DepMap | Descartes | 0.06 | 1.39 |
| RPH3A | -0.0001863 | 8590 | GTEx | DepMap | Descartes | 0.01 | 0.21 |
| IL7 | -0.0001927 | 8744 | GTEx | DepMap | Descartes | 0.02 | 2.33 |
| SLC44A5 | -0.0002011 | 8902 | GTEx | DepMap | Descartes | 0.00 | 0.00 |
| EYA4 | -0.0002146 | 9168 | GTEx | DepMap | Descartes | 0.01 | 0.65 |
| NTRK1 | -0.0002193 | 9262 | GTEx | DepMap | Descartes | 0.00 | 0.00 |
| EYA1 | -0.0002479 | 9796 | GTEx | DepMap | Descartes | 0.00 | 0.00 |
| FAT3 | -0.0002659 | 10090 | GTEx | DepMap | Descartes | 0.00 | 0.04 |
| GREM1 | -0.0002753 | 10240 | GTEx | DepMap | Descartes | 0.03 | 0.27 |
| RBFOX1 | -0.0002755 | 10242 | GTEx | DepMap | Descartes | 0.01 | 0.21 |
| CNTFR | -0.0002769 | 10266 | GTEx | DepMap | Descartes | 0.00 | 0.09 |
| ELAVL2 | -0.0002789 | 10293 | GTEx | DepMap | Descartes | 0.01 | 0.46 |
| NPY | -0.0002837 | 10367 | GTEx | DepMap | Descartes | 0.30 | 111.20 |
| CNKSR2 | -0.0003004 | 10600 | GTEx | DepMap | Descartes | 0.00 | 0.44 |
| TMEM132C | -0.0003213 | 10820 | GTEx | DepMap | Descartes | 0.00 | 0.00 |
| GAP43 | -0.0003234 | 10845 | GTEx | DepMap | Descartes | 0.37 | 40.84 |
| ISL1 | -0.0003416 | 11043 | GTEx | DepMap | Descartes | 0.04 | 2.57 |
| CCND1 | -0.0003458 | 11092 | GTEx | DepMap | Descartes | 0.66 | 37.70 |
| MARCH11 | -0.0003645 | 11254 | GTEx | DepMap | Descartes | 0.00 | NA |
Descartes Vascular_endothelial markers
Top 50 marker genes of Vascular_endothelial cells in the Decartes fetal adrenal single cell map (https://atlas.brotmanbaty.org/bbi/human-gene-expression-during-development/cell/vascular_endothelial/in/adrenal)
Wilcoxon ranksum test P-value for gene set overrepresentation: 9.74e-01
Mean rank of genes in gene set: 7420.03
Median rank of genes in gene set: 7210
Rank on gene expression program of top 30 genes in gene set:
| Genes | Weight | Rank | GTEx | DepMap | Descartes | Mean.Counts | Mean.TPM |
|---|---|---|---|---|---|---|---|
| CRHBP | 0.0013012 | 291 | GTEx | DepMap | Descartes | 0.12 | 34.00 |
| PLVAP | 0.0000113 | 3624 | GTEx | DepMap | Descartes | 0.51 | 39.58 |
| SHE | 0.0000048 | 3716 | GTEx | DepMap | Descartes | 0.09 | 3.04 |
| BTNL9 | -0.0000217 | 4184 | GTEx | DepMap | Descartes | 0.01 | 0.79 |
| HYAL2 | -0.0000302 | 4366 | GTEx | DepMap | Descartes | 0.09 | 5.41 |
| FLT4 | -0.0000635 | 5226 | GTEx | DepMap | Descartes | 0.03 | 1.69 |
| EHD3 | -0.0000661 | 5308 | GTEx | DepMap | Descartes | 0.03 | 1.74 |
| CEACAM1 | -0.0000841 | 5837 | GTEx | DepMap | Descartes | 0.04 | 2.09 |
| CYP26B1 | -0.0000927 | 6088 | GTEx | DepMap | Descartes | 0.02 | 3.68 |
| IRX3 | -0.0001052 | 6425 | GTEx | DepMap | Descartes | 0.01 | 1.24 |
| F8 | -0.0001128 | 6659 | GTEx | DepMap | Descartes | 0.04 | 0.74 |
| NR5A2 | -0.0001135 | 6679 | GTEx | DepMap | Descartes | 0.00 | 0.23 |
| NOTCH4 | -0.0001142 | 6695 | GTEx | DepMap | Descartes | 0.08 | 2.24 |
| TEK | -0.0001153 | 6725 | GTEx | DepMap | Descartes | 0.02 | 2.35 |
| ROBO4 | -0.0001189 | 6830 | GTEx | DepMap | Descartes | 0.08 | 3.84 |
| KANK3 | -0.0001195 | 6848 | GTEx | DepMap | Descartes | 0.01 | 1.73 |
| CLDN5 | -0.0001271 | 7055 | GTEx | DepMap | Descartes | 0.07 | 4.11 |
| NPR1 | -0.0001273 | 7059 | GTEx | DepMap | Descartes | 0.01 | 0.30 |
| CHRM3 | -0.0001317 | 7183 | GTEx | DepMap | Descartes | 0.00 | 0.06 |
| ESM1 | -0.0001337 | 7237 | GTEx | DepMap | Descartes | 0.01 | 0.36 |
| TIE1 | -0.0001348 | 7263 | GTEx | DepMap | Descartes | 0.15 | 6.84 |
| RAMP2 | -0.0001470 | 7607 | GTEx | DepMap | Descartes | 0.04 | 11.53 |
| KDR | -0.0001473 | 7621 | GTEx | DepMap | Descartes | 0.03 | 0.54 |
| GALNT15 | -0.0001611 | 7978 | GTEx | DepMap | Descartes | 0.03 | NA |
| SLCO2A1 | -0.0001664 | 8098 | GTEx | DepMap | Descartes | 0.06 | 2.38 |
| PODXL | -0.0001747 | 8326 | GTEx | DepMap | Descartes | 0.07 | 2.57 |
| MMRN2 | -0.0001951 | 8792 | GTEx | DepMap | Descartes | 0.04 | 2.23 |
| RASIP1 | -0.0001999 | 8882 | GTEx | DepMap | Descartes | 0.04 | 2.95 |
| MYRIP | -0.0002228 | 9326 | GTEx | DepMap | Descartes | 0.03 | 0.90 |
| CDH5 | -0.0002366 | 9596 | GTEx | DepMap | Descartes | 0.06 | 2.04 |
Descartes stromal markers
Top 50 marker genes of stromal cells in the Decartes fetal adrenal single cell map (https://atlas.brotmanbaty.org/bbi/human-gene-expression-during-development/cell/stromal/in/adrenal)
Wilcoxon ranksum test P-value for gene set overrepresentation: 1.00e+00
Mean rank of genes in gene set: 10103.16
Median rank of genes in gene set: 10903
Rank on gene expression program of top 30 genes in gene set:
| Genes | Weight | Rank | GTEx | DepMap | Descartes | Mean.Counts | Mean.TPM |
|---|---|---|---|---|---|---|---|
| LAMC3 | -0.0000137 | 4020 | GTEx | DepMap | Descartes | 0.01 | 0.37 |
| RSPO3 | -0.0000359 | 4505 | GTEx | DepMap | Descartes | 0.00 | NA |
| ITGA11 | -0.0000424 | 4661 | GTEx | DepMap | Descartes | 0.06 | 0.88 |
| GAS2 | -0.0000669 | 5349 | GTEx | DepMap | Descartes | 0.00 | 0.00 |
| DKK2 | -0.0000841 | 5836 | GTEx | DepMap | Descartes | 0.01 | 1.80 |
| POSTN | -0.0001381 | 7361 | GTEx | DepMap | Descartes | 0.06 | 4.32 |
| LRRC17 | -0.0001505 | 7706 | GTEx | DepMap | Descartes | 0.00 | 0.29 |
| CLDN11 | -0.0001578 | 7892 | GTEx | DepMap | Descartes | 0.03 | 3.99 |
| ABCC9 | -0.0001765 | 8357 | GTEx | DepMap | Descartes | 0.03 | 0.73 |
| GLI2 | -0.0001812 | 8478 | GTEx | DepMap | Descartes | 0.01 | 0.48 |
| HHIP | -0.0002035 | 8948 | GTEx | DepMap | Descartes | 0.01 | 0.21 |
| ADAMTSL3 | -0.0002043 | 8967 | GTEx | DepMap | Descartes | 0.02 | 1.09 |
| EDNRA | -0.0002251 | 9382 | GTEx | DepMap | Descartes | 0.03 | 1.74 |
| SFRP2 | -0.0002390 | 9644 | GTEx | DepMap | Descartes | 0.20 | 21.92 |
| FREM1 | -0.0002403 | 9667 | GTEx | DepMap | Descartes | 0.00 | 0.59 |
| ADAMTS2 | -0.0002498 | 9828 | GTEx | DepMap | Descartes | 0.16 | 3.31 |
| PCDH18 | -0.0002500 | 9830 | GTEx | DepMap | Descartes | 0.01 | 0.28 |
| ACTA2 | -0.0002664 | 10101 | GTEx | DepMap | Descartes | 0.36 | 54.98 |
| CD248 | -0.0002873 | 10414 | GTEx | DepMap | Descartes | 0.02 | 1.49 |
| IGFBP3 | -0.0003050 | 10660 | GTEx | DepMap | Descartes | 0.03 | 1.56 |
| COL27A1 | -0.0003258 | 10875 | GTEx | DepMap | Descartes | 0.03 | 0.85 |
| SCARA5 | -0.0003274 | 10891 | GTEx | DepMap | Descartes | 0.04 | 2.64 |
| PRICKLE1 | -0.0003293 | 10915 | GTEx | DepMap | Descartes | 0.03 | 2.03 |
| LOX | -0.0003341 | 10970 | GTEx | DepMap | Descartes | 0.07 | 3.28 |
| COL1A1 | -0.0003441 | 11069 | GTEx | DepMap | Descartes | 17.73 | 334.41 |
| ELN | -0.0003511 | 11137 | GTEx | DepMap | Descartes | 0.18 | 12.25 |
| PAMR1 | -0.0003591 | 11204 | GTEx | DepMap | Descartes | 0.02 | 3.56 |
| ABCA6 | -0.0003599 | 11214 | GTEx | DepMap | Descartes | 0.06 | 1.13 |
| BICC1 | -0.0004176 | 11649 | GTEx | DepMap | Descartes | 0.03 | 1.71 |
| COL12A1 | -0.0004389 | 11776 | GTEx | DepMap | Descartes | 0.15 | 2.64 |
Descartes sympathoblasts markers
Top 50 marker genes of sympathoblasts cells in the Decartes fetal adrenal single cell map (https://atlas.brotmanbaty.org/bbi/human-gene-expression-during-development/cell/sympathoblasts/in/adrenal)
Wilcoxon ranksum test P-value for gene set overrepresentation: 9.31e-01
Mean rank of genes in gene set: 7145.47
Median rank of genes in gene set: 7141.5
Rank on gene expression program of top 30 genes in gene set:
| Genes | Weight | Rank | GTEx | DepMap | Descartes | Mean.Counts | Mean.TPM |
|---|---|---|---|---|---|---|---|
| GALNTL6 | 0.0002663 | 1539 | GTEx | DepMap | Descartes | 0.02 | 0.54 |
| TIAM1 | 0.0001209 | 2383 | GTEx | DepMap | Descartes | 0.66 | 22.88 |
| CCSER1 | 0.0000655 | 2918 | GTEx | DepMap | Descartes | 0.09 | NA |
| ST18 | 0.0000581 | 3004 | GTEx | DepMap | Descartes | 0.12 | 3.42 |
| SLC24A2 | 0.0000147 | 3570 | GTEx | DepMap | Descartes | 0.00 | 0.07 |
| GRID2 | -0.0000115 | 3982 | GTEx | DepMap | Descartes | 0.01 | 0.33 |
| GRM7 | -0.0000188 | 4119 | GTEx | DepMap | Descartes | 0.00 | 0.20 |
| KSR2 | -0.0000240 | 4231 | GTEx | DepMap | Descartes | 0.01 | 0.09 |
| CDH18 | -0.0000329 | 4424 | GTEx | DepMap | Descartes | 0.00 | 0.00 |
| SPOCK3 | -0.0000482 | 4813 | GTEx | DepMap | Descartes | 0.01 | 0.59 |
| PACRG | -0.0000501 | 4868 | GTEx | DepMap | Descartes | 0.03 | 2.20 |
| SLC35F3 | -0.0000611 | 5172 | GTEx | DepMap | Descartes | 0.00 | 0.00 |
| TBX20 | -0.0000818 | 5767 | GTEx | DepMap | Descartes | 0.00 | 0.00 |
| PENK | -0.0001107 | 6588 | GTEx | DepMap | Descartes | 0.00 | 0.00 |
| SORCS3 | -0.0001123 | 6643 | GTEx | DepMap | Descartes | 0.00 | 0.00 |
| ARC | -0.0001131 | 6666 | GTEx | DepMap | Descartes | 0.33 | 27.75 |
| MGAT4C | -0.0001190 | 6833 | GTEx | DepMap | Descartes | 0.01 | 0.13 |
| AGBL4 | -0.0001209 | 6891 | GTEx | DepMap | Descartes | 0.00 | 0.00 |
| CDH12 | -0.0001257 | 7018 | GTEx | DepMap | Descartes | 0.00 | 0.00 |
| LAMA3 | -0.0001349 | 7265 | GTEx | DepMap | Descartes | 0.00 | 0.45 |
| KCTD16 | -0.0001424 | 7488 | GTEx | DepMap | Descartes | 0.03 | 0.37 |
| PCSK2 | -0.0001490 | 7660 | GTEx | DepMap | Descartes | 0.01 | 1.14 |
| TENM1 | -0.0001560 | 7840 | GTEx | DepMap | Descartes | 0.05 | NA |
| FGF14 | -0.0001659 | 8082 | GTEx | DepMap | Descartes | 0.00 | 0.00 |
| EML6 | -0.0001743 | 8321 | GTEx | DepMap | Descartes | 0.01 | 0.16 |
| SLC18A1 | -0.0001873 | 8619 | GTEx | DepMap | Descartes | 0.01 | 1.09 |
| NTNG1 | -0.0001876 | 8622 | GTEx | DepMap | Descartes | 0.01 | 0.33 |
| CNTN3 | -0.0001896 | 8675 | GTEx | DepMap | Descartes | 0.00 | 0.00 |
| PCSK1N | -0.0002226 | 9324 | GTEx | DepMap | Descartes | 0.18 | 38.58 |
| UNC80 | -0.0002309 | 9492 | GTEx | DepMap | Descartes | 0.03 | 0.72 |
Descartes erythroblasts markers
Top 50 marker genes of erythroblasts cells in the Decartes fetal adrenal single cell map (https://atlas.brotmanbaty.org/bbi/human-gene-expression-during-development/cell/erythroblasts/in/adrenal)
Wilcoxon ranksum test P-value for gene set overrepresentation: 4.99e-01
Mean rank of genes in gene set: 6273.21
Median rank of genes in gene set: 6016
Rank on gene expression program of top 30 genes in gene set:
| Genes | Weight | Rank | GTEx | DepMap | Descartes | Mean.Counts | Mean.TPM |
|---|---|---|---|---|---|---|---|
| BLVRB | 0.0032852 | 66 | GTEx | DepMap | Descartes | 1.03 | 209.57 |
| CAT | 0.0008770 | 478 | GTEx | DepMap | Descartes | 0.76 | 86.19 |
| GCLC | 0.0003950 | 1122 | GTEx | DepMap | Descartes | 0.47 | 28.59 |
| FECH | 0.0002927 | 1435 | GTEx | DepMap | Descartes | 0.07 | 2.71 |
| SPECC1 | 0.0002832 | 1466 | GTEx | DepMap | Descartes | 0.20 | 5.18 |
| GYPC | 0.0001767 | 1998 | GTEx | DepMap | Descartes | 0.86 | 135.68 |
| ABCB10 | 0.0001478 | 2169 | GTEx | DepMap | Descartes | 0.14 | 8.69 |
| XPO7 | 0.0000545 | 3047 | GTEx | DepMap | Descartes | 0.21 | 10.11 |
| SPTB | 0.0000518 | 3085 | GTEx | DepMap | Descartes | 0.02 | 0.70 |
| TRAK2 | 0.0000512 | 3088 | GTEx | DepMap | Descartes | 0.16 | 7.74 |
| SLC25A21 | -0.0000058 | 3892 | GTEx | DepMap | Descartes | 0.00 | 0.00 |
| RHD | -0.0000310 | 4386 | GTEx | DepMap | Descartes | 0.00 | 0.00 |
| SLC4A1 | -0.0000503 | 4873 | GTEx | DepMap | Descartes | 0.01 | 0.40 |
| ALAS2 | -0.0000634 | 5224 | GTEx | DepMap | Descartes | 0.00 | 0.00 |
| TMCC2 | -0.0000903 | 6016 | GTEx | DepMap | Descartes | 0.03 | 1.71 |
| TFR2 | -0.0001354 | 7275 | GTEx | DepMap | Descartes | 0.01 | 1.04 |
| CPOX | -0.0001421 | 7483 | GTEx | DepMap | Descartes | 0.10 | 11.34 |
| SNCA | -0.0001650 | 8066 | GTEx | DepMap | Descartes | 0.12 | 9.14 |
| RGS6 | -0.0001792 | 8428 | GTEx | DepMap | Descartes | 0.00 | 0.00 |
| SOX6 | -0.0001911 | 8706 | GTEx | DepMap | Descartes | 0.03 | 1.41 |
| SELENBP1 | -0.0002287 | 9435 | GTEx | DepMap | Descartes | 0.02 | 2.26 |
| MICAL2 | -0.0002511 | 9846 | GTEx | DepMap | Descartes | 0.21 | 8.65 |
| ANK1 | -0.0002653 | 10082 | GTEx | DepMap | Descartes | 0.01 | 0.12 |
| MARCH3 | -0.0002843 | 10379 | GTEx | DepMap | Descartes | 0.10 | NA |
| EPB41 | -0.0003904 | 11479 | GTEx | DepMap | Descartes | 0.22 | 9.76 |
| TSPAN5 | -0.0003993 | 11541 | GTEx | DepMap | Descartes | 0.07 | 3.51 |
| DENND4A | -0.0005074 | 12078 | GTEx | DepMap | Descartes | 0.92 | 25.81 |
| SLC25A37 | -0.0006596 | 12375 | GTEx | DepMap | Descartes | 0.64 | 35.62 |
| RAPGEF2 | -0.0006818 | 12405 | GTEx | DepMap | Descartes | 1.11 | 32.36 |
| NA | NA | NA | NA | NA | NA | NA | NA |
Descartes myeloid markers
Top 50 marker genes of myeloid cells in the Decartes fetal adrenal single cell map (https://atlas.brotmanbaty.org/bbi/human-gene-expression-during-development/cell/myeloid/in/adrenal)
Wilcoxon ranksum test P-value for gene set overrepresentation: 2.38e-24
Mean rank of genes in gene set: 339.79
Median rank of genes in gene set: 69.5
Rank on gene expression program of top 30 genes in gene set:
| Genes | Weight | Rank | GTEx | DepMap | Descartes | Mean.Counts | Mean.TPM |
|---|---|---|---|---|---|---|---|
| LGMN | 0.0084108 | 3 | GTEx | DepMap | Descartes | 7.74 | 951.93 |
| CTSB | 0.0081959 | 4 | GTEx | DepMap | Descartes | 24.48 | 1833.57 |
| CTSD | 0.0080343 | 7 | GTEx | DepMap | Descartes | 19.69 | 2418.32 |
| CD163 | 0.0074670 | 11 | GTEx | DepMap | Descartes | 4.24 | 245.25 |
| SLCO2B1 | 0.0072832 | 12 | GTEx | DepMap | Descartes | 2.32 | 130.09 |
| CSF1R | 0.0069906 | 13 | GTEx | DepMap | Descartes | 3.69 | 298.03 |
| MS4A4A | 0.0066294 | 15 | GTEx | DepMap | Descartes | 2.58 | 495.21 |
| CTSS | 0.0062604 | 18 | GTEx | DepMap | Descartes | 9.08 | 567.56 |
| CD14 | 0.0061947 | 19 | GTEx | DepMap | Descartes | 4.69 | 1018.07 |
| CPVL | 0.0059359 | 22 | GTEx | DepMap | Descartes | 3.99 | 467.94 |
| CD74 | 0.0055652 | 25 | GTEx | DepMap | Descartes | 174.08 | 14110.95 |
| CD163L1 | 0.0055483 | 26 | GTEx | DepMap | Descartes | 0.66 | 54.05 |
| ADAP2 | 0.0051791 | 30 | GTEx | DepMap | Descartes | 1.43 | 204.01 |
| FGL2 | 0.0050760 | 31 | GTEx | DepMap | Descartes | 6.40 | 400.16 |
| CYBB | 0.0048465 | 34 | GTEx | DepMap | Descartes | 3.33 | 209.94 |
| CTSC | 0.0048188 | 36 | GTEx | DepMap | Descartes | 4.31 | 237.27 |
| MSR1 | 0.0040519 | 46 | GTEx | DepMap | Descartes | 2.37 | 226.77 |
| MERTK | 0.0039596 | 47 | GTEx | DepMap | Descartes | 0.54 | 35.26 |
| SLC1A3 | 0.0033010 | 65 | GTEx | DepMap | Descartes | 1.22 | 79.51 |
| MARCH1 | 0.0030426 | 74 | GTEx | DepMap | Descartes | 0.90 | NA |
| FGD2 | 0.0025793 | 99 | GTEx | DepMap | Descartes | 0.54 | 30.14 |
| CST3 | 0.0022685 | 131 | GTEx | DepMap | Descartes | 20.35 | 1502.23 |
| HCK | 0.0021135 | 144 | GTEx | DepMap | Descartes | 2.31 | 267.02 |
| ABCA1 | 0.0021135 | 145 | GTEx | DepMap | Descartes | 3.59 | 95.33 |
| ITPR2 | 0.0017438 | 187 | GTEx | DepMap | Descartes | 1.09 | 28.51 |
| RGL1 | 0.0016938 | 197 | GTEx | DepMap | Descartes | 0.83 | 53.95 |
| AXL | 0.0016810 | 199 | GTEx | DepMap | Descartes | 1.49 | 91.55 |
| SLC9A9 | 0.0014067 | 260 | GTEx | DepMap | Descartes | 0.65 | 44.38 |
| WWP1 | 0.0013083 | 289 | GTEx | DepMap | Descartes | 0.37 | 25.13 |
| FMN1 | 0.0011585 | 331 | GTEx | DepMap | Descartes | 0.44 | 11.53 |
Descartes Schwann markers
Top 50 marker genes of Schwann cells in the Decartes fetal adrenal single cell map (https://atlas.brotmanbaty.org/bbi/human-gene-expression-during-development/cell/schwann/in/adrenal)
Wilcoxon ranksum test P-value for gene set overrepresentation: 1.00e+00
Mean rank of genes in gene set: 8494.82
Median rank of genes in gene set: 9084
Rank on gene expression program of top 30 genes in gene set:
| Genes | Weight | Rank | GTEx | DepMap | Descartes | Mean.Counts | Mean.TPM |
|---|---|---|---|---|---|---|---|
| KCTD12 | 0.0019091 | 162 | GTEx | DepMap | Descartes | 3.33 | 167.66 |
| MARCKS | 0.0002220 | 1746 | GTEx | DepMap | Descartes | 10.01 | 593.29 |
| GAS7 | 0.0001078 | 2505 | GTEx | DepMap | Descartes | 0.94 | 31.36 |
| PMP22 | 0.0000697 | 2874 | GTEx | DepMap | Descartes | 0.81 | 105.18 |
| STARD13 | 0.0000252 | 3411 | GTEx | DepMap | Descartes | 0.22 | 11.96 |
| IL1RAPL2 | -0.0000425 | 4662 | GTEx | DepMap | Descartes | 0.00 | 0.00 |
| MDGA2 | -0.0000743 | 5557 | GTEx | DepMap | Descartes | 0.00 | 0.42 |
| PTPRZ1 | -0.0000961 | 6197 | GTEx | DepMap | Descartes | 0.01 | 0.22 |
| TRPM3 | -0.0000967 | 6211 | GTEx | DepMap | Descartes | 0.01 | 0.29 |
| LRRTM4 | -0.0001095 | 6543 | GTEx | DepMap | Descartes | 0.00 | 0.00 |
| MPZ | -0.0001244 | 6993 | GTEx | DepMap | Descartes | 0.04 | 6.91 |
| IL1RAPL1 | -0.0001246 | 6996 | GTEx | DepMap | Descartes | 0.00 | 0.00 |
| COL25A1 | -0.0001344 | 7253 | GTEx | DepMap | Descartes | 0.00 | 0.00 |
| ERBB4 | -0.0001366 | 7314 | GTEx | DepMap | Descartes | 0.00 | 0.00 |
| ERBB3 | -0.0001512 | 7729 | GTEx | DepMap | Descartes | 0.03 | 1.08 |
| XKR4 | -0.0001692 | 8188 | GTEx | DepMap | Descartes | 0.04 | 0.38 |
| ADAMTS5 | -0.0001697 | 8203 | GTEx | DepMap | Descartes | 0.01 | 0.36 |
| HMGA2 | -0.0001730 | 8284 | GTEx | DepMap | Descartes | 0.00 | 0.22 |
| PAG1 | -0.0001869 | 8606 | GTEx | DepMap | Descartes | 0.90 | 19.60 |
| PTN | -0.0001913 | 8713 | GTEx | DepMap | Descartes | 0.06 | 6.66 |
| SLC35F1 | -0.0001943 | 8771 | GTEx | DepMap | Descartes | 0.01 | 0.80 |
| PLCE1 | -0.0002052 | 8989 | GTEx | DepMap | Descartes | 0.02 | 1.29 |
| NRXN3 | -0.0002152 | 9179 | GTEx | DepMap | Descartes | 0.00 | 0.04 |
| GRIK3 | -0.0002155 | 9191 | GTEx | DepMap | Descartes | 0.00 | 0.12 |
| DST | -0.0002232 | 9336 | GTEx | DepMap | Descartes | 0.90 | 9.27 |
| EDNRB | -0.0002302 | 9468 | GTEx | DepMap | Descartes | 0.09 | 4.92 |
| SORCS1 | -0.0002430 | 9717 | GTEx | DepMap | Descartes | 0.04 | 1.22 |
| PLP1 | -0.0002532 | 9880 | GTEx | DepMap | Descartes | 0.03 | 2.72 |
| FIGN | -0.0002592 | 9979 | GTEx | DepMap | Descartes | 0.03 | 0.52 |
| GFRA3 | -0.0002593 | 9981 | GTEx | DepMap | Descartes | 0.04 | 6.20 |
Descartes Megakaryocytes markers
Top 50 marker genes of Megakaryocytes cells in the Decartes fetal adrenal single cell map (https://atlas.brotmanbaty.org/bbi/human-gene-expression-during-development/cell/megakaryocytes/in/adrenal)
Wilcoxon ranksum test P-value for gene set overrepresentation: 7.24e-01
Mean rank of genes in gene set: 6595.87
Median rank of genes in gene set: 6941
Rank on gene expression program of top 30 genes in gene set:
| Genes | Weight | Rank | GTEx | DepMap | Descartes | Mean.Counts | Mean.TPM |
|---|---|---|---|---|---|---|---|
| CD84 | 0.0042484 | 41 | GTEx | DepMap | Descartes | 3.49 | 133.38 |
| TMSB4X | 0.0017424 | 188 | GTEx | DepMap | Descartes | 37.63 | 5143.27 |
| ACTB | 0.0014996 | 238 | GTEx | DepMap | Descartes | 36.15 | 3298.74 |
| STON2 | 0.0010896 | 360 | GTEx | DepMap | Descartes | 0.12 | 8.40 |
| FERMT3 | 0.0007978 | 524 | GTEx | DepMap | Descartes | 1.11 | 128.14 |
| TLN1 | 0.0007912 | 533 | GTEx | DepMap | Descartes | 2.91 | 84.98 |
| MCTP1 | 0.0007533 | 567 | GTEx | DepMap | Descartes | 0.66 | 33.65 |
| ZYX | 0.0005364 | 840 | GTEx | DepMap | Descartes | 2.74 | 313.39 |
| PLEK | 0.0004659 | 969 | GTEx | DepMap | Descartes | 7.73 | 694.90 |
| CD9 | 0.0003551 | 1219 | GTEx | DepMap | Descartes | 1.08 | 130.29 |
| LIMS1 | 0.0002874 | 1454 | GTEx | DepMap | Descartes | 3.02 | 165.04 |
| UBASH3B | 0.0002342 | 1679 | GTEx | DepMap | Descartes | 0.54 | 17.31 |
| FLI1 | 0.0001991 | 1867 | GTEx | DepMap | Descartes | 0.26 | 12.76 |
| P2RX1 | 0.0000781 | 2782 | GTEx | DepMap | Descartes | 0.09 | 9.62 |
| TUBB1 | 0.0000537 | 3062 | GTEx | DepMap | Descartes | 0.03 | 1.40 |
| ARHGAP6 | 0.0000300 | 3339 | GTEx | DepMap | Descartes | 0.04 | 2.96 |
| STOM | -0.0000208 | 4158 | GTEx | DepMap | Descartes | 1.84 | 178.07 |
| MMRN1 | -0.0000568 | 5049 | GTEx | DepMap | Descartes | 0.00 | 0.07 |
| RAB27B | -0.0000701 | 5436 | GTEx | DepMap | Descartes | 0.00 | 0.98 |
| TRPC6 | -0.0000742 | 5555 | GTEx | DepMap | Descartes | 0.00 | 0.23 |
| GP1BA | -0.0000800 | 5718 | GTEx | DepMap | Descartes | 0.00 | 0.26 |
| SLC24A3 | -0.0000845 | 5849 | GTEx | DepMap | Descartes | 0.00 | 0.00 |
| ITGA2B | -0.0001226 | 6941 | GTEx | DepMap | Descartes | 0.01 | 0.48 |
| ITGB3 | -0.0001473 | 7614 | GTEx | DepMap | Descartes | 0.00 | 0.00 |
| PRKAR2B | -0.0001683 | 8158 | GTEx | DepMap | Descartes | 0.14 | 11.22 |
| DOK6 | -0.0001756 | 8341 | GTEx | DepMap | Descartes | 0.03 | 0.74 |
| MED12L | -0.0001871 | 8612 | GTEx | DepMap | Descartes | 0.02 | 0.19 |
| ANGPT1 | -0.0002080 | 9048 | GTEx | DepMap | Descartes | 0.01 | 0.45 |
| SPN | -0.0002195 | 9267 | GTEx | DepMap | Descartes | 0.40 | 10.85 |
| INPP4B | -0.0002261 | 9400 | GTEx | DepMap | Descartes | 0.06 | 1.39 |
Descartes Lyphoid markers
Top 50 marker genes of Lyphoid cells in the Decartes fetal adrenal single cell map (https://atlas.brotmanbaty.org/bbi/human-gene-expression-during-development/cell/lymphoid/in/adrenal)
Wilcoxon ranksum test P-value for gene set overrepresentation: 1.00e+00
Mean rank of genes in gene set: 8700
Median rank of genes in gene set: 10598
Rank on gene expression program of top 30 genes in gene set:
| Genes | Weight | Rank | GTEx | DepMap | Descartes | Mean.Counts | Mean.TPM |
|---|---|---|---|---|---|---|---|
| B2M | 0.0014314 | 251 | GTEx | DepMap | Descartes | 61.41 | 7139.16 |
| TMSB10 | 0.0010750 | 366 | GTEx | DepMap | Descartes | 14.67 | 7588.78 |
| RCSD1 | 0.0005242 | 862 | GTEx | DepMap | Descartes | 0.66 | 32.77 |
| CELF2 | 0.0002218 | 1748 | GTEx | DepMap | Descartes | 1.64 | 58.40 |
| SORL1 | 0.0001583 | 2116 | GTEx | DepMap | Descartes | 1.55 | 41.37 |
| LCP1 | 0.0001172 | 2414 | GTEx | DepMap | Descartes | 5.20 | 281.60 |
| EVL | 0.0001036 | 2539 | GTEx | DepMap | Descartes | 1.08 | 89.20 |
| ITPKB | 0.0000533 | 3069 | GTEx | DepMap | Descartes | 1.14 | 47.47 |
| ANKRD44 | 0.0000260 | 3400 | GTEx | DepMap | Descartes | 0.40 | 13.43 |
| ARHGDIB | -0.0000369 | 4529 | GTEx | DepMap | Descartes | 4.59 | 889.19 |
| PLEKHA2 | -0.0000637 | 5237 | GTEx | DepMap | Descartes | 1.14 | 56.92 |
| DOCK10 | -0.0000723 | 5512 | GTEx | DepMap | Descartes | 0.64 | 23.53 |
| ARHGAP15 | -0.0001408 | 7441 | GTEx | DepMap | Descartes | 0.23 | 23.68 |
| RAP1GAP2 | -0.0001671 | 8119 | GTEx | DepMap | Descartes | 0.10 | 3.03 |
| CCND3 | -0.0002092 | 9068 | GTEx | DepMap | Descartes | 0.19 | 15.12 |
| MSN | -0.0002235 | 9344 | GTEx | DepMap | Descartes | 2.34 | 139.16 |
| SCML4 | -0.0002782 | 10286 | GTEx | DepMap | Descartes | 0.04 | 0.87 |
| SKAP1 | -0.0002822 | 10340 | GTEx | DepMap | Descartes | 0.03 | 1.95 |
| MCTP2 | -0.0002878 | 10424 | GTEx | DepMap | Descartes | 0.02 | 0.76 |
| WIPF1 | -0.0002952 | 10522 | GTEx | DepMap | Descartes | 1.50 | 87.49 |
| SAMD3 | -0.0002953 | 10523 | GTEx | DepMap | Descartes | 0.01 | 0.76 |
| IKZF1 | -0.0003056 | 10673 | GTEx | DepMap | Descartes | 0.56 | 23.29 |
| NCALD | -0.0003128 | 10734 | GTEx | DepMap | Descartes | 0.04 | 1.85 |
| SP100 | -0.0003153 | 10763 | GTEx | DepMap | Descartes | 0.85 | 43.47 |
| PTPRC | -0.0003306 | 10928 | GTEx | DepMap | Descartes | 3.74 | 180.83 |
| TOX | -0.0003318 | 10940 | GTEx | DepMap | Descartes | 0.03 | 1.25 |
| MBNL1 | -0.0003723 | 11335 | GTEx | DepMap | Descartes | 1.51 | 55.06 |
| LEF1 | -0.0003811 | 11408 | GTEx | DepMap | Descartes | 0.06 | 4.31 |
| STK39 | -0.0003983 | 11532 | GTEx | DepMap | Descartes | 0.06 | 5.81 |
| PRKCH | -0.0004554 | 11863 | GTEx | DepMap | Descartes | 0.24 | 19.23 |
Below shows the ranks on this GEP for immune marker gene lists curated by CellTypist (https://www.celltypist.org/encyclopedia).
High ranks indicate this gene is a driver of this GEP.
These curated gene list are ranked by P-value (on this GEP) of their constituent genes.
The Mean Count column shows the mean read count in cells scoring highly (H > 50) on this gene expression program.
Macrophages: Macrophages (model markers)
specialised mononuclear phagocytic cells which recognise:
Wilcoxon ranksum test P-value for gene set overrepresentation: 1.69e-03
Mean rank of genes in gene set: 967
Rank on gene expression program of genes in gene set:
| Genes | Weight | Rank | GTEx | DepMap | Decartes | Mean.Counts | Mean.TPM |
|---|---|---|---|---|---|---|---|
| APOE | 0.0095484 | 2 | GTEx | DepMap | Descartes | 34.27 | 7483.78 |
| APOC1 | 0.0080386 | 6 | GTEx | DepMap | Descartes | 8.05 | 2748.16 |
| CD5L | 0.0062905 | 17 | GTEx | DepMap | Descartes | 2.20 | 249.66 |
| FTH1 | -0.0000028 | 3843 | GTEx | DepMap | Descartes | 55.32 | 10530.80 |
ILC precursor: ILC precursor (curated markers)
innate lymphoid cell precursors which give rise to innate lymphoid cells and lack the characteristics of their mature progenies:
Wilcoxon ranksum test P-value for gene set overrepresentation: 4.88e-03
Mean rank of genes in gene set: 870
Rank on gene expression program of genes in gene set:
| Genes | Weight | Rank | GTEx | DepMap | Decartes | Mean.Counts | Mean.TPM |
|---|---|---|---|---|---|---|---|
| LST1 | 0.0024702 | 110 | GTEx | DepMap | Descartes | 1.80 | 232.12 |
| HPN | 0.0003606 | 1210 | GTEx | DepMap | Descartes | 0.10 | 12.23 |
| SCN1B | 0.0003339 | 1290 | GTEx | DepMap | Descartes | 0.44 | 20.50 |
Macrophages: Kupffer cells (curated markers)
resident macrophages in liver under non-inflammatory conditions which line the hepatic sinusoids and are involved in erythrocyte clearance:
Wilcoxon ranksum test P-value for gene set overrepresentation: 8.71e-03
Mean rank of genes in gene set: 184
Rank on gene expression program of genes in gene set:
| Genes | Weight | Rank | GTEx | DepMap | Decartes | Mean.Counts | Mean.TPM |
|---|---|---|---|---|---|---|---|
| CD5L | 0.0062905 | 17 | GTEx | DepMap | Descartes | 2.20 | 249.66 |
| VCAM1 | 0.0011057 | 351 | GTEx | DepMap | Descartes | 0.86 | 47.61 |