Top genes driving this program.
Note: Decartes website is buggy, try refreshing. Also, Decartes fetal adrenal data have been collected at specific time points (89-122 days), all possible cell types of interest may not be represented, do not overinterpret.
The Mean Count column shows the mean read count in cells scoring highly (H > 50) on this gene expression program.
Coactivator for HNF1A-dependent transcription. Regulates the dimerization of homeodomain protein HNF1A and enhances its transcriptional activity (UniProt: P61457)
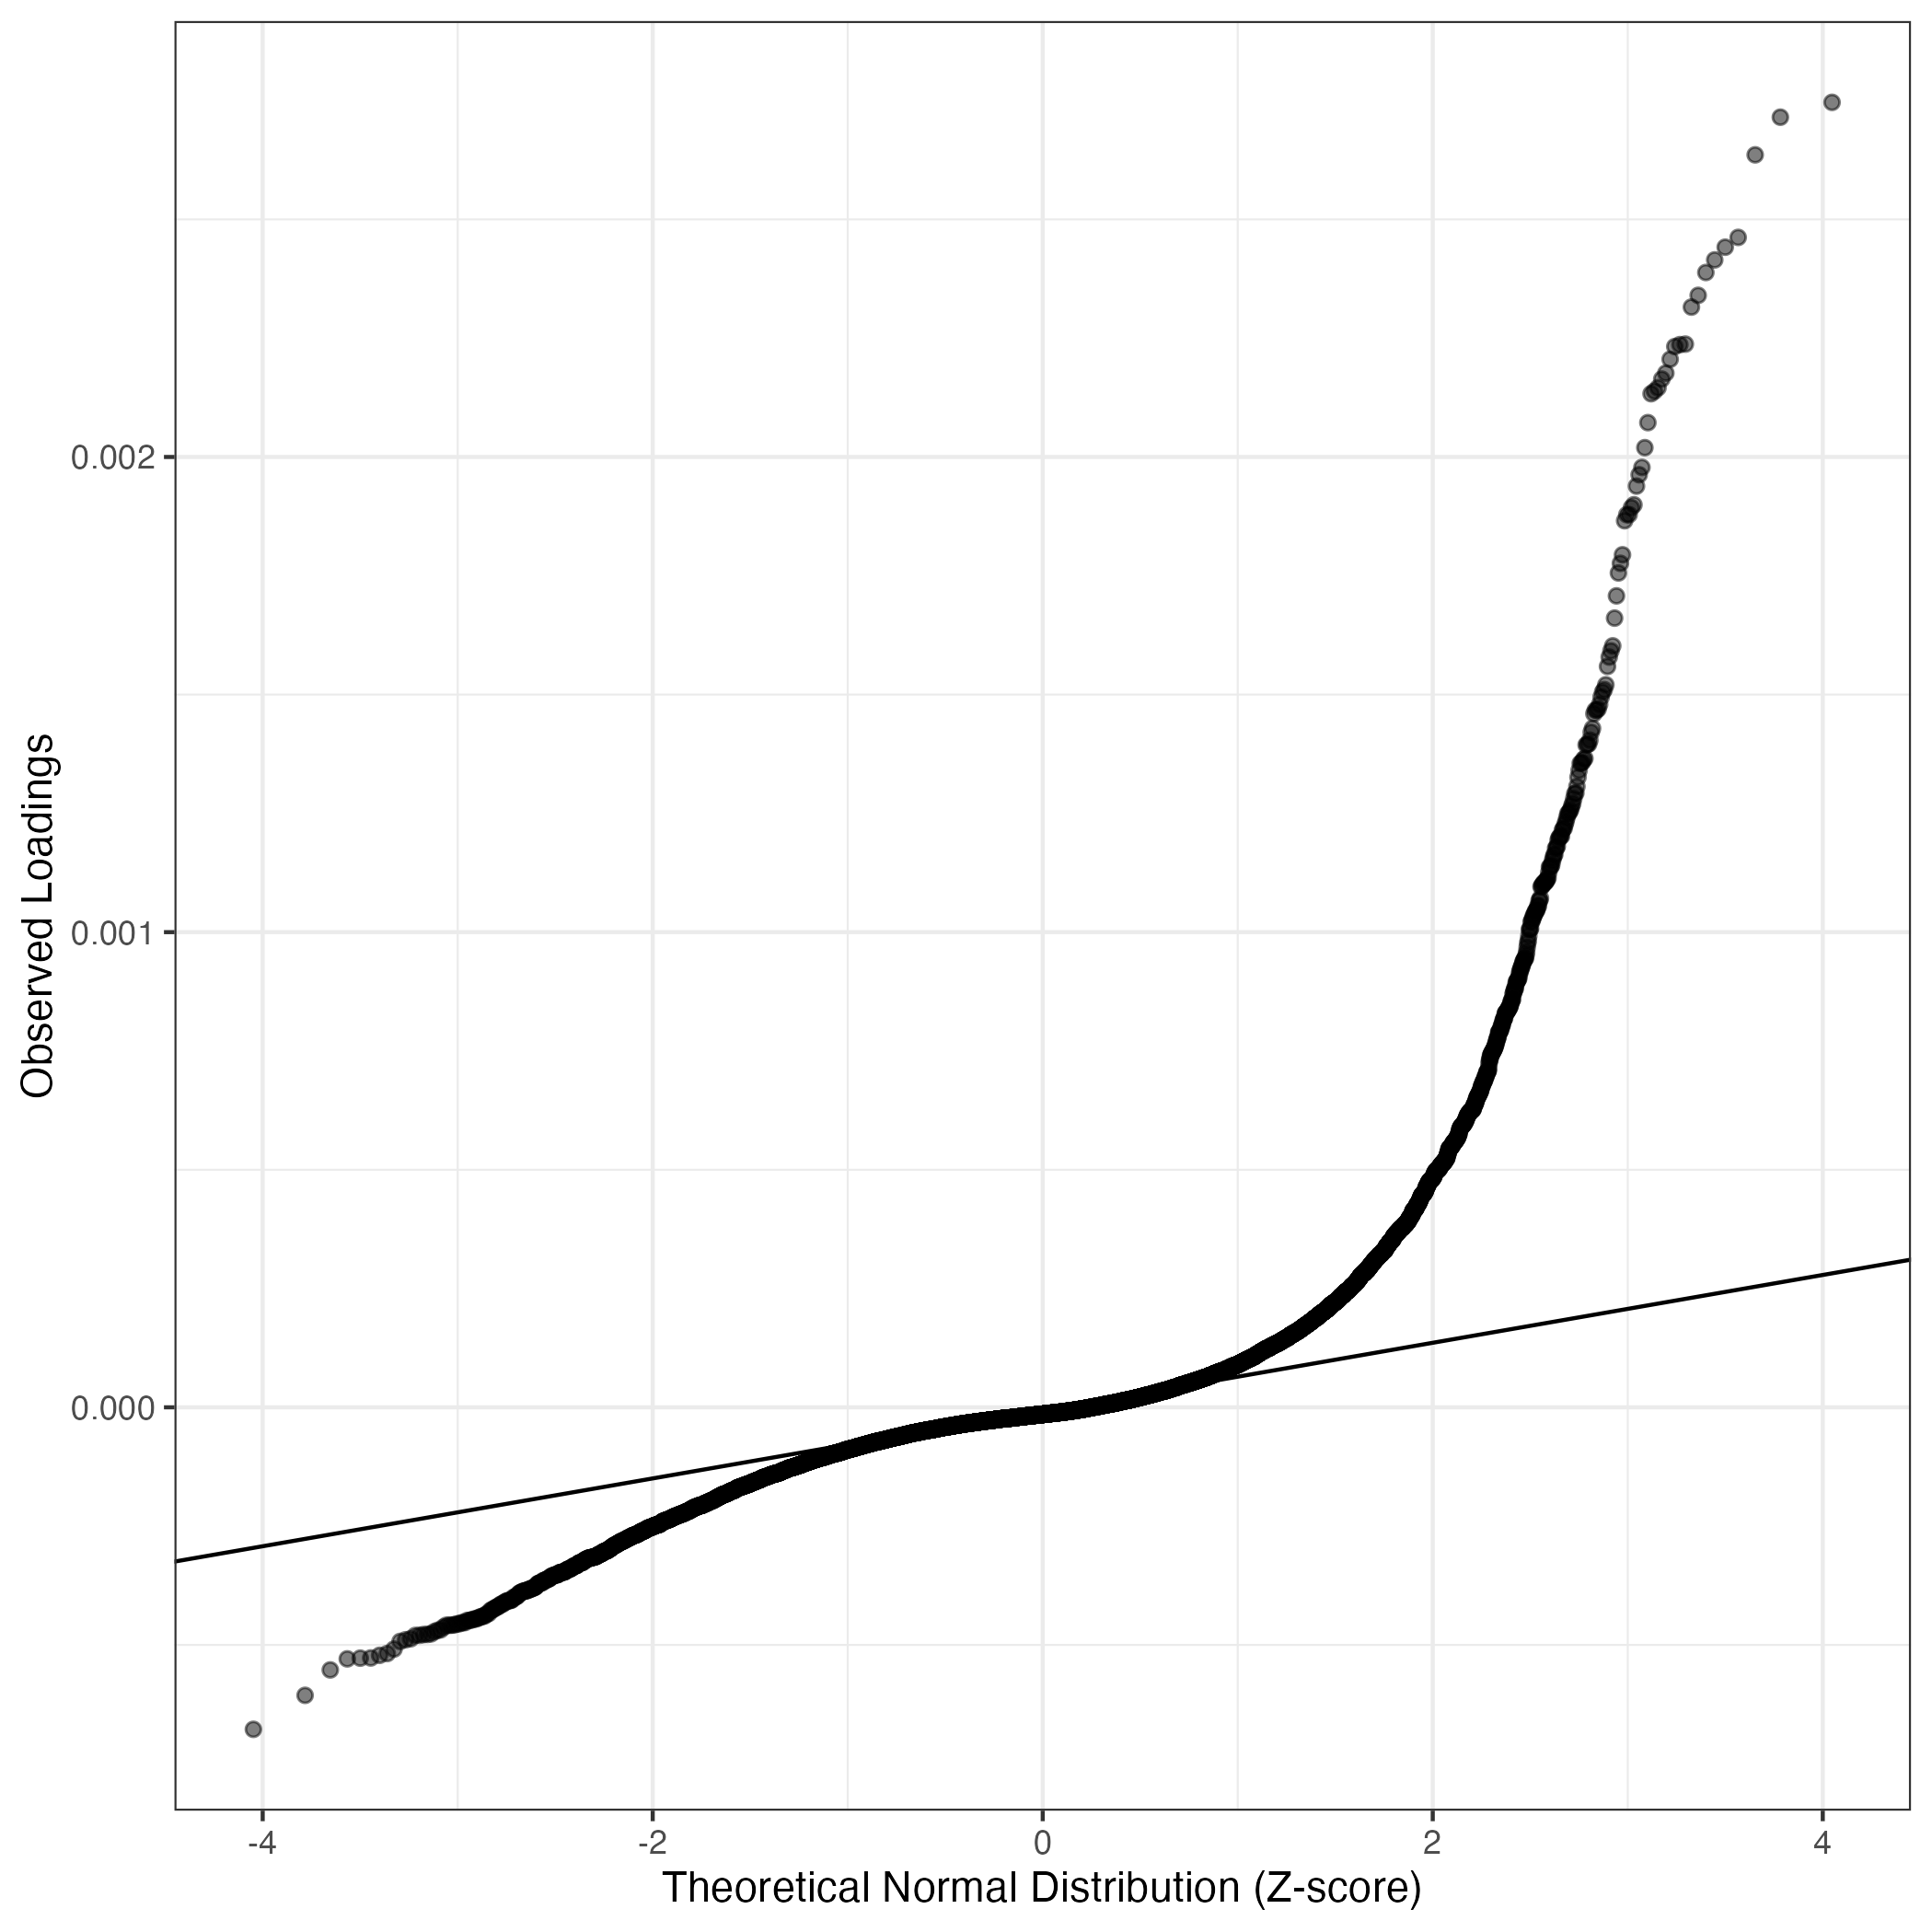
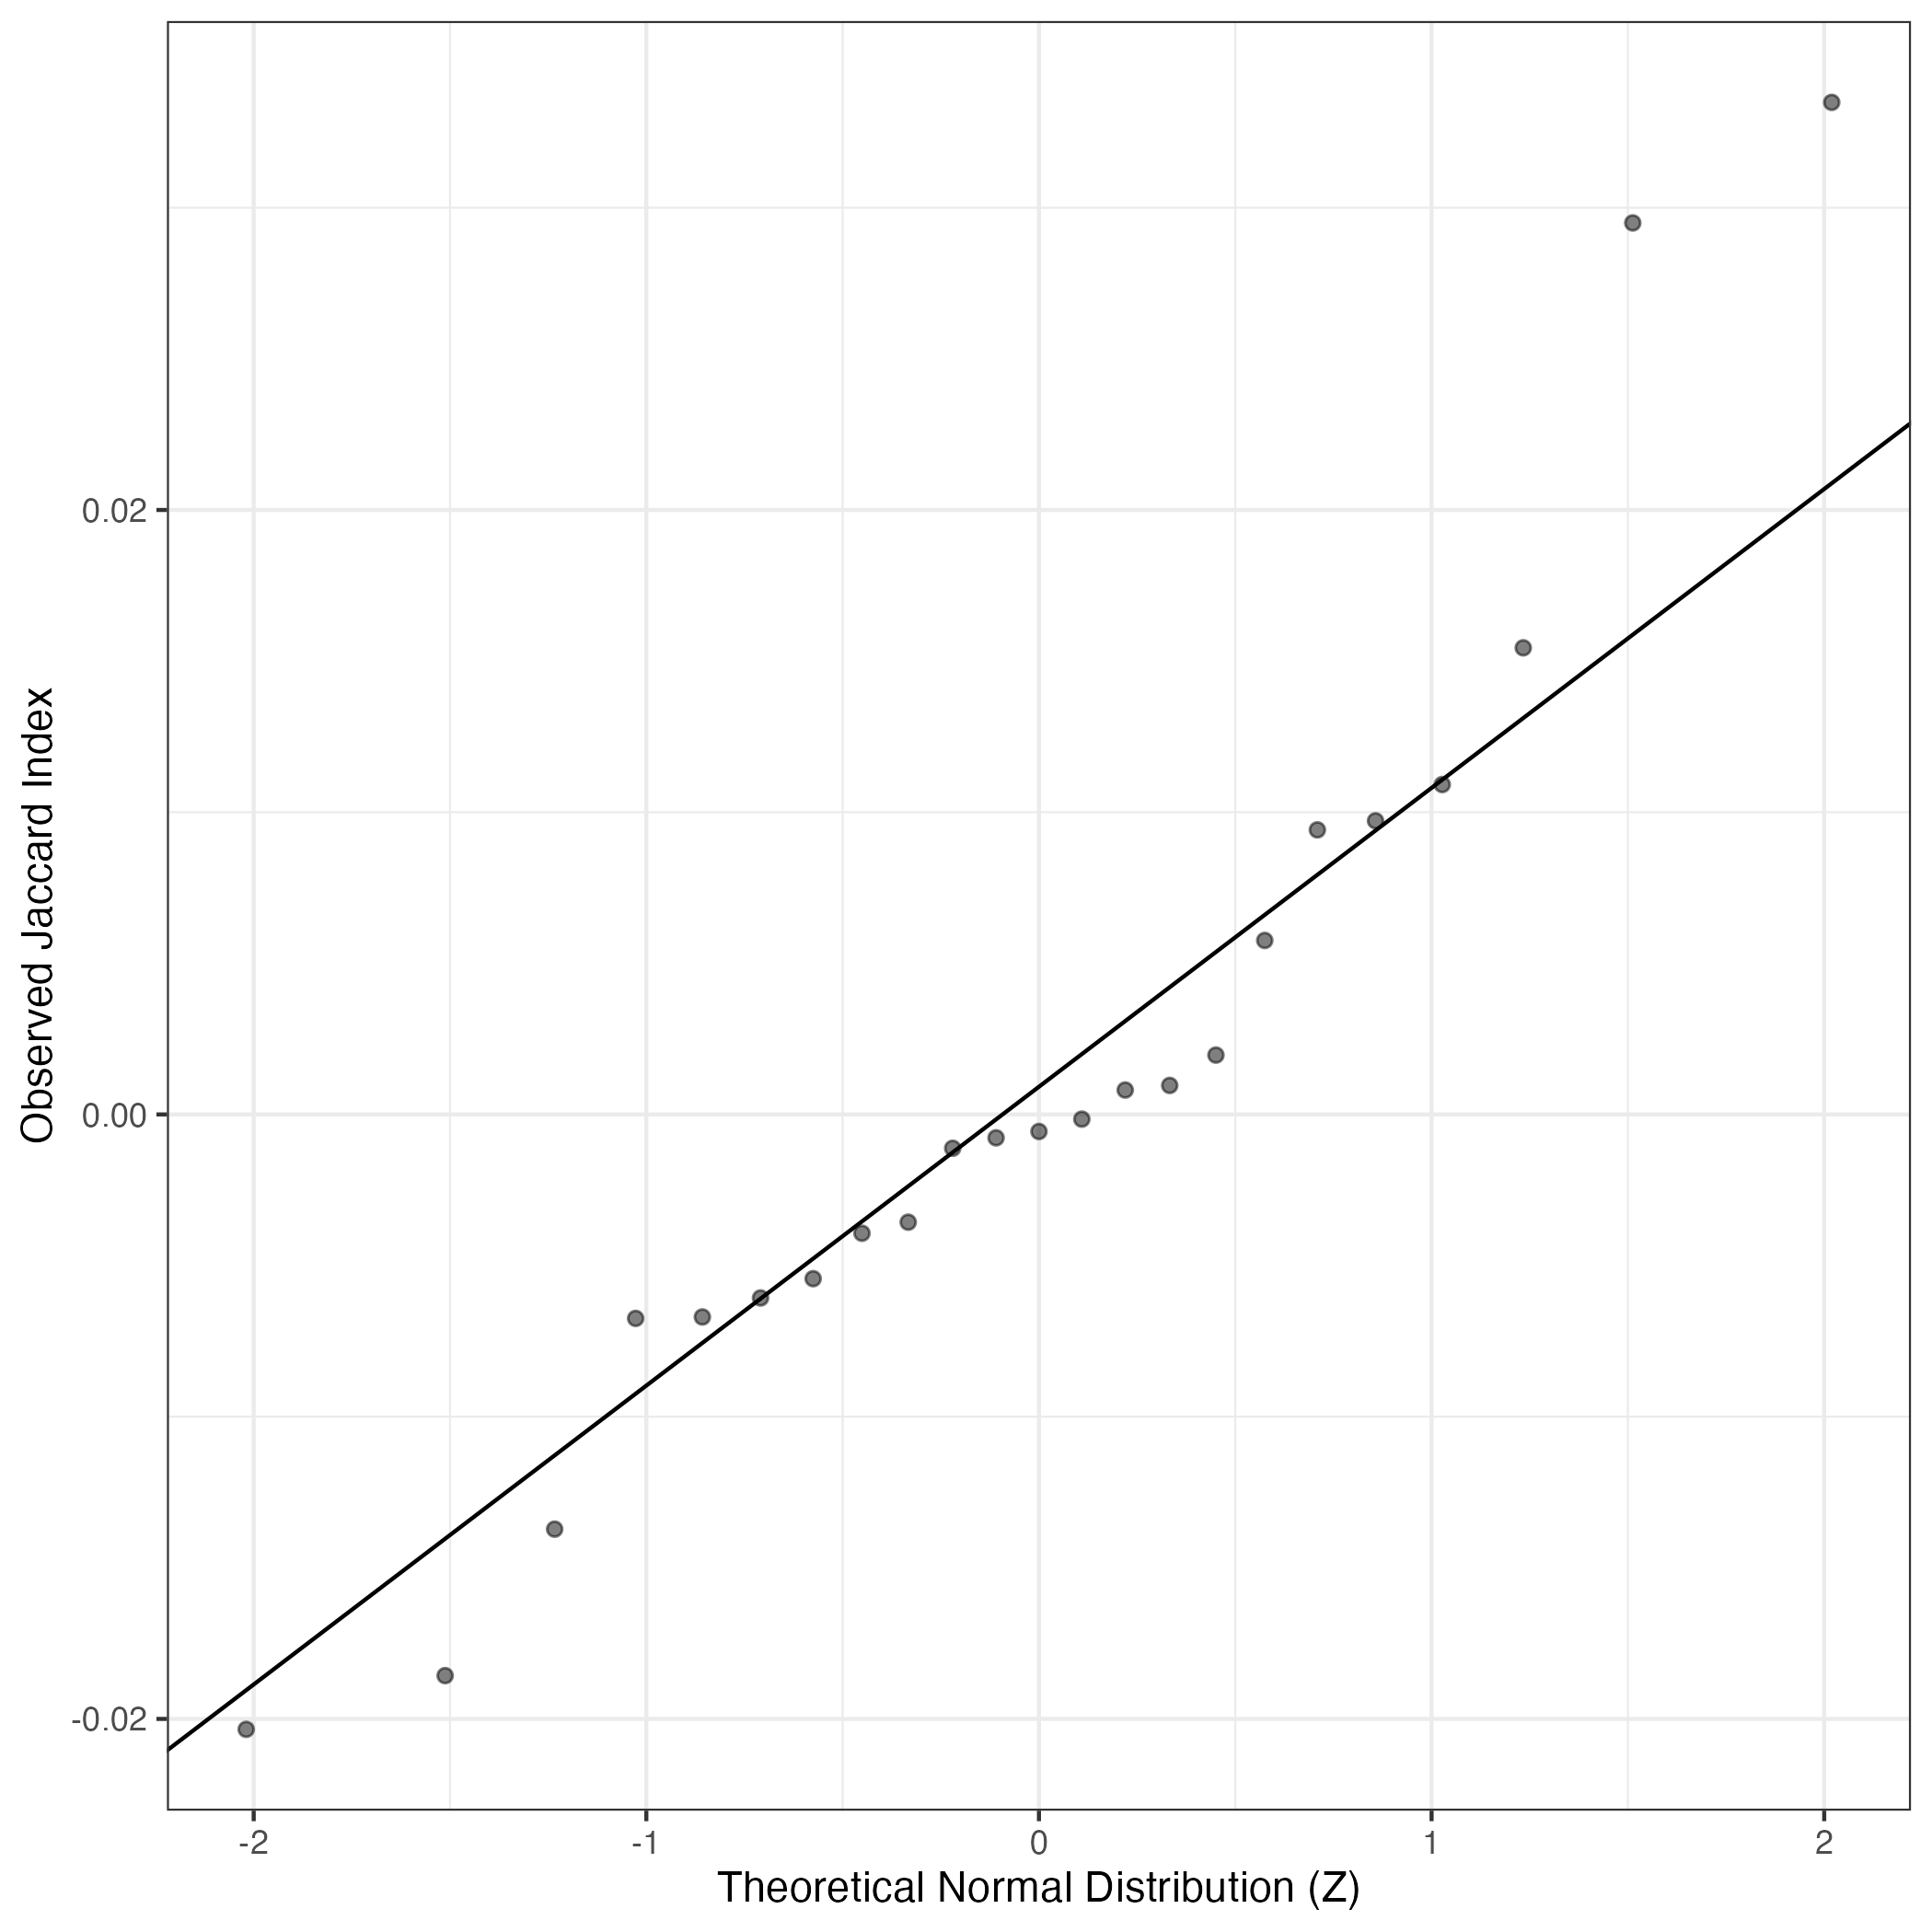
A similar QQ-plot as above, but only for instances where the H value is e.g. > 25, i.e. we are confident that the expression program is active above noise. Agreemenet between these binary vectors is tested using the Jaccard Index, with the P-values calculated by an exact test:
Below shows the significant enrichments of this GEP for literature curated gene lists
This data was procured from existing single cell RNA-seq maps of neuroblastoma or related relevant data.
High ranks indicate this gene is a driver of this GEP.
These curated gene list are ranked by the P-value (on this GEP) of their constituent genes.
The Mean Count column shows the mean read count in cells scoring highly (H > 50) on this gene expression program.
Medulla (Hanemaaijer) Marker genes obtained from Supplementary Table SD of Hanemaaijer et al (PMID 33500353). The authors generated single-cell RNA-seq data (sort-seq, 2,229 cells total) from mouse adrenal glads at E13.5, E14.5, E17.5, E18.5, P1 and P5. These were marker genes that matched with a similar dataset generated by Furlan et al (PMID 28684471). This particular set of markers are for genes defining the broad group labelled adrenal medulla, which included 7 subclusters (SCP, Bridge, Committed Progenitor, N Chromaffin, E Chromaffin, Neuroblast) - see UMAP on their Fig1B for cluster assignments.: Wilcoxon ranksum test P-value for gene set overrepresentation: 6.05e-13 Mean rank of genes in gene set: 54.94 Rank on gene expression program of genes in gene set:
Committed Progenitor (Hanemaaijer) Marker genes obtained from Supplementary Table SD of Hanemaaijer et al (PMID 33500353). The authors generated single-cell RNA-seq data (sort-seq, 2,229 cells total) from mouse adrenal glads at E13.5, E14.5, E17.5, E18.5, P1 and P5. These were marker genes that matched with a similar dataset generated by Furlan et al (PMID 28684471). This particular set of markers are for the Committed Progenitor subcluster (seems to mean progenitor of chromaffin cells), which is part of the Adrenal Medulla cluster.: Wilcoxon ranksum test P-value for gene set overrepresentation: 6.47e-13 Mean rank of genes in gene set: 338.06 Rank on gene expression program of genes in gene set:
Adrenergic Fig 1D (Olsen) Similar to above, but for selected adrenergic marker genes: Wilcoxon ranksum test P-value for gene set overrepresentation: 3.05e-09 Mean rank of genes in gene set: 302.58 Rank on gene expression program of genes in gene set:
Pre-E Chromafin (Hanemaaijer) Marker genes obtained from Supplementary Table SD of Hanemaaijer et al (PMID 33500353). The authors generated single-cell RNA-seq data (sort-seq, 2,229 cells total) from mouse adrenal glads at E13.5, E14.5, E17.5, E18.5, P1 and P5. These were marker genes that matched with a similar dataset generated by Furlan et al (PMID 28684471). This particular set of markers are for the Pre Epinepherine Chromaffin subcluster, which is part of the Adrenal Medulla cluster.: Wilcoxon ranksum test P-value for gene set overrepresentation: 6.11e-09 Mean rank of genes in gene set: 491.83 Rank on gene expression program of genes in gene set:
N Chromafin (Hanemaaijer) Marker genes obtained from Supplementary Table SD of Hanemaaijer et al (PMID 33500353). The authors generated single-cell RNA-seq data (sort-seq, 2,229 cells total) from mouse adrenal glads at E13.5, E14.5, E17.5, E18.5, P1 and P5. These were marker genes that matched with a similar dataset generated by Furlan et al (PMID 28684471). This particular set of markers are for the Norepinepherine Chromaffin subcluster, which is part of the Adrenal Medulla cluster.: Wilcoxon ranksum test P-value for gene set overrepresentation: 3.33e-08 Mean rank of genes in gene set: 2359.88 Rank on gene expression program of genes in gene set:
Neuroblast (Hanemaaijer) Marker genes obtained from Supplementary Table SD of Hanemaaijer et al (PMID 33500353). The authors generated single-cell RNA-seq data (sort-seq, 2,229 cells total) from mouse adrenal glads at E13.5, E14.5, E17.5, E18.5, P1 and P5. These were marker genes that matched with a similar dataset generated by Furlan et al (PMID 28684471). This particular set of markers are for the Neuroblast subcluster, which is part of the Adrenal Medulla cluster.: Wilcoxon ranksum test P-value for gene set overrepresentation: 6.82e-08 Mean rank of genes in gene set: 1511.92 Rank on gene expression program of genes in gene set:
Symphathoblasts Fig2 (Kamenva) Marker genes were obtained from Fig. 2H of Kameneva et al (PMID 33833454) for symphathoblasts (differentiating from SCPs): Wilcoxon ranksum test P-value for gene set overrepresentation: 6.62e-07 Mean rank of genes in gene set: 126.38 Rank on gene expression program of genes in gene set:
Broad sympathetic marker (Dong) Obtained from Fig. 3c of Dong et al. (PMID 32946775).: Wilcoxon ranksum test P-value for gene set overrepresentation: 1.22e-05 Mean rank of genes in gene set: 51.67 Rank on gene expression program of genes in gene set:
Symphathoblasts (Kameneva) Marker gene were obtained from Fig. 1D of Kameneva et al (PMID 33833454). These genes were used by the authors to annotate each cell type in their human fetal adrenal scRNA-seq data obtained 6, 8, 9, 11, 12 and 14 weeks post conception. Several of these markers are also (more weakly) expressed in chromaffin cells. The authors data suggest Symphthoblasts give rise to chromaffin cells.: Wilcoxon ranksum test P-value for gene set overrepresentation: 1.37e-05 Mean rank of genes in gene set: 114 Rank on gene expression program of genes in gene set:
Chromaffin Cells (Dong) Obtained from Fig. 3c of Dong et al. (PMID 32946775). Jansky et al (PMID) criticize this choice of markers, stating: the neuronal markers NPY, PRPH, NTRK1 and ISL1 are used to annotate chromaffin cells; these were clearly expressed in neuroblasts in our analyses.: Wilcoxon ranksum test P-value for gene set overrepresentation: 5.74e-05 Mean rank of genes in gene set: 41.2 Rank on gene expression program of genes in gene set:
Late chromaffin cells (Jansky Fig1E) Heatmap in Fig. 1E, marker genes derived from Jansks scRNA-seq data for adrenal medulla cell types. Note: this late chromaffin cell signature also includes PNMT, which is an enzyme catalyzing methylation of norepinephrine to form epinephrine; this marker is absent from the ealier less differentiated chromaffin cells (which may have been referred to as sympathoblasts in other datasets, I think): Wilcoxon ranksum test P-value for gene set overrepresentation: 8.07e-05 Mean rank of genes in gene set: 251.4 Rank on gene expression program of genes in gene set:
Chromaffin and connecting progenitor cells (Jansky Fig1E) Heatmap in Fig. 1E, marker genes derived from Jansks scRNA-seq data for adrenal medulla cell types.: Wilcoxon ranksum test P-value for gene set overrepresentation: 2.69e-04 Mean rank of genes in gene set: 9.25 Rank on gene expression program of genes in gene set:
Sympathobasts or chromaffin (Kildisiute) Sympathoblast and chromaffin markers obtained from Kildisiute et al, Supplmenentary Table 2, references supporting these genes are provided in Supp Table S2 of Kildisiute et al (PMID 33547074) https://www.science.org/doi/suppl/10.1126/sciadv.abd3311/suppl_file/abd3311_tables_s1_to_s12.xlsx: Wilcoxon ranksum test P-value for gene set overrepresentation: 2.70e-04 Mean rank of genes in gene set: 12.5 Rank on gene expression program of genes in gene set:
Bridge region adrenergic transition (Olsen) As above but for cells in the mesenchymal transitioning to adrenergic region: Wilcoxon ranksum test P-value for gene set overrepresentation: 3.80e-04 Mean rank of genes in gene set: 273 Rank on gene expression program of genes in gene set:
Neuroblasts (Jansky Fig1E) Heatmap in Fig. 1E, marker genes derived from Jansks scRNA-seq data for adrenal medulla cell types.: Wilcoxon ranksum test P-value for gene set overrepresentation: 4.91e-04 Mean rank of genes in gene set: 2716 Rank on gene expression program of genes in gene set:
E Chromaffin (Hanemaaijer) Marker genes obtained from Supplementary Table SD of Hanemaaijer et al (PMID 33500353). The authors generated single-cell RNA-seq data (sort-seq, 2,229 cells total) from mouse adrenal glads at E13.5, E14.5, E17.5, E18.5, P1 and P5. These were marker genes that matched with a similar dataset generated by Furlan et al (PMID 28684471). This particular set of markers are for the Epinepherine Chromaffin subcluster, which is part of the Adrenal Medulla cluster.: Wilcoxon ranksum test P-value for gene set overrepresentation: 7.42e-04 Mean rank of genes in gene set: 2964.43 Rank on gene expression program of genes in gene set:
Chromaffin cells Fig2 (Kamenva) Marker genes were obtained from Fig. 2H of Kameneva et al (PMID 33833454) for chromaffin cells (differentiating from symphathoblasts): Wilcoxon ranksum test P-value for gene set overrepresentation: 1.27e-03 Mean rank of genes in gene set: 2131.6 Rank on gene expression program of genes in gene set:
Chromaffin cell development (Dong) Markers obtained in computationally inferred meta program (by NMF applied to their neuroblastoma sc-RNA-seq data) from Fig. 5(a) of Dong et al. (PMID 32946775).: Wilcoxon ranksum test P-value for gene set overrepresentation: 1.41e-03 Mean rank of genes in gene set: 45.33 Rank on gene expression program of genes in gene set:
Adrenergic mature (olsen) Stated on pages 6 and 7 of the main text of Olsen et al. https://www.biorxiv.org/content/10.1101/2020.05.04.077057v1 - it is argued that upon reanalysis of the adrenergic neuroblastoma cells, there is further heterogeneity, grouped into proliferating, mature and immature cell populations. These markers are specific to the mature adrenergic cells: Wilcoxon ranksum test P-value for gene set overrepresentation: 1.43e-03 Mean rank of genes in gene set: 59.33 Rank on gene expression program of genes in gene set:
Neuroblastoma (Kildisiute) Neuroblastoma markers obtained from Kildisiute et al, Supplmenentary Table 2, references supporting these genes are provided in Supp Table S2 of Kildisiute et al (PMID 33547074) https://www.science.org/doi/suppl/10.1126/sciadv.abd3311/suppl_file/abd3311_tables_s1_to_s12.xlsx: Wilcoxon ranksum test P-value for gene set overrepresentation: 1.46e-03 Mean rank of genes in gene set: 80.67 Rank on gene expression program of genes in gene set:
Chromaffin cell-like (Dong) Markers obtained in computationally inferred meta program (by NMF applied to their neuroblastoma sc-RNA-seq data) from Fig. 5(a) of Dong et al. (PMID 32946775).: Wilcoxon ranksum test P-value for gene set overrepresentation: 1.83e-03 Mean rank of genes in gene set: 305 Rank on gene expression program of genes in gene set:
Chromaffin (Kameneva) Marker gene were obtained from Fig. 1D of Kameneva et al (PMID 33833454). These genes were used by the authors to annotate each cell type in their human fetal adrenal scRNA-seq data obtained 6, 8, 9, 11, 12 and 14 weeks post conception. These markers are expressed at a lower level in symphathoblasts.: Wilcoxon ranksum test P-value for gene set overrepresentation: 2.05e-03 Mean rank of genes in gene set: 416 Rank on gene expression program of genes in gene set:
Meta_7 undefined sympathetic (Dong) Markers obtained in computationally inferred meta program (by NMF applied to their neuroblastoma sc-RNA-seq data) from Fig. 5(a) of Dong et al. (PMID 32946775).: Wilcoxon ranksum test P-value for gene set overrepresentation: 2.35e-03 Mean rank of genes in gene set: 558.67 Rank on gene expression program of genes in gene set:
Bridge (Hanemaaijer) Marker genes obtained from Supplementary Table SD of Hanemaaijer et al (PMID 33500353). The authors generated single-cell RNA-seq data (sort-seq, 2,229 cells total) from mouse adrenal glads at E13.5, E14.5, E17.5, E18.5, P1 and P5. These were marker genes that matched with a similar dataset generated by Furlan et al (PMID 28684471). This particular set of markers are for the Bridge subcluster, which is part of the Adrenal Medulla cluster.: Wilcoxon ranksum test P-value for gene set overrepresentation: 2.85e-03 Mean rank of genes in gene set: 5684.07 Rank on gene expression program of genes in gene set:
Late Neuroblasts (Jansky Fig1E) Heatmap in Fig. 1E, marker genes derived from Jansks scRNA-seq data for adrenal medulla cell types. Note: the Jansky Late Neuroblast signature is the same as the earlier Neuroblast signature, but NEFM and ALK are now absent (meaning lower expressed at later stages of differentiation): Wilcoxon ranksum test P-value for gene set overrepresentation: 4.10e-03 Mean rank of genes in gene set: 3068.2 Rank on gene expression program of genes in gene set:
Adrenergic (Olsen) Markers listed in on page 3 of the main text of Olsen et al. https://www.biorxiv.org/content/10.1101/2020.05.04.077057v1 - these markers are for adrenergic genes: Wilcoxon ranksum test P-value for gene set overrepresentation: 7.16e-03 Mean rank of genes in gene set: 2.5 Rank on gene expression program of genes in gene set:
Adrenergic neuroblatoma (Olsen) Stated on page 6 of the main text of Olsen et al. https://www.biorxiv.org/content/10.1101/2020.05.04.077057v1 - neuroblastoma adrenergic markers derived from their data, which are state as resembling sympathoblasts and lacking chromffin markers such as PNMT: Wilcoxon ranksum test P-value for gene set overrepresentation: 7.33e-03 Mean rank of genes in gene set: 34.5 Rank on gene expression program of genes in gene set:
Symphatoblasts (Dong) Obtained from Fig. 3c of Dong et al. (PMID 32946775). Jansky et al (PMID) criticize this choice of markers, stating: Sympathoblasts were identified by Dong et al.28 based on the expression of CARTPT and INSM1, which we found expressed in chromaffin cells: Wilcoxon ranksum test P-value for gene set overrepresentation: 8.20e-03 Mean rank of genes in gene set: 195.5 Rank on gene expression program of genes in gene set:
Autonomic neurons mouse (olsen) Stated on page 6 of the main text of Olsen et al. https://www.biorxiv.org/content/10.1101/2020.05.04.077057v1 - seems to be referencing previous mouse lineage tracing studies in mouse which sucggested SCPs give rise to autonomic neurons and mesenchymal cells: Wilcoxon ranksum test P-value for gene set overrepresentation: 8.25e-03 Mean rank of genes in gene set: 205.5 Rank on gene expression program of genes in gene set:
Meta5 unclear (Dong) Markers obtained in computationally inferred meta program (by NMF applied to their neuroblastoma sc-RNA-seq data) from Fig. 5(a) of Dong et al. (PMID 32946775).: Wilcoxon ranksum test P-value for gene set overrepresentation: 9.16e-03 Mean rank of genes in gene set: 357.5 Rank on gene expression program of genes in gene set:
Bridge (Kildisiute) Bridge cell (cites Furlan 2017) markers obtained from Kildisiute et al, Supplmenentary Table 2, references supporting these genes are provided in Supp Table S2 of Kildisiute et al (PMID 33547074) https://www.science.org/doi/suppl/10.1126/sciadv.abd3311/suppl_file/abd3311_tables_s1_to_s12.xlsx.: Wilcoxon ranksum test P-value for gene set overrepresentation: 2.09e-02 Mean rank of genes in gene set: 1631 Rank on gene expression program of genes in gene set:
Proteasomal degradation (Kinker) These marker genes were obtained in a pan cancer cell lines NMF analysis of scRNA-eq data in Kinker et al (PMID 33128048) - 10 metaprograms were recovered that manifest across cancers, this is for proteasomal degradataion: Wilcoxon ranksum test P-value for gene set overrepresentation: 3.39e-02 Mean rank of genes in gene set: 5107.6 Rank on gene expression program of genes in gene set:
Symphathoadrenal cells (Yuan) Obtained from Fig. 1 of Yuan et al. https://www.biorxiv.org/content/10.1101/2020.05.15.097469v1: Wilcoxon ranksum test P-value for gene set overrepresentation: 4.01e-02 Mean rank of genes in gene set: 4784.75 Rank on gene expression program of genes in gene set:
Nerves and neurofiliment (Olsen) Markers listed in on page 4 of the main text of Olsen et al. https://www.biorxiv.org/content/10.1101/2020.05.04.077057v1 - NF200 is expressed in neurofiliments and is found close to SCPs in normal tissue, NRG1 is secreted by neurons, to which ERBB3 (on glia) binds.: Wilcoxon ranksum test P-value for gene set overrepresentation: 4.97e-02 Mean rank of genes in gene set: 468 Rank on gene expression program of genes in gene set:
Translation (Dong) Markers obtained in computationally inferred meta program (by NMF applied to their neuroblastoma sc-RNA-seq data) from Fig. 5(a) of Dong et al. (PMID 32946775).: Wilcoxon ranksum test P-value for gene set overrepresentation: 4.97e-02 Mean rank of genes in gene set: 4357.67 Rank on gene expression program of genes in gene set:
Fetal Zone (Hanemaaijer) Marker genes obtained from Supplementary Table SD of Hanemaaijer et al (PMID 33500353). The authors generated single-cell RNA-seq data (sort-seq, 2,229 cells total) from mouse adrenal glads at E13.5, E14.5, E17.5, E18.5, P1 and P5. These were marker genes that matched with a similar dataset generated by Furlan et al (PMID 28684471). This particular set of markers are for the Fetal Zone subcluster, which is part of the Cortex cluster.: Wilcoxon ranksum test P-value for gene set overrepresentation: 5.53e-02 Mean rank of genes in gene set: 763 Rank on gene expression program of genes in gene set:
Stress response (Kinker) These marker genes were obtained in a pan cancer cell lines NMF analysis of scRNA-eq data in Kinker et al (PMID 33128048) - 10 metaprograms were recovered that manifest across cancers.: Wilcoxon ranksum test P-value for gene set overrepresentation: 6.34e-02 Mean rank of genes in gene set: 5855.4 Rank on gene expression program of genes in gene set:
Chromaffin (Kildisiute) Chromaffin markers obtained from Kildisiute et al, Supplmenentary Table 2, references supporting these genes are provided in Supp Table S2 of Kildisiute et al (PMID 33547074) https://www.science.org/doi/suppl/10.1126/sciadv.abd3311/suppl_file/abd3311_tables_s1_to_s12.xlsx: Wilcoxon ranksum test P-value for gene set overrepresentation: 6.51e-02 Mean rank of genes in gene set: 1220 Rank on gene expression program of genes in gene set:
Stress response (Dong) Markers obtained in computationally inferred meta program (by NMF applied to their neuroblastoma sc-RNA-seq data) from Fig. 5(a) of Dong et al. (PMID 32946775).: Wilcoxon ranksum test P-value for gene set overrepresentation: 8.26e-02 Mean rank of genes in gene set: 5195.33 Rank on gene expression program of genes in gene set:
Protein maturation (Kinker) These marker genes were obtained in a pan cancer cell lines NMF analysis of scRNA-eq data in Kinker et al (PMID 33128048) - 10 metaprograms were recovered that manifest across cancers.: Wilcoxon ranksum test P-value for gene set overrepresentation: 9.13e-02 Mean rank of genes in gene set: 6339.8 Rank on gene expression program of genes in gene set:
Sympathoblasts (Kildisiute) Sympathoblasts markers obtained from Kildisiute et al, Supplmenentary Table 2, references supporting these genes are provided in Supp Table S2 of Kildisiute et al (PMID 33547074) https://www.science.org/doi/suppl/10.1126/sciadv.abd3311/suppl_file/abd3311_tables_s1_to_s12.xlsx: Wilcoxon ranksum test P-value for gene set overrepresentation: 1.63e-01 Mean rank of genes in gene set: 6496.33 Rank on gene expression program of genes in gene set:
M2 Macrophage These genes were collated from multiple sources: Wilcoxon ranksum test P-value for gene set overrepresentation: 1.82e-01 Mean rank of genes in gene set: 7876.88 Rank on gene expression program of genes in gene set:
Definitive Zone (Hanemaaijer) Marker genes obtained from Supplementary Table SD of Hanemaaijer et al (PMID 33500353). The authors generated single-cell RNA-seq data (sort-seq, 2,229 cells total) from mouse adrenal glads at E13.5, E14.5, E17.5, E18.5, P1 and P5. These were marker genes that matched with a similar dataset generated by Furlan et al (PMID 28684471). This particular set of markers are for the Definitive Zone subcluster, which is part of the Cortex cluster.: Wilcoxon ranksum test P-value for gene set overrepresentation: 1.86e-01 Mean rank of genes in gene set: 7169.75 Rank on gene expression program of genes in gene set:
Other T cells (Yuan) Obtained from Fig. 6 of Yuan et al. https://www.biorxiv.org/content/10.1101/2020.05.15.097469v1: Wilcoxon ranksum test P-value for gene set overrepresentation: 2.08e-01 Mean rank of genes in gene set: 7634.8 Rank on gene expression program of genes in gene set:
Immune cells (Yuan) Obtained from Fig. 1 of Yuan et al. https://www.biorxiv.org/content/10.1101/2020.05.15.097469v1: Wilcoxon ranksum test P-value for gene set overrepresentation: 2.35e-01 Mean rank of genes in gene set: 6816.5 Rank on gene expression program of genes in gene set:
HSCs and immune cells (Kameneva) Marker gene were obtained from Fig. 1D of Kameneva et al (PMID 33833454). These genes were used by the authors to annotate each cell type in their human fetal adrenal scRNA-seq data obtained 6, 8, 9, 11, 12 and 14 weeks post conception.: Wilcoxon ranksum test P-value for gene set overrepresentation: 2.68e-01 Mean rank of genes in gene set: 7223 Rank on gene expression program of genes in gene set:
Immune (Hanemaaijer) Marker genes obtained from Supplementary Table SD of Hanemaaijer et al (PMID 33500353). The authors generated single-cell RNA-seq data (sort-seq, 2,229 cells total) from mouse adrenal glads at E13.5, E14.5, E17.5, E18.5, P1 and P5. These were marker genes that matched with a similar dataset generated by Furlan et al (PMID 28684471). This particular set of markers are for the broad Immune cluster: Wilcoxon ranksum test P-value for gene set overrepresentation: 2.76e-01 Mean rank of genes in gene set: 7320 Rank on gene expression program of genes in gene set:
Endothelial cells (Jansky) Mentioned in the main text (Jansky et al, Nature Genetics (2021)), page 1, that PTPRB+ Endothelial cells were identified in their fetal adrenal glands, this is also highlighted in the UMAP plot on their Fig 1B. Additional genes also shown in their Extended data Figure 2D.: Wilcoxon ranksum test P-value for gene set overrepresentation: 3.59e-01 Mean rank of genes in gene set: 8499.33 Rank on gene expression program of genes in gene set:
Neuroblastoma SCPs but not normal SCPs (Olsen) The same as above: Wilcoxon ranksum test P-value for gene set overrepresentation: 4.00e-01 Mean rank of genes in gene set: 8667.5 Rank on gene expression program of genes in gene set:
Adrenal gland cortex (Kameneva) Marker gene were obtained from Fig. 1D of Kameneva et al (PMID 33833454). These genes were used by the authors to annotate each cell type in their human fetal adrenal scRNA-seq data obtained 6, 8, 9, 11, 12 and 14 weeks post conception. : Wilcoxon ranksum test P-value for gene set overrepresentation: 4.24e-01 Mean rank of genes in gene set: 9131.75 Rank on gene expression program of genes in gene set:
p53 Dependent Senescence (Kinker) These marker genes were obtained in a pan cancer cell lines NMF analysis of scRNA-eq data in Kinker et al (PMID 33128048) - 10 metaprograms were recovered that manifest across cancers.: Wilcoxon ranksum test P-value for gene set overrepresentation: 4.32e-01 Mean rank of genes in gene set: 8991.5 Rank on gene expression program of genes in gene set:
IFN Response (Kinker) These marker genes were obtained in a pan cancer cell lines NMF analysis of scRNA-eq data in Kinker et al (PMID 33128048) - 10 metaprograms were recovered that manifest across cancers, this program contained interferon response genes.: Wilcoxon ranksum test P-value for gene set overrepresentation: 4.64e-01 Mean rank of genes in gene set: 9440 Rank on gene expression program of genes in gene set:
Pigmentation (Kinker) These marker genes were obtained in a pan cancer cell lines NMF analysis of scRNA-eq data in Kinker et al (PMID 33128048) - 10 metaprograms were recovered that manifest across cancers, Skin pigmentation genes, identified in melanoma.: Wilcoxon ranksum test P-value for gene set overrepresentation: 4.89e-01 Mean rank of genes in gene set: 9589.25 Rank on gene expression program of genes in gene set:
SCPs mouse unique (Olsen) Selected list of SCP marker genes shown in Fig. 2B of Olsen et al. https://www.biorxiv.org/content/10.1101/2020.05.04.077057v1 - these genes were unique to mouse SCPs as determined by the linearge tracing study Furlan et al. (Science 2017, PMID 28684471).: Wilcoxon ranksum test P-value for gene set overrepresentation: 4.94e-01 Mean rank of genes in gene set: 9630.83 Rank on gene expression program of genes in gene set:
Normal Schwann cell precurors, but not Neuroblastoma Scps (Olsen) Based on their neuroblastoma data and stated on page 6 of the main text of Olsen et al. https://www.biorxiv.org/content/10.1101/2020.05.04.077057v1: Wilcoxon ranksum test P-value for gene set overrepresentation: 4.98e-01 Mean rank of genes in gene set: 9644 Rank on gene expression program of genes in gene set:
Melanocytes (Kameneva) Marker gene were obtained from Fig. 1D of Kameneva et al (PMID 33833454). These genes were used by the authors to annotate each cell type in their human fetal adrenal scRNA-seq data obtained 6, 8, 9, 11, 12 and 14 weeks post conception.: Wilcoxon ranksum test P-value for gene set overrepresentation: 5.08e-01 Mean rank of genes in gene set: 9722.5 Rank on gene expression program of genes in gene set:
Cortex (Hanemaaijer) Marker genes obtained from Supplementary Table SD of Hanemaaijer et al (PMID 33500353). The authors generated single-cell RNA-seq data (sort-seq, 2,229 cells total) from mouse adrenal glads at E13.5, E14.5, E17.5, E18.5, P1 and P5. These were marker genes that matched with a similar dataset generated by Furlan et al (PMID 28684471). This particular set of markers are for their broad Cortex group, which is composed of Fetal Zone, Definitive Zone and Adr Primordium subclusters: Wilcoxon ranksum test P-value for gene set overrepresentation: 5.50e-01 Mean rank of genes in gene set: 10368 Rank on gene expression program of genes in gene set:
Immune cells (Jansky) Mentioned in the main text (Jansky et al, Nature Genetics (2021)), page 1, that PTPRC+ Immune cells were identified in their fetal adrenal glands, this is also highlighted in the UMAP plot on their Fig 1B. Additional genes also shown in their Extended data Figure 2D.: Wilcoxon ranksum test P-value for gene set overrepresentation: 5.78e-01 Mean rank of genes in gene set: 10302.67 Rank on gene expression program of genes in gene set:
Adrenal Cortex (Yuan) Obtained from Fig. 6 of Yuan et al. https://www.biorxiv.org/content/10.1101/2020.05.15.097469v1: Wilcoxon ranksum test P-value for gene set overrepresentation: 5.91e-01 Mean rank of genes in gene set: 10942 Rank on gene expression program of genes in gene set:
Liver Primordium (Kameneva) Marker gene were obtained from Fig. 1D of Kameneva et al (PMID 33833454). These genes were used by the authors to annotate each cell type in their human fetal adrenal scRNA-seq data obtained 6, 8, 9, 11, 12 and 14 weeks post conception.: Wilcoxon ranksum test P-value for gene set overrepresentation: 6.36e-01 Mean rank of genes in gene set: 10636.5 Rank on gene expression program of genes in gene set:
Adrenal cortical (Jansky) Mentioned in the main text (Jansky et al, Nature Genetics (2021)), page 1, that CYP11A1+ Adrenal cortical cells were identified in their fetal adrenal glands, this is also highlighted in the UMAP plot on their Fig 1B. Additional genes also shown in their Extended data Figure 2D.: Wilcoxon ranksum test P-value for gene set overrepresentation: 6.37e-01 Mean rank of genes in gene set: 10797 Rank on gene expression program of genes in gene set:
Adrenal cortex (Kildisiute) Adrenal cortex markers obtained from Kildisiute et al, Supplmenentary Table 2, references supporting these genes are provided in Supp Table S2 of Kildisiute et al (PMID 33547074) https://www.science.org/doi/suppl/10.1126/sciadv.abd3311/suppl_file/abd3311_tables_s1_to_s12.xlsx: Wilcoxon ranksum test P-value for gene set overrepresentation: 6.40e-01 Mean rank of genes in gene set: 11083 Rank on gene expression program of genes in gene set:
B cells (Yuan) Obtained from Fig. 6 of Yuan et al. https://www.biorxiv.org/content/10.1101/2020.05.15.097469v1: Wilcoxon ranksum test P-value for gene set overrepresentation: 6.41e-01 Mean rank of genes in gene set: 11684 Rank on gene expression program of genes in gene set:
Hepatocytes (Jansky) Mentioned in the main text (Jansky et al, Nature Genetics (2021)), page 1, that ALB+ Hepatocytes were identified in their fetal adrenal glands, this is also highlighted in the UMAP plot on their Fig 1B. Additional genes also shown in their Extended data Figure 2D. The main text also speculated that these hepatocytes were probably derived from neighboring tissue, and hence artifactual, but there is no evidence presented for this.: Wilcoxon ranksum test P-value for gene set overrepresentation: 6.52e-01 Mean rank of genes in gene set: 10924.33 Rank on gene expression program of genes in gene set:
Leukocyte (Kildisiute) Leukocyes markers obtained from Kildisiute et al, Supplmenentary Table 2, references supporting these genes are provided in Supp Table S2 of Kildisiute et al (PMID 33547074) https://www.science.org/doi/suppl/10.1126/sciadv.abd3311/suppl_file/abd3311_tables_s1_to_s12.xlsx: Wilcoxon ranksum test P-value for gene set overrepresentation: 6.56e-01 Mean rank of genes in gene set: 11900 Rank on gene expression program of genes in gene set:
Meta_9 ATRX (Dong) Markers obtained in computationally inferred meta program (by NMF applied to their neuroblastoma sc-RNA-seq data) from Fig. 5(a) of Dong et al. (PMID 32946775).: Wilcoxon ranksum test P-value for gene set overrepresentation: 6.73e-01 Mean rank of genes in gene set: 11436.5 Rank on gene expression program of genes in gene set:
Erythroid cells (Kameneva) Marker gene were obtained from Fig. 1D of Kameneva et al (PMID 33833454). These genes were used by the authors to annotate each cell type in their human fetal adrenal scRNA-seq data obtained 6, 8, 9, 11, 12 and 14 weeks post conception.: Wilcoxon ranksum test P-value for gene set overrepresentation: 6.91e-01 Mean rank of genes in gene set: 12445 Rank on gene expression program of genes in gene set:
M-MDSC These marker genes were curated for MDSC subtypes as reviewed in Veglia et. al. (PMID 33526920): Wilcoxon ranksum test P-value for gene set overrepresentation: 7.33e-01 Mean rank of genes in gene set: 10462 Rank on gene expression program of genes in gene set:
Bridge (Jansky Fig1E) Heatmap in Fig. 1E, marker genes derived from Jansks scRNA-seq data for adrenal medulla cell types.: Wilcoxon ranksum test P-value for gene set overrepresentation: 7.43e-01 Mean rank of genes in gene set: 11489.75 Rank on gene expression program of genes in gene set:
Bridge region mesenchymal-SCP transition (Olsen) As above but for cells in the mesenchymal transitioning to SCP region: Wilcoxon ranksum test P-value for gene set overrepresentation: 7.67e-01 Mean rank of genes in gene set: 12018.33 Rank on gene expression program of genes in gene set:
Antigen Presenting CAF These marker genes were curated across cancer subtypes in multiple organ systems as reviewed in Lavie et. al. (PMID 35883004) and contain antigen presenting specific CAF genes: Wilcoxon ranksum test P-value for gene set overrepresentation: 7.90e-01 Mean rank of genes in gene set: 10787.25 Rank on gene expression program of genes in gene set:
Cell cycle (Dong) Markers obtained in computationally inferred meta program (by NMF applied to their neuroblastoma sc-RNA-seq data) from Fig. 5(a) of Dong et al. (PMID 32946775).: Wilcoxon ranksum test P-value for gene set overrepresentation: 8.16e-01 Mean rank of genes in gene set: 12564.33 Rank on gene expression program of genes in gene set:
Mixed phenotype identified at the fate split point mouse (olsen) Stated on page 6 of the main text of Olsen et al. https://www.biorxiv.org/content/10.1101/2020.05.04.077057v1 - seems to be referencing previous mouse lineage tracing studies in mouse which sucggested SCPs give rise to autonomic neurons and mesenchymal cells. markers are of the split point where SCPs differentiate.: Wilcoxon ranksum test P-value for gene set overrepresentation: 8.20e-01 Mean rank of genes in gene set: 12616.67 Rank on gene expression program of genes in gene set:
Adrenal Premordium (Hanemaaijer) Marker genes obtained from Supplementary Table SD of Hanemaaijer et al (PMID 33500353). The authors generated single-cell RNA-seq data (sort-seq, 2,229 cells total) from mouse adrenal glads at E13.5, E14.5, E17.5, E18.5, P1 and P5. These were marker genes that matched with a similar dataset generated by Furlan et al (PMID 28684471). This particular set of markers are for the Adrenal Premordium subcluster, which is part of the Cortex cluster.: Wilcoxon ranksum test P-value for gene set overrepresentation: 8.25e-01 Mean rank of genes in gene set: 11994.6 Rank on gene expression program of genes in gene set:
Kidney Primordium (Kameneva) Marker gene were obtained from Fig. 1D of Kameneva et al (PMID 33833454). These genes were used by the authors to annotate each cell type in their human fetal adrenal scRNA-seq data obtained 6, 8, 9, 11, 12 and 14 weeks post conception. : Wilcoxon ranksum test P-value for gene set overrepresentation: 8.30e-01 Mean rank of genes in gene set: 12732.67 Rank on gene expression program of genes in gene set:
Endothelium (Kameneva) Marker gene were obtained from Fig. 1D of Kameneva et al (PMID 33833454). These genes were used by the authors to annotate each cell type in their human fetal adrenal scRNA-seq data obtained 6, 8, 9, 11, 12 and 14 weeks post conception.: Wilcoxon ranksum test P-value for gene set overrepresentation: 8.36e-01 Mean rank of genes in gene set: 12108.8 Rank on gene expression program of genes in gene set:
Angioblast (Hanemaaijer) Marker genes obtained from Supplementary Table SD of Hanemaaijer et al (PMID 33500353). The authors generated single-cell RNA-seq data (sort-seq, 2,229 cells total) from mouse adrenal glads at E13.5, E14.5, E17.5, E18.5, P1 and P5. These were marker genes that matched with a similar dataset generated by Furlan et al (PMID 28684471). This particular set of markers are for Angioblast subcluster of Endothelium cluster: Wilcoxon ranksum test P-value for gene set overrepresentation: 8.55e-01 Mean rank of genes in gene set: 13073 Rank on gene expression program of genes in gene set:
Endothelial Cells (Yuan) Obtained from Fig. 6 of Yuan et al. https://www.biorxiv.org/content/10.1101/2020.05.15.097469v1: Wilcoxon ranksum test P-value for gene set overrepresentation: 8.65e-01 Mean rank of genes in gene set: 13219.33 Rank on gene expression program of genes in gene set:
Myelination (Olsen) Markers listed in on page 4 of the main text of Olsen et al. https://www.biorxiv.org/content/10.1101/2020.05.04.077057v1 - these markers are state as being involved in Myelination and are expressed in the Schwann cell precursor cluster of their UMAP (Fig. 1D), these are suggested to represent more mature myelinating Schwann cells. MPZ is Myelin Protien Zero.: Wilcoxon ranksum test P-value for gene set overrepresentation: 8.77e-01 Mean rank of genes in gene set: 14236.5 Rank on gene expression program of genes in gene set:
Vascular (Kildisiute) Vascular markers obtained from Kildisiute et al, Supplmenentary Table 2, references supporting these genes are provided in Supp Table S2 of Kildisiute et al (PMID 33547074) https://www.science.org/doi/suppl/10.1126/sciadv.abd3311/suppl_file/abd3311_tables_s1_to_s12.xlsx: Wilcoxon ranksum test P-value for gene set overrepresentation: 8.85e-01 Mean rank of genes in gene set: 13018.5 Rank on gene expression program of genes in gene set:
Plasmacytoid dendritic cells (Yuan) Obtained from Fig. 6 of Yuan et al. https://www.biorxiv.org/content/10.1101/2020.05.15.097469v1: Wilcoxon ranksum test P-value for gene set overrepresentation: 8.86e-01 Mean rank of genes in gene set: 14416 Rank on gene expression program of genes in gene set:
Erythrocytes (Jansky) Mentioned in the main text (Jansky et al, Nature Genetics (2021)), page 1, that HBA2+ Erythrocytes were identified in their fetal adrenal glands, this is also highlighted in the UMAP plot on their Fig 1B. Additional genes also shown in their Extended data Figure 2D.: Wilcoxon ranksum test P-value for gene set overrepresentation: 8.92e-01 Mean rank of genes in gene set: 16566 Rank on gene expression program of genes in gene set:
EMT III (Kinker) These marker genes were obtained in a pan cancer cell lines NMF analysis of scRNA-eq data in Kinker et al (PMID 33128048) - 10 metaprograms were recovered that manifest across cancers, this EMT program was enriched in non-cycling cells.: Wilcoxon ranksum test P-value for gene set overrepresentation: 9.20e-01 Mean rank of genes in gene set: 13166.4 Rank on gene expression program of genes in gene set:
Bridge region SCP-adrenergic transition (Olsen) As above but for cells in the mesenchymal transitioning to SCP-adrenergic region: Wilcoxon ranksum test P-value for gene set overrepresentation: 9.20e-01 Mean rank of genes in gene set: 13592 Rank on gene expression program of genes in gene set:
Axon guidance (Olsen) Markers listed in on page 4 of the main text of Olsen et al. https://www.biorxiv.org/content/10.1101/2020.05.04.077057v1 - these markers are for axon guidance instead of myelination: Wilcoxon ranksum test P-value for gene set overrepresentation: 9.32e-01 Mean rank of genes in gene set: 18003 Rank on gene expression program of genes in gene set:
PMN-MDSC These marker genes were curated for MDSC subtypes as reviewed in Veglia et. al. (PMID 33526920): Wilcoxon ranksum test P-value for gene set overrepresentation: 9.34e-01 Mean rank of genes in gene set: 11458.32 Rank on gene expression program of genes in gene set:
Adrenergic immature (Olsen) Stated on pages 6 and 7 of the main text of Olsen et al. https://www.biorxiv.org/content/10.1101/2020.05.04.077057v1 - it is argued that upon reanalysis of the adrenergic neuroblastoma cells, there is further heterogeneity, grouped into proliferating, mature and immature cell populations. These is a marker listed for the immature adrenergic cells. SOX11 is referenced as important in early phases of pro-adrenergic differentiation (cites PMID 20147379) whereas SOX4 appears later. SOX11 is also associated with poor outcome in neuroblatoma bulk RNA-seq data (Olsen analysis).: Wilcoxon ranksum test P-value for gene set overrepresentation: 9.50e-01 Mean rank of genes in gene set: 18826 Rank on gene expression program of genes in gene set:
Myocytes (Jansky) Mentioned in the main text (Jansky et al, Nature Genetics (2021)), page 1, that MYH3+ Myocytes were identified in their fetal adrenal glands, this is also highlighted in the UMAP plot on their Fig 1B. Additional genes also shown in their Extended data Figure 2D.: Wilcoxon ranksum test P-value for gene set overrepresentation: 9.50e-01 Mean rank of genes in gene set: 14967.33 Rank on gene expression program of genes in gene set:
Mesemchymal validated (Olsen) Stated on pages 7 and 8 of the main text of Olsen et al. https://www.biorxiv.org/content/10.1101/2020.05.04.077057v1 - it is stated that a mesenchymal-like neuroblastoma cell state is validate by combined immunofluorescence staining for PDGFRA and FISH for PPMID gain, a gene on 17q.: Wilcoxon ranksum test P-value for gene set overrepresentation: 9.52e-01 Mean rank of genes in gene set: 18960 Rank on gene expression program of genes in gene set:
Endothelium (Hanemaaijer) Marker genes obtained from Supplementary Table SD of Hanemaaijer et al (PMID 33500353). The authors generated single-cell RNA-seq data (sort-seq, 2,229 cells total) from mouse adrenal glads at E13.5, E14.5, E17.5, E18.5, P1 and P5. These were marker genes that matched with a similar dataset generated by Furlan et al (PMID 28684471). This particular set of markers are for the broad Endothelium cluster: Wilcoxon ranksum test P-value for gene set overrepresentation: 9.52e-01 Mean rank of genes in gene set: 18980 Rank on gene expression program of genes in gene set:
Stromal 3 (Hanemaaijer) Marker genes obtained from Supplementary Table SD of Hanemaaijer et al (PMID 33500353). The authors generated single-cell RNA-seq data (sort-seq, 2,229 cells total) from mouse adrenal glads at E13.5, E14.5, E17.5, E18.5, P1 and P5. These were marker genes that matched with a similar dataset generated by Furlan et al (PMID 28684471). This particular set of markers are for Stroma subcluster: Wilcoxon ranksum test P-value for gene set overrepresentation: 9.56e-01 Mean rank of genes in gene set: 15156 Rank on gene expression program of genes in gene set:
Inflammatory Macrophages (Yuan) Obtained from Fig. 6 of Yuan et al. https://www.biorxiv.org/content/10.1101/2020.05.15.097469v1: Wilcoxon ranksum test P-value for gene set overrepresentation: 9.57e-01 Mean rank of genes in gene set: 19240 Rank on gene expression program of genes in gene set:
Mesenchymal (Olsen) Markers listed in on page 3 of the main text of Olsen et al. https://www.biorxiv.org/content/10.1101/2020.05.04.077057v1 - these markers are stated as being expressed in a group of mesenchymal-like cells (some at least claimed to be neuroblastoma cells) shown in their UMAP representation on Fig. 1D. They reference the two Nature Genetics paper.: Wilcoxon ranksum test P-value for gene set overrepresentation: 9.57e-01 Mean rank of genes in gene set: 14453.5 Rank on gene expression program of genes in gene set:
EMT II (Kinker) These marker genes were obtained in a pan cancer cell lines NMF analysis of scRNA-eq data in Kinker et al (PMID 33128048) - 10 metaprograms were recovered that manifest across cancers, this EMT program was enriched in HNSCC cell lines: Wilcoxon ranksum test P-value for gene set overrepresentation: 9.60e-01 Mean rank of genes in gene set: 14564.75 Rank on gene expression program of genes in gene set:
Mesenchymal cells (Yuan) Obtained from Fig. 1 of Yuan et al. https://www.biorxiv.org/content/10.1101/2020.05.15.097469v1: Wilcoxon ranksum test P-value for gene set overrepresentation: 9.62e-01 Mean rank of genes in gene set: 14627.5 Rank on gene expression program of genes in gene set:
Noninflammatory Macrophages (Yuan) Obtained from Fig. 6 of Yuan et al. https://www.biorxiv.org/content/10.1101/2020.05.15.097469v1: Wilcoxon ranksum test P-value for gene set overrepresentation: 9.62e-01 Mean rank of genes in gene set: 16689 Rank on gene expression program of genes in gene set:
EpiSen (Kinker) These marker genes were obtained in a pan cancer cell lines NMF analysis of scRNA-eq data in Kinker et al (PMID 33128048) - 10 metaprograms were recovered that manifest across cancers, an epithelial senescence associated program.: Wilcoxon ranksum test P-value for gene set overrepresentation: 9.71e-01 Mean rank of genes in gene set: 14400.8 Rank on gene expression program of genes in gene set:
Mesenchymal (Kildisiute) Mesenchymal markers obtained from Kildisiute et al, Supplmenentary Table 2, references supporting these genes are provided in Supp Table S2 of Kildisiute et al (PMID 33547074) https://www.science.org/doi/suppl/10.1126/sciadv.abd3311/suppl_file/abd3311_tables_s1_to_s12.xlsx: Wilcoxon ranksum test P-value for gene set overrepresentation: 9.80e-01 Mean rank of genes in gene set: 17780 Rank on gene expression program of genes in gene set:
Myofibroblasts (Jansky) Mentioned in the main text (Jansky et al, Nature Genetics (2021)), page 1, that ACTA2+ Myofibroblasts were identified in their fetal adrenal glands, this is also highlighted in the UMAP plot on their Fig 1B. Additional genes also shown in their Extended data Figure 2D.: Wilcoxon ranksum test P-value for gene set overrepresentation: 9.83e-01 Mean rank of genes in gene set: 16531.33 Rank on gene expression program of genes in gene set:
Adrenergic proliferating cluster (Olsen) Stated on pages 6 and 7 of the main text of Olsen et al. https://www.biorxiv.org/content/10.1101/2020.05.04.077057v1 - it is argued that upon reanalysis of the adrenergic neuroblastoma cells, there is further heterogeneity, grouped into proliferating, mature and immature cell populations. These genes were found as markers for proliferating adrenergic cells: Wilcoxon ranksum test P-value for gene set overrepresentation: 9.84e-01 Mean rank of genes in gene set: 18081.5 Rank on gene expression program of genes in gene set:
Muscle progenitor (Jansky) Mentioned in the main text (Jansky et al, Nature Genetics (2021)), page 1, that PAX7+ Muscle progenitor were identified in their fetal adrenal glands, this is also highlighted in the UMAP plot on their Fig 1B. Additional genes also shown in their Extended data Figure 2D.: Wilcoxon ranksum test P-value for gene set overrepresentation: 9.87e-01 Mean rank of genes in gene set: 16808 Rank on gene expression program of genes in gene set:
Mesencchymal populations mouse (Olsen) Stated on page 6 of the main text of Olsen et al. https://www.biorxiv.org/content/10.1101/2020.05.04.077057v1 - seems to be referencing previous mouse lineage tracing studies in mouse which sucggested SCPs give rise to autonomic neurons and mesenchymal cells: Wilcoxon ranksum test P-value for gene set overrepresentation: 9.87e-01 Mean rank of genes in gene set: 18415 Rank on gene expression program of genes in gene set:
EMT I melanoma (Kinker) These marker genes were obtained in a pan cancer cell lines NMF analysis of scRNA-eq data in Kinker et al (PMID 33128048) - 10 metaprograms were recovered that manifest across cancers, this EMT program was melanoma specific.: Wilcoxon ranksum test P-value for gene set overrepresentation: 9.91e-01 Mean rank of genes in gene set: 15517.4 Rank on gene expression program of genes in gene set:
Meta_8 undefined undifferentiated neuronal (Dong) Markers obtained in computationally inferred meta program (by NMF applied to their neuroblastoma sc-RNA-seq data) from Fig. 5(a) of Dong et al. (PMID 32946775).: Wilcoxon ranksum test P-value for gene set overrepresentation: 9.91e-01 Mean rank of genes in gene set: 19047 Rank on gene expression program of genes in gene set:
SCPs neuroblastoma unique (Olsen) Similar to above, but for genes unique to neuroblastoma SCP-like cells. Note FN1 is often used as a mesenchymal marker gene.: Wilcoxon ranksum test P-value for gene set overrepresentation: 9.94e-01 Mean rank of genes in gene set: 15441.83 Rank on gene expression program of genes in gene set:
M1 Macrophage These genes were collated from multiple sources: Wilcoxon ranksum test P-value for gene set overrepresentation: 9.96e-01 Mean rank of genes in gene set: 13521.73 Rank on gene expression program of genes in gene set:
Mesenchymal cells (Jansky) Mentioned in the main text (Jansky et al, Nature Genetics (2021)), page 1, that COL1A1+ Mesenchymal were identified in their fetal adrenal glands, this is also highlighted in the UMAP plot on their Fig 1B. Additional genes also shown in their Extended data Figure 2D.: Wilcoxon ranksum test P-value for gene set overrepresentation: 9.98e-01 Mean rank of genes in gene set: 18881.33 Rank on gene expression program of genes in gene set:
Schwann cell precursors (Dong) Obtained from Fig. 3c of Dong et al. (PMID 32946775).: Wilcoxon ranksum test P-value for gene set overrepresentation: 9.98e-01 Mean rank of genes in gene set: 19007.67 Rank on gene expression program of genes in gene set:
Schwann cell precursors (Kameneva) Marker gene were obtained from Fig. 1D of Kameneva et al (PMID 33833454). These genes were used by the authors to annotate each cell type in their human fetal adrenal scRNA-seq data obtained 6, 8, 9, 11, 12 and 14 weeks post conception. The authors data suggest these SCPs can give rise to symphathoblasts, which can then give rise to chromaffin cells. However, these SCPs can also directly give rise to chromaffin cells (i.e there are two bridges/paths).: Wilcoxon ranksum test P-value for gene set overrepresentation: 9.98e-01 Mean rank of genes in gene set: 19007.67 Rank on gene expression program of genes in gene set:
Proliferating Cells These are canonical marker genes of cycling cells, obtained from Fig. 3 of Hsiao et al. (PMID 32312741): Wilcoxon ranksum test P-value for gene set overrepresentation: 9.98e-01 Mean rank of genes in gene set: 17795.5 Rank on gene expression program of genes in gene set:
Schwann cell precursor-like Fig 1D (Olsen) Similar to above, but for selected SCP marker genes.: Wilcoxon ranksum test P-value for gene set overrepresentation: 9.99e-01 Mean rank of genes in gene set: 18692.25 Rank on gene expression program of genes in gene set:
Schwann cell precursor (Kildisiute) SCP markers obtained from Kildisiute et al, Supplmenentary Table 2, references supporting these genes are provided in Supp Table S2 of Kildisiute et al (PMID 33547074) https://www.science.org/doi/suppl/10.1126/sciadv.abd3311/suppl_file/abd3311_tables_s1_to_s12.xlsx: Wilcoxon ranksum test P-value for gene set overrepresentation: 1.00e+00 Mean rank of genes in gene set: 18977 Rank on gene expression program of genes in gene set:
Schwann cell precursor (Olsen) Markers listed in on page 4 of the main text of Olsen et al. https://www.biorxiv.org/content/10.1101/2020.05.04.077057v1 - these markers are stated as being characteristic of Schwann cell lineage and Furlan et al. (Science 2017, PMID 28684471) is referenced to support this. These cell types seem to be claimed to form a bridge between the mesenchymal and adrenergic cell types.: Wilcoxon ranksum test P-value for gene set overrepresentation: 1.00e+00 Mean rank of genes in gene set: 18764.4 Rank on gene expression program of genes in gene set:
Schwann cell precursors (Jansky Fig1E) Heatmap in Fig. 1E, marker genes derived from Jansks scRNA-seq data for adrenal medulla cell types.: Wilcoxon ranksum test P-value for gene set overrepresentation: 1.00e+00 Mean rank of genes in gene set: 18785.8 Rank on gene expression program of genes in gene set:
Bridge region mesencchymal (Olsen) Marker genes shown in Fig. 3A of Olsen et al. https://www.biorxiv.org/content/10.1101/2020.05.04.077057v1 - Cells were ordered by pseudotime in the bridge region, this first group of cells were from the mesenchymal part of the trajectory.: Wilcoxon ranksum test P-value for gene set overrepresentation: 1.00e+00 Mean rank of genes in gene set: 15423.08 Rank on gene expression program of genes in gene set:
Stroma (Hanemaaijer) Marker genes obtained from Supplementary Table SD of Hanemaaijer et al (PMID 33500353). The authors generated single-cell RNA-seq data (sort-seq, 2,229 cells total) from mouse adrenal glads at E13.5, E14.5, E17.5, E18.5, P1 and P5. These were marker genes that matched with a similar dataset generated by Furlan et al (PMID 28684471). This particular set of markers are for the broad Stroma cluster: Wilcoxon ranksum test P-value for gene set overrepresentation: 1.00e+00 Mean rank of genes in gene set: 19159 Rank on gene expression program of genes in gene set:
Bridge region SCP-like (Olsen) As above but for the SCP-like region: Wilcoxon ranksum test P-value for gene set overrepresentation: 1.00e+00 Mean rank of genes in gene set: 18538.5 Rank on gene expression program of genes in gene set:
Schwann cell precursor Fig2 (Kamenva) Marker genes were obtained from Fig. 2H of Kameneva et al (PMID 33833454). These genes were used to show cells transitioning from a SCP to a symphathoblast state in their human fetal single-cell RNA-seq data.: Wilcoxon ranksum test P-value for gene set overrepresentation: 1.00e+00 Mean rank of genes in gene set: 16177.15 Rank on gene expression program of genes in gene set:
Subepicardial mesenchyme (Kameneva) Marker gene were obtained from Fig. 1D of Kameneva et al (PMID 33833454). These genes were used by the authors to annotate each cell type in their human fetal adrenal scRNA-seq data obtained 6, 8, 9, 11, 12 and 14 weeks post conception.: Wilcoxon ranksum test P-value for gene set overrepresentation: 1.00e+00 Mean rank of genes in gene set: 18772.71 Rank on gene expression program of genes in gene set:
Stromal 1 (Hanemaaijer) Marker genes obtained from Supplementary Table SD of Hanemaaijer et al (PMID 33500353). The authors generated single-cell RNA-seq data (sort-seq, 2,229 cells total) from mouse adrenal glads at E13.5, E14.5, E17.5, E18.5, P1 and P5. These were marker genes that matched with a similar dataset generated by Furlan et al (PMID 28684471). This particular set of markers are for Stroma subcluster: Wilcoxon ranksum test P-value for gene set overrepresentation: 1.00e+00 Mean rank of genes in gene set: 18942.57 Rank on gene expression program of genes in gene set:
Inflammatory CAF These marker genes were curated across cancer subtypes in multiple organ systems as reviewed in Lavie et. al. (PMID 35883004) and contain inflammatory specific CAF genes: Wilcoxon ranksum test P-value for gene set overrepresentation: 1.00e+00 Mean rank of genes in gene set: 13821.19 Rank on gene expression program of genes in gene set:
Stromal 2 (Hanemaaijer) Marker genes obtained from Supplementary Table SD of Hanemaaijer et al (PMID 33500353). The authors generated single-cell RNA-seq data (sort-seq, 2,229 cells total) from mouse adrenal glads at E13.5, E14.5, E17.5, E18.5, P1 and P5. These were marker genes that matched with a similar dataset generated by Furlan et al (PMID 28684471). This particular set of markers are for Stroma subcluster: Wilcoxon ranksum test P-value for gene set overrepresentation: 1.00e+00 Mean rank of genes in gene set: 17082.17 Rank on gene expression program of genes in gene set:
SCPs mouse and neuroblastoma (Olsen) Similar to above, but for genes common to neuroblastoma SCP-like cells (as determined from their UMAP plot) and mouse SCP cells.: Wilcoxon ranksum test P-value for gene set overrepresentation: 1.00e+00 Mean rank of genes in gene set: 16358.47 Rank on gene expression program of genes in gene set:
Schwann cell Precursor (Hanemaaijer) Marker genes obtained from Supplementary Table SD of Hanemaaijer et al (PMID 33500353). The authors generated single-cell RNA-seq data (sort-seq, 2,229 cells total) from mouse adrenal glads at E13.5, E14.5, E17.5, E18.5, P1 and P5. These were marker genes that matched with a similar dataset generated by Furlan et al (PMID 28684471). This particular set of markers are for the SCP subcluster, which is part of the Adrenal Medulla cluster: Wilcoxon ranksum test P-value for gene set overrepresentation: 1.00e+00 Mean rank of genes in gene set: 16609 Rank on gene expression program of genes in gene set:
Endothelial subclusters 2-6 (Hanemaaijer) Marker genes obtained from Supplementary Table SD of Hanemaaijer et al (PMID 33500353). The authors generated single-cell RNA-seq data (sort-seq, 2,229 cells total) from mouse adrenal glads at E13.5, E14.5, E17.5, E18.5, P1 and P5. These were marker genes that matched with a similar dataset generated by Furlan et al (PMID 28684471). This particular set of markers are for Various endothelial subclusters of Endothelium clusters: Wilcoxon ranksum test P-value for gene set overrepresentation: 1.00e+00 Mean rank of genes in gene set: 15969.6 Rank on gene expression program of genes in gene set:
Mesenchymal Fig 1D (Olsen) Selected mesenchymal marker genes shown in Fig. 1D of Olsen et al. https://www.biorxiv.org/content/10.1101/2020.05.04.077057v1 - these are highly expressed in their mesenchymal cluster on their UMAP.: Wilcoxon ranksum test P-value for gene set overrepresentation: 1.00e+00 Mean rank of genes in gene set: 17606.54 Rank on gene expression program of genes in gene set:
Myofibroblastic CAF These marker genes were curated across cancer subtypes in multiple organ systems as reviewed in Lavie et. al. (PMID 35883004) and contain myofibroblastic specific CAF genes: Wilcoxon ranksum test P-value for gene set overrepresentation: 1.00e+00 Mean rank of genes in gene set: 15853.63 Rank on gene expression program of genes in gene set:
Below shows ranks on this GEP for literature curated gene lists for large gene sets
These include those reported as mesenchymal/adrenergic by Van Groningen et al.
High ranks indicate this gene is a driver of this GEP (note these results are not ordered).
The Mean Count column shows the mean read count in cells scoring highly (H > 50) on this gene expression program.
VanGroningen Adrenergic Genes Adrenergic marker genes from Supplementary Table 2 of Van Groningen et al. Nature Genetics 2017. These genes were identified by differential expression analysis of mesenchymal-like and adrenergic-like neuroblastoma cell lines. Wilcoxon ranksum test P-value for gene set overrepresentation: 1.08e-26 Mean rank of genes in gene set: 6486.02 Median rank of genes in gene set: 3190 Rank on gene expression program of top 30 genes in gene set:
VanGroningen Mesenchymal Genes Mesenchymal marker genes from Supplementary Table 2 of Van Groningen et al. Nature Genetics 2017. These genes were identified by differential expression analysis of mesenchymal-like and adrenergic-like neuroblastoma cell lines. Wilcoxon ranksum test P-value for gene set overrepresentation: 1.00e+00 Mean rank of genes in gene set: 13998.44 Median rank of genes in gene set: 17310 Rank on gene expression program of top 30 genes in gene set:
Descartes adrenocortical markers Top 50 marker genes of adrenocortical cells in the Decartes fetal adrenal single cell map (https://atlas.brotmanbaty.org/bbi/human-gene-expression-during-development/cell/adrenocortical/in/adrenal) Wilcoxon ranksum test P-value for gene set overrepresentation: 7.16e-01 Mean rank of genes in gene set: 10156.38 Median rank of genes in gene set: 11069.5 Rank on gene expression program of top 30 genes in gene set:
Descartes chromaffin markers Top 50 marker genes of chromaffin cells in the Decartes fetal adrenal single cell map (https://atlas.brotmanbaty.org/bbi/human-gene-expression-during-development/cell/chromaffin/in/adrenal) Wilcoxon ranksum test P-value for gene set overrepresentation: 5.51e-10 Mean rank of genes in gene set: 4544.5 Median rank of genes in gene set: 950 Rank on gene expression program of top 30 genes in gene set:
Descartes Vascular_endothelial markers Top 50 marker genes of Vascular_endothelial cells in the Decartes fetal adrenal single cell map (https://atlas.brotmanbaty.org/bbi/human-gene-expression-during-development/cell/vascular_endothelial/in/adrenal) Wilcoxon ranksum test P-value for gene set overrepresentation: 1.00e+00 Mean rank of genes in gene set: 12592.19 Median rank of genes in gene set: 14260 Rank on gene expression program of top 30 genes in gene set:
Descartes stromal markers Top 50 marker genes of stromal cells in the Decartes fetal adrenal single cell map (https://atlas.brotmanbaty.org/bbi/human-gene-expression-during-development/cell/stromal/in/adrenal) Wilcoxon ranksum test P-value for gene set overrepresentation: 1.00e+00 Mean rank of genes in gene set: 16731.96 Median rank of genes in gene set: 18263.5 Rank on gene expression program of top 30 genes in gene set:
Descartes sympathoblasts markers Top 50 marker genes of sympathoblasts cells in the Decartes fetal adrenal single cell map (https://atlas.brotmanbaty.org/bbi/human-gene-expression-during-development/cell/sympathoblasts/in/adrenal) Wilcoxon ranksum test P-value for gene set overrepresentation: 2.37e-04 Mean rank of genes in gene set: 6659.21 Median rank of genes in gene set: 3110 Rank on gene expression program of top 30 genes in gene set:
Descartes erythroblasts markers Top 50 marker genes of erythroblasts cells in the Decartes fetal adrenal single cell map (https://atlas.brotmanbaty.org/bbi/human-gene-expression-during-development/cell/erythroblasts/in/adrenal) Wilcoxon ranksum test P-value for gene set overrepresentation: 7.69e-01 Mean rank of genes in gene set: 10348.39 Median rank of genes in gene set: 12008.5 Rank on gene expression program of top 30 genes in gene set:
Descartes myeloid markers Top 50 marker genes of myeloid cells in the Decartes fetal adrenal single cell map (https://atlas.brotmanbaty.org/bbi/human-gene-expression-during-development/cell/myeloid/in/adrenal) Wilcoxon ranksum test P-value for gene set overrepresentation: 9.97e-01 Mean rank of genes in gene set: 12020.69 Median rank of genes in gene set: 13509 Rank on gene expression program of top 30 genes in gene set:
Descartes Schwann markers Top 50 marker genes of Schwann cells in the Decartes fetal adrenal single cell map (https://atlas.brotmanbaty.org/bbi/human-gene-expression-during-development/cell/schwann/in/adrenal) Wilcoxon ranksum test P-value for gene set overrepresentation: 1.00e+00 Mean rank of genes in gene set: 14677.21 Median rank of genes in gene set: 18367 Rank on gene expression program of top 30 genes in gene set:
Descartes Megakaryocytes markers Top 50 marker genes of Megakaryocytes cells in the Decartes fetal adrenal single cell map (https://atlas.brotmanbaty.org/bbi/human-gene-expression-during-development/cell/megakaryocytes/in/adrenal) Wilcoxon ranksum test P-value for gene set overrepresentation: 9.66e-01 Mean rank of genes in gene set: 11145.77 Median rank of genes in gene set: 13138 Rank on gene expression program of top 30 genes in gene set:
Descartes Lyphoid markers Top 50 marker genes of Lyphoid cells in the Decartes fetal adrenal single cell map (https://atlas.brotmanbaty.org/bbi/human-gene-expression-during-development/cell/lymphoid/in/adrenal) Wilcoxon ranksum test P-value for gene set overrepresentation: 8.89e-01 Mean rank of genes in gene set: 10716.21 Median rank of genes in gene set: 12650.5 Rank on gene expression program of top 30 genes in gene set:
Below shows the ranks on this GEP for immune marker gene lists curated by CellTypist (https://www.celltypist.org/encyclopedia).
High ranks indicate this gene is a driver of this GEP.
These curated gene list are ranked by P-value (on this GEP) of their constituent genes.
The Mean Count column shows the mean read count in cells scoring highly (H > 50) on this gene expression program.
ILC: ILC (curated markers) specialised innate immune cells from the lymphoid lineage but without antigen-specific T-cell receptors on the surface: Wilcoxon ranksum test P-value for gene set overrepresentation: 4.28e-03 Mean rank of genes in gene set: 1194.67 Rank on gene expression program of genes in gene set:
pDC precursor: pDC precursor (curated markers) precursors of plasmacytoid dendritic cells which have intermixed lymphoid and myeloid origins and give rise to plasmacytoid dendritic cells: Wilcoxon ranksum test P-value for gene set overrepresentation: 1.06e-02 Mean rank of genes in gene set: 2243.33 Rank on gene expression program of genes in gene set:
Megakaryocyte precursor: Megakaryocyte precursor (curated markers) megakaryocyte precursors in the bone marrow that are committed to megakaryocytes: Wilcoxon ranksum test P-value for gene set overrepresentation: 1.44e-02 Mean rank of genes in gene set: 1035 Rank on gene expression program of genes in gene set:
Plasma cells: Plasma cells (model markers) B-lymphocyte white blood cells capable of secreting large quantities of immunoglobulins or antibodies: Wilcoxon ranksum test P-value for gene set overrepresentation: 1.64e-02 Mean rank of genes in gene set: 4340.8 Rank on gene expression program of genes in gene set:
B cells: Transitional B cells (model markers) immature B cell precursors in the bone marrow which connect Pre-B cells with mature naive B cells and are subject to the process of B cell selection: Wilcoxon ranksum test P-value for gene set overrepresentation: 4.31e-02 Mean rank of genes in gene set: 90 Rank on gene expression program of genes in gene set:
Monocyte precursor: Monocyte precursor (model markers) monocyte precursors that are committed to the monocytes: Wilcoxon ranksum test P-value for gene set overrepresentation: 4.75e-02 Mean rank of genes in gene set: 4286.33 Rank on gene expression program of genes in gene set:
Double-positive thymocytes: Double-positive thymocytes (curated markers) immature thymocytes capable of binding MHC class I or II in the double positive (co-receptors CD4+ and CD8+) stage: Wilcoxon ranksum test P-value for gene set overrepresentation: 4.78e-02 Mean rank of genes in gene set: 365 Rank on gene expression program of genes in gene set:
ILC: ILC2 (model markers) innate lymphoid cell subpopulation II that promotes type 2 inflammation and is involved in immune response against large extracellular pathogens: Wilcoxon ranksum test P-value for gene set overrepresentation: 7.62e-02 Mean rank of genes in gene set: 1678 Rank on gene expression program of genes in gene set:
ILC: ILC3 (curated markers) innate lymphoid cell subpopulation III that is required for host defense against specific extracellular bacteria and fungi: Wilcoxon ranksum test P-value for gene set overrepresentation: 9.10e-02 Mean rank of genes in gene set: 5364.67 Rank on gene expression program of genes in gene set:
Granulocytes: Granulocytes (curated markers) cells of innate immune system with specific granules in the cytoplasm including neutrophils: Wilcoxon ranksum test P-value for gene set overrepresentation: 9.64e-02 Mean rank of genes in gene set: 5469.67 Rank on gene expression program of genes in gene set:
T cells: Tem/Effector helper T cells PD1+ (model markers) CD4+ helper T lymphocyte subpopulation in the thymus which features the expression of programmed cell death protein 1 (PD-1): Wilcoxon ranksum test P-value for gene set overrepresentation: 1.07e-01 Mean rank of genes in gene set: 5656.67 Rank on gene expression program of genes in gene set:
HSC/MPP: Megakaryocyte-erythroid-mast cell progenitor (curated markers) shared progenitors in the fetal liver which originate from common myeloid progenitors and differentiate into megakaryocytes: Wilcoxon ranksum test P-value for gene set overrepresentation: 1.15e-01 Mean rank of genes in gene set: 4934 Rank on gene expression program of genes in gene set:
T cells: CD8a/a (curated markers) unconventional T lymphocytes with CD8 alpha/alpha homodimers binding MHC molecules: Wilcoxon ranksum test P-value for gene set overrepresentation: 1.22e-01 Mean rank of genes in gene set: 5059 Rank on gene expression program of genes in gene set:
Plasma cells: Plasma cells (curated markers) B-lymphocyte white blood cells capable of secreting large quantities of immunoglobulins or antibodies: Wilcoxon ranksum test P-value for gene set overrepresentation: 1.24e-01 Mean rank of genes in gene set: 5941.33 Rank on gene expression program of genes in gene set:
Erythroid: Mid erythroid (curated markers) middle erythroid cells in fetal liver: Wilcoxon ranksum test P-value for gene set overrepresentation: 1.37e-01 Mean rank of genes in gene set: 6141.33 Rank on gene expression program of genes in gene set:
T cells: MAIT cells (model markers) mucosal-associated invariant T cells which have semi-invariant T-cell receptors and are restricted by the MHC I-like molecule MR1: Wilcoxon ranksum test P-value for gene set overrepresentation: 1.43e-01 Mean rank of genes in gene set: 6228 Rank on gene expression program of genes in gene set:
Megakaryocyte precursor: Megakaryocyte precursor (model markers) megakaryocyte precursors in the bone marrow that are committed to megakaryocytes: Wilcoxon ranksum test P-value for gene set overrepresentation: 1.57e-01 Mean rank of genes in gene set: 4048 Rank on gene expression program of genes in gene set:
HSC/MPP: Early lymphoid/T lymphoid (model markers) early lymphoid/T lymphocytes with lymphocyte potential in the fetal liver before T cells emerged from the thymus: Wilcoxon ranksum test P-value for gene set overrepresentation: 1.59e-01 Mean rank of genes in gene set: 5731 Rank on gene expression program of genes in gene set:
T cells: Memory CD4+ cytotoxic T cells (curated markers) CD4+ memory T cells which have cytotoxic activities by secreting granzymes and perforin and by killing target cells on the basis of MHC class II: Wilcoxon ranksum test P-value for gene set overrepresentation: 1.67e-01 Mean rank of genes in gene set: 5846 Rank on gene expression program of genes in gene set:
Double-negative thymocytes: Double-negative thymocytes (model markers) the early immature thymocytes from the thymus in the double negative (co-receptors CD4- and CD8-) stage: Wilcoxon ranksum test P-value for gene set overrepresentation: 1.76e-01 Mean rank of genes in gene set: 7700.14 Rank on gene expression program of genes in gene set:
Double-positive thymocytes: Double-positive thymocytes (model markers) immature thymocytes capable of binding MHC class I or II in the double positive (co-receptors CD4+ and CD8+) stage: Wilcoxon ranksum test P-value for gene set overrepresentation: 1.77e-01 Mean rank of genes in gene set: 7555.33 Rank on gene expression program of genes in gene set:
T cells: Tem/Effector helper T cells PD1+ (curated markers) CD4+ helper T lymphocyte subpopulation in the thymus which features the expression of programmed cell death protein 1 (PD-1): Wilcoxon ranksum test P-value for gene set overrepresentation: 2.00e-01 Mean rank of genes in gene set: 6957 Rank on gene expression program of genes in gene set:
DC: DC1 (curated markers) conventional type 1 dendritic cells which constitute a rare dendritic cell population with superior cross-presentation ability: Wilcoxon ranksum test P-value for gene set overrepresentation: 2.23e-01 Mean rank of genes in gene set: 6661 Rank on gene expression program of genes in gene set:
B cells: Memory B cells (curated markers) long-lived mature B lymphocytes which are formed within germinal centers following primary infection and selected for higher-affinity immunoglobulin: Wilcoxon ranksum test P-value for gene set overrepresentation: 2.40e-01 Mean rank of genes in gene set: 7391.67 Rank on gene expression program of genes in gene set:
T cells: Tcm/Naive helper T cells (curated markers) CD4+ helper T lymphocytes mainly localized in secondary lymphoid tissues and sustaining the responses by proliferating and producing new effectors: Wilcoxon ranksum test P-value for gene set overrepresentation: 2.43e-01 Mean rank of genes in gene set: 6914 Rank on gene expression program of genes in gene set:
HSC/MPP: MEMP (curated markers) shared progenitors which are derived from common myeloid progenitors and will differentiate into megakaryocytes: Wilcoxon ranksum test P-value for gene set overrepresentation: 2.70e-01 Mean rank of genes in gene set: 7687.33 Rank on gene expression program of genes in gene set:
pDC: pDC (model markers) rare plasmacytoid dendritic cell subpopulation which serves as the major source of type I interferons when the body is infected by a virus: Wilcoxon ranksum test P-value for gene set overrepresentation: 2.94e-01 Mean rank of genes in gene set: 8155.75 Rank on gene expression program of genes in gene set:
T cells: Type 1 helper T cells (curated markers) CD4+ helper T lymphocyte subpopulation which is capable of producing interferon-gamma and modulating cell-mediated immune responses: Wilcoxon ranksum test P-value for gene set overrepresentation: 3.11e-01 Mean rank of genes in gene set: 7714.5 Rank on gene expression program of genes in gene set:
DC: Migratory DCs (curated markers) migratory dendritic cells that transport antigens to the draining lymph nodes during both homeostatic conditions and infections: Wilcoxon ranksum test P-value for gene set overrepresentation: 3.33e-01 Mean rank of genes in gene set: 8273.33 Rank on gene expression program of genes in gene set:
HSC/MPP: GMP (curated markers) hematopoietic granulocyte-monocyte progenitors that are committed to the granulocyte and monocyte lineage cells: Wilcoxon ranksum test P-value for gene set overrepresentation: 3.33e-01 Mean rank of genes in gene set: 8274.67 Rank on gene expression program of genes in gene set:
Cycling cells: Cycling DCs (model markers) proliferating dendritic cells: Wilcoxon ranksum test P-value for gene set overrepresentation: 3.42e-01 Mean rank of genes in gene set: 7400 Rank on gene expression program of genes in gene set:
Cycling cells: Cycling T cells (model markers) proliferating T lymphocytes: Wilcoxon ranksum test P-value for gene set overrepresentation: 3.49e-01 Mean rank of genes in gene set: 8415.67 Rank on gene expression program of genes in gene set:
HSC/MPP: Early lymphoid/T lymphoid (curated markers) early lymphoid/T lymphocytes with lymphocyte potential in the fetal liver before T cells emerged from the thymus: Wilcoxon ranksum test P-value for gene set overrepresentation: 3.50e-01 Mean rank of genes in gene set: 8143.5 Rank on gene expression program of genes in gene set:
pDC: pDC (curated markers) rare plasmacytoid dendritic cell subpopulation which serves as the major source of type I interferons when the body is infected by a virus: Wilcoxon ranksum test P-value for gene set overrepresentation: 3.74e-01 Mean rank of genes in gene set: 8392 Rank on gene expression program of genes in gene set:
Myelocytes: Myelocytes (curated markers) early granulocyte precursors that are derive from promyelocytes and later mature into metamyelocytes: Wilcoxon ranksum test P-value for gene set overrepresentation: 3.76e-01 Mean rank of genes in gene set: 7895 Rank on gene expression program of genes in gene set:
Monocytes: Non-classical monocytes (model markers) CD16+ myeloid mononuclear recirculating leukocytes that are capable of differentiating into macrophages and myeloid lineage dendritic cells: Wilcoxon ranksum test P-value for gene set overrepresentation: 3.81e-01 Mean rank of genes in gene set: 8977.67 Rank on gene expression program of genes in gene set:
HSC/MPP: CMP (curated markers) highly proliferative common myeloid progenitors which later give rise to granulocyte-monocyte progenitors and megakaryocyte-erythroid progenitors: Wilcoxon ranksum test P-value for gene set overrepresentation: 3.82e-01 Mean rank of genes in gene set: 8697.67 Rank on gene expression program of genes in gene set:
Mast cells: Mast cells (curated markers) long-lived innate migrant cells found in most tissues with many large basophilic granules rich in histamine and heparin: Wilcoxon ranksum test P-value for gene set overrepresentation: 3.85e-01 Mean rank of genes in gene set: 8035 Rank on gene expression program of genes in gene set:
T cells: CD8a/b(entry) (curated markers) T lymphocytes with CD8 alpha/beta heterodimers in the late double-positive (entry) stage during T cell development: Wilcoxon ranksum test P-value for gene set overrepresentation: 3.87e-01 Mean rank of genes in gene set: 8742.33 Rank on gene expression program of genes in gene set:
DC: DC3 (model markers) a dendritic cell subtype found in bone marrow which shares features with monocytes and conventional type 2 dendritic cells: Wilcoxon ranksum test P-value for gene set overrepresentation: 3.92e-01 Mean rank of genes in gene set: 8785.67 Rank on gene expression program of genes in gene set:
pDC precursor: pDC precursor (model markers) precursors of plasmacytoid dendritic cells which have intermixed lymphoid and myeloid origins and give rise to plasmacytoid dendritic cells: Wilcoxon ranksum test P-value for gene set overrepresentation: 3.94e-01 Mean rank of genes in gene set: 8798.67 Rank on gene expression program of genes in gene set:
Macrophages: Hofbauer cells (model markers) primitive placental resident macrophages with granules and vacuoles found in placenta particularly during early pregnancy: Wilcoxon ranksum test P-value for gene set overrepresentation: 3.99e-01 Mean rank of genes in gene set: 8836.67 Rank on gene expression program of genes in gene set:
B cells: Germinal center B cells (model markers) proliferating mature B cells that undergo somatic hypermutation and class-switch recombination in secondary lymphoid organs: Wilcoxon ranksum test P-value for gene set overrepresentation: 3.99e-01 Mean rank of genes in gene set: 8951 Rank on gene expression program of genes in gene set:
ILC precursor: ILC precursor (model markers) innate lymphoid cell precursors which give rise to innate lymphoid cells and lack the characteristics of their mature progenies: Wilcoxon ranksum test P-value for gene set overrepresentation: 4.00e-01 Mean rank of genes in gene set: 9035 Rank on gene expression program of genes in gene set:
Granulocytes: Granulocytes (model markers) cells of innate immune system with specific granules in the cytoplasm including neutrophils: Wilcoxon ranksum test P-value for gene set overrepresentation: 4.01e-01 Mean rank of genes in gene set: 8858.67 Rank on gene expression program of genes in gene set:
Granulocytes: Neutrophils (curated markers) the most abundant type of granulocytes that contains distinctive cytoplasmic granules and forms an essential part of the innate immune system: Wilcoxon ranksum test P-value for gene set overrepresentation: 4.01e-01 Mean rank of genes in gene set: 8677.5 Rank on gene expression program of genes in gene set:
Cycling cells: Cycling NK cells (model markers) proliferating natural killer cells: Wilcoxon ranksum test P-value for gene set overrepresentation: 4.02e-01 Mean rank of genes in gene set: 8686 Rank on gene expression program of genes in gene set:
ILC: ILC (model markers) specialised innate immune cells from the lymphoid lineage but without antigen-specific T-cell receptors on the surface: Wilcoxon ranksum test P-value for gene set overrepresentation: 4.07e-01 Mean rank of genes in gene set: 9005 Rank on gene expression program of genes in gene set:
HSC/MPP: Neutrophil-myeloid progenitor (model markers) progenitors of neutrophils and myeloid cells which are transitioned from hematopoietic stem cells and multipotent progenitors: Wilcoxon ranksum test P-value for gene set overrepresentation: 4.12e-01 Mean rank of genes in gene set: 8945.67 Rank on gene expression program of genes in gene set:
Erythroid: Early erythroid (curated markers) early erythroid cells which are committed to erythroid lineage cells: Wilcoxon ranksum test P-value for gene set overrepresentation: 4.22e-01 Mean rank of genes in gene set: 9029 Rank on gene expression program of genes in gene set:
T cells: Follicular helper T cells (curated markers) specialised CD4+ T cell subpopulation found in the periphery within B cell follicles and stimulating the cognate follicular B cells for class-switching: Wilcoxon ranksum test P-value for gene set overrepresentation: 4.23e-01 Mean rank of genes in gene set: 9039.67 Rank on gene expression program of genes in gene set:
ILC: CD16+ NK cells (curated markers) CD16+ granular lymphocytes that play protective roles against both infectious pathogens and cancer using antibody-dependent cell-mediated cytotoxicity: Wilcoxon ranksum test P-value for gene set overrepresentation: 4.26e-01 Mean rank of genes in gene set: 8630 Rank on gene expression program of genes in gene set:
ILC: CD16- NK cells (curated markers) CD16- granular lymphocytes that play protective roles against both infectious pathogens and cancer using antibody-dependent cell-mediated cytotoxicity: Wilcoxon ranksum test P-value for gene set overrepresentation: 4.26e-01 Mean rank of genes in gene set: 8630 Rank on gene expression program of genes in gene set:
ILC: NK cells (curated markers) granular lymphocytes that play protective roles against both infectious pathogens and cancer using antibody-dependent cell-mediated cytotoxicity: Wilcoxon ranksum test P-value for gene set overrepresentation: 4.26e-01 Mean rank of genes in gene set: 8630 Rank on gene expression program of genes in gene set:
T cells: NKT cells (curated markers) distinct T lymphocyte subpopulation that expresses both alpha/beta T-cell receptors and surface receptors of natural killer cells: Wilcoxon ranksum test P-value for gene set overrepresentation: 4.26e-01 Mean rank of genes in gene set: 8630 Rank on gene expression program of genes in gene set:
B cells: Follicular B cells (curated markers) resting mature B lymphocytes found in the primary and secondary lymphoid follicles and participating in T cell-dependent immune responses: Wilcoxon ranksum test P-value for gene set overrepresentation: 4.28e-01 Mean rank of genes in gene set: 8952.5 Rank on gene expression program of genes in gene set:
T cells: Tem/Effector helper T cells (curated markers) CD4+ helper T lymphocytes mainly localized in lymphoid and peripheral tissues and presenting an immediate: Wilcoxon ranksum test P-value for gene set overrepresentation: 4.40e-01 Mean rank of genes in gene set: 9072.5 Rank on gene expression program of genes in gene set:
Promyelocytes: Promyelocytes (model markers) early granulocyte progenitors in the bone marrow which are derived from the myeloblasts and develop into the myelocytes: Wilcoxon ranksum test P-value for gene set overrepresentation: 4.52e-01 Mean rank of genes in gene set: 9277.67 Rank on gene expression program of genes in gene set:
T cells: Regulatory T cells (curated markers) T cell subpopulation which modulates immune responses and regulates other cells through direct cell-cell contact and cytokine release: Wilcoxon ranksum test P-value for gene set overrepresentation: 4.52e-01 Mean rank of genes in gene set: 9193 Rank on gene expression program of genes in gene set:
ILC: ILC2 (curated markers) innate lymphoid cell subpopulation II that promotes type 2 inflammation and is involved in immune response against large extracellular pathogens: Wilcoxon ranksum test P-value for gene set overrepresentation: 4.56e-01 Mean rank of genes in gene set: 9312 Rank on gene expression program of genes in gene set:
HSC/MPP: CMP (model markers) highly proliferative common myeloid progenitors which later give rise to granulocyte-monocyte progenitors and megakaryocyte-erythroid progenitors: Wilcoxon ranksum test P-value for gene set overrepresentation: 4.57e-01 Mean rank of genes in gene set: 9314 Rank on gene expression program of genes in gene set:
HSC/MPP: Neutrophil-myeloid progenitor (curated markers) progenitors of neutrophils and myeloid cells which are transitioned from hematopoietic stem cells and multipotent progenitors: Wilcoxon ranksum test P-value for gene set overrepresentation: 4.83e-01 Mean rank of genes in gene set: 9421 Rank on gene expression program of genes in gene set:
Promyelocytes: Promyelocytes (curated markers) early granulocyte progenitors in the bone marrow which are derived from the myeloblasts and develop into the myelocytes: Wilcoxon ranksum test P-value for gene set overrepresentation: 4.84e-01 Mean rank of genes in gene set: 9532 Rank on gene expression program of genes in gene set:
DC: Transitional DC (model markers) immature dendritic cells which follow dendritic cell precursors and are committed to the mature dendritic cells: Wilcoxon ranksum test P-value for gene set overrepresentation: 4.88e-01 Mean rank of genes in gene set: 9577.5 Rank on gene expression program of genes in gene set:
B-cell lineage: Pre-pro-B cells (curated markers) the earliest primitive B cell progenitors which express CD34 and SPINK2: Wilcoxon ranksum test P-value for gene set overrepresentation: 4.94e-01 Mean rank of genes in gene set: 9617.33 Rank on gene expression program of genes in gene set:
T cells: T(agonist) (curated markers) unconventional T cell subpopulation in the thymus which expresses MIR155HG and shares some signatures with differentiating regulatory T cells: Wilcoxon ranksum test P-value for gene set overrepresentation: 5.12e-01 Mean rank of genes in gene set: 9763.33 Rank on gene expression program of genes in gene set:
Mast cells: Mast cells (model markers) long-lived innate migrant cells found in most tissues with many large basophilic granules rich in histamine and heparin: Wilcoxon ranksum test P-value for gene set overrepresentation: 5.21e-01 Mean rank of genes in gene set: 9793.6 Rank on gene expression program of genes in gene set:
T cells: Memory CD4+ cytotoxic T cells (model markers) CD4+ memory T cells which have cytotoxic activities by secreting granzymes and perforin and by killing target cells on the basis of MHC class II: Wilcoxon ranksum test P-value for gene set overrepresentation: 5.32e-01 Mean rank of genes in gene set: 9978 Rank on gene expression program of genes in gene set:
HSC/MPP: GMP (model markers) hematopoietic granulocyte-monocyte progenitors that are committed to the granulocyte and monocyte lineage cells: Wilcoxon ranksum test P-value for gene set overrepresentation: 5.37e-01 Mean rank of genes in gene set: 10027.5 Rank on gene expression program of genes in gene set:
B cells: B cells (curated markers) B lymphocytes with diverse cell surface immunoglobulin receptors recognising specific antigenic epitopes and mediating humoral immunity: Wilcoxon ranksum test P-value for gene set overrepresentation: 5.46e-01 Mean rank of genes in gene set: 10125.5 Rank on gene expression program of genes in gene set:
Cycling cells: Cycling gamma-delta T cells (model markers) proliferating gamma-delta (γδ) T lymphocytes: Wilcoxon ranksum test P-value for gene set overrepresentation: 5.59e-01 Mean rank of genes in gene set: 10486 Rank on gene expression program of genes in gene set:
ILC: ILC1 (model markers) innate lymphoid cell subpopulation I that is non-cytotoxic and has overlapping phenotypes and functions with natural killer cells: Wilcoxon ranksum test P-value for gene set overrepresentation: 5.59e-01 Mean rank of genes in gene set: 10486 Rank on gene expression program of genes in gene set:
T cells: CD8a/a (model markers) unconventional T lymphocytes with CD8 alpha/alpha homodimers binding MHC molecules: Wilcoxon ranksum test P-value for gene set overrepresentation: 5.64e-01 Mean rank of genes in gene set: 10004 Rank on gene expression program of genes in gene set:
ILC: ILC1 (curated markers) innate lymphoid cell subpopulation I that is non-cytotoxic and has overlapping phenotypes and functions with natural killer cells: Wilcoxon ranksum test P-value for gene set overrepresentation: 5.64e-01 Mean rank of genes in gene set: 10303.5 Rank on gene expression program of genes in gene set:
Early MK: Early MK (model markers) early megakaryocytes which are committed to megakaryocyte lineage cells: Wilcoxon ranksum test P-value for gene set overrepresentation: 5.65e-01 Mean rank of genes in gene set: 10306.5 Rank on gene expression program of genes in gene set:
Megakaryocytes/platelets: Megakaryocytes/platelets (model markers) large multinucleated cells with numerous azurophilic granules and with mature blood platelets released from the cytoplasm: Wilcoxon ranksum test P-value for gene set overrepresentation: 5.72e-01 Mean rank of genes in gene set: 10684 Rank on gene expression program of genes in gene set:
DC: DC (curated markers) dendrite-shaped cells which process and present antigens to naïve T cells and induce adaptive immune responses : Wilcoxon ranksum test P-value for gene set overrepresentation: 5.81e-01 Mean rank of genes in gene set: 10802 Rank on gene expression program of genes in gene set:
DC: DC2 (curated markers) conventional type 2 dendritic cells which constitute the major subset of myeloid dendritic cells: Wilcoxon ranksum test P-value for gene set overrepresentation: 5.81e-01 Mean rank of genes in gene set: 10802 Rank on gene expression program of genes in gene set:
DC: Migratory DCs (model markers) migratory dendritic cells that transport antigens to the draining lymph nodes during both homeostatic conditions and infections: Wilcoxon ranksum test P-value for gene set overrepresentation: 5.94e-01 Mean rank of genes in gene set: 10600.5 Rank on gene expression program of genes in gene set:
T cells: Tem/Temra cytotoxic T cells (model markers) terminally differentiated CD8+ cytotoxic T lymphocytes with effector memory phenotypes that re-express CD45RA : Wilcoxon ranksum test P-value for gene set overrepresentation: 5.94e-01 Mean rank of genes in gene set: 10431.67 Rank on gene expression program of genes in gene set:
Double-negative thymocytes: Double-negative thymocytes (curated markers) the early immature thymocytes from the thymus in the double negative (co-receptors CD4- and CD8-) stage: Wilcoxon ranksum test P-value for gene set overrepresentation: 6.01e-01 Mean rank of genes in gene set: 10670.5 Rank on gene expression program of genes in gene set:
T cells: Treg(diff) (curated markers) unconventional T lymphocyte subpopulation in the thymus which connects αβ T cells and canonical regulatory T cells and is still differentiating: Wilcoxon ranksum test P-value for gene set overrepresentation: 6.09e-01 Mean rank of genes in gene set: 10553 Rank on gene expression program of genes in gene set:
T cells: Regulatory T cells (model markers) T cell subpopulation which modulates immune responses and regulates other cells through direct cell-cell contact and cytokine release: Wilcoxon ranksum test P-value for gene set overrepresentation: 6.22e-01 Mean rank of genes in gene set: 10529.75 Rank on gene expression program of genes in gene set:
DC: DC2 (model markers) conventional type 2 dendritic cells which constitute the major subset of myeloid dendritic cells: Wilcoxon ranksum test P-value for gene set overrepresentation: 6.23e-01 Mean rank of genes in gene set: 10376.17 Rank on gene expression program of genes in gene set:
B cells: Germinal center B cells (curated markers) proliferating mature B cells that undergo somatic hypermutation and class-switch recombination in secondary lymphoid organs: Wilcoxon ranksum test P-value for gene set overrepresentation: 6.26e-01 Mean rank of genes in gene set: 10935.5 Rank on gene expression program of genes in gene set:
T cells: Tcm/Naive cytotoxic T cells (curated markers) CD8+ cytotoxic T lymphocytes mainly localized in secondary lymphoid tissues and sustaining the responses by proliferating and producing new effectors: Wilcoxon ranksum test P-value for gene set overrepresentation: 6.43e-01 Mean rank of genes in gene set: 11704 Rank on gene expression program of genes in gene set:
Endothelial cells: Endothelial cells (model markers) single-layered lining cells that constitute the interior vasculature: Wilcoxon ranksum test P-value for gene set overrepresentation: 6.48e-01 Mean rank of genes in gene set: 10373.56 Rank on gene expression program of genes in gene set:
T cells: Type 17 helper T cells (curated markers) CD4+ helper T lymphocyte subpopulation which is capable of producing interleukin 17 (IL-17) and mediating protective immunity and autoimmunity: Wilcoxon ranksum test P-value for gene set overrepresentation: 6.51e-01 Mean rank of genes in gene set: 11193 Rank on gene expression program of genes in gene set:
T cells: gamma-delta T cells (model markers) unconventional T lymphocyte subpopulation expressing a gamma-delta T cell receptor complex on the surface to recognise antigens: Wilcoxon ranksum test P-value for gene set overrepresentation: 6.57e-01 Mean rank of genes in gene set: 10964.33 Rank on gene expression program of genes in gene set:
B-cell lineage: Pro-B cells (model markers) early B lymphocyte progenitors undergoing D-J joining on the H chain chromosome and joining of a V segment to the rearranged D-J: Wilcoxon ranksum test P-value for gene set overrepresentation: 6.65e-01 Mean rank of genes in gene set: 11346 Rank on gene expression program of genes in gene set:
Erythrocytes: Erythrocytes (curated markers) biconcave enucleated red blood cells filled with hemoglobin to transport oxygen and carbon dioxide between the lungs and tissues: Wilcoxon ranksum test P-value for gene set overrepresentation: 6.66e-01 Mean rank of genes in gene set: 12060 Rank on gene expression program of genes in gene set:
Erythroid: Late erythroid (curated markers) late erythroid cells following early and middle erythroid cells: Wilcoxon ranksum test P-value for gene set overrepresentation: 6.66e-01 Mean rank of genes in gene set: 12060 Rank on gene expression program of genes in gene set:
HSC/MPP: ELP (model markers) early lymphoid progenitors which originate from hematopoietic stem cells of the bone marrow and migrate to the thymus: Wilcoxon ranksum test P-value for gene set overrepresentation: 6.90e-01 Mean rank of genes in gene set: 12430 Rank on gene expression program of genes in gene set:
DC: DC3 (curated markers) a dendritic cell subtype found in bone marrow which shares features with monocytes and conventional type 2 dendritic cells: Wilcoxon ranksum test P-value for gene set overrepresentation: 6.93e-01 Mean rank of genes in gene set: 11657 Rank on gene expression program of genes in gene set:
ETP: ETP (model markers) early thymic progenitors migrated to the thymus before turning into double-negative thymocytes or other cells: Wilcoxon ranksum test P-value for gene set overrepresentation: 6.94e-01 Mean rank of genes in gene set: 11301 Rank on gene expression program of genes in gene set:
Monocytes: Monocytes (curated markers) myeloid mononuclear recirculating leukocytes that are capable of differentiating into macrophages and myeloid lineage dendritic cells: Wilcoxon ranksum test P-value for gene set overrepresentation: 6.95e-01 Mean rank of genes in gene set: 12512 Rank on gene expression program of genes in gene set:
B-cell lineage: Pro-B cells (curated markers) early B lymphocyte progenitors undergoing D-J joining on the H chain chromosome and joining of a V segment to the rearranged D-J: Wilcoxon ranksum test P-value for gene set overrepresentation: 7.07e-01 Mean rank of genes in gene set: 11423 Rank on gene expression program of genes in gene set:
T cells: Treg(diff) (model markers) unconventional T lymphocyte subpopulation in the thymus which connects αβ T cells and canonical regulatory T cells and is still differentiating: Wilcoxon ranksum test P-value for gene set overrepresentation: 7.09e-01 Mean rank of genes in gene set: 11037.6 Rank on gene expression program of genes in gene set:
Erythroid: Early erythroid (model markers) early erythroid cells which are committed to erythroid lineage cells: Wilcoxon ranksum test P-value for gene set overrepresentation: 7.11e-01 Mean rank of genes in gene set: 11452.67 Rank on gene expression program of genes in gene set:
MNP: MNP (curated markers) mononuclear phagocytes including dendritic cells: Wilcoxon ranksum test P-value for gene set overrepresentation: 7.11e-01 Mean rank of genes in gene set: 12775 Rank on gene expression program of genes in gene set:
HSC/MPP: HSC/MPP (model markers) hematopoietic stem cells and multipotent progenitor cells with the potential of differentiating into different blood cells: Wilcoxon ranksum test P-value for gene set overrepresentation: 7.16e-01 Mean rank of genes in gene set: 11508 Rank on gene expression program of genes in gene set:
T cells: Trm cytotoxic T cells (curated markers) tissue resident CD8+ cytotoxic T lymphocytes mainly localized in epithelial tissues such as gut: Wilcoxon ranksum test P-value for gene set overrepresentation: 7.28e-01 Mean rank of genes in gene set: 12055 Rank on gene expression program of genes in gene set:
Cycling cells: Cycling B cells (model markers) proliferating B lymphocytes: Wilcoxon ranksum test P-value for gene set overrepresentation: 7.37e-01 Mean rank of genes in gene set: 12170 Rank on gene expression program of genes in gene set:
HSC/MPP: Megakaryocyte-erythroid-mast cell progenitor (model markers) shared progenitors in the fetal liver which originate from common myeloid progenitors and differentiate into megakaryocytes: Wilcoxon ranksum test P-value for gene set overrepresentation: 7.44e-01 Mean rank of genes in gene set: 13318 Rank on gene expression program of genes in gene set:
DC precursor: DC precursor (curated markers) dendritic cell precursors that differentiate into dendritic cells: Wilcoxon ranksum test P-value for gene set overrepresentation: 7.55e-01 Mean rank of genes in gene set: 12385.5 Rank on gene expression program of genes in gene set:
T cells: Type 17 helper T cells (model markers) CD4+ helper T lymphocyte subpopulation which is capable of producing interleukin 17 (IL-17) and mediating protective immunity and autoimmunity: Wilcoxon ranksum test P-value for gene set overrepresentation: 7.56e-01 Mean rank of genes in gene set: 12403 Rank on gene expression program of genes in gene set:
B-cell lineage: Pre-pro-B cells (model markers) the earliest primitive B cell progenitors which express CD34 and SPINK2: Wilcoxon ranksum test P-value for gene set overrepresentation: 7.68e-01 Mean rank of genes in gene set: 13745 Rank on gene expression program of genes in gene set:
ILC: Transitional NK (model markers) immature natural killer cells which originate from natural killer cell precursors and are committed to mature natural killer cells: Wilcoxon ranksum test P-value for gene set overrepresentation: 7.70e-01 Mean rank of genes in gene set: 11507.2 Rank on gene expression program of genes in gene set:
Macrophages: Kidney-resident macrophages (curated markers) long-lived macrophages resident in the kidney under non-inflammatory conditions and maintaining homeostasis and resolving inflammation : Wilcoxon ranksum test P-value for gene set overrepresentation: 7.75e-01 Mean rank of genes in gene set: 12096.33 Rank on gene expression program of genes in gene set:
DC: DC (model markers) dendrite-shaped cells which process and present antigens to naïve T cells and induce adaptive immune responses : Wilcoxon ranksum test P-value for gene set overrepresentation: 7.80e-01 Mean rank of genes in gene set: 12706 Rank on gene expression program of genes in gene set:
ILC precursor: ILC precursor (curated markers) innate lymphoid cell precursors which give rise to innate lymphoid cells and lack the characteristics of their mature progenies: Wilcoxon ranksum test P-value for gene set overrepresentation: 7.81e-01 Mean rank of genes in gene set: 12159.67 Rank on gene expression program of genes in gene set:
ILC: CD16+ NK cells (model markers) CD16+ granular lymphocytes that play protective roles against both infectious pathogens and cancer using antibody-dependent cell-mediated cytotoxicity: Wilcoxon ranksum test P-value for gene set overrepresentation: 7.91e-01 Mean rank of genes in gene set: 11376.14 Rank on gene expression program of genes in gene set:
Monocytes: Classical monocytes (curated markers) CD14+ myeloid mononuclear recirculating leukocytes that are capable of differentiating into macrophages and myeloid lineage dendritic cells: Wilcoxon ranksum test P-value for gene set overrepresentation: 7.96e-01 Mean rank of genes in gene set: 12928 Rank on gene expression program of genes in gene set:
DC precursor: DC precursor (model markers) dendritic cell precursors that differentiate into dendritic cells: Wilcoxon ranksum test P-value for gene set overrepresentation: 7.98e-01 Mean rank of genes in gene set: 12953 Rank on gene expression program of genes in gene set:
T cells: Tem/Temra cytotoxic T cells (curated markers) terminally differentiated CD8+ cytotoxic T lymphocytes with effector memory phenotypes that re-express CD45RA : Wilcoxon ranksum test P-value for gene set overrepresentation: 8.03e-01 Mean rank of genes in gene set: 14414 Rank on gene expression program of genes in gene set:
HSC/MPP: MEMP (model markers) shared progenitors which are derived from common myeloid progenitors and will differentiate into megakaryocytes: Wilcoxon ranksum test P-value for gene set overrepresentation: 8.05e-01 Mean rank of genes in gene set: 14452 Rank on gene expression program of genes in gene set:
Mono-mac: Mono-mac (model markers) mononuclear phagocytes including monocytes and macrophages that are involved in the regulation of innate and adaptive immunity: Wilcoxon ranksum test P-value for gene set overrepresentation: 8.05e-01 Mean rank of genes in gene set: 11622.67 Rank on gene expression program of genes in gene set:
B cells: Transitional B cells (curated markers) immature B cell precursors in the bone marrow which connect Pre-B cells with mature naive B cells and are subject to the process of B cell selection: Wilcoxon ranksum test P-value for gene set overrepresentation: 8.12e-01 Mean rank of genes in gene set: 13160 Rank on gene expression program of genes in gene set:
T cells: Tem/Effector helper T cells (model markers) CD4+ helper T lymphocytes mainly localized in lymphoid and peripheral tissues and presenting an immediate: Wilcoxon ranksum test P-value for gene set overrepresentation: 8.14e-01 Mean rank of genes in gene set: 11544 Rank on gene expression program of genes in gene set:
HSC/MPP: ELP (curated markers) early lymphoid progenitors which originate from hematopoietic stem cells of the bone marrow and migrate to the thymus: Wilcoxon ranksum test P-value for gene set overrepresentation: 8.16e-01 Mean rank of genes in gene set: 12565.33 Rank on gene expression program of genes in gene set:
T cells: MAIT cells (curated markers) mucosal-associated invariant T cells which have semi-invariant T-cell receptors and are restricted by the MHC I-like molecule MR1: Wilcoxon ranksum test P-value for gene set overrepresentation: 8.22e-01 Mean rank of genes in gene set: 14816 Rank on gene expression program of genes in gene set:
B cells: Follicular B cells (model markers) resting mature B lymphocytes found in the primary and secondary lymphoid follicles and participating in T cell-dependent immune responses: Wilcoxon ranksum test P-value for gene set overrepresentation: 8.42e-01 Mean rank of genes in gene set: 12465.75 Rank on gene expression program of genes in gene set:
DC: Transitional DC (curated markers) immature dendritic cells which follow dendritic cell precursors and are committed to the mature dendritic cells: Wilcoxon ranksum test P-value for gene set overrepresentation: 8.62e-01 Mean rank of genes in gene set: 13178.67 Rank on gene expression program of genes in gene set:
T cells: Tcm/Naive helper T cells (model markers) CD4+ helper T lymphocytes mainly localized in secondary lymphoid tissues and sustaining the responses by proliferating and producing new effectors: Wilcoxon ranksum test P-value for gene set overrepresentation: 8.64e-01 Mean rank of genes in gene set: 12166.5 Rank on gene expression program of genes in gene set:
Monocytes: Non-classical monocytes (curated markers) CD16+ myeloid mononuclear recirculating leukocytes that are capable of differentiating into macrophages and myeloid lineage dendritic cells: Wilcoxon ranksum test P-value for gene set overrepresentation: 8.66e-01 Mean rank of genes in gene set: 14044 Rank on gene expression program of genes in gene set:
B-cell lineage: Large pre-B cells (model markers) proliferative B lymphocyte precursors derived from Pro-B cells and expressing membrane μ chains with surrogate light chains in their receptors: Wilcoxon ranksum test P-value for gene set overrepresentation: 8.69e-01 Mean rank of genes in gene set: 12788.25 Rank on gene expression program of genes in gene set:
B-cell lineage: Small pre-B cells (model markers) non-proliferative B lymphocyte precursors derived from Pro-B cells and expressing membrane μ chains with surrogate light chains in their receptors: Wilcoxon ranksum test P-value for gene set overrepresentation: 8.73e-01 Mean rank of genes in gene set: 14156 Rank on gene expression program of genes in gene set:
DC: DC1 (model markers) conventional type 1 dendritic cells which constitute a rare dendritic cell population with superior cross-presentation ability: Wilcoxon ranksum test P-value for gene set overrepresentation: 8.74e-01 Mean rank of genes in gene set: 14190.5 Rank on gene expression program of genes in gene set:
ILC: CD16- NK cells (model markers) CD16- granular lymphocytes that play protective roles against both infectious pathogens and cancer using antibody-dependent cell-mediated cytotoxicity: Wilcoxon ranksum test P-value for gene set overrepresentation: 8.87e-01 Mean rank of genes in gene set: 11918.89 Rank on gene expression program of genes in gene set:
Macrophages: Kupffer cells (curated markers) resident macrophages in liver under non-inflammatory conditions which line the hepatic sinusoids and are involved in erythrocyte clearance: Wilcoxon ranksum test P-value for gene set overrepresentation: 8.92e-01 Mean rank of genes in gene set: 14540.5 Rank on gene expression program of genes in gene set:
T cells: Trm cytotoxic T cells (model markers) tissue resident CD8+ cytotoxic T lymphocytes mainly localized in epithelial tissues such as gut: Wilcoxon ranksum test P-value for gene set overrepresentation: 9.11e-01 Mean rank of genes in gene set: 14013 Rank on gene expression program of genes in gene set:
Macrophages: Macrophages (curated markers) specialised mononuclear phagocytic cells which recognise: Wilcoxon ranksum test P-value for gene set overrepresentation: 9.14e-01 Mean rank of genes in gene set: 14062 Rank on gene expression program of genes in gene set:
Monocytes: Classical monocytes (model markers) CD14+ myeloid mononuclear recirculating leukocytes that are capable of differentiating into macrophages and myeloid lineage dendritic cells: Wilcoxon ranksum test P-value for gene set overrepresentation: 9.15e-01 Mean rank of genes in gene set: 13493.5 Rank on gene expression program of genes in gene set:
Epithelial cells: Epithelial cells (curated markers) highly specialised cells which are located in the outer layer of stroma and form the cellular components of the epithelium: Wilcoxon ranksum test P-value for gene set overrepresentation: 9.16e-01 Mean rank of genes in gene set: 14107.67 Rank on gene expression program of genes in gene set:
Erythrocytes: Erythrocytes (model markers) biconcave enucleated red blood cells filled with hemoglobin to transport oxygen and carbon dioxide between the lungs and tissues: Wilcoxon ranksum test P-value for gene set overrepresentation: 9.18e-01 Mean rank of genes in gene set: 15162.5 Rank on gene expression program of genes in gene set:
Endothelial cells: Endothelial cells (curated markers) single-layered lining cells that constitute the interior vasculature: Wilcoxon ranksum test P-value for gene set overrepresentation: 9.19e-01 Mean rank of genes in gene set: 14178 Rank on gene expression program of genes in gene set:
ETP: ETP (curated markers) early thymic progenitors migrated to the thymus before turning into double-negative thymocytes or other cells: Wilcoxon ranksum test P-value for gene set overrepresentation: 9.20e-01 Mean rank of genes in gene set: 14183.67 Rank on gene expression program of genes in gene set:
Early MK: Early MK (curated markers) early megakaryocytes which are committed to megakaryocyte lineage cells: Wilcoxon ranksum test P-value for gene set overrepresentation: 9.21e-01 Mean rank of genes in gene set: 14213.67 Rank on gene expression program of genes in gene set:
ILC: NK cells (model markers) granular lymphocytes that play protective roles against both infectious pathogens and cancer using antibody-dependent cell-mediated cytotoxicity: Wilcoxon ranksum test P-value for gene set overrepresentation: 9.26e-01 Mean rank of genes in gene set: 12519.62 Rank on gene expression program of genes in gene set:
Macrophages: Hofbauer cells (curated markers) primitive placental resident macrophages with granules and vacuoles found in placenta particularly during early pregnancy: Wilcoxon ranksum test P-value for gene set overrepresentation: 9.30e-01 Mean rank of genes in gene set: 14429.33 Rank on gene expression program of genes in gene set:
B cells: Naive B cells (model markers) mature B lymphocytes which express cell-surface IgM and IgD and have not been exposed to/activated by antigens: Wilcoxon ranksum test P-value for gene set overrepresentation: 9.31e-01 Mean rank of genes in gene set: 13797.75 Rank on gene expression program of genes in gene set:
Macrophages: Kupffer cells (model markers) resident macrophages in liver under non-inflammatory conditions which line the hepatic sinusoids and are involved in erythrocyte clearance: Wilcoxon ranksum test P-value for gene set overrepresentation: 9.33e-01 Mean rank of genes in gene set: 13074.17 Rank on gene expression program of genes in gene set:
B-cell lineage: Small pre-B cells (curated markers) non-proliferative B lymphocyte precursors derived from Pro-B cells and expressing membrane μ chains with surrogate light chains in their receptors: Wilcoxon ranksum test P-value for gene set overrepresentation: 9.38e-01 Mean rank of genes in gene set: 18239 Rank on gene expression program of genes in gene set:
Monocyte precursor: Monocyte precursor (curated markers) monocyte precursors that are committed to the monocytes: Wilcoxon ranksum test P-value for gene set overrepresentation: 9.42e-01 Mean rank of genes in gene set: 15876 Rank on gene expression program of genes in gene set:
T cells: NKT cells (model markers) distinct T lymphocyte subpopulation that expresses both alpha/beta T-cell receptors and surface receptors of natural killer cells: Wilcoxon ranksum test P-value for gene set overrepresentation: 9.47e-01 Mean rank of genes in gene set: 14164.25 Rank on gene expression program of genes in gene set:
HSC/MPP: HSC/MPP (curated markers) hematopoietic stem cells and multipotent progenitor cells with the potential of differentiating into different blood cells: Wilcoxon ranksum test P-value for gene set overrepresentation: 9.48e-01 Mean rank of genes in gene set: 14912.33 Rank on gene expression program of genes in gene set:
Cycling cells: Cycling DCs (curated markers) proliferating dendritic cells: Wilcoxon ranksum test P-value for gene set overrepresentation: 9.57e-01 Mean rank of genes in gene set: 15210 Rank on gene expression program of genes in gene set:
Mono-mac: Mono-mac (curated markers) mononuclear phagocytes including monocytes and macrophages that are involved in the regulation of innate and adaptive immunity: Wilcoxon ranksum test P-value for gene set overrepresentation: 9.62e-01 Mean rank of genes in gene set: 15389.33 Rank on gene expression program of genes in gene set:
Megakaryocytes/platelets: Megakaryocytes/platelets (curated markers) large multinucleated cells with numerous azurophilic granules and with mature blood platelets released from the cytoplasm: Wilcoxon ranksum test P-value for gene set overrepresentation: 9.63e-01 Mean rank of genes in gene set: 15406 Rank on gene expression program of genes in gene set:
Myelocytes: Myelocytes (model markers) early granulocyte precursors that are derive from promyelocytes and later mature into metamyelocytes: Wilcoxon ranksum test P-value for gene set overrepresentation: 9.64e-01 Mean rank of genes in gene set: 13447.14 Rank on gene expression program of genes in gene set:
T cells: T(agonist) (model markers) unconventional T cell subpopulation in the thymus which expresses MIR155HG and shares some signatures with differentiating regulatory T cells: Wilcoxon ranksum test P-value for gene set overrepresentation: 9.67e-01 Mean rank of genes in gene set: 13529 Rank on gene expression program of genes in gene set:
T cells: Tem/Trm cytotoxic T cells (model markers) CD8+ cytotoxic T lymphocytes mainly localized in lymphoid and peripheral tissues and presenting an immediate: Wilcoxon ranksum test P-value for gene set overrepresentation: 9.70e-01 Mean rank of genes in gene set: 14918 Rank on gene expression program of genes in gene set:
B cells: B cells (model markers) B lymphocytes with diverse cell surface immunoglobulin receptors recognising specific antigenic epitopes and mediating humoral immunity: Wilcoxon ranksum test P-value for gene set overrepresentation: 9.70e-01 Mean rank of genes in gene set: 14928.5 Rank on gene expression program of genes in gene set:
Cycling cells: Cycling monocytes (curated markers) proliferating monocytes: Wilcoxon ranksum test P-value for gene set overrepresentation: 9.71e-01 Mean rank of genes in gene set: 15780 Rank on gene expression program of genes in gene set:
Cycling cells: Cycling B cells (curated markers) proliferating B lymphocytes: Wilcoxon ranksum test P-value for gene set overrepresentation: 9.75e-01 Mean rank of genes in gene set: 17414 Rank on gene expression program of genes in gene set:
Cycling cells: Cycling gamma-delta T cells (curated markers) proliferating gamma-delta (γδ) T lymphocytes: Wilcoxon ranksum test P-value for gene set overrepresentation: 9.75e-01 Mean rank of genes in gene set: 17414 Rank on gene expression program of genes in gene set:
Cycling cells: Cycling NK cells (curated markers) proliferating natural killer cells: Wilcoxon ranksum test P-value for gene set overrepresentation: 9.75e-01 Mean rank of genes in gene set: 17414 Rank on gene expression program of genes in gene set:
Cycling cells: Cycling T cells (curated markers) proliferating T lymphocytes: Wilcoxon ranksum test P-value for gene set overrepresentation: 9.75e-01 Mean rank of genes in gene set: 17414 Rank on gene expression program of genes in gene set:
T cells: CD8a/b(entry) (model markers) T lymphocytes with CD8 alpha/beta heterodimers in the late double-positive (entry) stage during T cell development: Wilcoxon ranksum test P-value for gene set overrepresentation: 9.76e-01 Mean rank of genes in gene set: 13577.75 Rank on gene expression program of genes in gene set:
Monocytes: Monocytes (model markers) myeloid mononuclear recirculating leukocytes that are capable of differentiating into macrophages and myeloid lineage dendritic cells: Wilcoxon ranksum test P-value for gene set overrepresentation: 9.77e-01 Mean rank of genes in gene set: 15248.5 Rank on gene expression program of genes in gene set:
B-cell lineage: Large pre-B cells (curated markers) proliferative B lymphocyte precursors derived from Pro-B cells and expressing membrane μ chains with surrogate light chains in their receptors: Wilcoxon ranksum test P-value for gene set overrepresentation: 9.79e-01 Mean rank of genes in gene set: 17719 Rank on gene expression program of genes in gene set:
T cells: Tcm/Naive cytotoxic T cells (model markers) CD8+ cytotoxic T lymphocytes mainly localized in secondary lymphoid tissues and sustaining the responses by proliferating and producing new effectors: Wilcoxon ranksum test P-value for gene set overrepresentation: 9.83e-01 Mean rank of genes in gene set: 18041.5 Rank on gene expression program of genes in gene set:
Macrophages: Macrophages (model markers) specialised mononuclear phagocytic cells which recognise: Wilcoxon ranksum test P-value for gene set overrepresentation: 9.85e-01 Mean rank of genes in gene set: 14244.57 Rank on gene expression program of genes in gene set:
Epithelial cells: Epithelial cells (model markers) highly specialised cells which are located in the outer layer of stroma and form the cellular components of the epithelium: Wilcoxon ranksum test P-value for gene set overrepresentation: 9.89e-01 Mean rank of genes in gene set: 13716.8 Rank on gene expression program of genes in gene set:
T cells: Follicular helper T cells (model markers) specialised CD4+ T cell subpopulation found in the periphery within B cell follicles and stimulating the cognate follicular B cells for class-switching: Wilcoxon ranksum test P-value for gene set overrepresentation: 9.91e-01 Mean rank of genes in gene set: 16252.25 Rank on gene expression program of genes in gene set:
B cells: Memory B cells (model markers) long-lived mature B lymphocytes which are formed within germinal centers following primary infection and selected for higher-affinity immunoglobulin: Wilcoxon ranksum test P-value for gene set overrepresentation: 9.95e-01 Mean rank of genes in gene set: 16046 Rank on gene expression program of genes in gene set:
T cells: Type 1 helper T cells (model markers) CD4+ helper T lymphocyte subpopulation which is capable of producing interferon-gamma and modulating cell-mediated immune responses: Wilcoxon ranksum test P-value for gene set overrepresentation: 9.98e-01 Mean rank of genes in gene set: 17618.25 Rank on gene expression program of genes in gene set:
Fibroblasts: Fibroblasts (curated markers) the most common cells of connective tissues which synthesize the extracellular matrix and collagen to maintain tissue homeostasis: Wilcoxon ranksum test P-value for gene set overrepresentation: 9.98e-01 Mean rank of genes in gene set: 19038.33 Rank on gene expression program of genes in gene set:
Fibroblasts: Fibroblasts (model markers) the most common cells of connective tissues which synthesize the extracellular matrix and collagen to maintain tissue homeostasis: Wilcoxon ranksum test P-value for gene set overrepresentation: 1.00e+00 Mean rank of genes in gene set: 16524 Rank on gene expression program of genes in gene set:
B cells: Naive B cells (curated markers) mature B lymphocytes which express cell-surface IgM and IgD and have not been exposed to/activated by antigens: ILC: Transitional NK (curated markers) immature natural killer cells which originate from natural killer cell precursors and are committed to mature natural killer cells: T cells: gamma-delta T cells (curated markers) unconventional T lymphocyte subpopulation expressing a gamma-delta T cell receptor complex on the surface to recognise antigens: T cells: Tem/Trm cytotoxic T cells (curated markers) CD8+ cytotoxic T lymphocytes mainly localized in lymphoid and peripheral tissues and presenting an immediate: Cycling cells: Cycling monocytes (model markers) proliferating monocytes: Erythroid: Late erythroid (model markers) late erythroid cells following early and middle erythroid cells: Erythroid: Mid erythroid (model markers) middle erythroid cells in fetal liver: Granulocytes: Neutrophils (model markers) the most abundant type of granulocytes that contains distinctive cytoplasmic granules and forms an essential part of the innate immune system: ILC: ILC3 (model markers) innate lymphoid cell subpopulation III that is required for host defense against specific extracellular bacteria and fungi: Macrophages: Kidney-resident macrophages (model markers) long-lived macrophages resident in the kidney under non-inflammatory conditions and maintaining homeostasis and resolving inflammation : MNP: MNP (model markers) mononuclear phagocytes including dendritic cells: