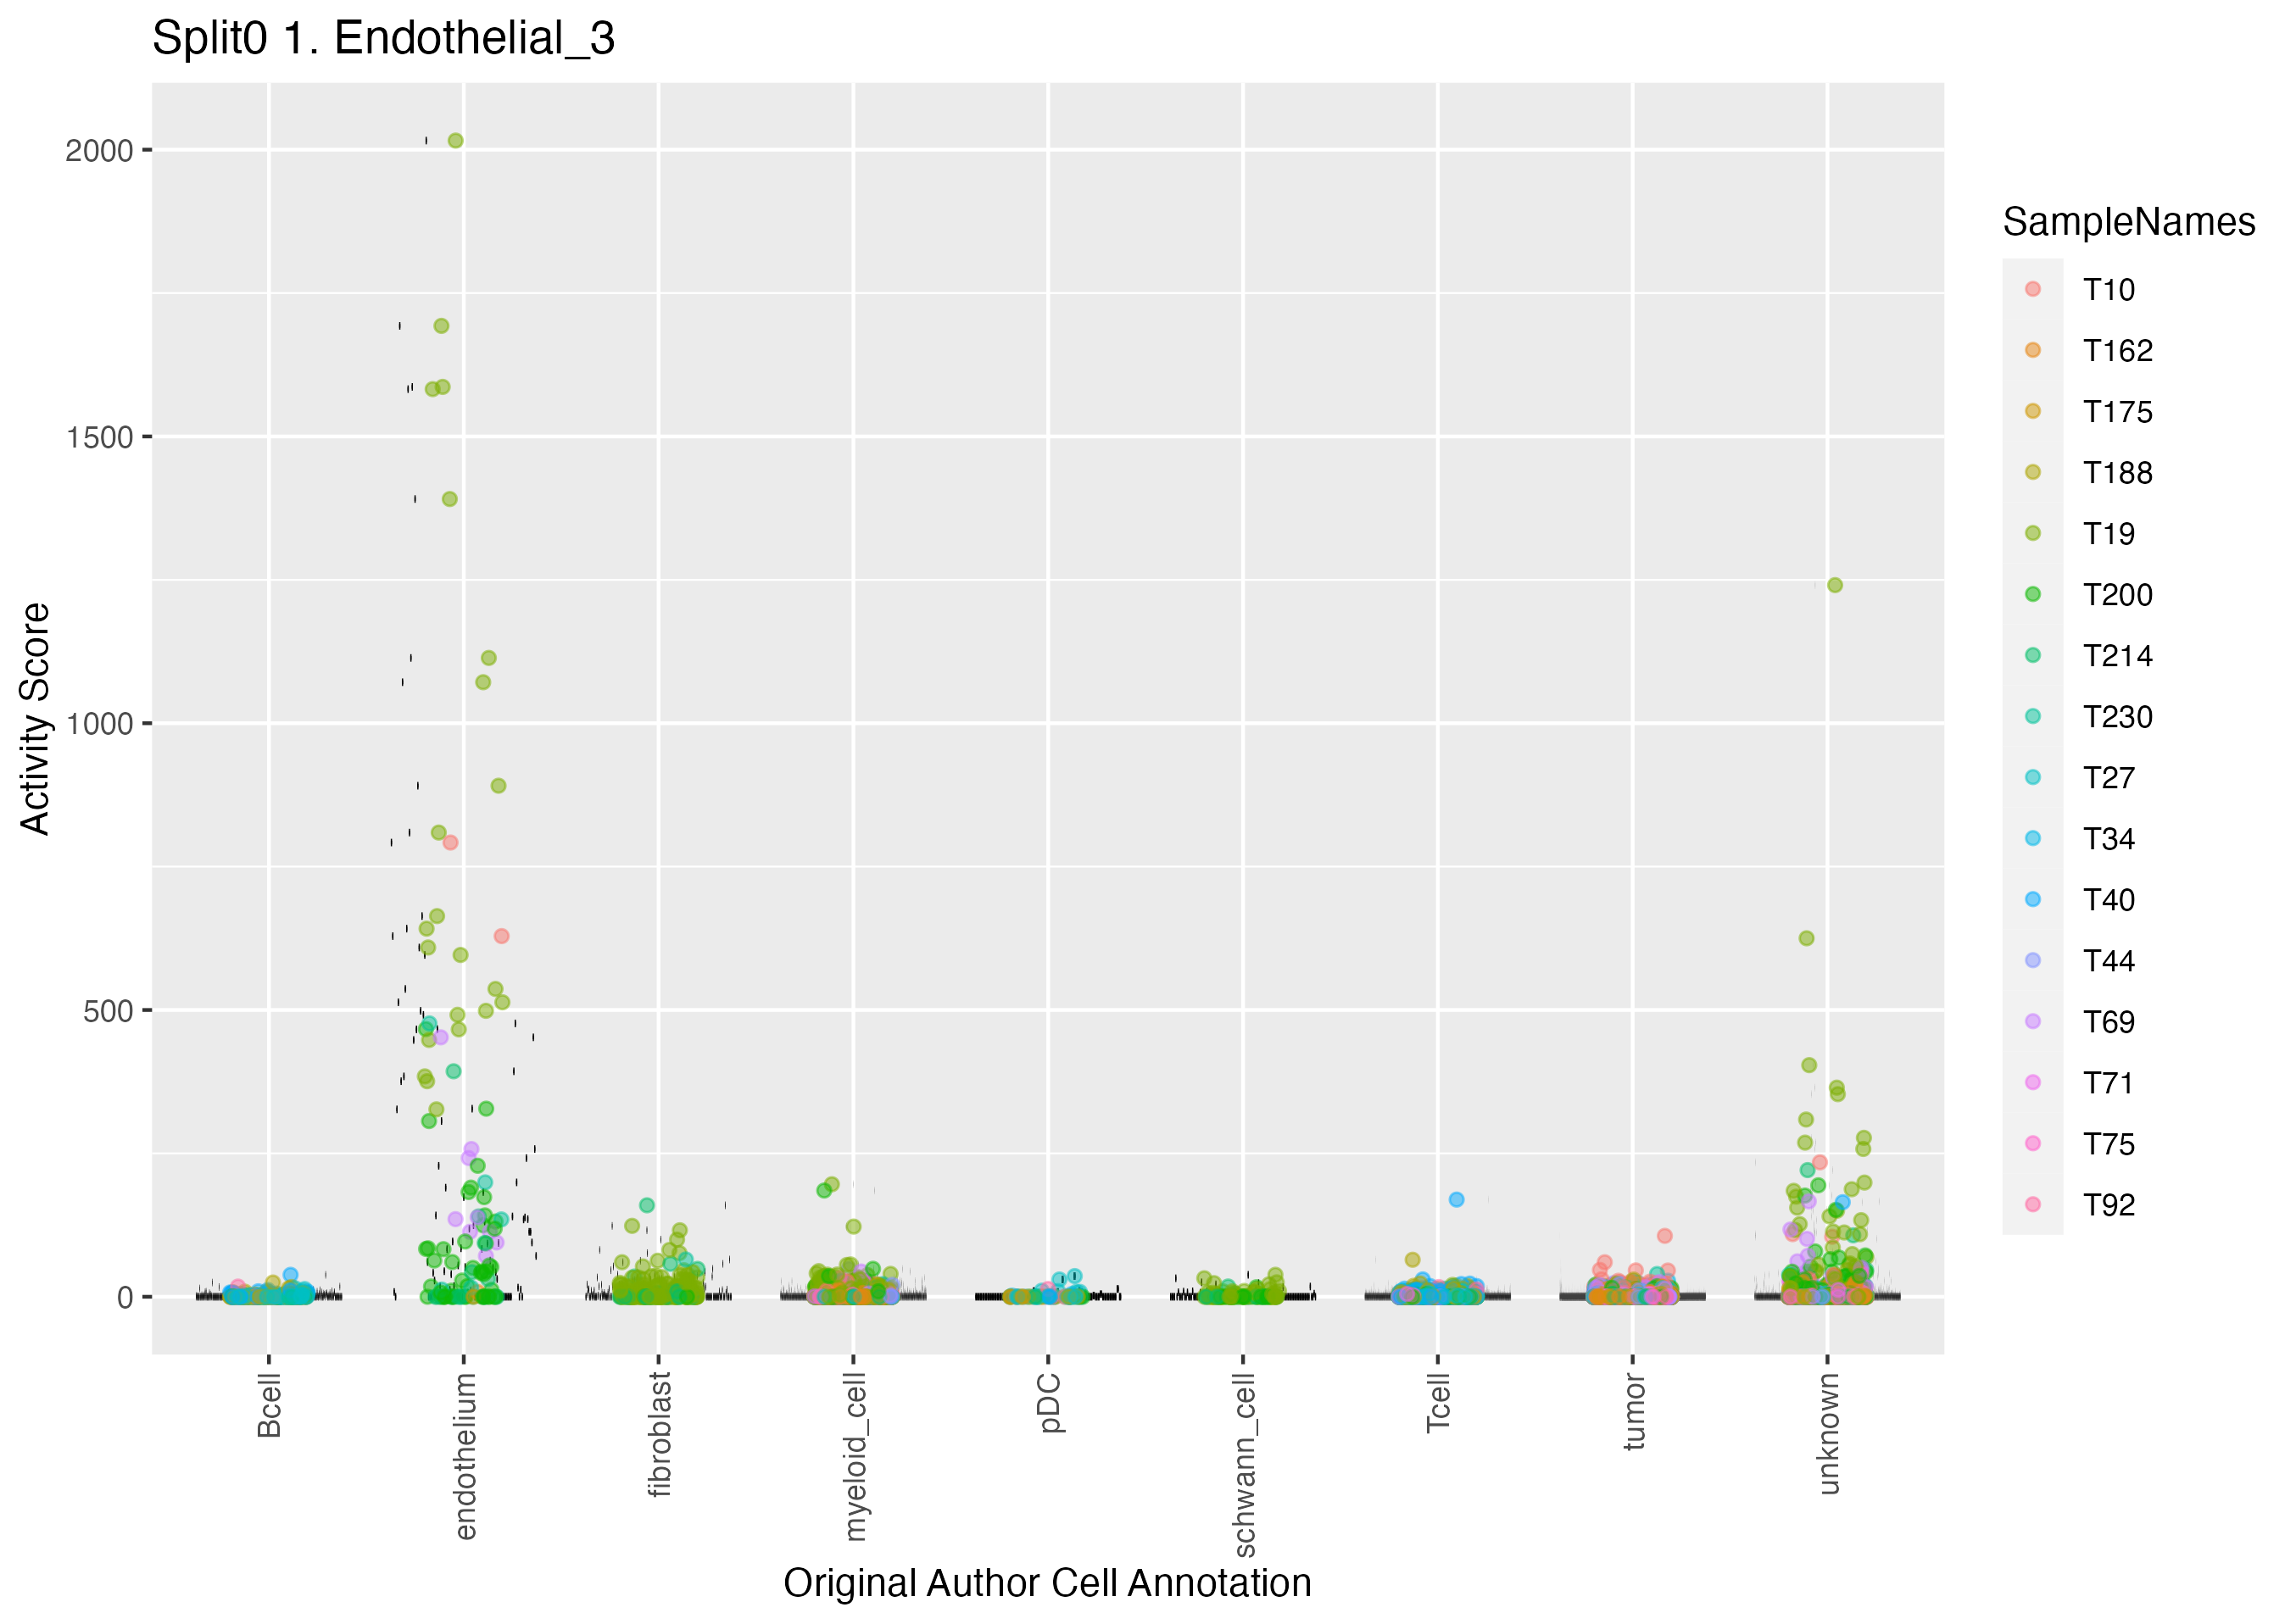
Program: 1. Endothelial.
Submit a comment on this gene expression program’s interpretation: CLICK
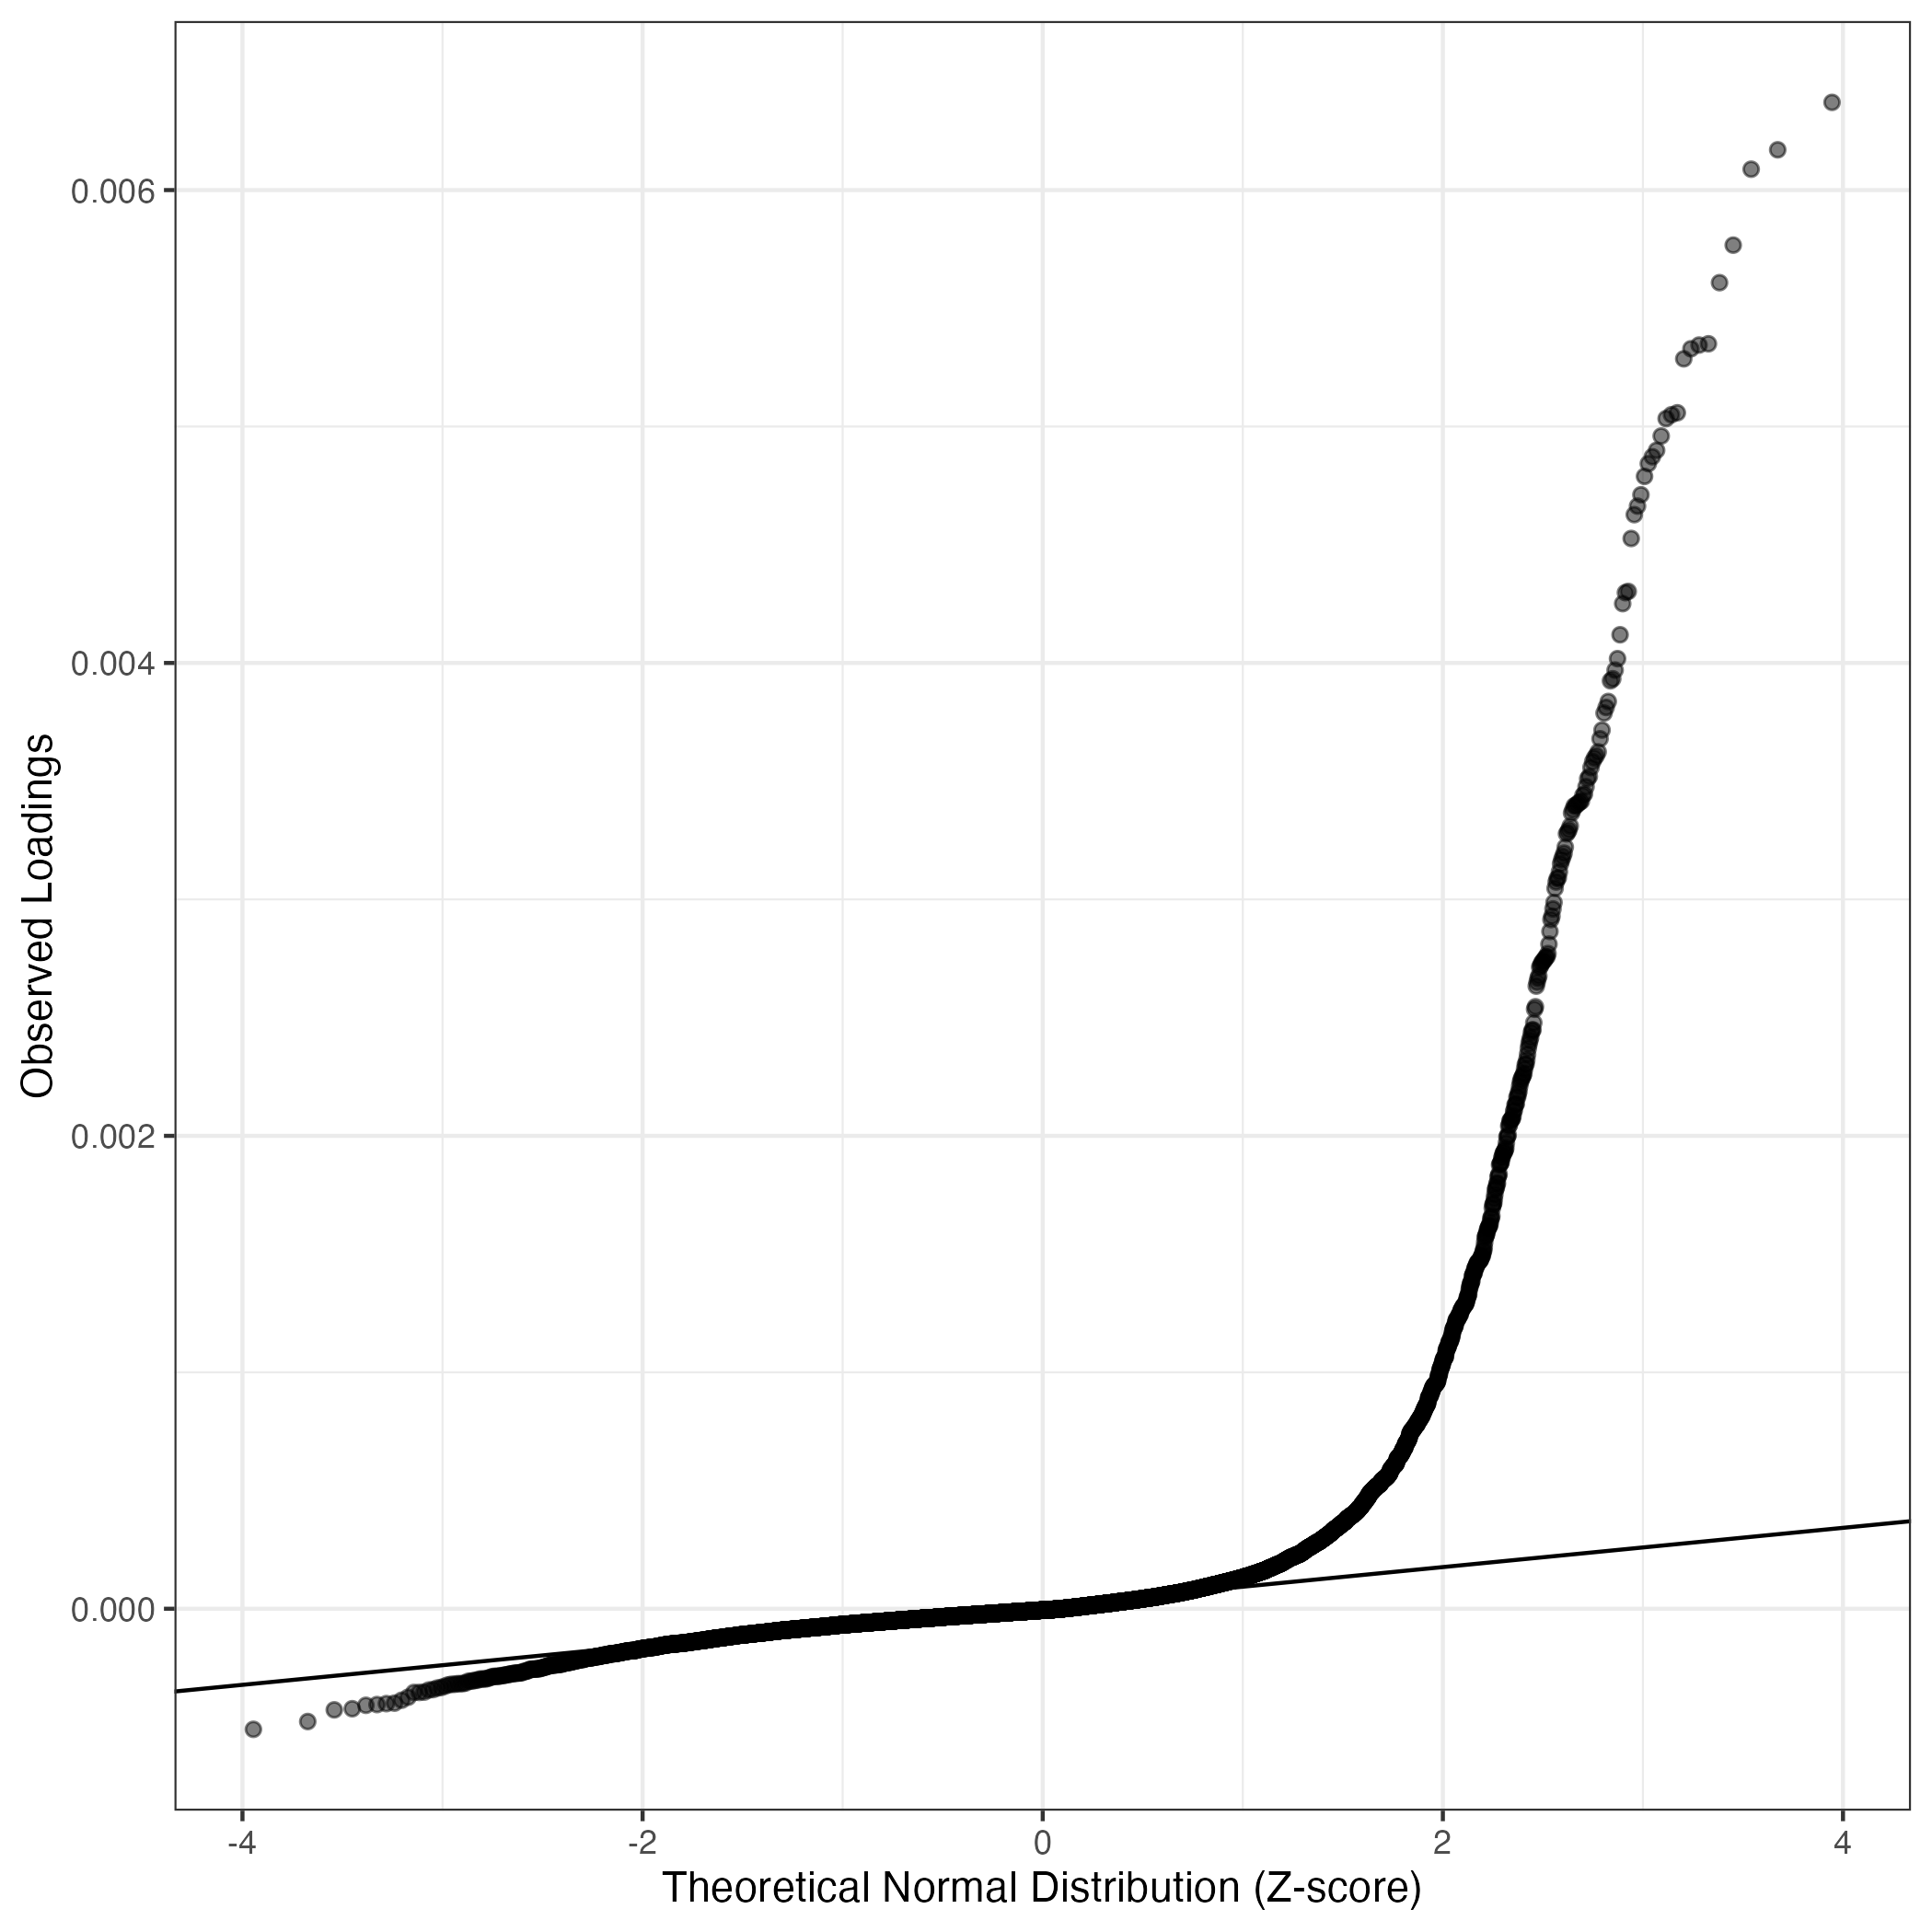
QQ-plot of gene loadings, averaged over both independent splits of the data
This plot highlights the relative contribution of each gene to the GEP
Top genes driving this program.
Note: Decartes website is buggy, try refreshing. Also, Decartes fetal adrenal data have been collected at specific time points (89-122 days), all possible cell types of interest may not be represented, do not overinterpret.
The Mean Count column shows the mean read count in cells scoring highly (H > 50) on this gene expression program.
| Gene | Loading | Gene.Name | GTEx | DepMap | Descartes | Mean.Counts | Mean.Tpm | |
|---|---|---|---|---|---|---|---|---|
| 1 | AQP1 | 0.0063710 | aquaporin 1 (Colton blood group) | GTEx | DepMap | Descartes | 4.06 | 268.49 |
| 2 | EMCN | 0.0061704 | endomucin | GTEx | DepMap | Descartes | 1.84 | 103.25 |
| 3 | INHBB | 0.0060883 | inhibin subunit beta B | GTEx | DepMap | Descartes | 0.71 | 45.75 |
| 4 | ESAM | 0.0057671 | endothelial cell adhesion molecule | GTEx | DepMap | Descartes | 2.95 | 265.73 |
| 5 | PLVAP | 0.0056084 | plasmalemma vesicle associated protein | GTEx | DepMap | Descartes | 8.02 | 662.01 |
| 6 | CLEC14A | 0.0053500 | C-type lectin domain containing 14A | GTEx | DepMap | Descartes | 3.20 | 326.98 |
| 7 | CDH5 | 0.0053446 | cadherin 5 | GTEx | DepMap | Descartes | 2.27 | 107.02 |
| 8 | HSPG2 | 0.0053289 | heparan sulfate proteoglycan 2 | GTEx | DepMap | Descartes | 7.60 | 100.02 |
| 9 | FAM167B | 0.0052863 | family with sequence similarity 167 member B | GTEx | DepMap | Descartes | 3.07 | 728.95 |
| 10 | BCAM | 0.0050582 | basal cell adhesion molecule (Lutheran blood group) | GTEx | DepMap | Descartes | 2.24 | 132.00 |
| 11 | DLL4 | 0.0050499 | delta like canonical Notch ligand 4 | GTEx | DepMap | Descartes | 0.83 | 39.52 |
| 12 | KDR | 0.0050336 | kinase insert domain receptor | GTEx | DepMap | Descartes | 2.01 | 63.87 |
| 13 | FLT1 | 0.0049599 | fms related receptor tyrosine kinase 1 | GTEx | DepMap | Descartes | 2.91 | 74.63 |
| 14 | MMRN2 | 0.0048994 | multimerin 2 | GTEx | DepMap | Descartes | 1.27 | 60.96 |
| 15 | EGFL7 | 0.0048722 | EGF like domain multiple 7 | GTEx | DepMap | Descartes | 6.10 | 606.76 |
| 16 | CD34 | 0.0048429 | CD34 molecule | GTEx | DepMap | Descartes | 3.22 | 79.45 |
| 17 | ENG | 0.0047893 | endoglin | GTEx | DepMap | Descartes | 6.87 | 458.40 |
| 18 | GJA1 | 0.0047114 | gap junction protein alpha 1 | GTEx | DepMap | Descartes | 1.73 | 95.14 |
| 19 | A2M | 0.0046635 | alpha-2-macroglobulin | GTEx | DepMap | Descartes | 10.26 | 448.67 |
| 20 | CLDN5 | 0.0046273 | claudin 5 | GTEx | DepMap | Descartes | 5.81 | 473.58 |
| 21 | VWF | 0.0045265 | von Willebrand factor | GTEx | DepMap | Descartes | 8.28 | 195.57 |
| 22 | TM4SF1 | 0.0043025 | transmembrane 4 L six family member 1 | GTEx | DepMap | Descartes | 4.83 | 374.45 |
| 23 | NOSTRIN | 0.0042974 | nitric oxide synthase trafficking | GTEx | DepMap | Descartes | 0.96 | 96.87 |
| 24 | STC1 | 0.0042510 | stanniocalcin 1 | GTEx | DepMap | Descartes | 1.24 | 55.89 |
| 25 | ROBO4 | 0.0041193 | roundabout guidance receptor 4 | GTEx | DepMap | Descartes | 1.42 | 69.04 |
| 26 | SPRY1 | 0.0040182 | sprouty RTK signaling antagonist 1 | GTEx | DepMap | Descartes | 4.08 | 346.34 |
| 27 | PALMD | 0.0039698 | palmdelphin | GTEx | DepMap | Descartes | 1.06 | 46.59 |
| 28 | SPARCL1 | 0.0039332 | SPARC like 1 | GTEx | DepMap | Descartes | 10.67 | 834.11 |
| 29 | CYYR1 | 0.0039245 | cysteine and tyrosine rich 1 | GTEx | DepMap | Descartes | 1.29 | 81.88 |
| 30 | ABCG2 | 0.0038371 | ATP binding cassette subfamily G member 2 (Junior blood group) | GTEx | DepMap | Descartes | 0.39 | 18.51 |
| 31 | HTRA1 | 0.0038119 | HtrA serine peptidase 1 | GTEx | DepMap | Descartes | 3.36 | 282.83 |
| 32 | COL15A1 | 0.0037882 | collagen type XV alpha 1 chain | GTEx | DepMap | Descartes | 3.74 | 126.71 |
| 33 | PODXL | 0.0037162 | podocalyxin like | GTEx | DepMap | Descartes | 2.71 | 82.46 |
| 34 | SLC9A3R2 | 0.0036795 | SLC9A3 regulator 2 | GTEx | DepMap | Descartes | 4.75 | 442.99 |
| 35 | FAM107A | 0.0036241 | family with sequence similarity 107 member A | GTEx | DepMap | Descartes | 0.23 | 12.81 |
| 36 | MECOM | 0.0036083 | MDS1 and EVI1 complex locus | GTEx | DepMap | Descartes | 0.63 | 22.26 |
| 37 | GPR4 | 0.0035979 | G protein-coupled receptor 4 | GTEx | DepMap | Descartes | 0.60 | 36.20 |
| 38 | CALCRL | 0.0035825 | calcitonin receptor like receptor | GTEx | DepMap | Descartes | 1.59 | 60.20 |
| 39 | INSR | 0.0035578 | insulin receptor | GTEx | DepMap | Descartes | 4.33 | 85.30 |
| 40 | ACKR3 | 0.0035200 | atypical chemokine receptor 3 | GTEx | DepMap | Descartes | 0.74 | NA |
| 41 | RBP7 | 0.0035102 | retinol binding protein 7 | GTEx | DepMap | Descartes | 1.98 | 437.84 |
| 42 | SPARC | 0.0034766 | secreted protein acidic and cysteine rich | GTEx | DepMap | Descartes | 27.05 | 1402.52 |
| 43 | NR5A2 | 0.0034462 | nuclear receptor subfamily 5 group A member 2 | GTEx | DepMap | Descartes | 0.14 | 4.97 |
| 44 | TIE1 | 0.0034401 | tyrosine kinase with immunoglobulin like and EGF like domains 1 | GTEx | DepMap | Descartes | 1.04 | 57.16 |
| 45 | PREX2 | 0.0034156 | phosphatidylinositol-3,4,5-trisphosphate dependent Rac exchange factor 2 | GTEx | DepMap | Descartes | 0.60 | 12.20 |
| 46 | PCDH12 | 0.0034119 | protocadherin 12 | GTEx | DepMap | Descartes | 1.03 | 29.95 |
| 47 | ERG | 0.0034080 | ETS transcription factor ERG | GTEx | DepMap | Descartes | 0.67 | NA |
| 48 | IGFBP3 | 0.0034010 | insulin like growth factor binding protein 3 | GTEx | DepMap | Descartes | 4.22 | 311.68 |
| 49 | ESM1 | 0.0033963 | endothelial cell specific molecule 1 | GTEx | DepMap | Descartes | 2.05 | 177.79 |
| 50 | PTPRB | 0.0033957 | protein tyrosine phosphatase receptor type B | GTEx | DepMap | Descartes | 1.14 | 17.94 |
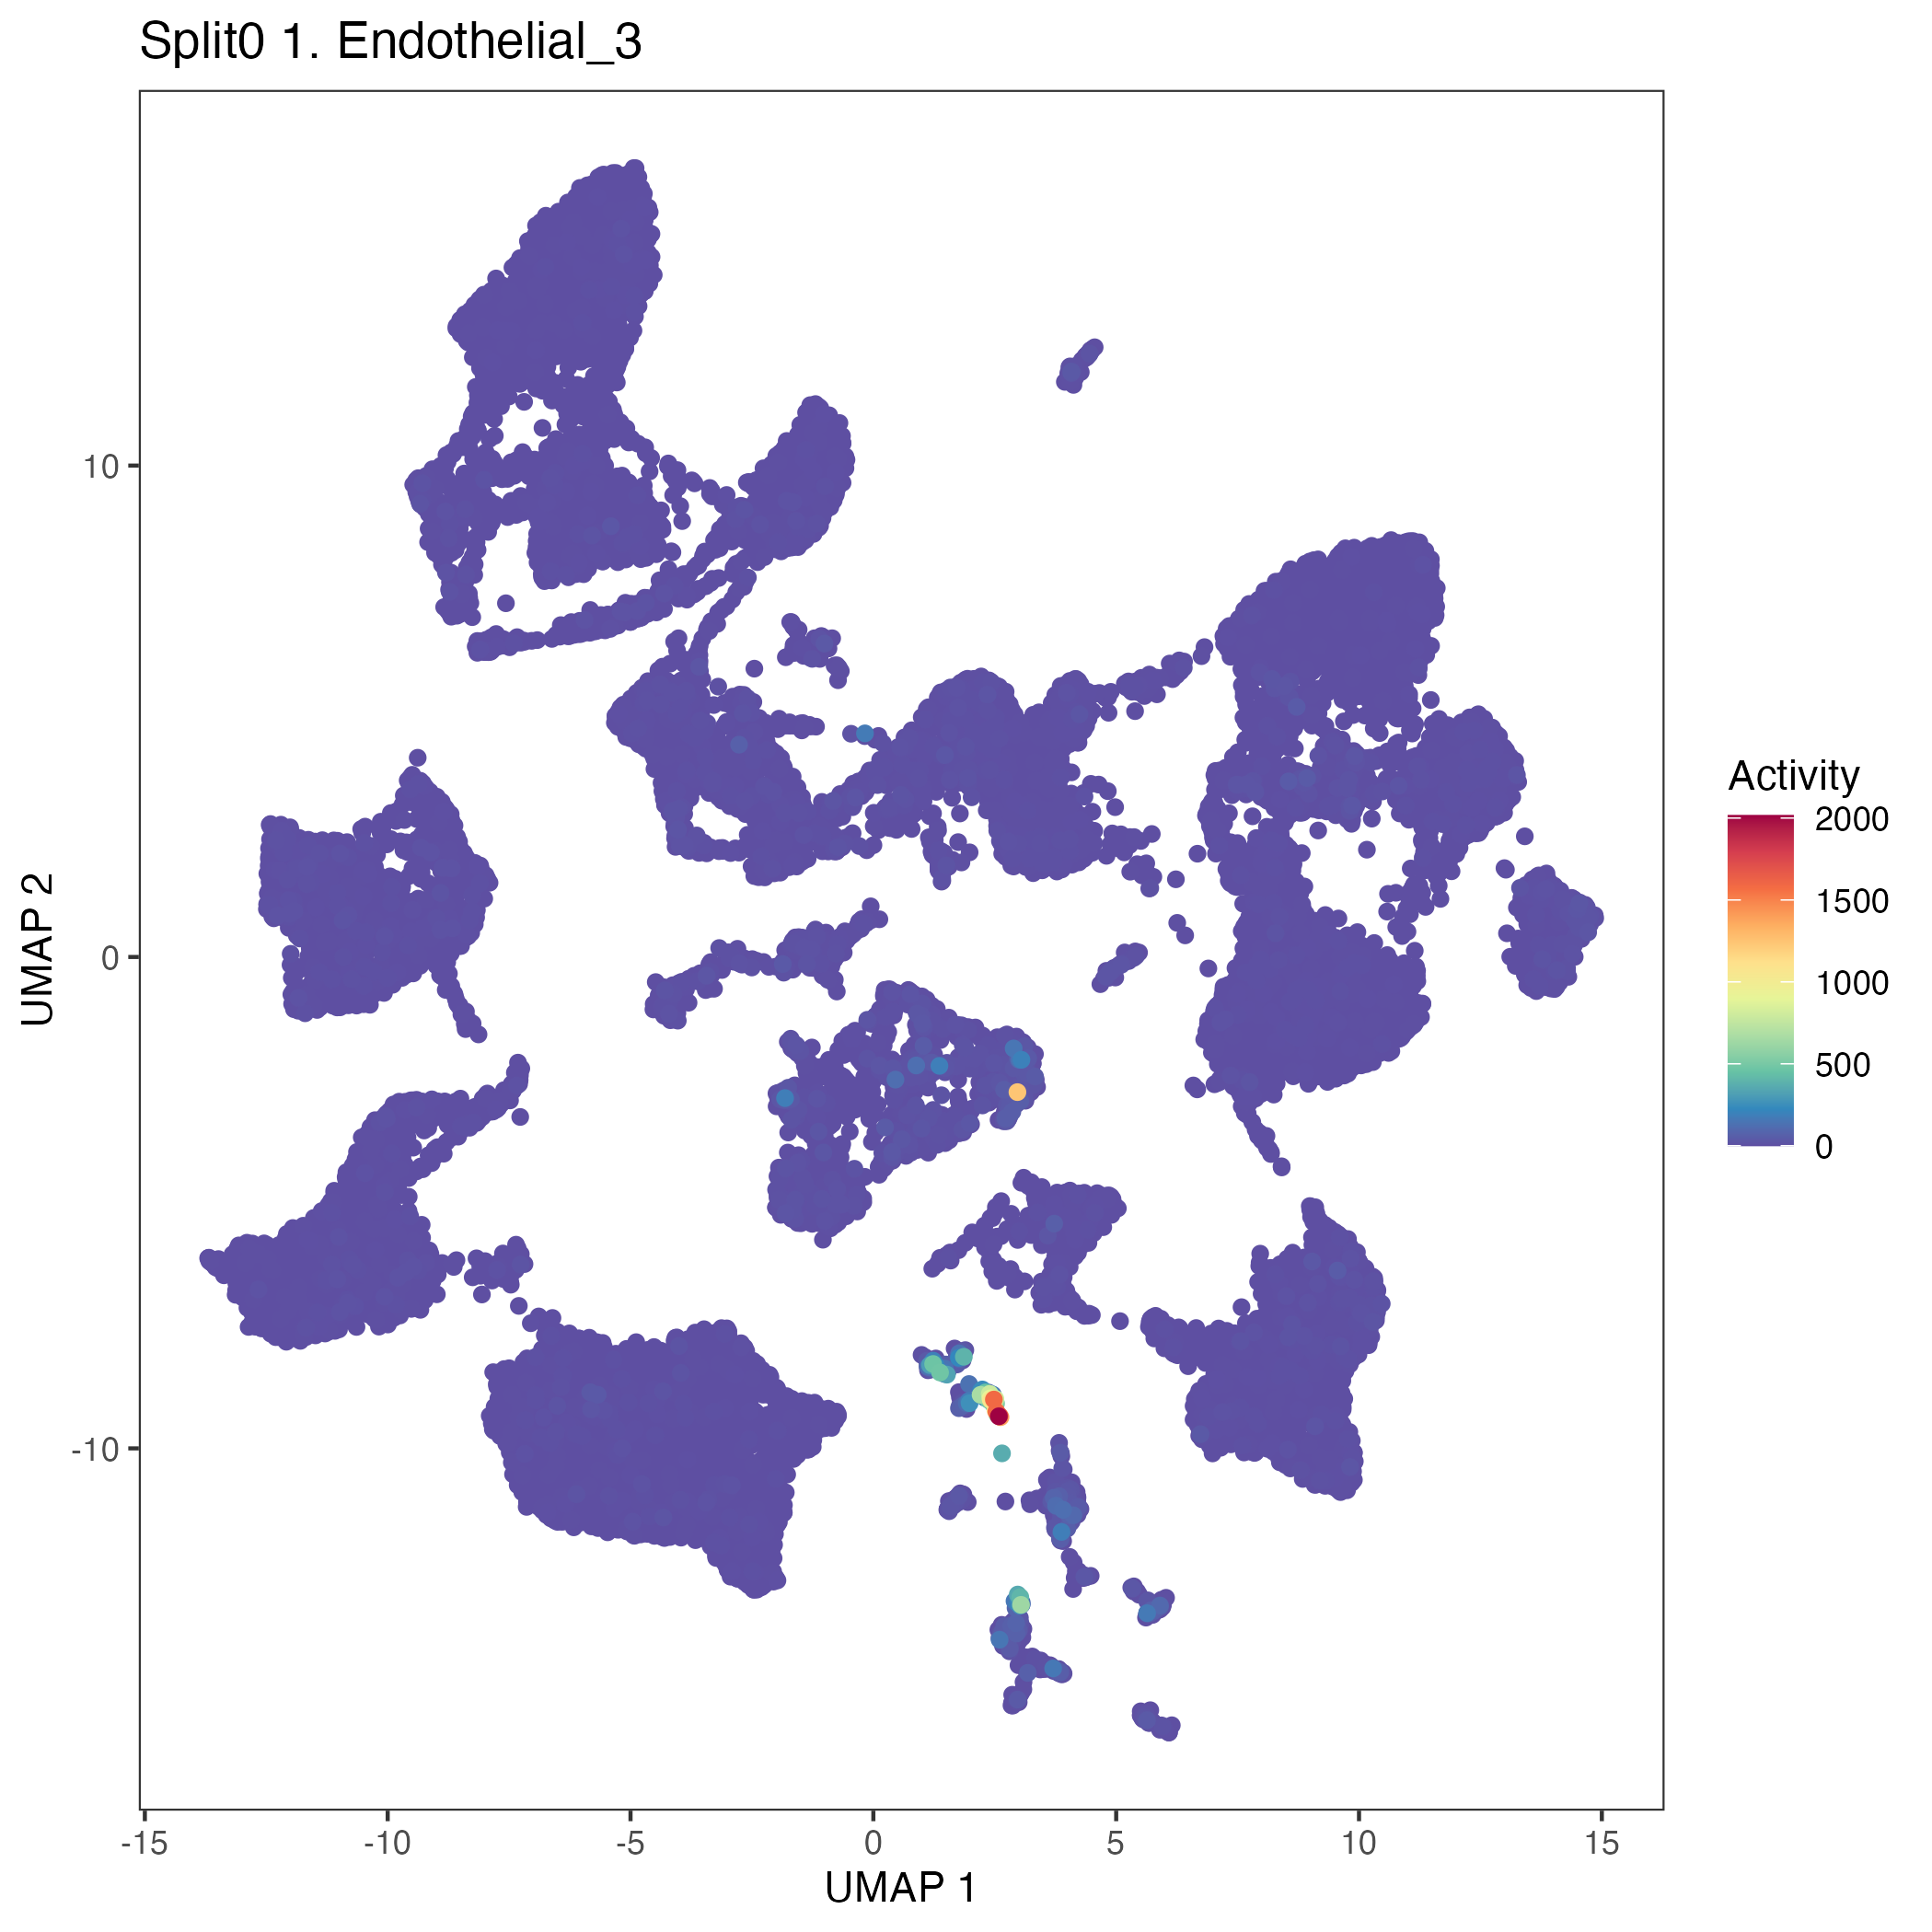
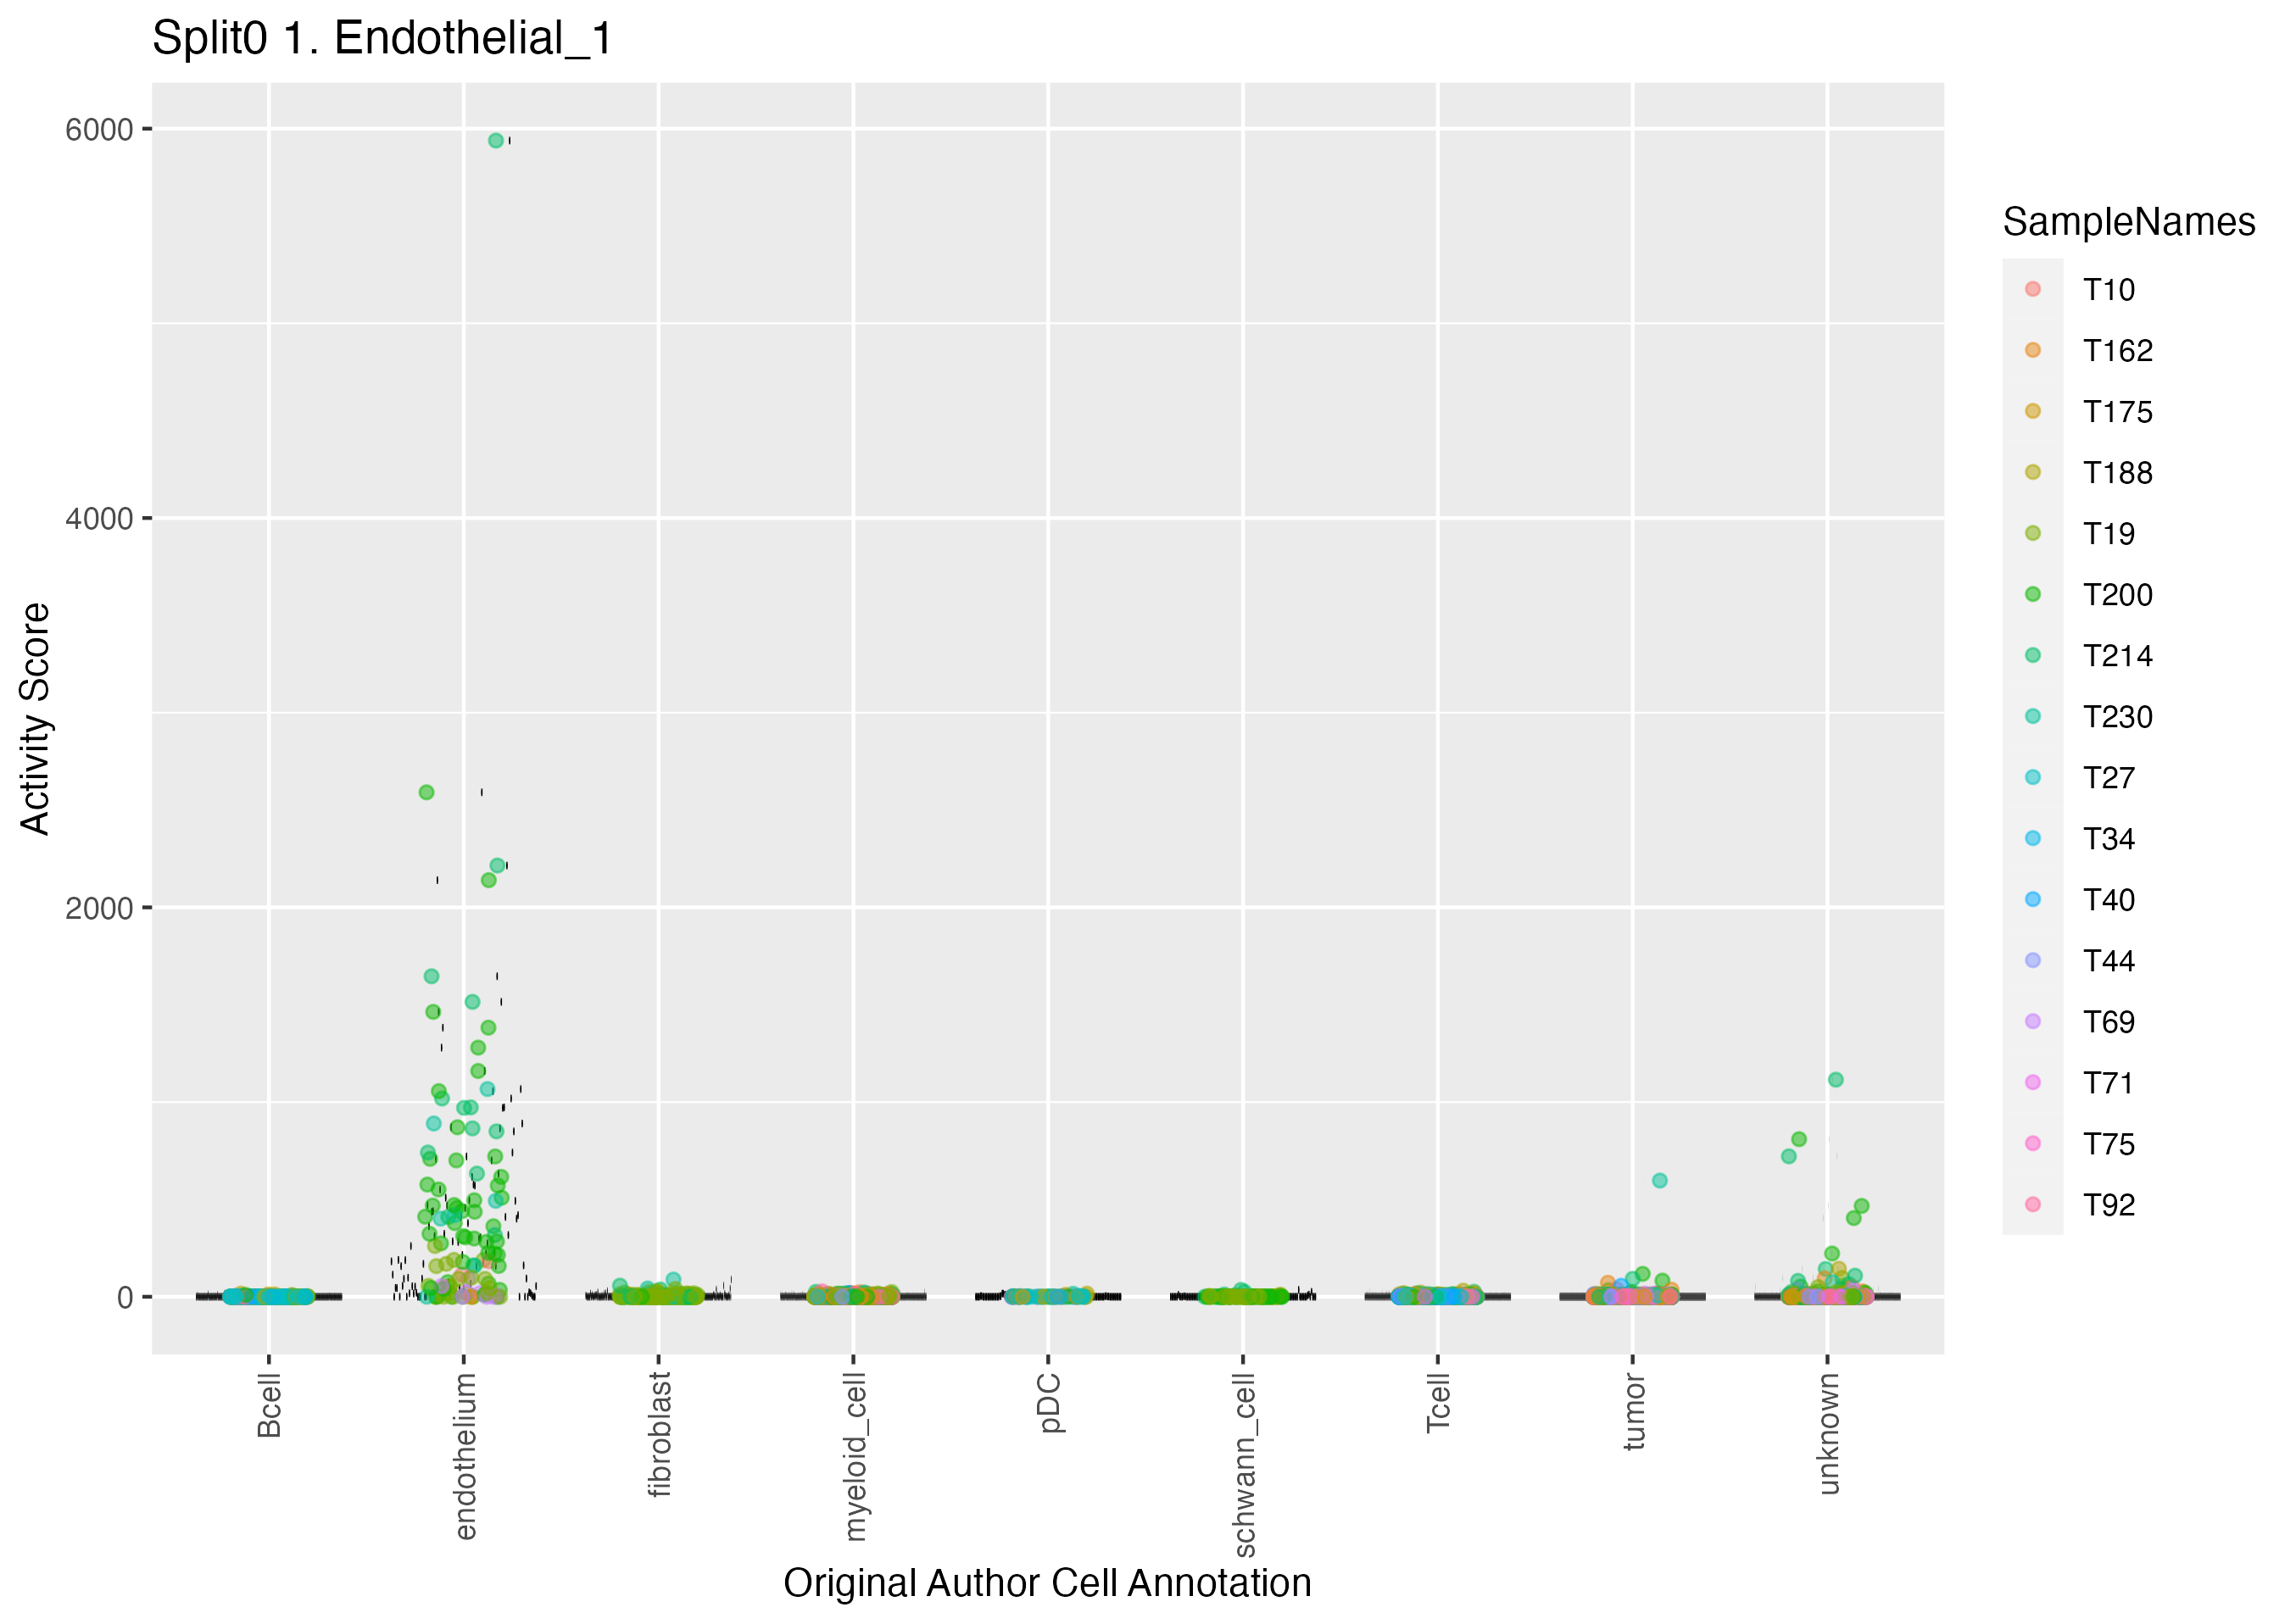
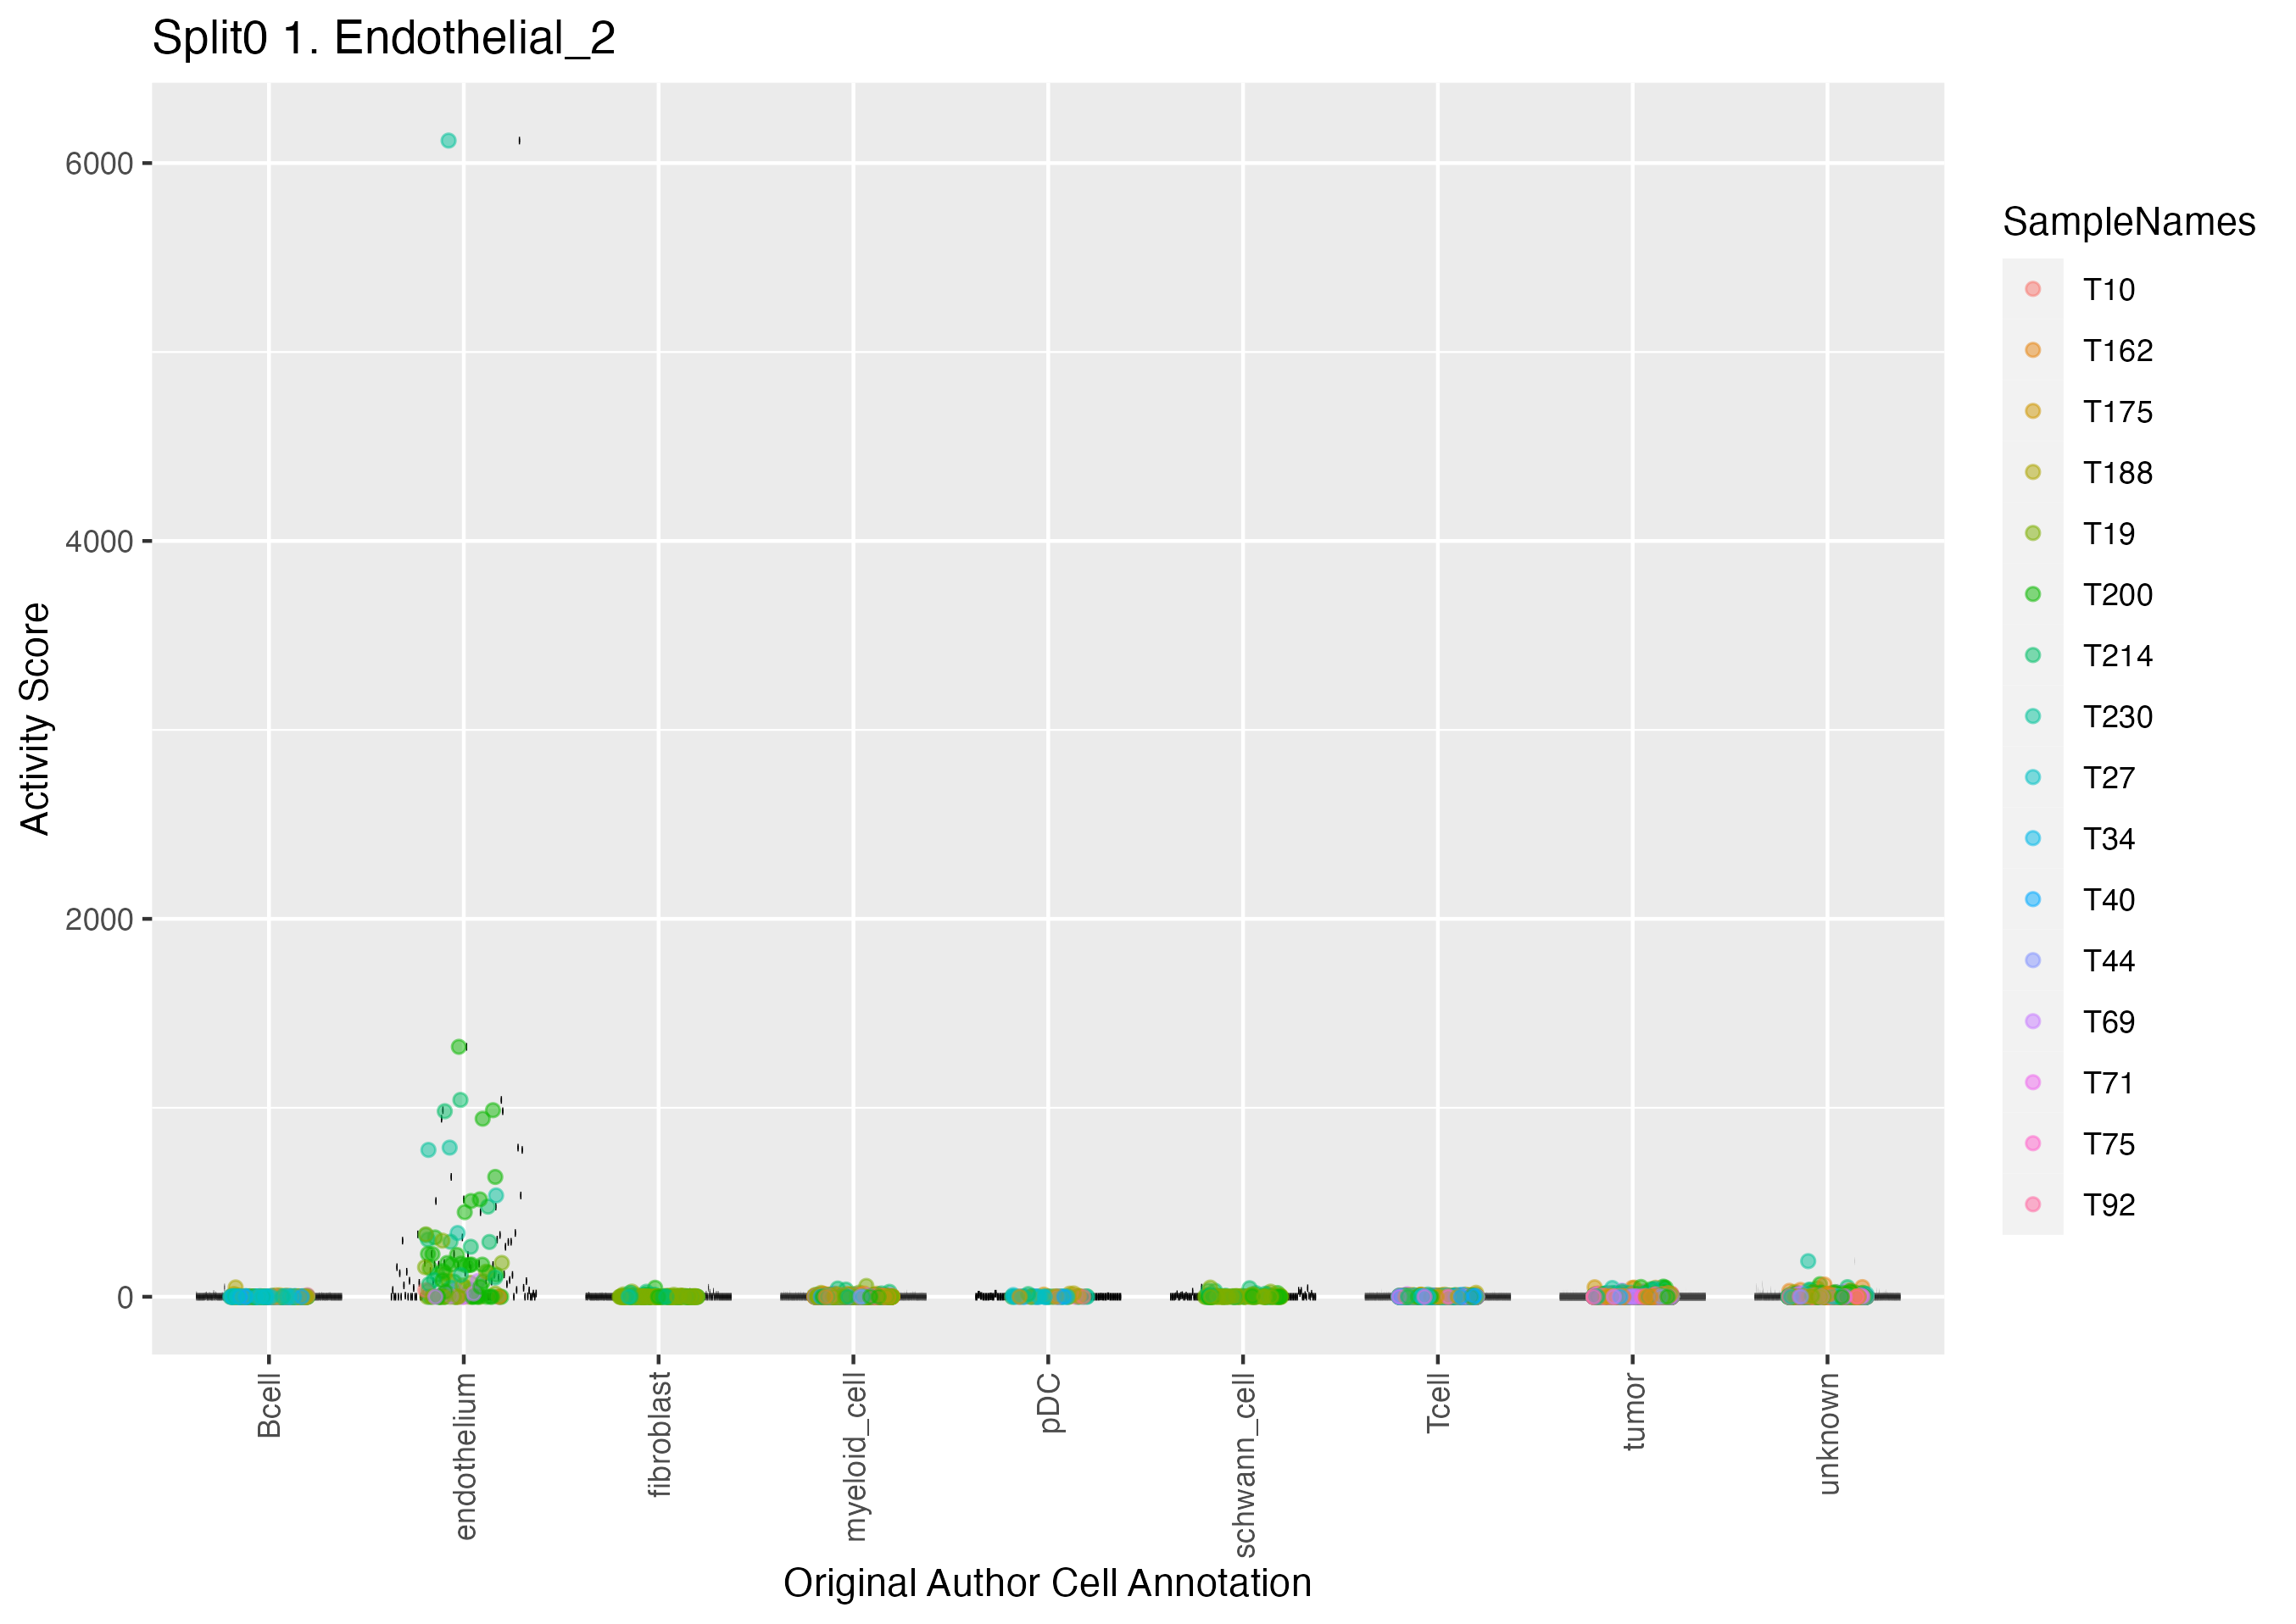
UMAP plots showing activity of gene expression program identified in GEP 1. Endothelial:


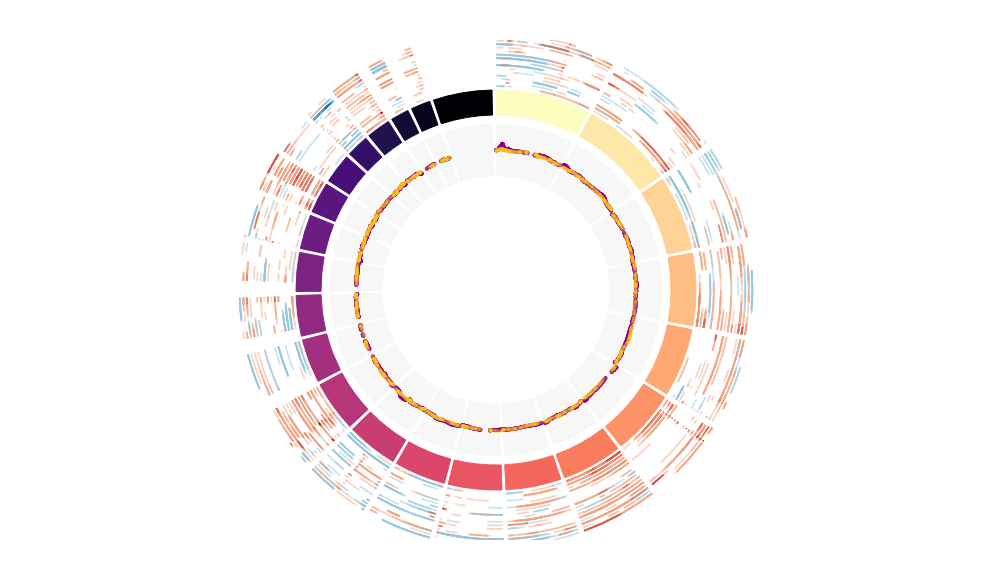
CNV Data procured from inferCNV.
Outer tracks are putative CNV regions (gains = red, losses = blue) for each patient
Inner track is expression data representing:
The top cells expressing this GEP (purple)
Random cells (n =50) from the reference set used in inferCNV (orange)
Gene set Enrichments for this program, caculated from top 50 genes
mSigDB Cell Types Gene Set:
| P-value | OR | Lower 95% CI | FDR | FWER | Genes Found | Gene Set Size | |
|---|---|---|---|---|---|---|---|
| DURANTE_ADULT_OLFACTORY_NEUROEPITHELIUM_PERICYTES | 1.04e-36 | 171.85 | 88.15 | 3.50e-34 | 6.99e-34 | 22AQP1, EMCN, ESAM, PLVAP, CLEC14A, FLT1, EGFL7, CD34, ENG, A2M, CLDN5, VWF, TM4SF1, NOSTRIN, SPRY1, PALMD, SPARCL1, CYYR1, ABCG2, PODXL, SLC9A3R2, CALCRL |
79 |
| DESCARTES_FETAL_INTESTINE_VASCULAR_ENDOTHELIAL_CELLS | 1.32e-26 | 190.01 | 86.63 | 7.37e-25 | 8.84e-24 | 15EMCN, ESAM, PLVAP, CLEC14A, HSPG2, FAM167B, DLL4, FLT1, MMRN2, CD34, CYYR1, COL15A1, GPR4, PCDH12, ESM1 |
43 |
| AIZARANI_LIVER_C10_MVECS_1 | 3.30e-48 | 124.68 | 65.23 | 2.21e-45 | 2.21e-45 | 35AQP1, EMCN, ESAM, PLVAP, CLEC14A, CDH5, BCAM, KDR, FLT1, MMRN2, EGFL7, CD34, ENG, GJA1, A2M, CLDN5, VWF, TM4SF1, NOSTRIN, ROBO4, SPRY1, PALMD, SPARCL1, CYYR1, COL15A1, SLC9A3R2, FAM107A, CALCRL, INSR, RBP7, SPARC, TIE1, PCDH12, ERG, PTPRB |
269 |
| GAO_LARGE_INTESTINE_24W_C2_MKI67POS_PROGENITOR | 6.83e-33 | 107.59 | 56.52 | 7.64e-31 | 4.58e-30 | 22EMCN, ESAM, PLVAP, CLEC14A, CDH5, KDR, FLT1, MMRN2, EGFL7, CD34, ENG, CLDN5, VWF, TM4SF1, ROBO4, PALMD, CYYR1, PODXL, CALCRL, TIE1, ERG, PTPRB |
113 |
| DESCARTES_FETAL_STOMACH_VASCULAR_ENDOTHELIAL_CELLS | 1.56e-15 | 130.42 | 49.28 | 4.54e-14 | 1.04e-12 | 9EMCN, ESAM, PLVAP, CLEC14A, FLT1, CD34, A2M, CYYR1, PCDH12 |
30 |
| CUI_DEVELOPING_HEART_C4_ENDOTHELIAL_CELL | 2.84e-30 | 79.09 | 41.93 | 2.39e-28 | 1.91e-27 | 22EMCN, ESAM, PLVAP, CLEC14A, CDH5, KDR, FLT1, MMRN2, EGFL7, CD34, ENG, VWF, TM4SF1, NOSTRIN, ROBO4, PALMD, CYYR1, PODXL, CALCRL, ACKR3, TIE1, PTPRB |
146 |
| DESCARTES_FETAL_PANCREAS_VASCULAR_ENDOTHELIAL_CELLS | 1.24e-19 | 86.05 | 39.45 | 4.63e-18 | 8.34e-17 | 13ESAM, PLVAP, CLEC14A, HSPG2, FAM167B, FLT1, MMRN2, CD34, NOSTRIN, CYYR1, COL15A1, PCDH12, ESM1 |
64 |
| RUBENSTEIN_SKELETAL_MUSCLE_ENDOTHELIAL_CELLS | 3.98e-27 | 71.12 | 37.16 | 2.96e-25 | 2.67e-24 | 20AQP1, EMCN, ESAM, CLEC14A, CDH5, HSPG2, FLT1, MMRN2, EGFL7, CD34, ENG, A2M, CLDN5, VWF, TM4SF1, PALMD, SPARCL1, PODXL, SLC9A3R2, PTPRB |
137 |
| DESCARTES_FETAL_ADRENAL_VASCULAR_ENDOTHELIAL_CELLS | 5.39e-27 | 69.97 | 36.55 | 3.29e-25 | 3.62e-24 | 20INHBB, PLVAP, CLEC14A, CDH5, DLL4, KDR, MMRN2, CD34, ENG, CLDN5, ROBO4, PODXL, SLC9A3R2, GPR4, CALCRL, NR5A2, TIE1, PCDH12, ESM1, PTPRB |
139 |
| AIZARANI_LIVER_C29_MVECS_2 | 2.91e-36 | 66.23 | 35.95 | 6.51e-34 | 1.95e-33 | 30AQP1, EMCN, ESAM, PLVAP, CLEC14A, CDH5, FLT1, MMRN2, CD34, ENG, GJA1, A2M, CLDN5, VWF, TM4SF1, STC1, SPRY1, PALMD, SPARCL1, CYYR1, FAM107A, MECOM, CALCRL, INSR, ACKR3, TIE1, PREX2, ERG, IGFBP3, PTPRB |
313 |
| DESCARTES_FETAL_THYMUS_VASCULAR_ENDOTHELIAL_CELLS | 7.36e-24 | 62.24 | 31.85 | 3.09e-22 | 4.94e-21 | 18EMCN, PLVAP, BCAM, KDR, FLT1, EGFL7, A2M, CLDN5, VWF, PALMD, COL15A1, PODXL, MECOM, CALCRL, TIE1, PREX2, ERG, PTPRB |
131 |
| DESCARTES_FETAL_EYE_VASCULAR_ENDOTHELIAL_CELLS | 2.29e-19 | 63.83 | 30.49 | 8.08e-18 | 1.54e-16 | 14PLVAP, CLEC14A, CDH5, FLT1, EGFL7, ENG, CLDN5, VWF, ROBO4, ABCG2, PODXL, CALCRL, TIE1, ERG |
90 |
| FAN_EMBRYONIC_CTX_BRAIN_ENDOTHELIAL_1 | 1.58e-33 | 49.91 | 27.08 | 2.25e-31 | 1.06e-30 | 31EMCN, ESAM, CLEC14A, CDH5, DLL4, KDR, FLT1, MMRN2, EGFL7, CD34, ENG, GJA1, CLDN5, VWF, TM4SF1, NOSTRIN, ROBO4, PALMD, SPARCL1, CYYR1, PODXL, SLC9A3R2, MECOM, CALCRL, INSR, SPARC, TIE1, PREX2, PCDH12, ERG, PTPRB |
440 |
| MURARO_PANCREAS_ENDOTHELIAL_CELL | 6.17e-31 | 47.73 | 26.00 | 5.91e-29 | 4.14e-28 | 28EMCN, ESAM, PLVAP, CLEC14A, CDH5, KDR, FLT1, MMRN2, CD34, A2M, VWF, TM4SF1, STC1, ROBO4, SPARCL1, CYYR1, HTRA1, COL15A1, PODXL, MECOM, GPR4, CALCRL, INSR, SPARC, TIE1, ERG, ESM1, PTPRB |
362 |
| AIZARANI_LIVER_C13_LSECS_2 | 4.79e-27 | 44.56 | 24.14 | 3.22e-25 | 3.22e-24 | 24EMCN, ESAM, CLEC14A, CDH5, FAM167B, KDR, FLT1, MMRN2, EGFL7, ENG, A2M, CLDN5, TM4SF1, NOSTRIN, ROBO4, SLC9A3R2, FAM107A, CALCRL, INSR, SPARC, TIE1, PREX2, ERG, PTPRB |
283 |
| MANNO_MIDBRAIN_NEUROTYPES_HENDO | 1.68e-33 | 41.87 | 21.67 | 2.25e-31 | 1.13e-30 | 37EMCN, ESAM, PLVAP, CLEC14A, CDH5, HSPG2, BCAM, DLL4, KDR, FLT1, MMRN2, EGFL7, CD34, ENG, GJA1, A2M, CLDN5, VWF, TM4SF1, NOSTRIN, ROBO4, PALMD, CYYR1, ABCG2, HTRA1, PODXL, SLC9A3R2, MECOM, GPR4, CALCRL, INSR, TIE1, PCDH12, ERG, IGFBP3, ESM1, PTPRB |
888 |
| DESCARTES_FETAL_MUSCLE_VASCULAR_ENDOTHELIAL_CELLS | 1.89e-13 | 49.55 | 21.14 | 4.69e-12 | 1.27e-10 | 10PLVAP, FAM167B, DLL4, FLT1, MMRN2, TM4SF1, NOSTRIN, CYYR1, RBP7, ESM1 |
73 |
| MENON_FETAL_KIDNEY_9_ENDOTHELIAL_CELLS | 3.66e-15 | 43.75 | 20.15 | 9.81e-14 | 2.45e-12 | 12EMCN, ESAM, HSPG2, KDR, FLT1, EGFL7, CD34, A2M, CLDN5, TM4SF1, NOSTRIN, SPARC |
102 |
| DESCARTES_FETAL_PLACENTA_VASCULAR_ENDOTHELIAL_CELLS | 3.66e-15 | 43.75 | 20.15 | 9.81e-14 | 2.45e-12 | 12PLVAP, CLEC14A, CDH5, DLL4, KDR, EGFL7, CD34, CLDN5, ROBO4, CYYR1, TIE1, ERG |
102 |
| FAN_EMBRYONIC_CTX_BIG_GROUPS_BRAIN_ENDOTHELIAL | 1.98e-24 | 33.85 | 18.40 | 9.50e-23 | 1.33e-21 | 24EMCN, ESAM, CLEC14A, CDH5, KDR, FLT1, EGFL7, CD34, ENG, CLDN5, VWF, TM4SF1, NOSTRIN, ROBO4, CYYR1, ABCG2, PODXL, SLC9A3R2, MECOM, SPARC, TIE1, PCDH12, ERG, PTPRB |
365 |
Dowload full table
mSigDB Hallmark Gene Sets:
| P-value | OR | Lower 95% CI | FDR | FWER | Genes Found | Gene Set Size | |
|---|---|---|---|---|---|---|---|
| HALLMARK_COAGULATION | 2.09e-03 | 8.11 | 2.09 | 1.05e-01 | 1.05e-01 | 4A2M, VWF, HTRA1, SPARC |
138 |
| HALLMARK_EPITHELIAL_MESENCHYMAL_TRANSITION | 7.71e-03 | 5.55 | 1.44 | 1.28e-01 | 3.85e-01 | 4GJA1, HTRA1, SPARC, IGFBP3 |
200 |
| HALLMARK_KRAS_SIGNALING_UP | 7.71e-03 | 5.55 | 1.44 | 1.28e-01 | 3.85e-01 | 4PLVAP, ENG, SPARCL1, IGFBP3 |
200 |
| HALLMARK_HYPOXIA | 4.35e-02 | 4.05 | 0.80 | 3.11e-01 | 1.00e+00 | 3STC1, ACKR3, IGFBP3 |
200 |
| HALLMARK_ESTROGEN_RESPONSE_EARLY | 4.35e-02 | 4.05 | 0.80 | 3.11e-01 | 1.00e+00 | 3INHBB, GJA1, PODXL |
200 |
| HALLMARK_MYOGENESIS | 4.35e-02 | 4.05 | 0.80 | 3.11e-01 | 1.00e+00 | 3COL15A1, SPARC, IGFBP3 |
200 |
| HALLMARK_APICAL_JUNCTION | 4.35e-02 | 4.05 | 0.80 | 3.11e-01 | 1.00e+00 | 3CD34, CLDN5, VWF |
200 |
| HALLMARK_ADIPOGENESIS | 1.85e-01 | 2.63 | 0.31 | 7.44e-01 | 1.00e+00 | 2SPARCL1, COL15A1 |
200 |
| HALLMARK_GLYCOLYSIS | 1.85e-01 | 2.63 | 0.31 | 7.44e-01 | 1.00e+00 | 2STC1, IGFBP3 |
200 |
| HALLMARK_P53_PATHWAY | 1.85e-01 | 2.63 | 0.31 | 7.44e-01 | 1.00e+00 | 2INHBB, TM4SF1 |
200 |
| HALLMARK_HEME_METABOLISM | 1.85e-01 | 2.63 | 0.31 | 7.44e-01 | 1.00e+00 | 2BCAM, ABCG2 |
200 |
| HALLMARK_ANGIOGENESIS | 1.34e-01 | 7.29 | 0.18 | 7.44e-01 | 1.00e+00 | 1STC1 |
36 |
| HALLMARK_TGF_BETA_SIGNALING | 1.94e-01 | 4.81 | 0.12 | 7.44e-01 | 1.00e+00 | 1ENG |
54 |
| HALLMARK_IL6_JAK_STAT3_SIGNALING | 2.93e-01 | 2.97 | 0.07 | 1.00e+00 | 1.00e+00 | 1A2M |
87 |
| HALLMARK_UV_RESPONSE_DN | 4.35e-01 | 1.78 | 0.04 | 1.00e+00 | 1.00e+00 | 1GJA1 |
144 |
| HALLMARK_DNA_REPAIR | 4.49e-01 | 1.71 | 0.04 | 1.00e+00 | 1.00e+00 | 1BCAM |
150 |
| HALLMARK_TNFA_SIGNALING_VIA_NFKB | 5.47e-01 | 1.28 | 0.03 | 1.00e+00 | 1.00e+00 | 1ACKR3 |
200 |
| HALLMARK_MTORC1_SIGNALING | 5.47e-01 | 1.28 | 0.03 | 1.00e+00 | 1.00e+00 | 1STC1 |
200 |
| HALLMARK_INFLAMMATORY_RESPONSE | 5.47e-01 | 1.28 | 0.03 | 1.00e+00 | 1.00e+00 | 1CALCRL |
200 |
| HALLMARK_ALLOGRAFT_REJECTION | 5.47e-01 | 1.28 | 0.03 | 1.00e+00 | 1.00e+00 | 1INHBB |
200 |
Dowload full table
KEGG Pathways:
| P-value | OR | Lower 95% CI | FDR | FWER | Genes Found | Gene Set Size | |
|---|---|---|---|---|---|---|---|
| KEGG_CELL_ADHESION_MOLECULES_CAMS | 1.83e-03 | 8.43 | 2.17 | 3.41e-01 | 3.41e-01 | 4ESAM, CDH5, CD34, CLDN5 |
133 |
| KEGG_ALDOSTERONE_REGULATED_SODIUM_REABSORPTION | 1.20e-02 | 13.01 | 1.48 | 7.46e-01 | 1.00e+00 | 2SLC9A3R2, INSR |
42 |
| KEGG_LEUKOCYTE_TRANSENDOTHELIAL_MIGRATION | 1.07e-02 | 7.06 | 1.39 | 7.46e-01 | 1.00e+00 | 3ESAM, CDH5, CLDN5 |
116 |
| KEGG_COMPLEMENT_AND_COAGULATION_CASCADES | 3.05e-02 | 7.77 | 0.90 | 1.00e+00 | 1.00e+00 | 2A2M, VWF |
69 |
| KEGG_ADHERENS_JUNCTION | 3.38e-02 | 7.33 | 0.85 | 1.00e+00 | 1.00e+00 | 2INSR, PTPRB |
73 |
| KEGG_FOCAL_ADHESION | 4.30e-02 | 4.07 | 0.80 | 1.00e+00 | 1.00e+00 | 3KDR, FLT1, VWF |
199 |
| KEGG_ECM_RECEPTOR_INTERACTION | 4.36e-02 | 6.35 | 0.74 | 1.00e+00 | 1.00e+00 | 2HSPG2, VWF |
84 |
| KEGG_CYTOKINE_CYTOKINE_RECEPTOR_INTERACTION | 8.44e-02 | 3.05 | 0.60 | 1.00e+00 | 1.00e+00 | 3INHBB, KDR, FLT1 |
265 |
| KEGG_ENDOCYTOSIS | 1.59e-01 | 2.91 | 0.34 | 1.00e+00 | 1.00e+00 | 2KDR, FLT1 |
181 |
| KEGG_PROXIMAL_TUBULE_BICARBONATE_RECLAMATION | 8.77e-02 | 11.59 | 0.28 | 1.00e+00 | 1.00e+00 | 1AQP1 |
23 |
| KEGG_MATURITY_ONSET_DIABETES_OF_THE_YOUNG | 9.49e-02 | 10.62 | 0.25 | 1.00e+00 | 1.00e+00 | 1NR5A2 |
25 |
| KEGG_ABC_TRANSPORTERS | 1.61e-01 | 5.93 | 0.14 | 1.00e+00 | 1.00e+00 | 1ABCG2 |
44 |
| KEGG_NOTCH_SIGNALING_PATHWAY | 1.71e-01 | 5.54 | 0.13 | 1.00e+00 | 1.00e+00 | 1DLL4 |
47 |
| KEGG_TYPE_II_DIABETES_MELLITUS | 1.71e-01 | 5.54 | 0.13 | 1.00e+00 | 1.00e+00 | 1INSR |
47 |
| KEGG_P53_SIGNALING_PATHWAY | 2.37e-01 | 3.81 | 0.09 | 1.00e+00 | 1.00e+00 | 1IGFBP3 |
68 |
| KEGG_CHRONIC_MYELOID_LEUKEMIA | 2.52e-01 | 3.54 | 0.09 | 1.00e+00 | 1.00e+00 | 1MECOM |
73 |
| KEGG_ARRHYTHMOGENIC_RIGHT_VENTRICULAR_CARDIOMYOPATHY_ARVC | 2.55e-01 | 3.49 | 0.09 | 1.00e+00 | 1.00e+00 | 1GJA1 |
74 |
| KEGG_VEGF_SIGNALING_PATHWAY | 2.61e-01 | 3.40 | 0.08 | 1.00e+00 | 1.00e+00 | 1KDR |
76 |
| KEGG_TGF_BETA_SIGNALING_PATHWAY | 2.90e-01 | 3.00 | 0.07 | 1.00e+00 | 1.00e+00 | 1INHBB |
86 |
| KEGG_HEMATOPOIETIC_CELL_LINEAGE | 2.93e-01 | 2.97 | 0.07 | 1.00e+00 | 1.00e+00 | 1CD34 |
87 |
Dowload full table
CHR Positional Gene Sets:
| P-value | OR | Lower 95% CI | FDR | FWER | Genes Found | Gene Set Size | |
|---|---|---|---|---|---|---|---|
| chr4q22 | 3.13e-02 | 7.66 | 0.88 | 1.00e+00 | 1.00e+00 | 2SPARCL1, ABCG2 |
70 |
| chr11q24 | 1.61e-01 | 2.88 | 0.34 | 1.00e+00 | 1.00e+00 | 2ESAM, ROBO4 |
183 |
| chr1q32 | 2.78e-01 | 1.97 | 0.23 | 1.00e+00 | 1.00e+00 | 2CD34, NR5A2 |
266 |
| chr9q34 | 3.42e-01 | 1.69 | 0.20 | 1.00e+00 | 1.00e+00 | 2EGFL7, ENG |
311 |
| chr12p13 | 3.72e-01 | 1.57 | 0.18 | 1.00e+00 | 1.00e+00 | 2A2M, VWF |
333 |
| chr12q15 | 1.97e-01 | 4.72 | 0.12 | 1.00e+00 | 1.00e+00 | 1PTPRB |
55 |
| chr4q24 | 2.00e-01 | 4.64 | 0.11 | 1.00e+00 | 1.00e+00 | 1EMCN |
56 |
| chr7p12 | 2.06e-01 | 4.47 | 0.11 | 1.00e+00 | 1.00e+00 | 1IGFBP3 |
58 |
| chr1p36 | 1.00e+00 | 0.80 | 0.09 | 1.00e+00 | 1.00e+00 | 2HSPG2, RBP7 |
656 |
| chr8q13 | 2.46e-01 | 3.64 | 0.09 | 1.00e+00 | 1.00e+00 | 1PREX2 |
71 |
| chr16q21 | 2.55e-01 | 3.49 | 0.09 | 1.00e+00 | 1.00e+00 | 1CDH5 |
74 |
| chr4q12 | 2.70e-01 | 3.27 | 0.08 | 1.00e+00 | 1.00e+00 | 1KDR |
79 |
| chr19p13 | 1.00e+00 | 0.68 | 0.08 | 1.00e+00 | 1.00e+00 | 2PLVAP, INSR |
773 |
| chr5q11 | 2.87e-01 | 3.04 | 0.07 | 1.00e+00 | 1.00e+00 | 1ESM1 |
85 |
| chr7q32 | 3.01e-01 | 2.87 | 0.07 | 1.00e+00 | 1.00e+00 | 1PODXL |
90 |
| chr14q21 | 3.04e-01 | 2.83 | 0.07 | 1.00e+00 | 1.00e+00 | 1CLEC14A |
91 |
| chr1p21 | 3.25e-01 | 2.60 | 0.06 | 1.00e+00 | 1.00e+00 | 1PALMD |
99 |
| chr2q32 | 3.49e-01 | 2.38 | 0.06 | 1.00e+00 | 1.00e+00 | 1CALCRL |
108 |
| chr5q33 | 3.52e-01 | 2.36 | 0.06 | 1.00e+00 | 1.00e+00 | 1SPARC |
109 |
| chr21q21 | 3.77e-01 | 2.16 | 0.05 | 1.00e+00 | 1.00e+00 | 1CYYR1 |
119 |
Dowload full table
Transcription Factor Targets:
| P-value | OR | Lower 95% CI | FDR | FWER | Genes Found | Gene Set Size | |
|---|---|---|---|---|---|---|---|
| NFAT_Q6 | 4.75e-05 | 8.41 | 3.16 | 5.38e-02 | 5.38e-02 | 7HSPG2, DLL4, SPARCL1, PREX2, PCDH12, ERG, IGFBP3 |
249 |
| HP1SITEFACTOR_Q6 | 2.92e-04 | 7.44 | 2.57 | 1.66e-01 | 3.31e-01 | 6STC1, MECOM, CALCRL, SPARC, NR5A2, PREX2 |
235 |
| GATA3_01 | 2.60e-03 | 5.79 | 1.78 | 3.54e-01 | 1.00e+00 | 5INHBB, HSPG2, CD34, NR5A2, ERG |
245 |
| CIZ_01 | 3.02e-03 | 5.58 | 1.71 | 3.54e-01 | 1.00e+00 | 5ACKR3, NR5A2, PCDH12, ERG, ESM1 |
254 |
| RYTTCCTG_ETS2_B | 5.29e-04 | 3.59 | 1.70 | 2.00e-01 | 6.00e-01 | 12ESAM, CLEC14A, CDH5, DLL4, FLT1, EGFL7, CLDN5, NOSTRIN, ROBO4, CALCRL, SPARC, ERG |
1112 |
| STAT5A_03 | 4.15e-03 | 5.16 | 1.59 | 3.80e-01 | 1.00e+00 | 5EMCN, HSPG2, FLT1, STC1, TIE1 |
274 |
| TGTTTGY_HNF3_Q6 | 1.68e-03 | 3.71 | 1.58 | 3.18e-01 | 1.00e+00 | 9EMCN, ESAM, MMRN2, EGFL7, A2M, ROBO4, SPRY1, PALMD, ERG |
748 |
| ETS2_B | 4.61e-03 | 5.03 | 1.55 | 3.80e-01 | 1.00e+00 | 5ESAM, CLEC14A, CDH5, SPARC, ESM1 |
281 |
| GATA1_05 | 4.81e-03 | 4.98 | 1.53 | 3.80e-01 | 1.00e+00 | 5EGFL7, STC1, MECOM, NR5A2, ERG |
284 |
| GATAAGR_GATA_C | 5.94e-03 | 4.72 | 1.45 | 3.96e-01 | 1.00e+00 | 5CD34, STC1, MECOM, NR5A2, ERG |
299 |
| AACTTT_UNKNOWN | 5.37e-03 | 2.54 | 1.26 | 3.80e-01 | 1.00e+00 | 14AQP1, EMCN, CDH5, HSPG2, CD34, GJA1, STC1, SPRY1, SPARCL1, MECOM, ACKR3, SPARC, NR5A2, ERG |
1928 |
| VDR_Q3 | 1.27e-02 | 4.77 | 1.24 | 4.03e-01 | 1.00e+00 | 4BCAM, STC1, MECOM, GPR4 |
232 |
| SOX9_B1 | 1.38e-02 | 4.65 | 1.20 | 4.03e-01 | 1.00e+00 | 4HSPG2, STC1, PCDH12, ERG |
238 |
| GCM_Q2 | 1.52e-02 | 4.51 | 1.17 | 4.03e-01 | 1.00e+00 | 4BCAM, DLL4, VWF, STC1 |
245 |
| RGAGGAARY_PU1_Q6 | 1.33e-02 | 3.35 | 1.16 | 4.03e-01 | 1.00e+00 | 6EMCN, PLVAP, MMRN2, NOSTRIN, TIE1, ESM1 |
515 |
| ELF1_Q6 | 1.60e-02 | 4.44 | 1.15 | 4.03e-01 | 1.00e+00 | 4CDH5, CALCRL, TIE1, ESM1 |
249 |
| GATA4_Q3 | 1.69e-02 | 4.37 | 1.13 | 4.03e-01 | 1.00e+00 | 4DLL4, EGFL7, STC1, COL15A1 |
253 |
| HMGIY_Q6 | 1.69e-02 | 4.37 | 1.13 | 4.03e-01 | 1.00e+00 | 4HSPG2, CALCRL, ERG, ESM1 |
253 |
| NERF_Q2 | 1.71e-02 | 4.35 | 1.13 | 4.03e-01 | 1.00e+00 | 4FLT1, MMRN2, ROBO4, ERG |
254 |
| STAT5B_01 | 1.73e-02 | 4.33 | 1.12 | 4.03e-01 | 1.00e+00 | 4DLL4, CLDN5, STC1, ERG |
255 |
Dowload full table
GO Biological Processes:
| P-value | OR | Lower 95% CI | FDR | FWER | Genes Found | Gene Set Size | |
|---|---|---|---|---|---|---|---|
| GOBP_VASCULAR_ENDOTHELIAL_GROWTH_FACTOR_RECEPTOR_2_SIGNALING_PATHWAY | 1.54e-04 | 172.68 | 14.09 | 3.72e-02 | 1.00e+00 | 2CLEC14A, KDR |
5 |
| GOBP_ENDOTHELIUM_DEVELOPMENT | 4.05e-12 | 27.95 | 12.61 | 4.33e-09 | 3.03e-08 | 11CDH5, DLL4, KDR, CD34, ENG, GJA1, CLDN5, STC1, ROBO4, COL15A1, TIE1 |
137 |
| GOBP_GLOMERULAR_MESANGIAL_CELL_DIFFERENTIATION | 2.31e-04 | 129.66 | 11.45 | 4.80e-02 | 1.00e+00 | 2CD34, GPR4 |
6 |
| GOBP_POSITIVE_REGULATION_OF_ENDOTHELIAL_CELL_DEVELOPMENT | 2.31e-04 | 129.66 | 11.45 | 4.80e-02 | 1.00e+00 | 2CDH5, CLDN5 |
6 |
| GOBP_NEGATIVE_REGULATION_OF_GONADOTROPIN_SECRETION | 3.22e-04 | 103.49 | 9.64 | 5.77e-02 | 1.00e+00 | 2INHBB, GJA1 |
7 |
| GOBP_ENDOTHELIAL_CELL_DEVELOPMENT | 2.16e-07 | 28.38 | 9.52 | 1.47e-04 | 1.61e-03 | 6CDH5, ENG, CLDN5, STC1, ROBO4, COL15A1 |
66 |
| GOBP_MAINTENANCE_OF_BLOOD_BRAIN_BARRIER | 8.29e-06 | 37.38 | 9.19 | 2.95e-03 | 6.20e-02 | 4ESAM, CDH5, GJA1, CLDN5 |
33 |
| GOBP_DORSAL_AORTA_MORPHOGENESIS | 4.28e-04 | 86.37 | 8.33 | 6.68e-02 | 1.00e+00 | 2DLL4, ENG |
8 |
| GOBP_PERICYTE_CELL_DIFFERENTIATION | 4.28e-04 | 86.37 | 8.33 | 6.68e-02 | 1.00e+00 | 2CD34, GPR4 |
8 |
| GOBP_VASCULOGENESIS | 5.85e-07 | 23.64 | 7.99 | 3.63e-04 | 4.38e-03 | 6KDR, EGFL7, CD34, ENG, ACKR3, TIE1 |
78 |
| GOBP_BLOOD_VESSEL_MORPHOGENESIS | 9.55e-15 | 13.81 | 7.44 | 3.51e-11 | 7.14e-11 | 21AQP1, CLEC14A, CDH5, HSPG2, DLL4, KDR, FLT1, MMRN2, EGFL7, CD34, ENG, CLDN5, ROBO4, COL15A1, GPR4, CALCRL, ACKR3, SPARC, TIE1, ESM1, PTPRB |
677 |
| GOBP_REGULATION_OF_GONADOTROPIN_SECRETION | 5.49e-04 | 74.10 | 7.33 | 7.76e-02 | 1.00e+00 | 2INHBB, GJA1 |
9 |
| GOBP_TUBE_MORPHOGENESIS | 1.41e-14 | 12.16 | 6.63 | 3.51e-11 | 1.05e-10 | 23AQP1, CLEC14A, CDH5, HSPG2, DLL4, KDR, FLT1, MMRN2, EGFL7, CD34, ENG, CLDN5, ROBO4, SPRY1, COL15A1, PODXL, GPR4, CALCRL, ACKR3, SPARC, TIE1, ESM1, PTPRB |
900 |
| GOBP_DORSAL_AORTA_DEVELOPMENT | 6.85e-04 | 64.86 | 6.55 | 8.99e-02 | 1.00e+00 | 2DLL4, ENG |
10 |
| GOBP_VASCULATURE_DEVELOPMENT | 1.54e-13 | 11.85 | 6.39 | 1.92e-10 | 1.15e-09 | 21AQP1, CLEC14A, CDH5, HSPG2, DLL4, KDR, FLT1, MMRN2, EGFL7, CD34, ENG, CLDN5, ROBO4, COL15A1, GPR4, CALCRL, ACKR3, SPARC, TIE1, ESM1, PTPRB |
786 |
| GOBP_ESTABLISHMENT_OF_ENDOTHELIAL_BARRIER | 3.76e-05 | 24.69 | 6.19 | 1.08e-02 | 2.81e-01 | 4CDH5, ENG, CLDN5, ROBO4 |
48 |
| GOBP_ANATOMICAL_STRUCTURE_FORMATION_INVOLVED_IN_MORPHOGENESIS | 1.38e-14 | 11.21 | 6.15 | 3.51e-11 | 1.03e-10 | 25AQP1, CLEC14A, CDH5, HSPG2, DLL4, KDR, FLT1, MMRN2, EGFL7, CD34, ENG, GJA1, CLDN5, ROBO4, SPRY1, HTRA1, COL15A1, PODXL, GPR4, CALCRL, ACKR3, SPARC, TIE1, ESM1, PTPRB |
1142 |
| GOBP_TUBE_DEVELOPMENT | 5.30e-14 | 10.89 | 5.96 | 9.91e-11 | 3.96e-10 | 24AQP1, CLEC14A, CDH5, HSPG2, DLL4, KDR, FLT1, MMRN2, EGFL7, CD34, ENG, GJA1, CLDN5, ROBO4, SPRY1, COL15A1, PODXL, GPR4, CALCRL, ACKR3, SPARC, TIE1, ESM1, PTPRB |
1085 |
| GOBP_ANGIOGENESIS_INVOLVED_IN_WOUND_HEALING | 2.01e-04 | 30.63 | 5.74 | 4.69e-02 | 1.00e+00 | 3KDR, CD34, GPR4 |
29 |
| GOBP_CIRCULATORY_SYSTEM_DEVELOPMENT | 1.44e-13 | 10.35 | 5.67 | 1.92e-10 | 1.08e-09 | 24AQP1, CLEC14A, CDH5, HSPG2, DLL4, KDR, FLT1, MMRN2, EGFL7, CD34, ENG, GJA1, CLDN5, ROBO4, SPRY1, COL15A1, GPR4, CALCRL, INSR, ACKR3, SPARC, TIE1, ESM1, PTPRB |
1140 |
Dowload full table
Immunological Gene Sets:
| P-value | OR | Lower 95% CI | FDR | FWER | Genes Found | Gene Set Size | |
|---|---|---|---|---|---|---|---|
| GSE21379_WT_VS_SAP_KO_TFH_CD4_TCELL_UP | 9.73e-07 | 12.40 | 4.96 | 4.74e-03 | 4.74e-03 | 8ESAM, CDH5, FAM167B, KDR, TM4SF1, SLC9A3R2, GPR4, TIE1 |
200 |
| GSE37605_FOXP3_FUSION_GFP_VS_IRES_GFP_TREG_C57BL6_UP | 7.65e-04 | 7.72 | 2.36 | 8.77e-01 | 1.00e+00 | 5ESAM, TM4SF1, SPRY1, CYYR1, ACKR3 |
185 |
| GSE37605_C57BL6_VS_NOD_FOXP3_FUSION_GFP_TREG_DN | 8.81e-04 | 7.47 | 2.29 | 8.77e-01 | 1.00e+00 | 5TM4SF1, SPRY1, CYYR1, GPR4, ACKR3 |
191 |
| GSE21360_PRIMARY_VS_SECONDARY_MEMORY_CD8_TCELL_UP | 1.06e-03 | 7.16 | 2.19 | 8.77e-01 | 1.00e+00 | 5CD34, TM4SF1, ACKR3, SPARC, ERG |
199 |
| GSE20715_0H_VS_48H_OZONE_TLR4_KO_LUNG_UP | 1.08e-03 | 7.12 | 2.18 | 8.77e-01 | 1.00e+00 | 5DLL4, CLDN5, STC1, PALMD, IGFBP3 |
200 |
| GSE21546_WT_VS_SAP1A_KO_AND_ELK1_KO_DP_THYMOCYTES_DN | 1.08e-03 | 7.12 | 2.18 | 8.77e-01 | 1.00e+00 | 5ESAM, CDH5, MECOM, GPR4, ERG |
200 |
| GSE37605_FOXP3_FUSION_GFP_VS_IRES_GFP_TREG_C57BL6_DN | 4.96e-03 | 6.32 | 1.63 | 1.00e+00 | 1.00e+00 | 4CLEC14A, TM4SF1, CYYR1, SPARC |
176 |
| GSE3982_DC_VS_EFF_MEMORY_CD4_TCELL_DN | 7.20e-03 | 5.66 | 1.47 | 1.00e+00 | 1.00e+00 | 4AQP1, CD34, TM4SF1, ACKR3 |
196 |
| GSE22886_TH1_VS_TH2_48H_ACT_UP | 7.45e-03 | 5.60 | 1.45 | 1.00e+00 | 1.00e+00 | 4VWF, SPRY1, PREX2, ERG |
198 |
| GSE29618_PRE_VS_DAY7_FLU_VACCINE_PDC_UP | 7.58e-03 | 5.57 | 1.44 | 1.00e+00 | 1.00e+00 | 4AQP1, TM4SF1, ROBO4, SLC9A3R2 |
199 |
| GSE6681_DELETED_FOXP3_VS_WT_TREG_UP | 7.58e-03 | 5.57 | 1.44 | 1.00e+00 | 1.00e+00 | 4KDR, A2M, TM4SF1, ESM1 |
199 |
| GSE18281_SUBCAPSULAR_CORTICAL_REGION_VS_WHOLE_MEDULLA_THYMUS_UP | 7.58e-03 | 5.57 | 1.44 | 1.00e+00 | 1.00e+00 | 4HSPG2, BCAM, INSR, ERG |
199 |
| GSE17721_CTRL_VS_CPG_8H_BMDC_DN | 7.71e-03 | 5.55 | 1.44 | 1.00e+00 | 1.00e+00 | 4ENG, TM4SF1, INSR, SPARC |
200 |
| GSE17721_LPS_VS_PAM3CSK4_24H_BMDC_DN | 7.71e-03 | 5.55 | 1.44 | 1.00e+00 | 1.00e+00 | 4CDH5, BCAM, SPARCL1, CALCRL |
200 |
| GSE17721_POLYIC_VS_CPG_2H_BMDC_DN | 7.71e-03 | 5.55 | 1.44 | 1.00e+00 | 1.00e+00 | 4SPRY1, SPARCL1, COL15A1, CALCRL |
200 |
| GSE17721_LPS_VS_GARDIQUIMOD_2H_BMDC_UP | 7.71e-03 | 5.55 | 1.44 | 1.00e+00 | 1.00e+00 | 4CLDN5, SPRY1, HTRA1, CALCRL |
200 |
| GSE24142_ADULT_VS_FETAL_EARLY_THYMIC_PROGENITOR_DN | 7.71e-03 | 5.55 | 1.44 | 1.00e+00 | 1.00e+00 | 4AQP1, ESAM, ABCG2, PODXL |
200 |
| GSE2826_WT_VS_XID_BCELL_DN | 7.71e-03 | 5.55 | 1.44 | 1.00e+00 | 1.00e+00 | 4EMCN, VWF, ABCG2, TIE1 |
200 |
| GSE36392_TYPE_2_MYELOID_VS_NEUTROPHIL_IL25_TREATED_LUNG_UP | 7.71e-03 | 5.55 | 1.44 | 1.00e+00 | 1.00e+00 | 4TM4SF1, ROBO4, CALCRL, SPARC |
200 |
| GSE2405_0H_VS_3H_A_PHAGOCYTOPHILUM_STIM_NEUTROPHIL_UP | 7.71e-03 | 5.55 | 1.44 | 1.00e+00 | 1.00e+00 | 4AQP1, SPARCL1, HTRA1, IGFBP3 |
200 |
Top Ranked Transcription Factors for this Gene Expression Program:
| Gene Symbol | TF Rank | DNA Binding Domain | Motif Status | IUPAC PWM | GTEx | DepMap | Decartes |
|---|---|---|---|---|---|---|---|
| MECOM | 36 | Yes | Known motif | Monomer or homomultimer | In vivo/Misc source | Only known motifs are from Transfac or HocoMoco - origin is uncertain | None |
| NR5A2 | 43 | Yes | Known motif | Monomer or homomultimer | High-throughput in vitro | None | None |
| PREX2 | 45 | No | Unlikely to be sequence specific TF | Not a DNA binding protein | No motif | None | None |
| ERG | 47 | Yes | Known motif | Monomer or homomultimer | High-throughput in vitro | None | None |
| FZD4 | 52 | No | Unlikely to be sequence specific TF | Not a DNA binding protein | No motif | None | None |
| SOX7 | 55 | Yes | Known motif | Monomer or homomultimer | High-throughput in vitro | None | None |
| BCL6B | 58 | Yes | Known motif | Monomer or homomultimer | High-throughput in vitro | None | None |
| WWTR1 | 59 | No | Unlikely to be sequence specific TF | Not a DNA binding protein | No motif | None | Transcriptional co-activator that binds to TEADs (PMID: 19324877) and TBX5 (PMID: 16332960) |
| LMO2 | 68 | No | Unlikely to be sequence specific TF | Not a DNA binding protein | No motif | Only known motifs are from Transfac or HocoMoco - origin is uncertain | Protein binds to bHLH TFs, which then bind to DNA (PMID: 9707419). Both transfac motifs are suspect - the bHLH motif likely resulted from an indirect interaction. |
| ID1 | 72 | No | Unlikely to be sequence specific TF | Not a DNA binding protein | No motif | None | ID bHLH proteins lack the basic region and should not be able to bind DNA. The HT-SELEX motif for ID4 is likely by a co-precipitated protein or it is a contamination |
| PLXND1 | 85 | No | Unlikely to be sequence specific TF | Not a DNA binding protein | No motif | None | Protein is a semaphorin receptor that operates far upstream on the signaling cascade. |
| ELK3 | 87 | Yes | Known motif | Monomer or homomultimer | High-throughput in vitro | None | None |
| FOXF1 | 96 | Yes | Known motif | Monomer or homomultimer | In vivo/Misc source | Only known motifs are from Transfac or HocoMoco - origin is uncertain | None |
| NOTCH1 | 103 | No | Unlikely to be sequence specific TF | Not a DNA binding protein | No motif | None | A transmembrane protein that inhibits MEF2C activation (PMID: 10082551). NOTCH1 does not bind DNA in the structure, and is not required for DNA binding, since RBPJ is bound without it in (PDB:4J2X). |
| ID3 | 112 | No | Unlikely to be sequence specific TF | Not a DNA binding protein | No motif | None | ID bHLH proteins lack the basic region and should not be able to bind DNA. The HT-SELEX motif for ID4 is likely by a co-precipitated protein or it is a contamination |
| EPAS1 | 125 | Yes | Known motif | Monomer or homomultimer | In vivo/Misc source | Only known motifs are from Transfac or HocoMoco - origin is uncertain | None |
| RAPGEF3 | 153 | No | Unlikely to be sequence specific TF | Not a DNA binding protein | No motif | None | No DBD and no evidence its a TF - included only because it has an x in Vaquerizas 2009 |
| TAL1 | 164 | Yes | Known motif | Obligate heteromer | In vivo/Misc source | Only known motifs are from Transfac or HocoMoco - origin is uncertain | No motif yielded from PBMs or HT-SELEX. Binds DNA as heterodimer with TCF3 (PDB:2YPB and PDB:2YPA). |
| HOXB7 | 169 | Yes | Known motif | Monomer or homomultimer | High-throughput in vitro | None | None |
| HOXB8 | 171 | Yes | Known motif | Monomer or homomultimer | High-throughput in vitro | None | None |
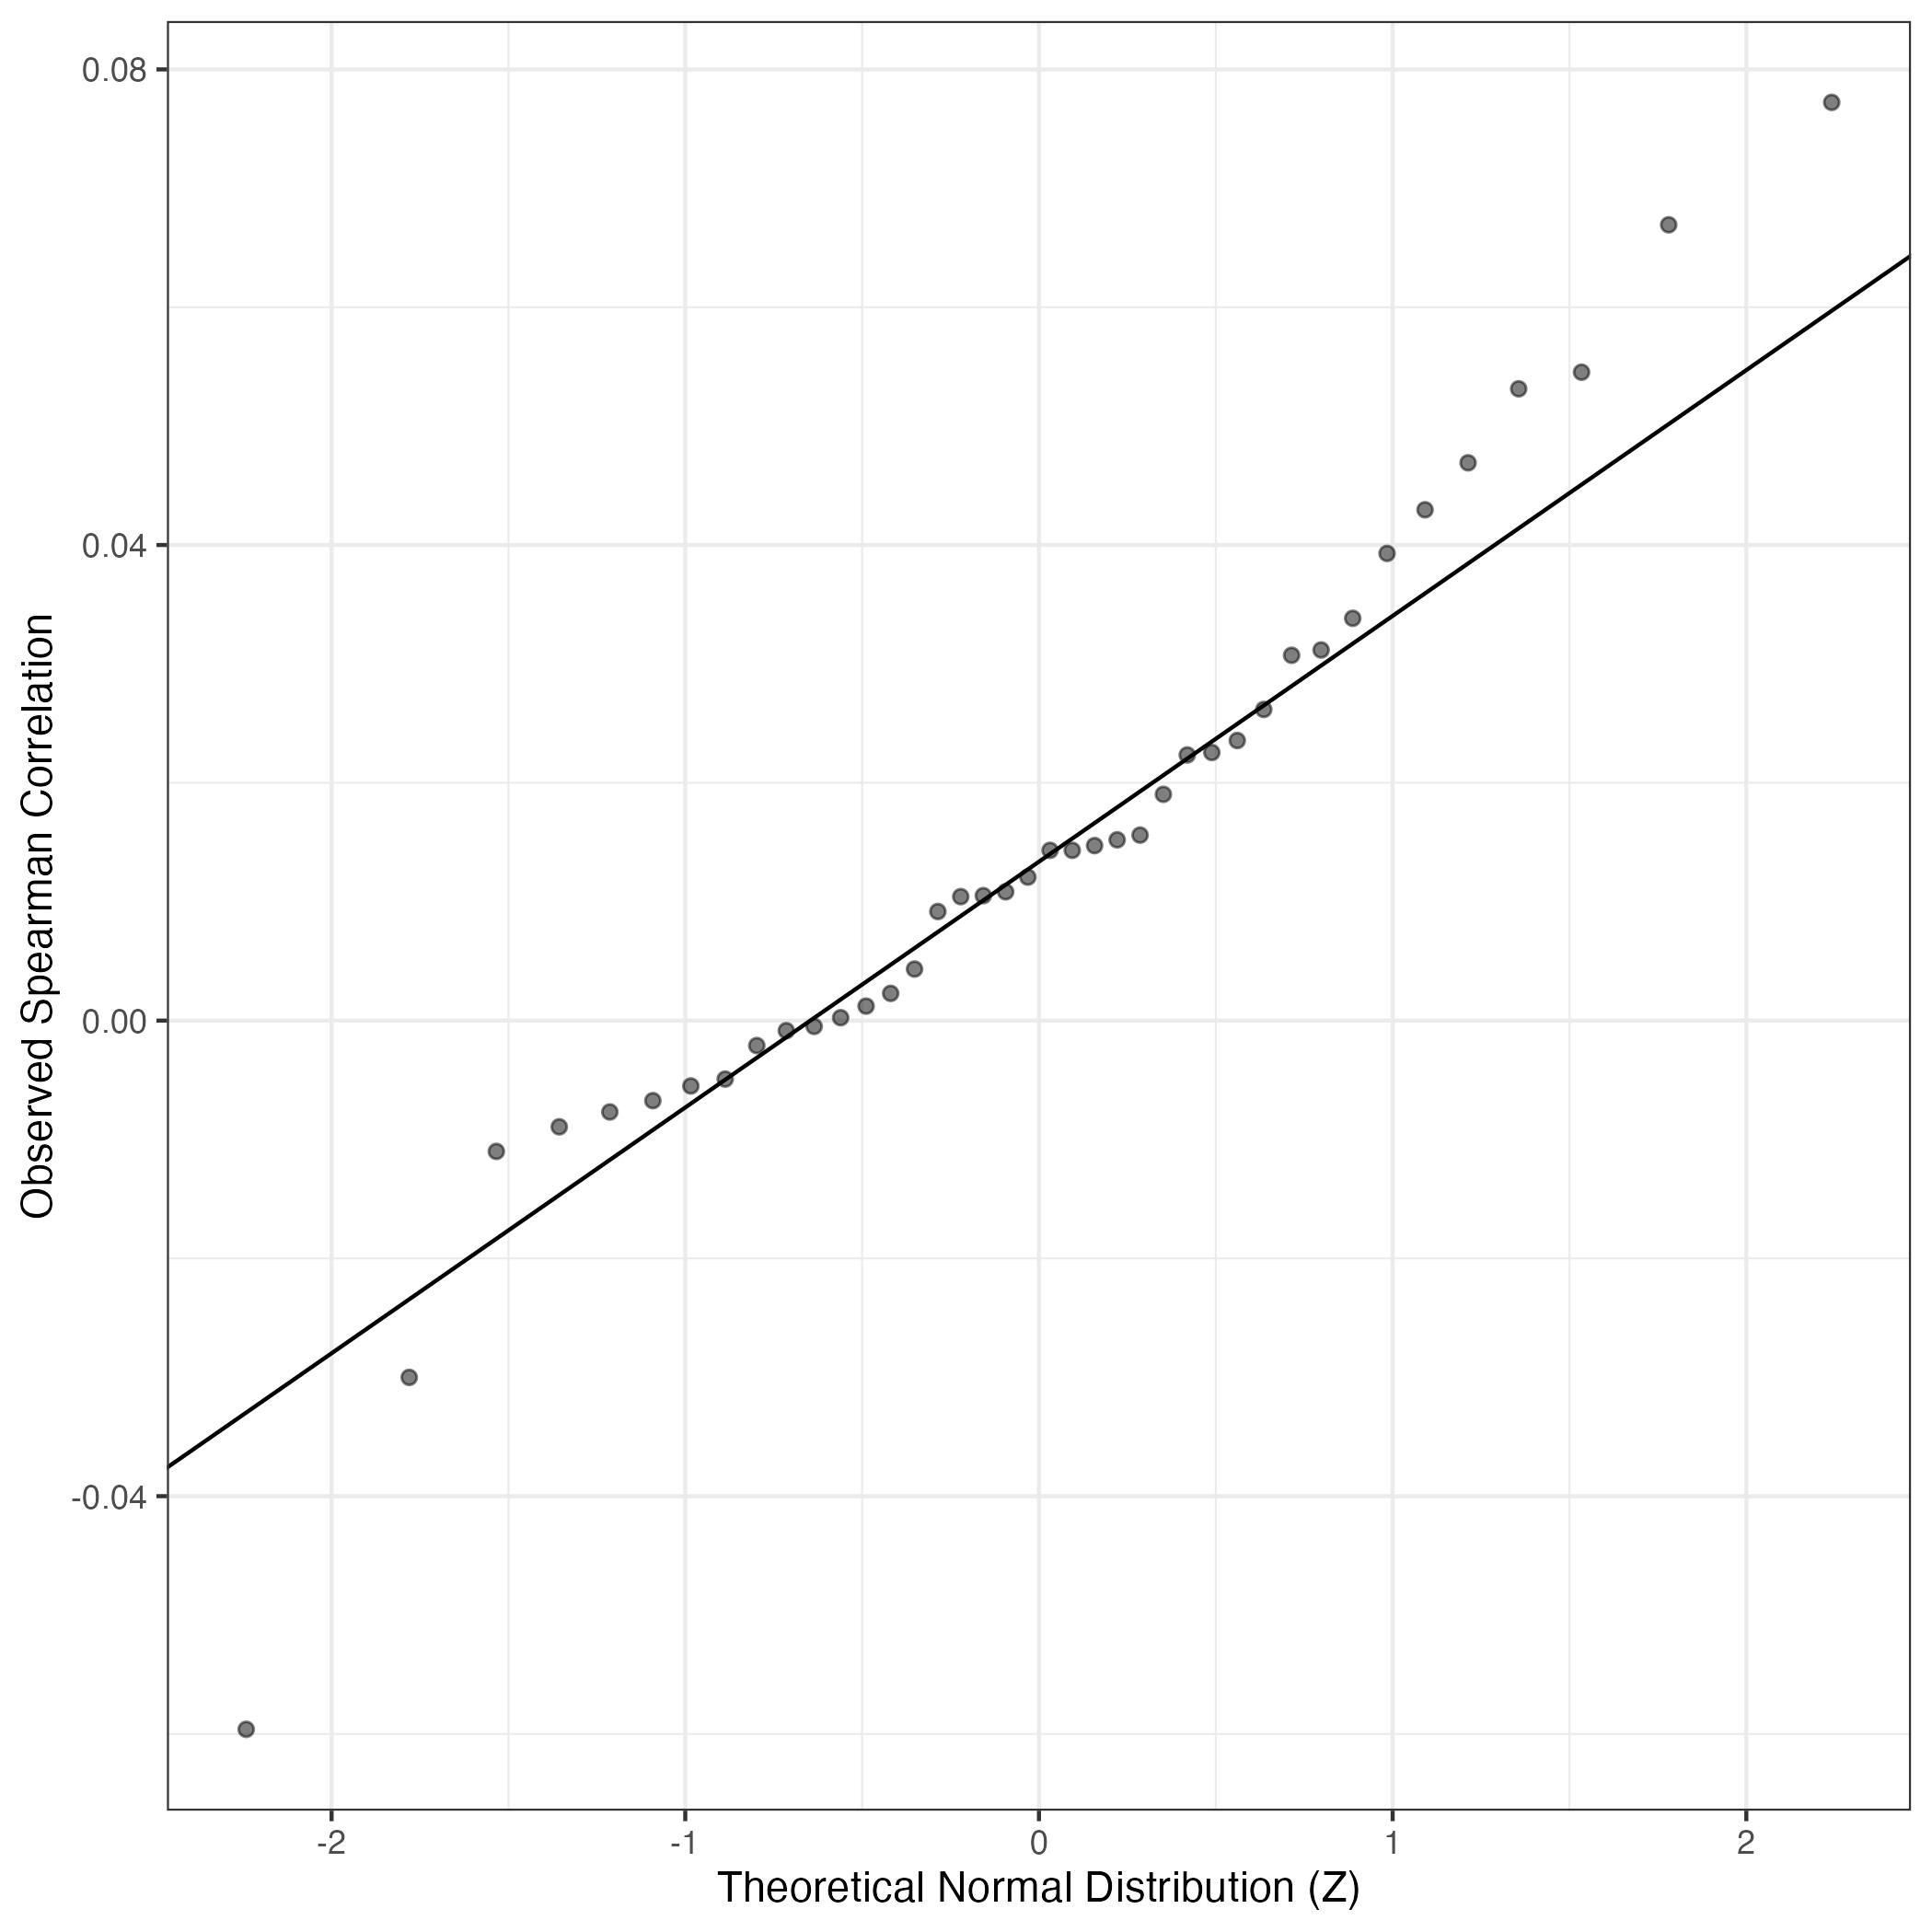
QQ Plot showing correlations with other GEPs in this dataset, calculated by Spearman correlation:
Interactive QQ-plot of gene loadings:
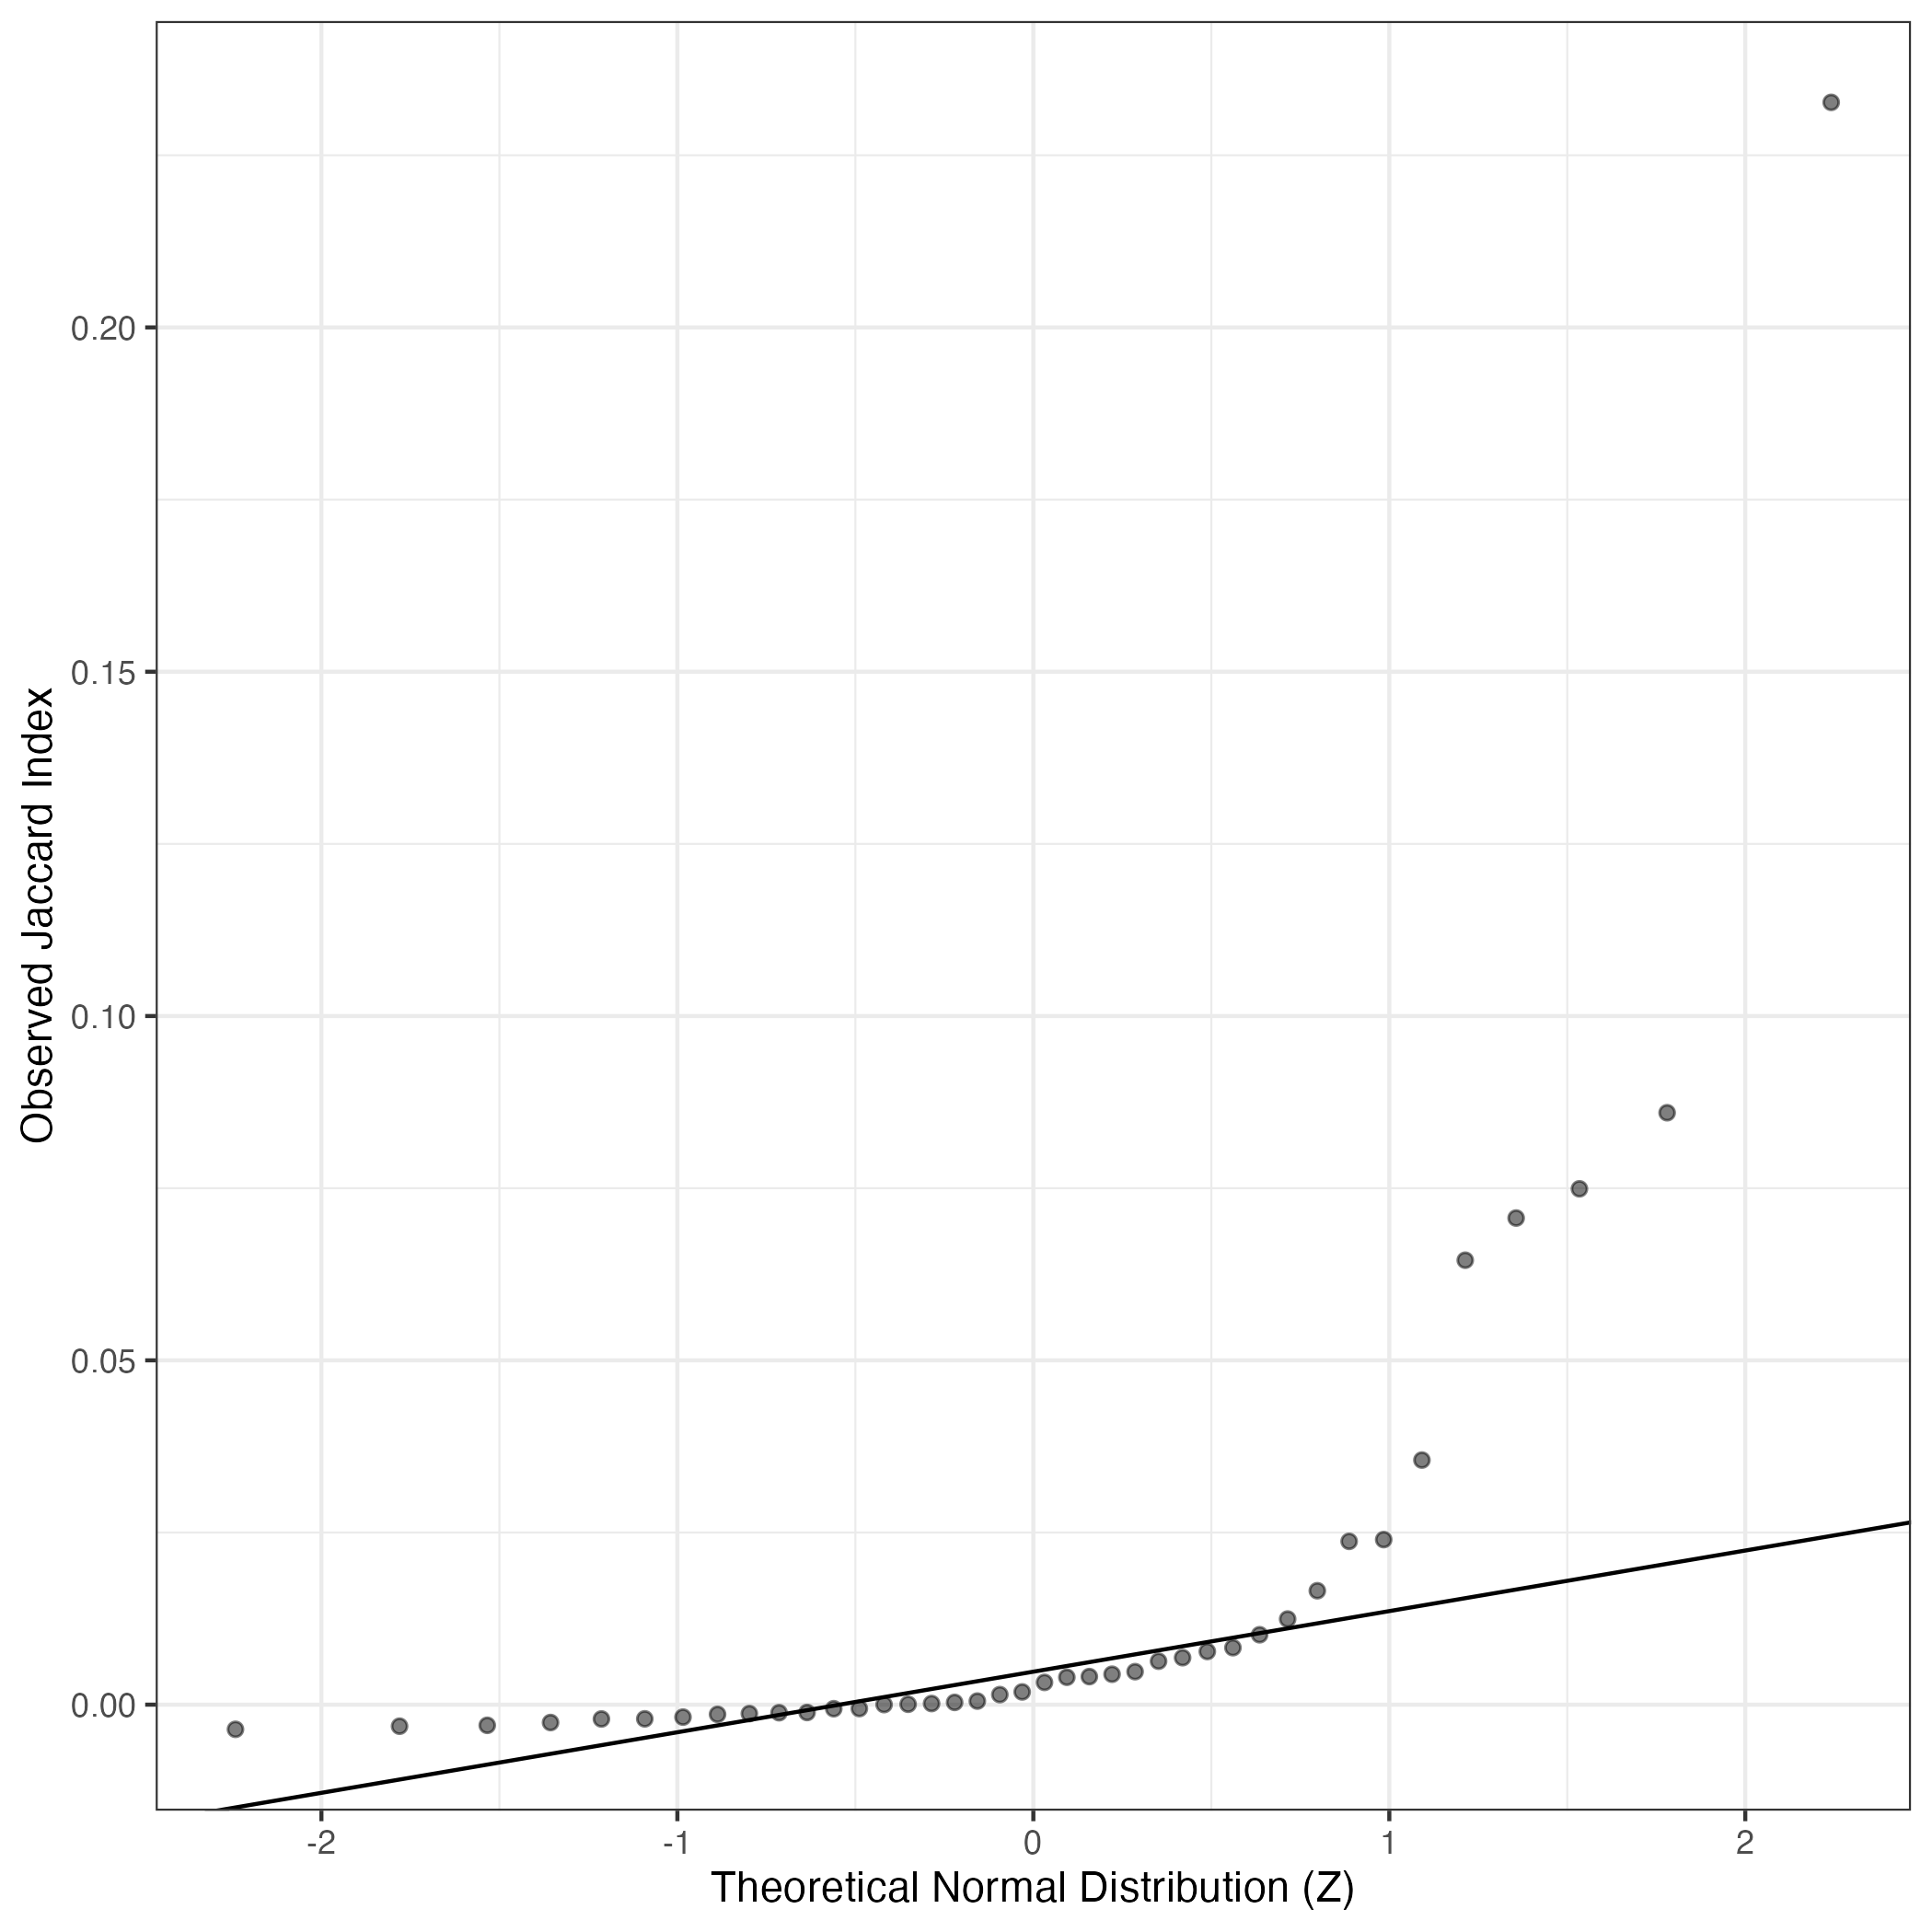
A similar QQ-plot as above, but only for instances where the H value is e.g. > 25, i.e. we are confident that the expression program is active above noise. Agreemenet between these binary vectors is tested using the Jaccard Index, with the P-values calculated by an exact test:
Interactive QQ-plot:
Singler cell type annotations for the top 50 cells on this program.
| Cell ID | Singler label | Singler Delta | Activity Score | Top Singler Raw Scores |
|---|---|---|---|---|
| T19_TTGCCGTCACGGCCAT.1 | Endothelial_cells:HUVEC:IFNg | 0.15 | 2015.86 | Raw ScoresEndothelial_cells:HUVEC:IFNg: 0.38, Endothelial_cells:lymphatic:TNFa_48h: 0.37, Endothelial_cells:lymphatic: 0.36, Endothelial_cells:HUVEC:Borrelia_burgdorferi: 0.36, Endothelial_cells:HUVEC:PR8-infected: 0.34, Endothelial_cells:blood_vessel: 0.34, Endothelial_cells:HUVEC: 0.34, Endothelial_cells:HUVEC:B._anthracis_LT: 0.34, Endothelial_cells:HUVEC:H5N1-infected: 0.34, Endothelial_cells:lymphatic:KSHV: 0.33 |
| T19_ATTTCTGTCGCATGAT.1 | Endothelial_cells:HUVEC:IFNg | 0.13 | 1692.81 | Raw ScoresEndothelial_cells:lymphatic:TNFa_48h: 0.33, Endothelial_cells:HUVEC:IFNg: 0.32, Endothelial_cells:lymphatic: 0.32, Endothelial_cells:HUVEC:PR8-infected: 0.31, Endothelial_cells:HUVEC:Borrelia_burgdorferi: 0.31, Endothelial_cells:blood_vessel: 0.31, Endothelial_cells:HUVEC: 0.31, Endothelial_cells:HUVEC:B._anthracis_LT: 0.3, Endothelial_cells:HUVEC:H5N1-infected: 0.3, Endothelial_cells:HUVEC:FPV-infected: 0.3 |
| T19_GACCTGGAGAGGGATA.1 | HSC_CD34+ | 0.06 | 1586.40 | Raw ScoresEndothelial_cells:lymphatic:TNFa_48h: 0.34, Endothelial_cells:HUVEC:IFNg: 0.33, Endothelial_cells:lymphatic: 0.33, Endothelial_cells:HUVEC:Borrelia_burgdorferi: 0.32, DC:monocyte-derived:AEC-conditioned: 0.32, DC:monocyte-derived:A._fumigatus_germ_tubes_6h: 0.32, DC:monocyte-derived:anti-DC-SIGN_2h: 0.32, Endothelial_cells:blood_vessel: 0.32, Endothelial_cells:lymphatic:KSHV: 0.31, DC:monocyte-derived:mature: 0.31 |
| T19_CTGCGGAAGCCAACAG.1 | Endothelial_cells:lymphatic:TNFa_48h | 0.14 | 1582.50 | Raw ScoresEndothelial_cells:lymphatic:TNFa_48h: 0.33, Endothelial_cells:lymphatic: 0.32, Endothelial_cells:HUVEC:IFNg: 0.32, Endothelial_cells:blood_vessel: 0.3, Endothelial_cells:HUVEC:Borrelia_burgdorferi: 0.3, Endothelial_cells:HUVEC: 0.3, Endothelial_cells:HUVEC:B._anthracis_LT: 0.29, Endothelial_cells:HUVEC:PR8-infected: 0.29, Endothelial_cells:lymphatic:KSHV: 0.29, Endothelial_cells:HUVEC:H5N1-infected: 0.29 |
| T19_GATCGTACACATAACC.1 | Endothelial_cells:HUVEC:Borrelia_burgdorferi | 0.11 | 1390.87 | Raw ScoresEndothelial_cells:HUVEC:IFNg: 0.32, Endothelial_cells:lymphatic:TNFa_48h: 0.31, Endothelial_cells:lymphatic: 0.3, Endothelial_cells:HUVEC:Borrelia_burgdorferi: 0.3, Endothelial_cells:blood_vessel: 0.29, Endothelial_cells:lymphatic:KSHV: 0.29, Endothelial_cells:HUVEC:PR8-infected: 0.29, Endothelial_cells:HUVEC:B._anthracis_LT: 0.29, Endothelial_cells:HUVEC: 0.29, Endothelial_cells:HUVEC:H5N1-infected: 0.28 |
| T19_GTGGGTCTCCGAACGC.1 | DC:monocyte-derived:LPS | 0.11 | 1240.79 | Raw ScoresDC:monocyte-derived:AEC-conditioned: 0.36, DC:monocyte-derived:anti-DC-SIGN_2h: 0.35, Macrophage:monocyte-derived:IFNa: 0.35, DC:monocyte-derived:LPS: 0.35, Monocyte:anti-FcgRIIB: 0.35, Macrophage:monocyte-derived:M-CSF/IFNg: 0.35, Macrophage:monocyte-derived:S._aureus: 0.35, Macrophage:monocyte-derived:M-CSF/IFNg/Pam3Cys: 0.35, DC:monocyte-derived:Poly(IC): 0.35, DC:monocyte-derived:Galectin-1: 0.35 |
| T19_GAACCTAAGGTGATAT.1 | Endothelial_cells:lymphatic:TNFa_48h | 0.14 | 1113.85 | Raw ScoresEndothelial_cells:lymphatic:TNFa_48h: 0.35, Endothelial_cells:HUVEC:IFNg: 0.35, Endothelial_cells:lymphatic: 0.35, Endothelial_cells:HUVEC:Borrelia_burgdorferi: 0.33, Endothelial_cells:blood_vessel: 0.33, Endothelial_cells:HUVEC:B._anthracis_LT: 0.33, Endothelial_cells:HUVEC:PR8-infected: 0.33, Endothelial_cells:HUVEC:FPV-infected: 0.32, Endothelial_cells:HUVEC: 0.32, Endothelial_cells:HUVEC:H5N1-infected: 0.32 |
| T19_CCTTTCTGTAGAAGGA.1 | Endothelial_cells:lymphatic:TNFa_48h | 0.14 | 1071.49 | Raw ScoresEndothelial_cells:lymphatic:TNFa_48h: 0.4, Endothelial_cells:lymphatic: 0.4, Endothelial_cells:blood_vessel: 0.38, Endothelial_cells:HUVEC:IFNg: 0.38, Endothelial_cells:HUVEC:B._anthracis_LT: 0.37, Endothelial_cells:HUVEC:PR8-infected: 0.37, Endothelial_cells:lymphatic:KSHV: 0.37, Endothelial_cells:HUVEC: 0.37, Endothelial_cells:HUVEC:Borrelia_burgdorferi: 0.37, Endothelial_cells:HUVEC:H5N1-infected: 0.36 |
| T19_GTTACAGCAATCCAAC.1 | Endothelial_cells:lymphatic:TNFa_48h | 0.14 | 891.02 | Raw ScoresEndothelial_cells:lymphatic:TNFa_48h: 0.38, Endothelial_cells:lymphatic: 0.37, Endothelial_cells:lymphatic:KSHV: 0.36, Endothelial_cells:blood_vessel: 0.36, Endothelial_cells:HUVEC:PR8-infected: 0.34, Endothelial_cells:HUVEC:B._anthracis_LT: 0.34, Endothelial_cells:HUVEC:IFNg: 0.34, Endothelial_cells:HUVEC:IL-1b: 0.34, Endothelial_cells:HUVEC:FPV-infected: 0.34, Endothelial_cells:HUVEC: 0.34 |
| T19_GAAACTCGTCAACTGT.1 | Endothelial_cells:blood_vessel | 0.10 | 809.35 | Raw ScoresEndothelial_cells:lymphatic:TNFa_48h: 0.33, Endothelial_cells:lymphatic: 0.32, Endothelial_cells:blood_vessel: 0.32, Endothelial_cells:HUVEC:IFNg: 0.31, Endothelial_cells:HUVEC:FPV-infected: 0.31, Endothelial_cells:lymphatic:KSHV: 0.31, Endothelial_cells:HUVEC:B._anthracis_LT: 0.31, Endothelial_cells:HUVEC:PR8-infected: 0.31, Endothelial_cells:HUVEC: 0.31, Endothelial_cells:HUVEC:Borrelia_burgdorferi: 0.3 |
| T10_GGATTACGTTCGGCAC.1 | Endothelial_cells:lymphatic:TNFa_48h | 0.16 | 791.95 | Raw ScoresEndothelial_cells:lymphatic:TNFa_48h: 0.39, Endothelial_cells:lymphatic: 0.38, Endothelial_cells:HUVEC:B._anthracis_LT: 0.37, Endothelial_cells:blood_vessel: 0.36, Endothelial_cells:HUVEC:PR8-infected: 0.36, Endothelial_cells:HUVEC: 0.36, Endothelial_cells:HUVEC:H5N1-infected: 0.35, Endothelial_cells:lymphatic:KSHV: 0.35, Endothelial_cells:HUVEC:IFNg: 0.35, Endothelial_cells:HUVEC:Serum_Amyloid_A: 0.35 |
| T19_TGAAAGATCTAACTCT.1 | Endothelial_cells:lymphatic:TNFa_48h | 0.11 | 663.72 | Raw ScoresEndothelial_cells:lymphatic:TNFa_48h: 0.36, Endothelial_cells:lymphatic: 0.35, Endothelial_cells:blood_vessel: 0.34, Endothelial_cells:HUVEC:IFNg: 0.34, Endothelial_cells:lymphatic:KSHV: 0.34, Endothelial_cells:HUVEC:PR8-infected: 0.33, Endothelial_cells:HUVEC:FPV-infected: 0.33, Endothelial_cells:HUVEC:B._anthracis_LT: 0.33, Endothelial_cells:HUVEC:Borrelia_burgdorferi: 0.33, Endothelial_cells:HUVEC:H5N1-infected: 0.32 |
| T19_CTACGTCGTCCATGAT.1 | Endothelial_cells:HUVEC:IFNg | 0.12 | 641.83 | Raw ScoresEndothelial_cells:lymphatic:TNFa_48h: 0.37, Endothelial_cells:HUVEC:IFNg: 0.36, Endothelial_cells:lymphatic: 0.36, Endothelial_cells:HUVEC:PR8-infected: 0.35, Endothelial_cells:HUVEC:Borrelia_burgdorferi: 0.35, Endothelial_cells:blood_vessel: 0.34, Endothelial_cells:HUVEC:B._anthracis_LT: 0.34, Endothelial_cells:HUVEC:H5N1-infected: 0.34, Endothelial_cells:HUVEC: 0.34, Endothelial_cells:lymphatic:KSHV: 0.34 |
| T10_TCACAAGGTGTGCCTG.1 | Endothelial_cells:lymphatic:TNFa_48h | 0.13 | 628.83 | Raw ScoresEndothelial_cells:lymphatic:TNFa_48h: 0.35, Endothelial_cells:lymphatic: 0.34, Endothelial_cells:HUVEC:IFNg: 0.33, Endothelial_cells:lymphatic:KSHV: 0.33, Endothelial_cells:blood_vessel: 0.33, Endothelial_cells:HUVEC: 0.33, Endothelial_cells:HUVEC:VEGF: 0.33, Endothelial_cells:HUVEC:Borrelia_burgdorferi: 0.32, Endothelial_cells:HUVEC:B._anthracis_LT: 0.32, Endothelial_cells:HUVEC:IL-1b: 0.32 |
| T19_CGCTATCTCACTCCTG.1 | Neurons:Schwann_cell | 0.14 | 625.02 | Raw ScoresiPS_cells:adipose_stem_cells: 0.36, Tissue_stem_cells:BM_MSC:BMP2: 0.36, Tissue_stem_cells:BM_MSC:TGFb3: 0.36, Tissue_stem_cells:BM_MSC: 0.36, Osteoblasts: 0.36, Fibroblasts:breast: 0.35, Tissue_stem_cells:BM_MSC:osteogenic: 0.35, Smooth_muscle_cells:bronchial: 0.35, Tissue_stem_cells:iliac_MSC: 0.35, Chondrocytes:MSC-derived: 0.35 |
| T19_TAAGTGCGTAGCTGCC.1 | Endothelial_cells:lymphatic:TNFa_48h | 0.15 | 608.94 | Raw ScoresEndothelial_cells:lymphatic:TNFa_48h: 0.37, Endothelial_cells:lymphatic: 0.36, Endothelial_cells:HUVEC:PR8-infected: 0.35, Endothelial_cells:HUVEC:IFNg: 0.35, Endothelial_cells:blood_vessel: 0.35, Endothelial_cells:HUVEC:H5N1-infected: 0.35, Endothelial_cells:HUVEC:B._anthracis_LT: 0.35, Endothelial_cells:lymphatic:KSHV: 0.35, Endothelial_cells:HUVEC:Borrelia_burgdorferi: 0.34, Endothelial_cells:HUVEC: 0.34 |
| T19_TTCTTAGAGCAGACTG.1 | Endothelial_cells:lymphatic:TNFa_48h | 0.12 | 595.93 | Raw ScoresEndothelial_cells:lymphatic:TNFa_48h: 0.38, Endothelial_cells:lymphatic: 0.38, Endothelial_cells:blood_vessel: 0.37, Endothelial_cells:lymphatic:KSHV: 0.37, Endothelial_cells:HUVEC:IFNg: 0.36, Endothelial_cells:HUVEC:PR8-infected: 0.36, Endothelial_cells:HUVEC: 0.36, Endothelial_cells:HUVEC:B._anthracis_LT: 0.36, Endothelial_cells:HUVEC:FPV-infected: 0.35, Endothelial_cells:HUVEC:H5N1-infected: 0.35 |
| T19_CGGAGTCTCAGCATGT.1 | Endothelial_cells:lymphatic:TNFa_48h | 0.14 | 536.69 | Raw ScoresEndothelial_cells:lymphatic:TNFa_48h: 0.36, Endothelial_cells:lymphatic: 0.35, Endothelial_cells:HUVEC:IFNg: 0.35, Endothelial_cells:blood_vessel: 0.34, Endothelial_cells:HUVEC:B._anthracis_LT: 0.34, Endothelial_cells:HUVEC:PR8-infected: 0.34, Endothelial_cells:HUVEC:FPV-infected: 0.34, Endothelial_cells:HUVEC:Borrelia_burgdorferi: 0.34, Endothelial_cells:HUVEC:H5N1-infected: 0.33, Endothelial_cells:lymphatic:KSHV: 0.33 |
| T19_AGGGTGAAGATAGTCA.1 | Endothelial_cells:lymphatic:TNFa_48h | 0.12 | 513.45 | Raw ScoresEndothelial_cells:lymphatic:TNFa_48h: 0.35, Endothelial_cells:lymphatic: 0.35, Endothelial_cells:HUVEC:PR8-infected: 0.33, Endothelial_cells:HUVEC:IFNg: 0.33, Endothelial_cells:blood_vessel: 0.33, Endothelial_cells:HUVEC:B._anthracis_LT: 0.33, Endothelial_cells:HUVEC:Borrelia_burgdorferi: 0.33, Endothelial_cells:lymphatic:KSHV: 0.32, Endothelial_cells:HUVEC:FPV-infected: 0.32, Endothelial_cells:HUVEC: 0.32 |
| T19_TCAGGATTCTGGAGCC.1 | Endothelial_cells:HUVEC:Borrelia_burgdorferi | 0.07 | 498.58 | Raw ScoresEndothelial_cells:HUVEC:IFNg: 0.29, Endothelial_cells:HUVEC:Borrelia_burgdorferi: 0.28, Endothelial_cells:lymphatic:TNFa_48h: 0.27, Endothelial_cells:HUVEC:PR8-infected: 0.27, Endothelial_cells:HUVEC:H5N1-infected: 0.27, Endothelial_cells:HUVEC:B._anthracis_LT: 0.26, Endothelial_cells:lymphatic: 0.26, Endothelial_cells:blood_vessel: 0.26, Endothelial_cells:HUVEC:FPV-infected: 0.26, Endothelial_cells:HUVEC: 0.25 |
| T19_TGACTTTAGGAGTTTA.1 | Endothelial_cells:lymphatic:TNFa_48h | 0.12 | 491.55 | Raw ScoresEndothelial_cells:lymphatic:TNFa_48h: 0.35, Endothelial_cells:lymphatic: 0.34, Endothelial_cells:blood_vessel: 0.33, Endothelial_cells:lymphatic:KSHV: 0.33, Endothelial_cells:HUVEC:IFNg: 0.32, Endothelial_cells:HUVEC:PR8-infected: 0.32, Endothelial_cells:HUVEC:FPV-infected: 0.32, Endothelial_cells:HUVEC:B._anthracis_LT: 0.32, Endothelial_cells:HUVEC: 0.32, Endothelial_cells:HUVEC:H5N1-infected: 0.32 |
| T230_AGGTTGTCACCTCTGT-1 | Endothelial_cells:HUVEC:IFNg | 0.20 | 476.60 | Raw ScoresEndothelial_cells:HUVEC:IFNg: 0.44, Endothelial_cells:lymphatic:TNFa_48h: 0.41, Endothelial_cells:HUVEC:PR8-infected: 0.41, Endothelial_cells:HUVEC:B._anthracis_LT: 0.41, Endothelial_cells:lymphatic: 0.4, Endothelial_cells:HUVEC:Borrelia_burgdorferi: 0.4, Endothelial_cells:HUVEC:H5N1-infected: 0.4, Endothelial_cells:HUVEC:FPV-infected: 0.39, Endothelial_cells:blood_vessel: 0.39, Endothelial_cells:HUVEC: 0.39 |
| T200_AGACAGGTCACACCGG-1 | Endothelial_cells:blood_vessel | 0.16 | 466.69 | Raw ScoresEndothelial_cells:lymphatic:TNFa_48h: 0.43, Endothelial_cells:lymphatic: 0.42, Endothelial_cells:lymphatic:KSHV: 0.42, Endothelial_cells:blood_vessel: 0.41, Endothelial_cells:HUVEC:PR8-infected: 0.4, Endothelial_cells:HUVEC:B._anthracis_LT: 0.4, Endothelial_cells:HUVEC:IFNg: 0.39, Endothelial_cells:HUVEC:FPV-infected: 0.39, Endothelial_cells:HUVEC:H5N1-infected: 0.39, Endothelial_cells:HUVEC:Serum_Amyloid_A: 0.38 |
| T19_GATGAAACAATGTTGC.1 | Endothelial_cells:lymphatic:TNFa_48h | 0.09 | 466.20 | Raw ScoresEndothelial_cells:lymphatic:TNFa_48h: 0.33, Endothelial_cells:lymphatic: 0.33, Endothelial_cells:HUVEC:IFNg: 0.32, Endothelial_cells:blood_vessel: 0.32, Endothelial_cells:HUVEC:Borrelia_burgdorferi: 0.31, Endothelial_cells:HUVEC: 0.31, Endothelial_cells:lymphatic:KSHV: 0.31, Endothelial_cells:HUVEC:IL-1b: 0.31, Endothelial_cells:HUVEC:PR8-infected: 0.31, Endothelial_cells:HUVEC:B._anthracis_LT: 0.3 |
| T69_GTAACGTTCGTCCGTT.1 | Endothelial_cells:HUVEC:Borrelia_burgdorferi | 0.11 | 452.31 | Raw ScoresEndothelial_cells:HUVEC:IFNg: 0.35, Endothelial_cells:HUVEC:Borrelia_burgdorferi: 0.34, Endothelial_cells:lymphatic:TNFa_48h: 0.34, Endothelial_cells:HUVEC:VEGF: 0.34, Endothelial_cells:lymphatic: 0.34, Endothelial_cells:HUVEC:B._anthracis_LT: 0.33, Endothelial_cells:HUVEC: 0.33, Endothelial_cells:HUVEC:PR8-infected: 0.33, Endothelial_cells:HUVEC:H5N1-infected: 0.33, Endothelial_cells:HUVEC:FPV-infected: 0.33 |
| T19_GAGGTGAAGGACCACA.1 | Endothelial_cells:lymphatic:TNFa_48h | 0.12 | 447.72 | Raw ScoresEndothelial_cells:lymphatic:TNFa_48h: 0.33, Endothelial_cells:HUVEC:IFNg: 0.32, Endothelial_cells:lymphatic: 0.32, Endothelial_cells:blood_vessel: 0.31, Endothelial_cells:HUVEC:PR8-infected: 0.31, Endothelial_cells:HUVEC:Borrelia_burgdorferi: 0.31, Endothelial_cells:HUVEC:B._anthracis_LT: 0.3, Endothelial_cells:HUVEC:H5N1-infected: 0.3, Endothelial_cells:HUVEC:FPV-infected: 0.3, Endothelial_cells:lymphatic:KSHV: 0.3 |
| T19_CTACGTCAGGCGACAT.1 | Tissue_stem_cells:iliac_MSC | 0.11 | 403.87 | Raw ScoresTissue_stem_cells:iliac_MSC: 0.33, Osteoblasts: 0.33, Fibroblasts:breast: 0.33, iPS_cells:adipose_stem_cells: 0.33, Tissue_stem_cells:BM_MSC:BMP2: 0.33, Tissue_stem_cells:BM_MSC:TGFb3: 0.32, Smooth_muscle_cells:bronchial: 0.32, Smooth_muscle_cells:bronchial:vit_D: 0.32, Chondrocytes:MSC-derived: 0.32, Smooth_muscle_cells:vascular: 0.32 |
| T214_TCACTCGCAAATTAGG-1 | Endothelial_cells:blood_vessel | 0.15 | 393.13 | Raw ScoresEndothelial_cells:lymphatic:TNFa_48h: 0.43, Endothelial_cells:lymphatic: 0.41, Endothelial_cells:blood_vessel: 0.41, Endothelial_cells:lymphatic:KSHV: 0.41, Endothelial_cells:HUVEC:Serum_Amyloid_A: 0.4, Endothelial_cells:HUVEC:B._anthracis_LT: 0.4, Endothelial_cells:HUVEC:IL-1b: 0.4, Endothelial_cells:HUVEC:PR8-infected: 0.39, Endothelial_cells:HUVEC: 0.39, Endothelial_cells:HUVEC:H5N1-infected: 0.39 |
| T19_CGCGTTTTCCTCATTA.1 | Endothelial_cells:lymphatic:TNFa_48h | 0.09 | 384.24 | Raw ScoresEndothelial_cells:lymphatic:TNFa_48h: 0.34, Endothelial_cells:lymphatic: 0.33, Endothelial_cells:blood_vessel: 0.33, Endothelial_cells:lymphatic:KSHV: 0.33, Endothelial_cells:HUVEC:IFNg: 0.33, Endothelial_cells:HUVEC:Borrelia_burgdorferi: 0.32, Endothelial_cells:HUVEC:PR8-infected: 0.32, Endothelial_cells:HUVEC: 0.32, Endothelial_cells:HUVEC:B._anthracis_LT: 0.32, Endothelial_cells:HUVEC:IL-1b: 0.31 |
| T19_CATCCACAGTAACCCT.1 | Endothelial_cells:lymphatic:TNFa_48h | 0.12 | 375.83 | Raw ScoresEndothelial_cells:lymphatic:TNFa_48h: 0.35, Endothelial_cells:lymphatic: 0.34, Endothelial_cells:blood_vessel: 0.34, Endothelial_cells:HUVEC:IFNg: 0.34, Endothelial_cells:lymphatic:KSHV: 0.33, Endothelial_cells:HUVEC:B._anthracis_LT: 0.33, Endothelial_cells:HUVEC:PR8-infected: 0.33, Endothelial_cells:HUVEC:H5N1-infected: 0.33, Endothelial_cells:HUVEC: 0.33, Endothelial_cells:HUVEC:FPV-infected: 0.32 |
| T19_GCATACAAGATGTTAG.1 | Neurons:Schwann_cell | 0.09 | 364.58 | Raw ScoresiPS_cells:adipose_stem_cells: 0.32, Tissue_stem_cells:BM_MSC:BMP2: 0.32, Neurons:Schwann_cell: 0.32, Smooth_muscle_cells:bronchial: 0.32, Fibroblasts:breast: 0.32, Endothelial_cells:HUVEC:IFNg: 0.32, Osteoblasts: 0.32, Tissue_stem_cells:iliac_MSC: 0.32, Smooth_muscle_cells:bronchial:vit_D: 0.32, Endothelial_cells:lymphatic:TNFa_48h: 0.32 |
| T19_ACTGAACAGACCTAGG.1 | Smooth_muscle_cells:bronchial | 0.11 | 353.25 | Raw ScoresiPS_cells:adipose_stem_cells: 0.33, Fibroblasts:breast: 0.33, Smooth_muscle_cells:bronchial: 0.32, Tissue_stem_cells:iliac_MSC: 0.32, Tissue_stem_cells:BM_MSC:BMP2: 0.32, Smooth_muscle_cells:vascular: 0.32, Endothelial_cells:HUVEC:IFNg: 0.32, Osteoblasts: 0.32, Smooth_muscle_cells:bronchial:vit_D: 0.32, Fibroblasts:foreskin: 0.32 |
| T200_GTGTCCTGTTAGCTAC-1 | Endothelial_cells:lymphatic:TNFa_48h | 0.20 | 327.93 | Raw ScoresEndothelial_cells:lymphatic:TNFa_48h: 0.44, Endothelial_cells:lymphatic: 0.43, Endothelial_cells:HUVEC:IFNg: 0.42, Endothelial_cells:HUVEC:PR8-infected: 0.41, Endothelial_cells:blood_vessel: 0.4, Endothelial_cells:HUVEC:B._anthracis_LT: 0.4, Endothelial_cells:HUVEC:VEGF: 0.4, Endothelial_cells:HUVEC:Serum_Amyloid_A: 0.4, Endothelial_cells:HUVEC: 0.4, Endothelial_cells:HUVEC:H5N1-infected: 0.4 |
| T19_AGAGTGGCATTTGCCC.1 | Endothelial_cells:lymphatic:TNFa_48h | 0.11 | 326.75 | Raw ScoresEndothelial_cells:lymphatic:TNFa_48h: 0.32, Endothelial_cells:lymphatic: 0.32, Endothelial_cells:blood_vessel: 0.31, Endothelial_cells:lymphatic:KSHV: 0.3, Endothelial_cells:HUVEC:IFNg: 0.3, Endothelial_cells:HUVEC:PR8-infected: 0.29, Endothelial_cells:HUVEC:B._anthracis_LT: 0.29, Endothelial_cells:HUVEC:Borrelia_burgdorferi: 0.29, Endothelial_cells:HUVEC:FPV-infected: 0.29, Endothelial_cells:HUVEC: 0.29 |
| T19_ACCAGTAAGGGTCGAT.1 | Endothelial_cells:HUVEC:IFNg | 0.05 | 309.00 | Raw ScoresEndothelial_cells:HUVEC:IFNg: 0.27, Endothelial_cells:lymphatic:TNFa_48h: 0.27, Endothelial_cells:blood_vessel: 0.26, NK_cell: 0.26, Endothelial_cells:lymphatic: 0.26, DC:monocyte-derived:AEC-conditioned: 0.26, Endothelial_cells:HUVEC:PR8-infected: 0.26, Endothelial_cells:HUVEC:Borrelia_burgdorferi: 0.26, DC:monocyte-derived:Poly(IC): 0.26, Endothelial_cells:HUVEC:B._anthracis_LT: 0.26 |
| T200_ATTACCTCACTACACA-1 | Endothelial_cells:lymphatic:TNFa_48h | 0.19 | 306.36 | Raw ScoresEndothelial_cells:lymphatic:TNFa_48h: 0.44, Endothelial_cells:lymphatic: 0.42, Endothelial_cells:blood_vessel: 0.42, Endothelial_cells:HUVEC:PR8-infected: 0.42, Endothelial_cells:lymphatic:KSHV: 0.42, Endothelial_cells:HUVEC:IFNg: 0.42, Endothelial_cells:HUVEC:B._anthracis_LT: 0.41, Endothelial_cells:HUVEC:H5N1-infected: 0.41, Endothelial_cells:HUVEC:FPV-infected: 0.41, Endothelial_cells:HUVEC:Serum_Amyloid_A: 0.4 |
| T19_AAGGTTCAGCTCCTCT.1 | DC:monocyte-derived:mature | 0.03 | 277.08 | Raw ScoresiPS_cells:adipose_stem_cells: 0.3, Endothelial_cells:HUVEC:IFNg: 0.3, Smooth_muscle_cells:bronchial: 0.3, Tissue_stem_cells:iliac_MSC: 0.3, Tissue_stem_cells:BM_MSC:BMP2: 0.3, Smooth_muscle_cells:bronchial:vit_D: 0.3, Tissue_stem_cells:BM_MSC:TGFb3: 0.29, Fibroblasts:foreskin: 0.29, Fibroblasts:breast: 0.29, Osteoblasts: 0.29 |
| T19_GTTACAGGTACACCGC.1 | Tissue_stem_cells:BM_MSC:TGFb3 | 0.11 | 268.75 | Raw ScoresTissue_stem_cells:BM_MSC:BMP2: 0.35, iPS_cells:adipose_stem_cells: 0.35, Tissue_stem_cells:BM_MSC:TGFb3: 0.34, Fibroblasts:breast: 0.34, Osteoblasts: 0.34, Tissue_stem_cells:iliac_MSC: 0.34, iPS_cells:CRL2097_foreskin: 0.33, Tissue_stem_cells:BM_MSC: 0.33, Chondrocytes:MSC-derived: 0.33, Smooth_muscle_cells:bronchial: 0.33 |
| T19_GGACGTCCACGGATAG.1 | Endothelial_cells:lymphatic:TNFa_48h | 0.14 | 257.73 | Raw ScoresEndothelial_cells:lymphatic:TNFa_48h: 0.38, Endothelial_cells:lymphatic: 0.37, Endothelial_cells:blood_vessel: 0.34, Endothelial_cells:lymphatic:KSHV: 0.34, Endothelial_cells:HUVEC:PR8-infected: 0.34, Endothelial_cells:HUVEC:FPV-infected: 0.34, Endothelial_cells:HUVEC:IFNg: 0.33, Endothelial_cells:HUVEC:B._anthracis_LT: 0.33, Endothelial_cells:HUVEC:Borrelia_burgdorferi: 0.33, Endothelial_cells:HUVEC:H5N1-infected: 0.33 |
| T69_GTAACTGGTCAACTGT.1 | Neurons:adrenal_medulla_cell_line | 0.08 | 257.56 | Raw ScoresNeurons:adrenal_medulla_cell_line: 0.33, Neuroepithelial_cell:ESC-derived: 0.31, Endothelial_cells:lymphatic:TNFa_48h: 0.31, Astrocyte:Embryonic_stem_cell-derived: 0.31, Endothelial_cells:HUVEC:VEGF: 0.31, Endothelial_cells:HUVEC:IL-1b: 0.31, Endothelial_cells:HUVEC:FPV-infected: 0.31, Endothelial_cells:HUVEC: 0.31, Endothelial_cells:HUVEC:H5N1-infected: 0.31, Endothelial_cells:HUVEC:PR8-infected: 0.3 |
| T69_AGCCTAAAGGAATCGC.1 | Endothelial_cells:HUVEC:Borrelia_burgdorferi | 0.13 | 241.85 | Raw ScoresEndothelial_cells:HUVEC:H5N1-infected: 0.35, Endothelial_cells:HUVEC:IFNg: 0.35, Endothelial_cells:HUVEC:PR8-infected: 0.35, Endothelial_cells:HUVEC:FPV-infected: 0.35, Endothelial_cells:HUVEC: 0.35, Endothelial_cells:HUVEC:Borrelia_burgdorferi: 0.35, Endothelial_cells:lymphatic:TNFa_48h: 0.34, Endothelial_cells:HUVEC:VEGF: 0.34, Endothelial_cells:HUVEC:B._anthracis_LT: 0.34, Endothelial_cells:lymphatic: 0.34 |
| T10_GATGAGGAGACGCACA.1 | Pro-B_cell_CD34+ | 0.02 | 234.38 | Raw ScoresEndothelial_cells:HUVEC:IFNg: 0.23, Endothelial_cells:HUVEC:Borrelia_burgdorferi: 0.23, Endothelial_cells:lymphatic: 0.23, Endothelial_cells:lymphatic:TNFa_48h: 0.23, Endothelial_cells:HUVEC:PR8-infected: 0.22, Endothelial_cells:HUVEC:FPV-infected: 0.22, Endothelial_cells:HUVEC: 0.22, Pro-B_cell_CD34+: 0.22, Endothelial_cells:blood_vessel: 0.22, Endothelial_cells:HUVEC:B._anthracis_LT: 0.22 |
| T200_AGTTAGCGTGCAATGG-1 | Endothelial_cells:lymphatic:TNFa_48h | 0.19 | 228.38 | Raw ScoresEndothelial_cells:lymphatic:TNFa_48h: 0.43, Endothelial_cells:lymphatic: 0.43, Endothelial_cells:blood_vessel: 0.42, Endothelial_cells:lymphatic:KSHV: 0.42, Endothelial_cells:HUVEC:B._anthracis_LT: 0.41, Endothelial_cells:HUVEC:PR8-infected: 0.4, Endothelial_cells:HUVEC:IFNg: 0.4, Endothelial_cells:HUVEC:Serum_Amyloid_A: 0.4, Endothelial_cells:HUVEC:FPV-infected: 0.4, Endothelial_cells:HUVEC:H5N1-infected: 0.39 |
| T214_AACCTGATCTTCGTAT-1 | Endothelial_cells:lymphatic | 0.15 | 220.83 | Raw ScoresEndothelial_cells:lymphatic:TNFa_48h: 0.4, Endothelial_cells:lymphatic: 0.39, Endothelial_cells:blood_vessel: 0.39, Endothelial_cells:lymphatic:KSHV: 0.38, Endothelial_cells:HUVEC: 0.38, Endothelial_cells:HUVEC:Serum_Amyloid_A: 0.38, Endothelial_cells:HUVEC:IL-1b: 0.38, Neurons:Schwann_cell: 0.37, Endothelial_cells:HUVEC:H5N1-infected: 0.37, Endothelial_cells:HUVEC:PR8-infected: 0.37 |
| T230_ATCCGTCGTAACAGGC-1 | Endothelial_cells:HUVEC:Borrelia_burgdorferi | 0.18 | 199.44 | Raw ScoresEndothelial_cells:HUVEC:IFNg: 0.43, Endothelial_cells:HUVEC:Borrelia_burgdorferi: 0.42, Endothelial_cells:lymphatic:TNFa_48h: 0.42, Endothelial_cells:lymphatic: 0.42, Endothelial_cells:HUVEC:VEGF: 0.42, Endothelial_cells:HUVEC: 0.42, Endothelial_cells:HUVEC:Serum_Amyloid_A: 0.41, Endothelial_cells:HUVEC:H5N1-infected: 0.41, Endothelial_cells:HUVEC:FPV-infected: 0.41, Endothelial_cells:HUVEC:B._anthracis_LT: 0.41 |
| T19_TAAGAGAGTTTGCATG.1 | Tissue_stem_cells:BM_MSC:BMP2 | 0.09 | 199.08 | Raw ScoresiPS_cells:adipose_stem_cells: 0.34, Fibroblasts:breast: 0.33, Tissue_stem_cells:iliac_MSC: 0.33, Tissue_stem_cells:BM_MSC:TGFb3: 0.33, Tissue_stem_cells:BM_MSC:BMP2: 0.33, Fibroblasts:foreskin: 0.33, Smooth_muscle_cells:bronchial: 0.33, Neurons:Schwann_cell: 0.33, Smooth_muscle_cells:bronchial:vit_D: 0.33, iPS_cells:CRL2097_foreskin: 0.32 |
| T19_CTGCGGATCTGAGGGA.1 | DC:monocyte-derived:AEC-conditioned | 0.14 | 196.18 | Raw ScoresMonocyte:leukotriene_D4: 0.37, Macrophage:monocyte-derived:M-CSF: 0.37, Monocyte:CD16-: 0.36, Macrophage:monocyte-derived:M-CSF/IFNg: 0.36, Monocyte:anti-FcgRIIB: 0.36, Monocyte: 0.36, Monocyte:CD16+: 0.36, Macrophage:monocyte-derived:M-CSF/IFNg/Pam3Cys: 0.36, Monocyte:CD14+: 0.36, DC:monocyte-derived:AEC-conditioned: 0.36 |
| T200_TACGCTCGTTCTCAGA-1 | Endothelial_cells:lymphatic:TNFa_48h | 0.16 | 194.37 | Raw ScoresEndothelial_cells:lymphatic:TNFa_48h: 0.37, Endothelial_cells:HUVEC:PR8-infected: 0.37, Endothelial_cells:lymphatic: 0.36, Endothelial_cells:HUVEC:B._anthracis_LT: 0.36, Endothelial_cells:HUVEC:H5N1-infected: 0.36, Endothelial_cells:lymphatic:KSHV: 0.36, Endothelial_cells:blood_vessel: 0.36, Endothelial_cells:HUVEC:Serum_Amyloid_A: 0.35, Endothelial_cells:HUVEC:FPV-infected: 0.35, Endothelial_cells:HUVEC:IFNg: 0.35 |
| T200_CATGCAATCAATCAGC-1 | Endothelial_cells:lymphatic:TNFa_48h | 0.13 | 190.27 | Raw ScoresEndothelial_cells:lymphatic:TNFa_48h: 0.42, Endothelial_cells:lymphatic: 0.41, Endothelial_cells:blood_vessel: 0.4, Endothelial_cells:HUVEC:PR8-infected: 0.4, Endothelial_cells:lymphatic:KSHV: 0.4, Endothelial_cells:HUVEC:B._anthracis_LT: 0.4, Endothelial_cells:HUVEC:FPV-infected: 0.39, Endothelial_cells:HUVEC:H5N1-infected: 0.39, Endothelial_cells:HUVEC:Serum_Amyloid_A: 0.39, Endothelial_cells:HUVEC:IFNg: 0.39 |
| T19_CCACGGAGTTTACTCT.1 | Monocyte:CD14+ | 0.12 | 187.49 | Raw ScoresMonocyte:CD16-: 0.39, Monocyte:CD14+: 0.38, Monocyte:CD16+: 0.38, DC:monocyte-derived:AEC-conditioned: 0.38, Macrophage:monocyte-derived:M-CSF/IFNg/Pam3Cys: 0.38, Monocyte:leukotriene_D4: 0.38, Macrophage:monocyte-derived:M-CSF/IFNg: 0.37, Monocyte: 0.37, Macrophage:monocyte-derived:M-CSF: 0.37, Monocyte:anti-FcgRIIB: 0.37 |
Below shows the significant enrichments of this GEP for literature curated gene lists
This data was procured from existing single cell RNA-seq maps of neuroblastoma or related relevant data.
High ranks indicate this gene is a driver of this GEP.
These curated gene list are ranked by the P-value (on this GEP) of their constituent genes.
The Mean Count column shows the mean read count in cells scoring highly (H > 50) on this gene expression program.
Endothelial subclusters 2-6 (Hanemaaijer)
Marker genes obtained from Supplementary Table SD of Hanemaaijer et al (PMID 33500353). The authors generated single-cell RNA-seq data (sort-seq, 2,229 cells total) from mouse adrenal glads at E13.5, E14.5, E17.5, E18.5, P1 and P5. These were marker genes that matched with a similar dataset generated by Furlan et al (PMID 28684471). This particular set of markers are for Various endothelial subclusters of Endothelium clusters:
Wilcoxon ranksum test P-value for gene set overrepresentation: 6.57e-08
Mean rank of genes in gene set: 2003.8
Rank on gene expression program of genes in gene set:
| Genes | Weight | Rank | GTEx | DepMap | Decartes | Mean.Counts | Mean.TPM |
|---|---|---|---|---|---|---|---|
| GJA1 | 0.0047114 | 18 | GTEx | DepMap | Descartes | 1.73 | 95.14 |
| TM4SF1 | 0.0043025 | 22 | GTEx | DepMap | Descartes | 4.83 | 374.45 |
| SPRY1 | 0.0040182 | 26 | GTEx | DepMap | Descartes | 4.08 | 346.34 |
| MECOM | 0.0036083 | 36 | GTEx | DepMap | Descartes | 0.63 | 22.26 |
| IGFBP3 | 0.0034010 | 48 | GTEx | DepMap | Descartes | 4.22 | 311.68 |
| DUSP6 | 0.0016526 | 157 | GTEx | DepMap | Descartes | 2.36 | 115.66 |
| THBD | 0.0014052 | 200 | GTEx | DepMap | Descartes | 0.84 | 45.79 |
| ADAMTS1 | 0.0013153 | 213 | GTEx | DepMap | Descartes | 1.01 | 35.18 |
| CLIC4 | 0.0008928 | 337 | GTEx | DepMap | Descartes | 1.42 | 70.22 |
| IVNS1ABP | 0.0007965 | 378 | GTEx | DepMap | Descartes | 1.41 | 71.15 |
| RHOB | 0.0007723 | 393 | GTEx | DepMap | Descartes | 4.80 | 400.43 |
| HES1 | 0.0007658 | 399 | GTEx | DepMap | Descartes | 2.24 | 341.59 |
| JAG1 | 0.0005533 | 545 | GTEx | DepMap | Descartes | 1.10 | 36.09 |
| MCF2L | 0.0003736 | 813 | GTEx | DepMap | Descartes | 0.34 | 9.41 |
| LFNG | 0.0001360 | 1949 | GTEx | DepMap | Descartes | 0.14 | 11.83 |
| MARCKSL1 | 0.0000654 | 3158 | GTEx | DepMap | Descartes | 8.54 | 899.89 |
| SHROOM2 | 0.0000427 | 3857 | GTEx | DepMap | Descartes | 0.07 | 1.79 |
| FBLN2 | -0.0000063 | 6323 | GTEx | DepMap | Descartes | 0.19 | 6.89 |
| CDK1 | -0.0000686 | 10601 | GTEx | DepMap | Descartes | 0.32 | 21.26 |
| FAM102A | -0.0000686 | 10603 | GTEx | DepMap | Descartes | 0.09 | 2.84 |
Endothelium (Kameneva)
Marker gene were obtained from Fig. 1D of Kameneva et al (PMID 33833454). These genes were used by the authors to annotate each cell type in their human fetal adrenal scRNA-seq data obtained 6, 8, 9, 11, 12 and 14 weeks post conception.:
Wilcoxon ranksum test P-value for gene set overrepresentation: 2.95e-04
Mean rank of genes in gene set: 51.5
Rank on gene expression program of genes in gene set:
| Genes | Weight | Rank | GTEx | DepMap | Decartes | Mean.Counts | Mean.TPM |
|---|---|---|---|---|---|---|---|
| KDR | 0.0050336 | 12 | GTEx | DepMap | Descartes | 2.01 | 63.87 |
| FLT1 | 0.0049599 | 13 | GTEx | DepMap | Descartes | 2.91 | 74.63 |
| EGFL7 | 0.0048722 | 15 | GTEx | DepMap | Descartes | 6.10 | 606.76 |
| PRCP | 0.0015923 | 166 | GTEx | DepMap | Descartes | 1.63 | 52.37 |
Vascular (Kildisiute)
Vascular markers obtained from Kildisiute et al, Supplmenentary Table 2, references supporting these genes are provided in Supp Table S2 of Kildisiute et al (PMID 33547074) https://www.science.org/doi/suppl/10.1126/sciadv.abd3311/suppl_file/abd3311_tables_s1_to_s12.xlsx:
Wilcoxon ranksum test P-value for gene set overrepresentation: 1.40e-03
Mean rank of genes in gene set: 22.33
Rank on gene expression program of genes in gene set:
| Genes | Weight | Rank | GTEx | DepMap | Decartes | Mean.Counts | Mean.TPM |
|---|---|---|---|---|---|---|---|
| PLVAP | 0.0056084 | 5 | GTEx | DepMap | Descartes | 8.02 | 662.01 |
| KDR | 0.0050336 | 12 | GTEx | DepMap | Descartes | 2.01 | 63.87 |
| PTPRB | 0.0033957 | 50 | GTEx | DepMap | Descartes | 1.14 | 17.94 |
Below shows ranks on this GEP for literature curated gene lists for large gene sets
These include those reported as mesenchymal/adrenergic by Van Groningen et al.
High ranks indicate this gene is a driver of this GEP (note these results are not ordered).
The Mean Count column shows the mean read count in cells scoring highly (H > 50) on this gene expression program.
VanGroningen Adrenergic Genes
Adrenergic marker genes from Supplementary Table 2 of Van Groningen et al. Nature Genetics 2017. These genes were identified by differential expression analysis of mesenchymal-like and adrenergic-like neuroblastoma cell lines.
Wilcoxon ranksum test P-value for gene set overrepresentation: 1.00e+00
Mean rank of genes in gene set: 9932.85
Median rank of genes in gene set: 11288
Rank on gene expression program of top 30 genes in gene set:
| Genes | Weight | Rank | GTEx | DepMap | Descartes | Mean.Counts | Mean.TPM |
|---|---|---|---|---|---|---|---|
| GRB10 | 0.0016520 | 158 | GTEx | DepMap | Descartes | 0.84 | 30.35 |
| RPS6KA2 | 0.0007238 | 421 | GTEx | DepMap | Descartes | 0.80 | 24.50 |
| HEY1 | 0.0006401 | 472 | GTEx | DepMap | Descartes | 0.38 | 20.68 |
| ABLIM1 | 0.0004415 | 691 | GTEx | DepMap | Descartes | 0.58 | 16.92 |
| TSPAN7 | 0.0004016 | 753 | GTEx | DepMap | Descartes | 0.88 | 85.23 |
| TSPAN13 | 0.0003170 | 950 | GTEx | DepMap | Descartes | 0.73 | 78.70 |
| SYNPO2 | 0.0003109 | 968 | GTEx | DepMap | Descartes | 0.71 | 8.66 |
| NCOA7 | 0.0002941 | 1020 | GTEx | DepMap | Descartes | 1.48 | NA |
| SETD7 | 0.0002804 | 1067 | GTEx | DepMap | Descartes | 0.32 | 8.90 |
| THSD7A | 0.0002708 | 1102 | GTEx | DepMap | Descartes | 0.59 | 10.12 |
| GNB1 | 0.0002620 | 1138 | GTEx | DepMap | Descartes | 1.74 | 94.57 |
| MYRIP | 0.0002213 | 1315 | GTEx | DepMap | Descartes | 0.05 | 1.36 |
| LYN | 0.0001788 | 1563 | GTEx | DepMap | Descartes | 0.53 | 18.24 |
| AP1S2 | 0.0001651 | 1660 | GTEx | DepMap | Descartes | 1.21 | 68.94 |
| RUNDC3B | 0.0001573 | 1723 | GTEx | DepMap | Descartes | 0.23 | 11.32 |
| CD200 | 0.0001518 | 1771 | GTEx | DepMap | Descartes | 0.71 | 68.95 |
| SLC35G2 | 0.0001367 | 1940 | GTEx | DepMap | Descartes | 0.18 | NA |
| INO80C | 0.0001356 | 1954 | GTEx | DepMap | Descartes | 0.32 | 22.00 |
| TBC1D30 | 0.0001281 | 2036 | GTEx | DepMap | Descartes | 0.14 | 2.71 |
| CDC42EP3 | 0.0001220 | 2115 | GTEx | DepMap | Descartes | 0.78 | 29.63 |
| ARHGEF7 | 0.0001217 | 2119 | GTEx | DepMap | Descartes | 0.46 | 14.41 |
| PDK1 | 0.0000786 | 2853 | GTEx | DepMap | Descartes | 0.12 | 1.59 |
| RNF144A | 0.0000763 | 2907 | GTEx | DepMap | Descartes | 0.20 | 7.00 |
| MYO5A | 0.0000572 | 3391 | GTEx | DepMap | Descartes | 0.23 | 2.94 |
| RALGDS | 0.0000525 | 3531 | GTEx | DepMap | Descartes | 0.74 | 23.34 |
| EXOC5 | 0.0000524 | 3535 | GTEx | DepMap | Descartes | 0.37 | 6.29 |
| NET1 | 0.0000418 | 3889 | GTEx | DepMap | Descartes | 0.25 | 13.71 |
| TMOD2 | 0.0000308 | 4323 | GTEx | DepMap | Descartes | 0.54 | 11.05 |
| NRCAM | 0.0000204 | 4784 | GTEx | DepMap | Descartes | 0.30 | 9.30 |
| DPYSL2 | 0.0000186 | 4872 | GTEx | DepMap | Descartes | 1.68 | 61.08 |
VanGroningen Mesenchymal Genes
Mesenchymal marker genes from Supplementary Table 2 of Van Groningen et al. Nature Genetics 2017. These genes were identified by differential expression analysis of mesenchymal-like and adrenergic-like neuroblastoma cell lines.
Wilcoxon ranksum test P-value for gene set overrepresentation: 1.23e-48
Mean rank of genes in gene set: 3781.87
Median rank of genes in gene set: 1806
Rank on gene expression program of top 30 genes in gene set:
| Genes | Weight | Rank | GTEx | DepMap | Descartes | Mean.Counts | Mean.TPM |
|---|---|---|---|---|---|---|---|
| GJA1 | 0.0047114 | 18 | GTEx | DepMap | Descartes | 1.73 | 95.14 |
| A2M | 0.0046635 | 19 | GTEx | DepMap | Descartes | 10.26 | 448.67 |
| TM4SF1 | 0.0043025 | 22 | GTEx | DepMap | Descartes | 4.83 | 374.45 |
| SPRY1 | 0.0040182 | 26 | GTEx | DepMap | Descartes | 4.08 | 346.34 |
| SPARCL1 | 0.0039332 | 28 | GTEx | DepMap | Descartes | 10.67 | 834.11 |
| HTRA1 | 0.0038119 | 31 | GTEx | DepMap | Descartes | 3.36 | 282.83 |
| SPARC | 0.0034766 | 42 | GTEx | DepMap | Descartes | 27.05 | 1402.52 |
| EMP1 | 0.0032214 | 57 | GTEx | DepMap | Descartes | 2.37 | 77.34 |
| WWTR1 | 0.0031816 | 59 | GTEx | DepMap | Descartes | 1.63 | 65.89 |
| COL4A1 | 0.0031168 | 62 | GTEx | DepMap | Descartes | 13.04 | 334.34 |
| ID1 | 0.0028109 | 72 | GTEx | DepMap | Descartes | 5.56 | 1085.27 |
| TGFBR2 | 0.0027133 | 82 | GTEx | DepMap | Descartes | 2.46 | 90.83 |
| ELK3 | 0.0025460 | 87 | GTEx | DepMap | Descartes | 1.40 | 64.20 |
| PDLIM1 | 0.0024784 | 89 | GTEx | DepMap | Descartes | 3.01 | 421.78 |
| SEMA3F | 0.0024481 | 90 | GTEx | DepMap | Descartes | 0.82 | 42.09 |
| RAB13 | 0.0023035 | 99 | GTEx | DepMap | Descartes | 3.52 | 310.87 |
| SPRY4 | 0.0021891 | 109 | GTEx | DepMap | Descartes | 0.89 | 28.49 |
| COL4A2 | 0.0021639 | 111 | GTEx | DepMap | Descartes | 10.71 | 274.45 |
| ID3 | 0.0021636 | 112 | GTEx | DepMap | Descartes | 9.98 | 2464.44 |
| SERPINH1 | 0.0021092 | 116 | GTEx | DepMap | Descartes | 3.67 | 174.32 |
| PTPN14 | 0.0020703 | 120 | GTEx | DepMap | Descartes | 0.45 | 6.97 |
| RHOJ | 0.0019316 | 133 | GTEx | DepMap | Descartes | 0.71 | 39.45 |
| RGS3 | 0.0017979 | 146 | GTEx | DepMap | Descartes | 1.82 | 77.77 |
| DUSP6 | 0.0016526 | 157 | GTEx | DepMap | Descartes | 2.36 | 115.66 |
| PRCP | 0.0015923 | 166 | GTEx | DepMap | Descartes | 1.63 | 52.37 |
| CFI | 0.0015166 | 173 | GTEx | DepMap | Descartes | 0.47 | 45.74 |
| NFIA | 0.0014866 | 179 | GTEx | DepMap | Descartes | 1.23 | 5.56 |
| RHOC | 0.0014694 | 184 | GTEx | DepMap | Descartes | 3.81 | 342.98 |
| NID2 | 0.0014654 | 186 | GTEx | DepMap | Descartes | 0.54 | 23.02 |
| LAMC1 | 0.0014575 | 189 | GTEx | DepMap | Descartes | 1.68 | 37.71 |
Descartes adrenocortical markers
Top 50 marker genes of adrenocortical cells in the Decartes fetal adrenal single cell map (https://atlas.brotmanbaty.org/bbi/human-gene-expression-during-development/cell/adrenocortical/in/adrenal)
Wilcoxon ranksum test P-value for gene set overrepresentation: 3.52e-01
Mean rank of genes in gene set: 6045.14
Median rank of genes in gene set: 5381
Rank on gene expression program of top 30 genes in gene set:
| Genes | Weight | Rank | GTEx | DepMap | Descartes | Mean.Counts | Mean.TPM |
|---|---|---|---|---|---|---|---|
| SH3BP5 | 0.0007429 | 415 | GTEx | DepMap | Descartes | 1.32 | 83.39 |
| SCARB1 | 0.0006151 | 486 | GTEx | DepMap | Descartes | 0.27 | 8.34 |
| LDLR | 0.0003549 | 856 | GTEx | DepMap | Descartes | 0.35 | 10.75 |
| FDPS | 0.0002423 | 1207 | GTEx | DepMap | Descartes | 1.65 | 149.03 |
| BAIAP2L1 | 0.0002116 | 1374 | GTEx | DepMap | Descartes | 0.02 | 1.48 |
| CYB5B | 0.0001717 | 1614 | GTEx | DepMap | Descartes | 0.54 | 24.75 |
| PDE10A | 0.0001509 | 1784 | GTEx | DepMap | Descartes | 0.15 | 3.79 |
| PAPSS2 | 0.0001349 | 1961 | GTEx | DepMap | Descartes | 0.17 | 5.53 |
| CLU | 0.0001025 | 2420 | GTEx | DepMap | Descartes | 1.86 | 183.90 |
| NPC1 | 0.0000928 | 2592 | GTEx | DepMap | Descartes | 0.08 | 3.96 |
| SH3PXD2B | 0.0000727 | 2977 | GTEx | DepMap | Descartes | 0.12 | 2.75 |
| IGF1R | 0.0000718 | 3005 | GTEx | DepMap | Descartes | 0.30 | 3.94 |
| DHCR7 | 0.0000633 | 3219 | GTEx | DepMap | Descartes | 0.12 | 7.24 |
| POR | 0.0000313 | 4303 | GTEx | DepMap | Descartes | 0.33 | 25.55 |
| GRAMD1B | 0.0000261 | 4524 | GTEx | DepMap | Descartes | 0.06 | 0.85 |
| ERN1 | 0.0000157 | 5014 | GTEx | DepMap | Descartes | 0.16 | 3.96 |
| FREM2 | 0.0000145 | 5071 | GTEx | DepMap | Descartes | 0.01 | 0.06 |
| SCAP | 0.0000104 | 5253 | GTEx | DepMap | Descartes | 0.27 | 10.13 |
| FDX1 | 0.0000055 | 5509 | GTEx | DepMap | Descartes | 0.58 | 33.22 |
| HMGCR | 0.0000026 | 5667 | GTEx | DepMap | Descartes | 0.15 | 6.20 |
| HMGCS1 | -0.0000004 | 5840 | GTEx | DepMap | Descartes | 0.26 | 8.91 |
| INHA | -0.0000271 | 8097 | GTEx | DepMap | Descartes | 0.00 | 0.00 |
| SGCZ | -0.0000272 | 8104 | GTEx | DepMap | Descartes | 0.00 | 0.00 |
| STAR | -0.0000345 | 8655 | GTEx | DepMap | Descartes | 0.00 | 0.00 |
| FDXR | -0.0000348 | 8679 | GTEx | DepMap | Descartes | 0.14 | 12.78 |
| MSMO1 | -0.0000363 | 8778 | GTEx | DepMap | Descartes | 0.28 | 24.00 |
| SLC16A9 | -0.0000420 | 9170 | GTEx | DepMap | Descartes | 0.02 | 1.06 |
| DHCR24 | -0.0000549 | 9929 | GTEx | DepMap | Descartes | 0.07 | 1.57 |
| FRMD5 | -0.0000728 | 10745 | GTEx | DepMap | Descartes | 0.02 | 0.39 |
| SLC1A2 | -0.0000819 | 11055 | GTEx | DepMap | Descartes | 0.05 | 0.51 |
Descartes chromaffin markers
Top 50 marker genes of chromaffin cells in the Decartes fetal adrenal single cell map (https://atlas.brotmanbaty.org/bbi/human-gene-expression-during-development/cell/chromaffin/in/adrenal)
Wilcoxon ranksum test P-value for gene set overrepresentation: 1.00e+00
Mean rank of genes in gene set: 11158.8
Median rank of genes in gene set: 11885
Rank on gene expression program of top 30 genes in gene set:
| Genes | Weight | Rank | GTEx | DepMap | Descartes | Mean.Counts | Mean.TPM |
|---|---|---|---|---|---|---|---|
| SYNPO2 | 0.0003109 | 968 | GTEx | DepMap | Descartes | 0.71 | 8.66 |
| GREM1 | -0.0000325 | 8518 | GTEx | DepMap | Descartes | 0.06 | 0.69 |
| EPHA6 | -0.0000441 | 9300 | GTEx | DepMap | Descartes | 0.01 | 0.21 |
| ANKFN1 | -0.0000471 | 9486 | GTEx | DepMap | Descartes | 0.01 | 0.12 |
| RPH3A | -0.0000479 | 9545 | GTEx | DepMap | Descartes | 0.01 | 0.11 |
| FAT3 | -0.0000481 | 9559 | GTEx | DepMap | Descartes | 0.06 | 0.54 |
| RYR2 | -0.0000514 | 9757 | GTEx | DepMap | Descartes | 0.04 | 0.35 |
| SLC44A5 | -0.0000567 | 10033 | GTEx | DepMap | Descartes | 0.01 | 0.69 |
| ALK | -0.0000605 | 10236 | GTEx | DepMap | Descartes | 0.01 | 0.37 |
| KCNB2 | -0.0000651 | 10454 | GTEx | DepMap | Descartes | 0.02 | 0.62 |
| PTCHD1 | -0.0000687 | 10607 | GTEx | DepMap | Descartes | 0.05 | 0.70 |
| HS3ST5 | -0.0000695 | 10631 | GTEx | DepMap | Descartes | 0.01 | 0.22 |
| EYA1 | -0.0000781 | 10925 | GTEx | DepMap | Descartes | 0.04 | 1.99 |
| EYA4 | -0.0000868 | 11207 | GTEx | DepMap | Descartes | 0.02 | 0.12 |
| PLXNA4 | -0.0000898 | 11285 | GTEx | DepMap | Descartes | 0.03 | 0.16 |
| CNKSR2 | -0.0000923 | 11355 | GTEx | DepMap | Descartes | 0.04 | 0.57 |
| SLC6A2 | -0.0000923 | 11356 | GTEx | DepMap | Descartes | 0.02 | 0.52 |
| RGMB | -0.0000927 | 11367 | GTEx | DepMap | Descartes | 0.19 | 5.36 |
| TMEM132C | -0.0000931 | 11376 | GTEx | DepMap | Descartes | 0.00 | 0.00 |
| TMEFF2 | -0.0001036 | 11589 | GTEx | DepMap | Descartes | 0.06 | 1.86 |
| REEP1 | -0.0001233 | 11885 | GTEx | DepMap | Descartes | 0.09 | 3.46 |
| RBFOX1 | -0.0001294 | 11950 | GTEx | DepMap | Descartes | 0.05 | 2.31 |
| NTRK1 | -0.0001343 | 11995 | GTEx | DepMap | Descartes | 0.09 | 5.05 |
| TUBB2A | -0.0001461 | 12106 | GTEx | DepMap | Descartes | 1.61 | 131.33 |
| IL7 | -0.0001466 | 12113 | GTEx | DepMap | Descartes | 0.11 | 9.55 |
| CCND1 | -0.0001549 | 12187 | GTEx | DepMap | Descartes | 3.30 | 152.95 |
| NPY | -0.0001603 | 12212 | GTEx | DepMap | Descartes | 5.10 | 1116.83 |
| MAB21L1 | -0.0001605 | 12214 | GTEx | DepMap | Descartes | 0.42 | 22.19 |
| MAB21L2 | -0.0001628 | 12227 | GTEx | DepMap | Descartes | 0.29 | 12.18 |
| ELAVL2 | -0.0001665 | 12252 | GTEx | DepMap | Descartes | 0.31 | 11.52 |
Descartes Vascular_endothelial markers
Top 50 marker genes of Vascular_endothelial cells in the Decartes fetal adrenal single cell map (https://atlas.brotmanbaty.org/bbi/human-gene-expression-during-development/cell/vascular_endothelial/in/adrenal)
Wilcoxon ranksum test P-value for gene set overrepresentation: 1.62e-22
Mean rank of genes in gene set: 587.32
Median rank of genes in gene set: 100.5
Rank on gene expression program of top 30 genes in gene set:
| Genes | Weight | Rank | GTEx | DepMap | Descartes | Mean.Counts | Mean.TPM |
|---|---|---|---|---|---|---|---|
| PLVAP | 0.0056084 | 5 | GTEx | DepMap | Descartes | 8.02 | 662.01 |
| CDH5 | 0.0053446 | 7 | GTEx | DepMap | Descartes | 2.27 | 107.02 |
| KDR | 0.0050336 | 12 | GTEx | DepMap | Descartes | 2.01 | 63.87 |
| MMRN2 | 0.0048994 | 14 | GTEx | DepMap | Descartes | 1.27 | 60.96 |
| CLDN5 | 0.0046273 | 20 | GTEx | DepMap | Descartes | 5.81 | 473.58 |
| ROBO4 | 0.0041193 | 25 | GTEx | DepMap | Descartes | 1.42 | 69.04 |
| PODXL | 0.0037162 | 33 | GTEx | DepMap | Descartes | 2.71 | 82.46 |
| CALCRL | 0.0035825 | 38 | GTEx | DepMap | Descartes | 1.59 | 60.20 |
| NR5A2 | 0.0034462 | 43 | GTEx | DepMap | Descartes | 0.14 | 4.97 |
| TIE1 | 0.0034401 | 44 | GTEx | DepMap | Descartes | 1.04 | 57.16 |
| ESM1 | 0.0033963 | 49 | GTEx | DepMap | Descartes | 2.05 | 177.79 |
| PTPRB | 0.0033957 | 50 | GTEx | DepMap | Descartes | 1.14 | 17.94 |
| SLCO2A1 | 0.0031678 | 60 | GTEx | DepMap | Descartes | 0.64 | 32.62 |
| TMEM88 | 0.0031509 | 61 | GTEx | DepMap | Descartes | 1.17 | 294.75 |
| ID1 | 0.0028109 | 72 | GTEx | DepMap | Descartes | 5.56 | 1085.27 |
| TEK | 0.0027414 | 77 | GTEx | DepMap | Descartes | 0.25 | 9.29 |
| RAMP2 | 0.0026765 | 83 | GTEx | DepMap | Descartes | 7.54 | 1829.65 |
| RASIP1 | 0.0026334 | 86 | GTEx | DepMap | Descartes | 0.84 | 58.18 |
| SHE | 0.0023023 | 100 | GTEx | DepMap | Descartes | 0.41 | 13.66 |
| ARHGAP29 | 0.0022832 | 101 | GTEx | DepMap | Descartes | 3.23 | 77.47 |
| FLT4 | 0.0021359 | 113 | GTEx | DepMap | Descartes | 0.57 | 18.57 |
| KANK3 | 0.0020641 | 122 | GTEx | DepMap | Descartes | 0.72 | 66.16 |
| NPR1 | 0.0020461 | 124 | GTEx | DepMap | Descartes | 0.30 | 14.09 |
| BTNL9 | 0.0018818 | 140 | GTEx | DepMap | Descartes | 0.20 | 9.36 |
| EFNB2 | 0.0017836 | 147 | GTEx | DepMap | Descartes | 1.79 | 56.16 |
| NOTCH4 | 0.0017351 | 151 | GTEx | DepMap | Descartes | 1.23 | 34.08 |
| SHANK3 | 0.0016619 | 156 | GTEx | DepMap | Descartes | 0.50 | 12.34 |
| HYAL2 | 0.0013296 | 209 | GTEx | DepMap | Descartes | 2.94 | 148.98 |
| GALNT15 | 0.0012545 | 231 | GTEx | DepMap | Descartes | 0.18 | NA |
| CDH13 | 0.0011535 | 257 | GTEx | DepMap | Descartes | 0.68 | 13.56 |
Descartes stromal markers
Top 50 marker genes of stromal cells in the Decartes fetal adrenal single cell map (https://atlas.brotmanbaty.org/bbi/human-gene-expression-during-development/cell/stromal/in/adrenal)
Wilcoxon ranksum test P-value for gene set overrepresentation: 1.00e+00
Mean rank of genes in gene set: 8805.5
Median rank of genes in gene set: 10705
Rank on gene expression program of top 30 genes in gene set:
| Genes | Weight | Rank | GTEx | DepMap | Descartes | Mean.Counts | Mean.TPM |
|---|---|---|---|---|---|---|---|
| IGFBP3 | 0.0034010 | 48 | GTEx | DepMap | Descartes | 4.22 | 311.68 |
| MGP | 0.0005241 | 584 | GTEx | DepMap | Descartes | 15.24 | 2513.37 |
| COL27A1 | 0.0004029 | 748 | GTEx | DepMap | Descartes | 0.13 | 2.36 |
| LOX | 0.0003692 | 821 | GTEx | DepMap | Descartes | 0.55 | 22.25 |
| COL12A1 | 0.0001794 | 1557 | GTEx | DepMap | Descartes | 0.49 | 5.87 |
| LRRC17 | 0.0001367 | 1938 | GTEx | DepMap | Descartes | 0.08 | 8.65 |
| C7 | 0.0001277 | 2040 | GTEx | DepMap | Descartes | 0.31 | 12.79 |
| ADAMTSL3 | 0.0000568 | 3400 | GTEx | DepMap | Descartes | 0.04 | 1.31 |
| ELN | 0.0000455 | 3767 | GTEx | DepMap | Descartes | 0.36 | 21.01 |
| GLI2 | 0.0000146 | 5068 | GTEx | DepMap | Descartes | 0.01 | 0.06 |
| POSTN | -0.0000072 | 6396 | GTEx | DepMap | Descartes | 1.61 | 58.14 |
| PRRX1 | -0.0000094 | 6588 | GTEx | DepMap | Descartes | 0.43 | 20.34 |
| RSPO3 | -0.0000109 | 6715 | GTEx | DepMap | Descartes | 0.06 | NA |
| PCDH18 | -0.0000234 | 7786 | GTEx | DepMap | Descartes | 0.10 | 2.76 |
| GAS2 | -0.0000337 | 8604 | GTEx | DepMap | Descartes | 0.00 | 0.00 |
| DKK2 | -0.0000339 | 8621 | GTEx | DepMap | Descartes | 0.01 | 0.77 |
| FREM1 | -0.0000368 | 8816 | GTEx | DepMap | Descartes | 0.01 | 0.17 |
| HHIP | -0.0000411 | 9115 | GTEx | DepMap | Descartes | 0.05 | 0.45 |
| PRICKLE1 | -0.0000481 | 9565 | GTEx | DepMap | Descartes | 0.10 | 3.71 |
| PAMR1 | -0.0000617 | 10291 | GTEx | DepMap | Descartes | 0.17 | 11.17 |
| ADAMTS2 | -0.0000675 | 10557 | GTEx | DepMap | Descartes | 0.16 | 3.39 |
| CCDC80 | -0.0000686 | 10599 | GTEx | DepMap | Descartes | 0.88 | 10.28 |
| SFRP2 | -0.0000750 | 10811 | GTEx | DepMap | Descartes | 0.00 | 0.00 |
| ITGA11 | -0.0000843 | 11126 | GTEx | DepMap | Descartes | 0.02 | 0.25 |
| CLDN11 | -0.0000858 | 11170 | GTEx | DepMap | Descartes | 0.02 | 0.63 |
| PDGFRA | -0.0000910 | 11319 | GTEx | DepMap | Descartes | 0.16 | 4.51 |
| SCARA5 | -0.0000936 | 11386 | GTEx | DepMap | Descartes | 0.01 | 0.24 |
| ABCA6 | -0.0001019 | 11556 | GTEx | DepMap | Descartes | 0.07 | 1.81 |
| ABCC9 | -0.0001149 | 11771 | GTEx | DepMap | Descartes | 0.16 | 5.63 |
| LAMC3 | -0.0001299 | 11956 | GTEx | DepMap | Descartes | 0.02 | 0.32 |
Descartes sympathoblasts markers
Top 50 marker genes of sympathoblasts cells in the Decartes fetal adrenal single cell map (https://atlas.brotmanbaty.org/bbi/human-gene-expression-during-development/cell/sympathoblasts/in/adrenal)
Wilcoxon ranksum test P-value for gene set overrepresentation: 1.00e+00
Mean rank of genes in gene set: 9264
Median rank of genes in gene set: 9839
Rank on gene expression program of top 30 genes in gene set:
| Genes | Weight | Rank | GTEx | DepMap | Descartes | Mean.Counts | Mean.TPM |
|---|---|---|---|---|---|---|---|
| ROBO1 | 0.0003471 | 878 | GTEx | DepMap | Descartes | 0.53 | 10.42 |
| LAMA3 | 0.0001593 | 1703 | GTEx | DepMap | Descartes | 0.04 | 1.29 |
| CNTN3 | 0.0000130 | 5142 | GTEx | DepMap | Descartes | 0.01 | 0.10 |
| FAM155A | 0.0000081 | 5372 | GTEx | DepMap | Descartes | 0.16 | 2.22 |
| SORCS3 | -0.0000156 | 7139 | GTEx | DepMap | Descartes | 0.01 | 0.17 |
| SLC24A2 | -0.0000172 | 7254 | GTEx | DepMap | Descartes | 0.01 | 0.24 |
| CDH18 | -0.0000199 | 7483 | GTEx | DepMap | Descartes | 0.01 | 0.24 |
| EML6 | -0.0000199 | 7486 | GTEx | DepMap | Descartes | 0.02 | 0.19 |
| TBX20 | -0.0000211 | 7579 | GTEx | DepMap | Descartes | 0.00 | 0.00 |
| ST18 | -0.0000230 | 7736 | GTEx | DepMap | Descartes | 0.01 | 0.10 |
| CCSER1 | -0.0000265 | 8033 | GTEx | DepMap | Descartes | 0.02 | NA |
| GRM7 | -0.0000308 | 8397 | GTEx | DepMap | Descartes | 0.00 | 0.00 |
| DGKK | -0.0000314 | 8438 | GTEx | DepMap | Descartes | 0.01 | 0.35 |
| AGBL4 | -0.0000373 | 8838 | GTEx | DepMap | Descartes | 0.01 | 0.20 |
| SLC35F3 | -0.0000376 | 8862 | GTEx | DepMap | Descartes | 0.00 | 0.00 |
| GALNTL6 | -0.0000409 | 9098 | GTEx | DepMap | Descartes | 0.01 | 0.14 |
| CDH12 | -0.0000466 | 9464 | GTEx | DepMap | Descartes | 0.01 | 0.12 |
| PACRG | -0.0000509 | 9722 | GTEx | DepMap | Descartes | 0.03 | 5.38 |
| PCSK2 | -0.0000526 | 9822 | GTEx | DepMap | Descartes | 0.02 | 0.47 |
| TIAM1 | -0.0000533 | 9856 | GTEx | DepMap | Descartes | 0.11 | 2.50 |
| GRID2 | -0.0000610 | 10261 | GTEx | DepMap | Descartes | 0.02 | 0.30 |
| TENM1 | -0.0000614 | 10275 | GTEx | DepMap | Descartes | 0.01 | NA |
| SPOCK3 | -0.0000624 | 10325 | GTEx | DepMap | Descartes | 0.01 | 0.87 |
| NTNG1 | -0.0000657 | 10478 | GTEx | DepMap | Descartes | 0.07 | 1.43 |
| HTATSF1 | -0.0000748 | 10806 | GTEx | DepMap | Descartes | 0.48 | 28.24 |
| MGAT4C | -0.0000751 | 10813 | GTEx | DepMap | Descartes | 0.05 | 0.29 |
| FGF14 | -0.0000753 | 10823 | GTEx | DepMap | Descartes | 0.01 | 0.33 |
| KSR2 | -0.0000763 | 10861 | GTEx | DepMap | Descartes | 0.03 | 0.30 |
| UNC80 | -0.0000837 | 11112 | GTEx | DepMap | Descartes | 0.05 | 0.44 |
| SLC18A1 | -0.0000856 | 11166 | GTEx | DepMap | Descartes | 0.02 | 0.36 |
Descartes erythroblasts markers
Top 50 marker genes of erythroblasts cells in the Decartes fetal adrenal single cell map (https://atlas.brotmanbaty.org/bbi/human-gene-expression-during-development/cell/erythroblasts/in/adrenal)
Wilcoxon ranksum test P-value for gene set overrepresentation: 3.62e-01
Mean rank of genes in gene set: 6036.86
Median rank of genes in gene set: 6550
Rank on gene expression program of top 30 genes in gene set:
| Genes | Weight | Rank | GTEx | DepMap | Descartes | Mean.Counts | Mean.TPM |
|---|---|---|---|---|---|---|---|
| SELENBP1 | 0.0005463 | 556 | GTEx | DepMap | Descartes | 0.24 | 24.97 |
| RAPGEF2 | 0.0002954 | 1014 | GTEx | DepMap | Descartes | 0.43 | 11.90 |
| GYPC | 0.0002257 | 1287 | GTEx | DepMap | Descartes | 2.25 | 242.03 |
| MARCH3 | 0.0002232 | 1303 | GTEx | DepMap | Descartes | 0.21 | NA |
| SLC25A37 | 0.0001609 | 1690 | GTEx | DepMap | Descartes | 0.54 | 26.39 |
| TRAK2 | 0.0001475 | 1820 | GTEx | DepMap | Descartes | 0.25 | 8.79 |
| MICAL2 | 0.0001100 | 2303 | GTEx | DepMap | Descartes | 0.21 | 5.87 |
| CPOX | 0.0000586 | 3356 | GTEx | DepMap | Descartes | 0.09 | 5.45 |
| ABCB10 | 0.0000553 | 3450 | GTEx | DepMap | Descartes | 0.08 | 3.83 |
| RGS6 | 0.0000530 | 3514 | GTEx | DepMap | Descartes | 0.01 | 0.45 |
| DENND4A | 0.0000351 | 4146 | GTEx | DepMap | Descartes | 0.19 | 4.34 |
| CAT | 0.0000164 | 4974 | GTEx | DepMap | Descartes | 0.40 | 37.48 |
| XPO7 | 0.0000044 | 5565 | GTEx | DepMap | Descartes | 0.14 | 5.68 |
| RHD | -0.0000073 | 6406 | GTEx | DepMap | Descartes | 0.00 | 0.00 |
| TMCC2 | -0.0000090 | 6550 | GTEx | DepMap | Descartes | 0.05 | 2.03 |
| SLC25A21 | -0.0000106 | 6690 | GTEx | DepMap | Descartes | 0.00 | 0.00 |
| FECH | -0.0000130 | 6910 | GTEx | DepMap | Descartes | 0.07 | 1.83 |
| ALAS2 | -0.0000175 | 7291 | GTEx | DepMap | Descartes | 0.02 | 0.44 |
| BLVRB | -0.0000193 | 7445 | GTEx | DepMap | Descartes | 0.71 | 88.00 |
| ANK1 | -0.0000293 | 8258 | GTEx | DepMap | Descartes | 0.07 | 0.61 |
| SLC4A1 | -0.0000293 | 8259 | GTEx | DepMap | Descartes | 0.00 | 0.00 |
| TFR2 | -0.0000366 | 8797 | GTEx | DepMap | Descartes | 0.09 | 2.51 |
| TSPAN5 | -0.0000375 | 8850 | GTEx | DepMap | Descartes | 0.57 | 26.98 |
| GCLC | -0.0000409 | 9096 | GTEx | DepMap | Descartes | 0.08 | 3.80 |
| SPTB | -0.0000508 | 9714 | GTEx | DepMap | Descartes | 0.01 | 0.14 |
| SPECC1 | -0.0000690 | 10620 | GTEx | DepMap | Descartes | 0.15 | 3.34 |
| SOX6 | -0.0000820 | 11056 | GTEx | DepMap | Descartes | 0.03 | 0.56 |
| EPB41 | -0.0001324 | 11974 | GTEx | DepMap | Descartes | 0.13 | 2.79 |
| SNCA | -0.0001528 | 12175 | GTEx | DepMap | Descartes | 0.27 | 15.49 |
| NA | NA | NA | NA | NA | NA | NA | NA |
Descartes myeloid markers
Top 50 marker genes of myeloid cells in the Decartes fetal adrenal single cell map (https://atlas.brotmanbaty.org/bbi/human-gene-expression-during-development/cell/myeloid/in/adrenal)
Wilcoxon ranksum test P-value for gene set overrepresentation: 9.77e-01
Mean rank of genes in gene set: 7448.11
Median rank of genes in gene set: 8273.5
Rank on gene expression program of top 30 genes in gene set:
| Genes | Weight | Rank | GTEx | DepMap | Descartes | Mean.Counts | Mean.TPM |
|---|---|---|---|---|---|---|---|
| RGL1 | 0.0003536 | 861 | GTEx | DepMap | Descartes | 0.28 | 12.02 |
| SLCO2B1 | 0.0003397 | 897 | GTEx | DepMap | Descartes | 0.30 | 11.00 |
| CD74 | 0.0002785 | 1076 | GTEx | DepMap | Descartes | 18.22 | 1308.59 |
| HRH1 | 0.0002522 | 1178 | GTEx | DepMap | Descartes | 0.13 | 5.83 |
| WWP1 | 0.0002459 | 1197 | GTEx | DepMap | Descartes | 0.36 | 13.41 |
| IFNGR1 | 0.0002181 | 1339 | GTEx | DepMap | Descartes | 0.69 | 55.28 |
| CST3 | 0.0002050 | 1407 | GTEx | DepMap | Descartes | 11.62 | 714.43 |
| SFMBT2 | 0.0001326 | 1983 | GTEx | DepMap | Descartes | 0.08 | 2.23 |
| PTPRE | 0.0001124 | 2264 | GTEx | DepMap | Descartes | 0.72 | 22.97 |
| SLC9A9 | 0.0000746 | 2945 | GTEx | DepMap | Descartes | 0.15 | 8.69 |
| CTSB | 0.0000629 | 3235 | GTEx | DepMap | Descartes | 2.40 | 125.88 |
| ITPR2 | 0.0000422 | 3872 | GTEx | DepMap | Descartes | 0.28 | 4.54 |
| MERTK | 0.0000182 | 4884 | GTEx | DepMap | Descartes | 0.08 | 2.93 |
| SPP1 | 0.0000125 | 5163 | GTEx | DepMap | Descartes | 1.21 | 201.62 |
| CTSC | -0.0000123 | 6843 | GTEx | DepMap | Descartes | 1.47 | 47.14 |
| CTSD | -0.0000131 | 6920 | GTEx | DepMap | Descartes | 1.88 | 171.23 |
| ATP8B4 | -0.0000211 | 7587 | GTEx | DepMap | Descartes | 0.03 | 0.95 |
| CPVL | -0.0000257 | 7976 | GTEx | DepMap | Descartes | 0.26 | 25.57 |
| LGMN | -0.0000269 | 8076 | GTEx | DepMap | Descartes | 1.15 | 85.12 |
| RBPJ | -0.0000320 | 8471 | GTEx | DepMap | Descartes | 0.75 | 23.32 |
| ABCA1 | -0.0000329 | 8542 | GTEx | DepMap | Descartes | 0.20 | 4.21 |
| MS4A4A | -0.0000491 | 9619 | GTEx | DepMap | Descartes | 0.34 | 32.68 |
| CD14 | -0.0000631 | 10362 | GTEx | DepMap | Descartes | 0.99 | 105.95 |
| AXL | -0.0000671 | 10533 | GTEx | DepMap | Descartes | 0.45 | 15.58 |
| CSF1R | -0.0000682 | 10586 | GTEx | DepMap | Descartes | 0.26 | 14.28 |
| FMN1 | -0.0000699 | 10640 | GTEx | DepMap | Descartes | 0.04 | 0.35 |
| SLC1A3 | -0.0001084 | 11673 | GTEx | DepMap | Descartes | 0.06 | 2.31 |
| FGD2 | -0.0001095 | 11692 | GTEx | DepMap | Descartes | 0.04 | 1.49 |
| CD163 | -0.0001271 | 11927 | GTEx | DepMap | Descartes | 0.13 | 4.94 |
| CYBB | -0.0001318 | 11969 | GTEx | DepMap | Descartes | 0.16 | 8.13 |
Descartes Schwann markers
Top 50 marker genes of Schwann cells in the Decartes fetal adrenal single cell map (https://atlas.brotmanbaty.org/bbi/human-gene-expression-during-development/cell/schwann/in/adrenal)
Wilcoxon ranksum test P-value for gene set overrepresentation: 9.99e-01
Mean rank of genes in gene set: 7990.64
Median rank of genes in gene set: 10256
Rank on gene expression program of top 30 genes in gene set:
| Genes | Weight | Rank | GTEx | DepMap | Descartes | Mean.Counts | Mean.TPM |
|---|---|---|---|---|---|---|---|
| LAMA4 | 0.0016165 | 162 | GTEx | DepMap | Descartes | 2.95 | 78.85 |
| LAMC1 | 0.0014575 | 189 | GTEx | DepMap | Descartes | 1.68 | 37.71 |
| EDNRB | 0.0012600 | 230 | GTEx | DepMap | Descartes | 0.84 | 36.36 |
| VIM | 0.0012285 | 238 | GTEx | DepMap | Descartes | 41.39 | 2682.43 |
| COL18A1 | 0.0010475 | 285 | GTEx | DepMap | Descartes | 3.44 | 97.05 |
| ADAMTS5 | 0.0010456 | 286 | GTEx | DepMap | Descartes | 0.41 | 7.48 |
| LAMB1 | 0.0009850 | 301 | GTEx | DepMap | Descartes | 1.46 | 48.20 |
| KCTD12 | 0.0005648 | 529 | GTEx | DepMap | Descartes | 0.77 | 26.49 |
| STARD13 | 0.0002844 | 1048 | GTEx | DepMap | Descartes | 0.25 | 7.51 |
| OLFML2A | 0.0001863 | 1509 | GTEx | DepMap | Descartes | 0.70 | 18.17 |
| EGFLAM | 0.0001362 | 1943 | GTEx | DepMap | Descartes | 0.24 | 7.39 |
| PLCE1 | 0.0000299 | 4368 | GTEx | DepMap | Descartes | 0.16 | 2.04 |
| HMGA2 | -0.0000008 | 5860 | GTEx | DepMap | Descartes | 0.01 | 0.05 |
| MDGA2 | -0.0000079 | 6455 | GTEx | DepMap | Descartes | 0.00 | 0.00 |
| GRIK3 | -0.0000118 | 6799 | GTEx | DepMap | Descartes | 0.04 | 0.85 |
| COL25A1 | -0.0000190 | 7416 | GTEx | DepMap | Descartes | 0.02 | 0.57 |
| TRPM3 | -0.0000276 | 8131 | GTEx | DepMap | Descartes | 0.01 | 0.09 |
| ERBB4 | -0.0000296 | 8282 | GTEx | DepMap | Descartes | 0.00 | 0.00 |
| LRRTM4 | -0.0000345 | 8658 | GTEx | DepMap | Descartes | 0.03 | 2.71 |
| IL1RAPL2 | -0.0000359 | 8756 | GTEx | DepMap | Descartes | 0.00 | 0.00 |
| IL1RAPL1 | -0.0000423 | 9184 | GTEx | DepMap | Descartes | 0.00 | 0.00 |
| FIGN | -0.0000575 | 10076 | GTEx | DepMap | Descartes | 0.10 | 1.15 |
| PMP22 | -0.0000648 | 10436 | GTEx | DepMap | Descartes | 1.45 | 151.88 |
| VCAN | -0.0000721 | 10721 | GTEx | DepMap | Descartes | 0.97 | 10.63 |
| XKR4 | -0.0000818 | 11047 | GTEx | DepMap | Descartes | 0.03 | 0.18 |
| SORCS1 | -0.0000865 | 11194 | GTEx | DepMap | Descartes | 0.05 | 1.69 |
| SLC35F1 | -0.0000915 | 11336 | GTEx | DepMap | Descartes | 0.07 | 1.23 |
| NRXN3 | -0.0000936 | 11388 | GTEx | DepMap | Descartes | 0.04 | 0.66 |
| SOX5 | -0.0000997 | 11508 | GTEx | DepMap | Descartes | 0.08 | 1.49 |
| PTPRZ1 | -0.0001180 | 11822 | GTEx | DepMap | Descartes | 0.05 | 0.47 |
Descartes Megakaryocytes markers
Top 50 marker genes of Megakaryocytes cells in the Decartes fetal adrenal single cell map (https://atlas.brotmanbaty.org/bbi/human-gene-expression-during-development/cell/megakaryocytes/in/adrenal)
Wilcoxon ranksum test P-value for gene set overrepresentation: 1.80e-03
Mean rank of genes in gene set: 4705.42
Median rank of genes in gene set: 2354
Rank on gene expression program of top 30 genes in gene set:
| Genes | Weight | Rank | GTEx | DepMap | Descartes | Mean.Counts | Mean.TPM |
|---|---|---|---|---|---|---|---|
| STOM | 0.0025355 | 88 | GTEx | DepMap | Descartes | 3.08 | 212.25 |
| MCTP1 | 0.0013175 | 212 | GTEx | DepMap | Descartes | 0.38 | 15.23 |
| MYH9 | 0.0011018 | 272 | GTEx | DepMap | Descartes | 2.82 | 76.84 |
| SLC2A3 | 0.0009519 | 310 | GTEx | DepMap | Descartes | 1.72 | 75.24 |
| FLI1 | 0.0008973 | 336 | GTEx | DepMap | Descartes | 0.38 | 16.13 |
| ARHGAP6 | 0.0008925 | 338 | GTEx | DepMap | Descartes | 0.20 | 6.56 |
| GSN | 0.0007530 | 409 | GTEx | DepMap | Descartes | 6.74 | 218.80 |
| THBS1 | 0.0006589 | 457 | GTEx | DepMap | Descartes | 2.04 | 45.61 |
| FLNA | 0.0006496 | 464 | GTEx | DepMap | Descartes | 2.50 | 52.24 |
| MYLK | 0.0005451 | 560 | GTEx | DepMap | Descartes | 1.20 | 20.28 |
| TPM4 | 0.0005071 | 614 | GTEx | DepMap | Descartes | 5.28 | 189.92 |
| TGFB1 | 0.0004971 | 628 | GTEx | DepMap | Descartes | 1.65 | 110.83 |
| LIMS1 | 0.0004847 | 644 | GTEx | DepMap | Descartes | 2.59 | 102.38 |
| CD9 | 0.0004329 | 699 | GTEx | DepMap | Descartes | 2.82 | 302.99 |
| LTBP1 | 0.0003629 | 838 | GTEx | DepMap | Descartes | 0.42 | 9.91 |
| TMSB4X | 0.0002513 | 1182 | GTEx | DepMap | Descartes | 103.18 | 11965.91 |
| VCL | 0.0002099 | 1381 | GTEx | DepMap | Descartes | 0.85 | 18.35 |
| RAP1B | 0.0001888 | 1494 | GTEx | DepMap | Descartes | 1.70 | 23.54 |
| ACTB | 0.0001648 | 1662 | GTEx | DepMap | Descartes | 35.03 | 2869.62 |
| ZYX | 0.0001511 | 1781 | GTEx | DepMap | Descartes | 0.86 | 69.73 |
| ACTN1 | 0.0001202 | 2138 | GTEx | DepMap | Descartes | 1.39 | 47.80 |
| GP1BA | 0.0001131 | 2249 | GTEx | DepMap | Descartes | 0.02 | 1.60 |
| HIPK2 | 0.0001068 | 2354 | GTEx | DepMap | Descartes | 0.51 | 5.35 |
| TLN1 | 0.0000862 | 2714 | GTEx | DepMap | Descartes | 1.45 | 27.36 |
| ITGB3 | 0.0000194 | 4827 | GTEx | DepMap | Descartes | 0.01 | 0.19 |
| MED12L | 0.0000087 | 5343 | GTEx | DepMap | Descartes | 0.01 | 0.18 |
| TRPC6 | 0.0000051 | 5530 | GTEx | DepMap | Descartes | 0.06 | 1.93 |
| UBASH3B | 0.0000034 | 5620 | GTEx | DepMap | Descartes | 0.04 | 1.08 |
| P2RX1 | -0.0000067 | 6356 | GTEx | DepMap | Descartes | 0.02 | 0.94 |
| TUBB1 | -0.0000089 | 6538 | GTEx | DepMap | Descartes | 0.01 | 1.02 |
Descartes Lyphoid markers
Top 50 marker genes of Lyphoid cells in the Decartes fetal adrenal single cell map (https://atlas.brotmanbaty.org/bbi/human-gene-expression-during-development/cell/lymphoid/in/adrenal)
Wilcoxon ranksum test P-value for gene set overrepresentation: 8.91e-01
Mean rank of genes in gene set: 6963
Median rank of genes in gene set: 8150
Rank on gene expression program of top 30 genes in gene set:
| Genes | Weight | Rank | GTEx | DepMap | Descartes | Mean.Counts | Mean.TPM |
|---|---|---|---|---|---|---|---|
| MSN | 0.0011295 | 264 | GTEx | DepMap | Descartes | 3.06 | 145.94 |
| ETS1 | 0.0007685 | 397 | GTEx | DepMap | Descartes | 1.63 | 60.18 |
| B2M | 0.0006107 | 489 | GTEx | DepMap | Descartes | 113.31 | 10383.87 |
| PRKCH | 0.0005885 | 514 | GTEx | DepMap | Descartes | 0.49 | 27.54 |
| SP100 | 0.0005551 | 541 | GTEx | DepMap | Descartes | 1.54 | 62.71 |
| ARHGDIB | 0.0004509 | 679 | GTEx | DepMap | Descartes | 4.07 | 697.67 |
| ABLIM1 | 0.0004415 | 691 | GTEx | DepMap | Descartes | 0.58 | 16.92 |
| ITPKB | 0.0003652 | 831 | GTEx | DepMap | Descartes | 0.26 | 8.72 |
| MBNL1 | 0.0002704 | 1104 | GTEx | DepMap | Descartes | 1.00 | 30.70 |
| PITPNC1 | 0.0002343 | 1240 | GTEx | DepMap | Descartes | 0.43 | 13.19 |
| ARID5B | 0.0002083 | 1389 | GTEx | DepMap | Descartes | 1.33 | 35.66 |
| LEF1 | 0.0001576 | 1719 | GTEx | DepMap | Descartes | 0.39 | 20.03 |
| FYN | 0.0001500 | 1795 | GTEx | DepMap | Descartes | 1.18 | 61.68 |
| TMSB10 | 0.0001100 | 2304 | GTEx | DepMap | Descartes | 70.51 | 27442.95 |
| CCND3 | 0.0000687 | 3073 | GTEx | DepMap | Descartes | 0.48 | 38.82 |
| WIPF1 | 0.0000290 | 4407 | GTEx | DepMap | Descartes | 0.46 | 21.59 |
| FOXP1 | 0.0000144 | 5075 | GTEx | DepMap | Descartes | 1.02 | 21.71 |
| MCTP2 | -0.0000124 | 6850 | GTEx | DepMap | Descartes | 0.06 | 1.33 |
| NCALD | -0.0000131 | 6922 | GTEx | DepMap | Descartes | 0.19 | 11.25 |
| SAMD3 | -0.0000196 | 7470 | GTEx | DepMap | Descartes | 0.05 | 2.64 |
| ARHGAP15 | -0.0000207 | 7549 | GTEx | DepMap | Descartes | 0.36 | 28.89 |
| SKAP1 | -0.0000359 | 8751 | GTEx | DepMap | Descartes | 0.08 | 9.30 |
| RCSD1 | -0.0000366 | 8796 | GTEx | DepMap | Descartes | 0.27 | 12.85 |
| CCL5 | -0.0000428 | 9228 | GTEx | DepMap | Descartes | 0.29 | 45.30 |
| SCML4 | -0.0000679 | 10575 | GTEx | DepMap | Descartes | 0.01 | 0.44 |
| BACH2 | -0.0000741 | 10779 | GTEx | DepMap | Descartes | 0.08 | 1.00 |
| ANKRD44 | -0.0000823 | 11070 | GTEx | DepMap | Descartes | 0.10 | 2.74 |
| PLEKHA2 | -0.0000839 | 11117 | GTEx | DepMap | Descartes | 0.14 | 4.76 |
| PDE3B | -0.0000969 | 11453 | GTEx | DepMap | Descartes | 0.03 | 0.57 |
| IKZF1 | -0.0000977 | 11473 | GTEx | DepMap | Descartes | 0.04 | 1.42 |
Below shows the ranks on this GEP for immune marker gene lists curated by CellTypist (https://www.celltypist.org/encyclopedia).
High ranks indicate this gene is a driver of this GEP.
These curated gene list are ranked by P-value (on this GEP) of their constituent genes.
The Mean Count column shows the mean read count in cells scoring highly (H > 50) on this gene expression program.
Endothelial cells: Endothelial cells (model markers)
single-layered lining cells that constitute the interior vasculature:
Wilcoxon ranksum test P-value for gene set overrepresentation: 3.10e-04
Mean rank of genes in gene set: 76.75
Rank on gene expression program of genes in gene set:
| Genes | Weight | Rank | GTEx | DepMap | Decartes | Mean.Counts | Mean.TPM |
|---|---|---|---|---|---|---|---|
| MMRN2 | 0.0048994 | 14 | GTEx | DepMap | Descartes | 1.27 | 60.96 |
| VWF | 0.0045265 | 21 | GTEx | DepMap | Descartes | 8.28 | 195.57 |
| JAM2 | 0.0019417 | 131 | GTEx | DepMap | Descartes | 0.87 | 43.71 |
| RAMP3 | 0.0018773 | 141 | GTEx | DepMap | Descartes | 2.42 | 410.11 |
Endothelial cells: Endothelial cells (curated markers)
single-layered lining cells that constitute the interior vasculature:
Wilcoxon ranksum test P-value for gene set overrepresentation: 1.39e-03
Mean rank of genes in gene set: 17.67
Rank on gene expression program of genes in gene set:
| Genes | Weight | Rank | GTEx | DepMap | Decartes | Mean.Counts | Mean.TPM |
|---|---|---|---|---|---|---|---|
| PLVAP | 0.0056084 | 5 | GTEx | DepMap | Descartes | 8.02 | 662.01 |
| CLDN5 | 0.0046273 | 20 | GTEx | DepMap | Descartes | 5.81 | 473.58 |
| SPARCL1 | 0.0039332 | 28 | GTEx | DepMap | Descartes | 10.67 | 834.11 |
B cells: Naive B cells (model markers)
mature B lymphocytes which express cell-surface IgM and IgD and have not been exposed to/activated by antigens:
Wilcoxon ranksum test P-value for gene set overrepresentation: 1.46e-02
Mean rank of genes in gene set: 687.5
Rank on gene expression program of genes in gene set:
| Genes | Weight | Rank | GTEx | DepMap | Decartes | Mean.Counts | Mean.TPM |
|---|---|---|---|---|---|---|---|
| YBX3 | 0.0009872 | 299 | GTEx | DepMap | Descartes | 2.73 | NA |
| CD74 | 0.0002785 | 1076 | GTEx | DepMap | Descartes | 18.22 | 1308.59 |