Program: 10. NB Cell Line #10 (Mixed).
Program description and justification of annotation: 10
Submit a comment on this gene expression program’s interpretation: CLICK
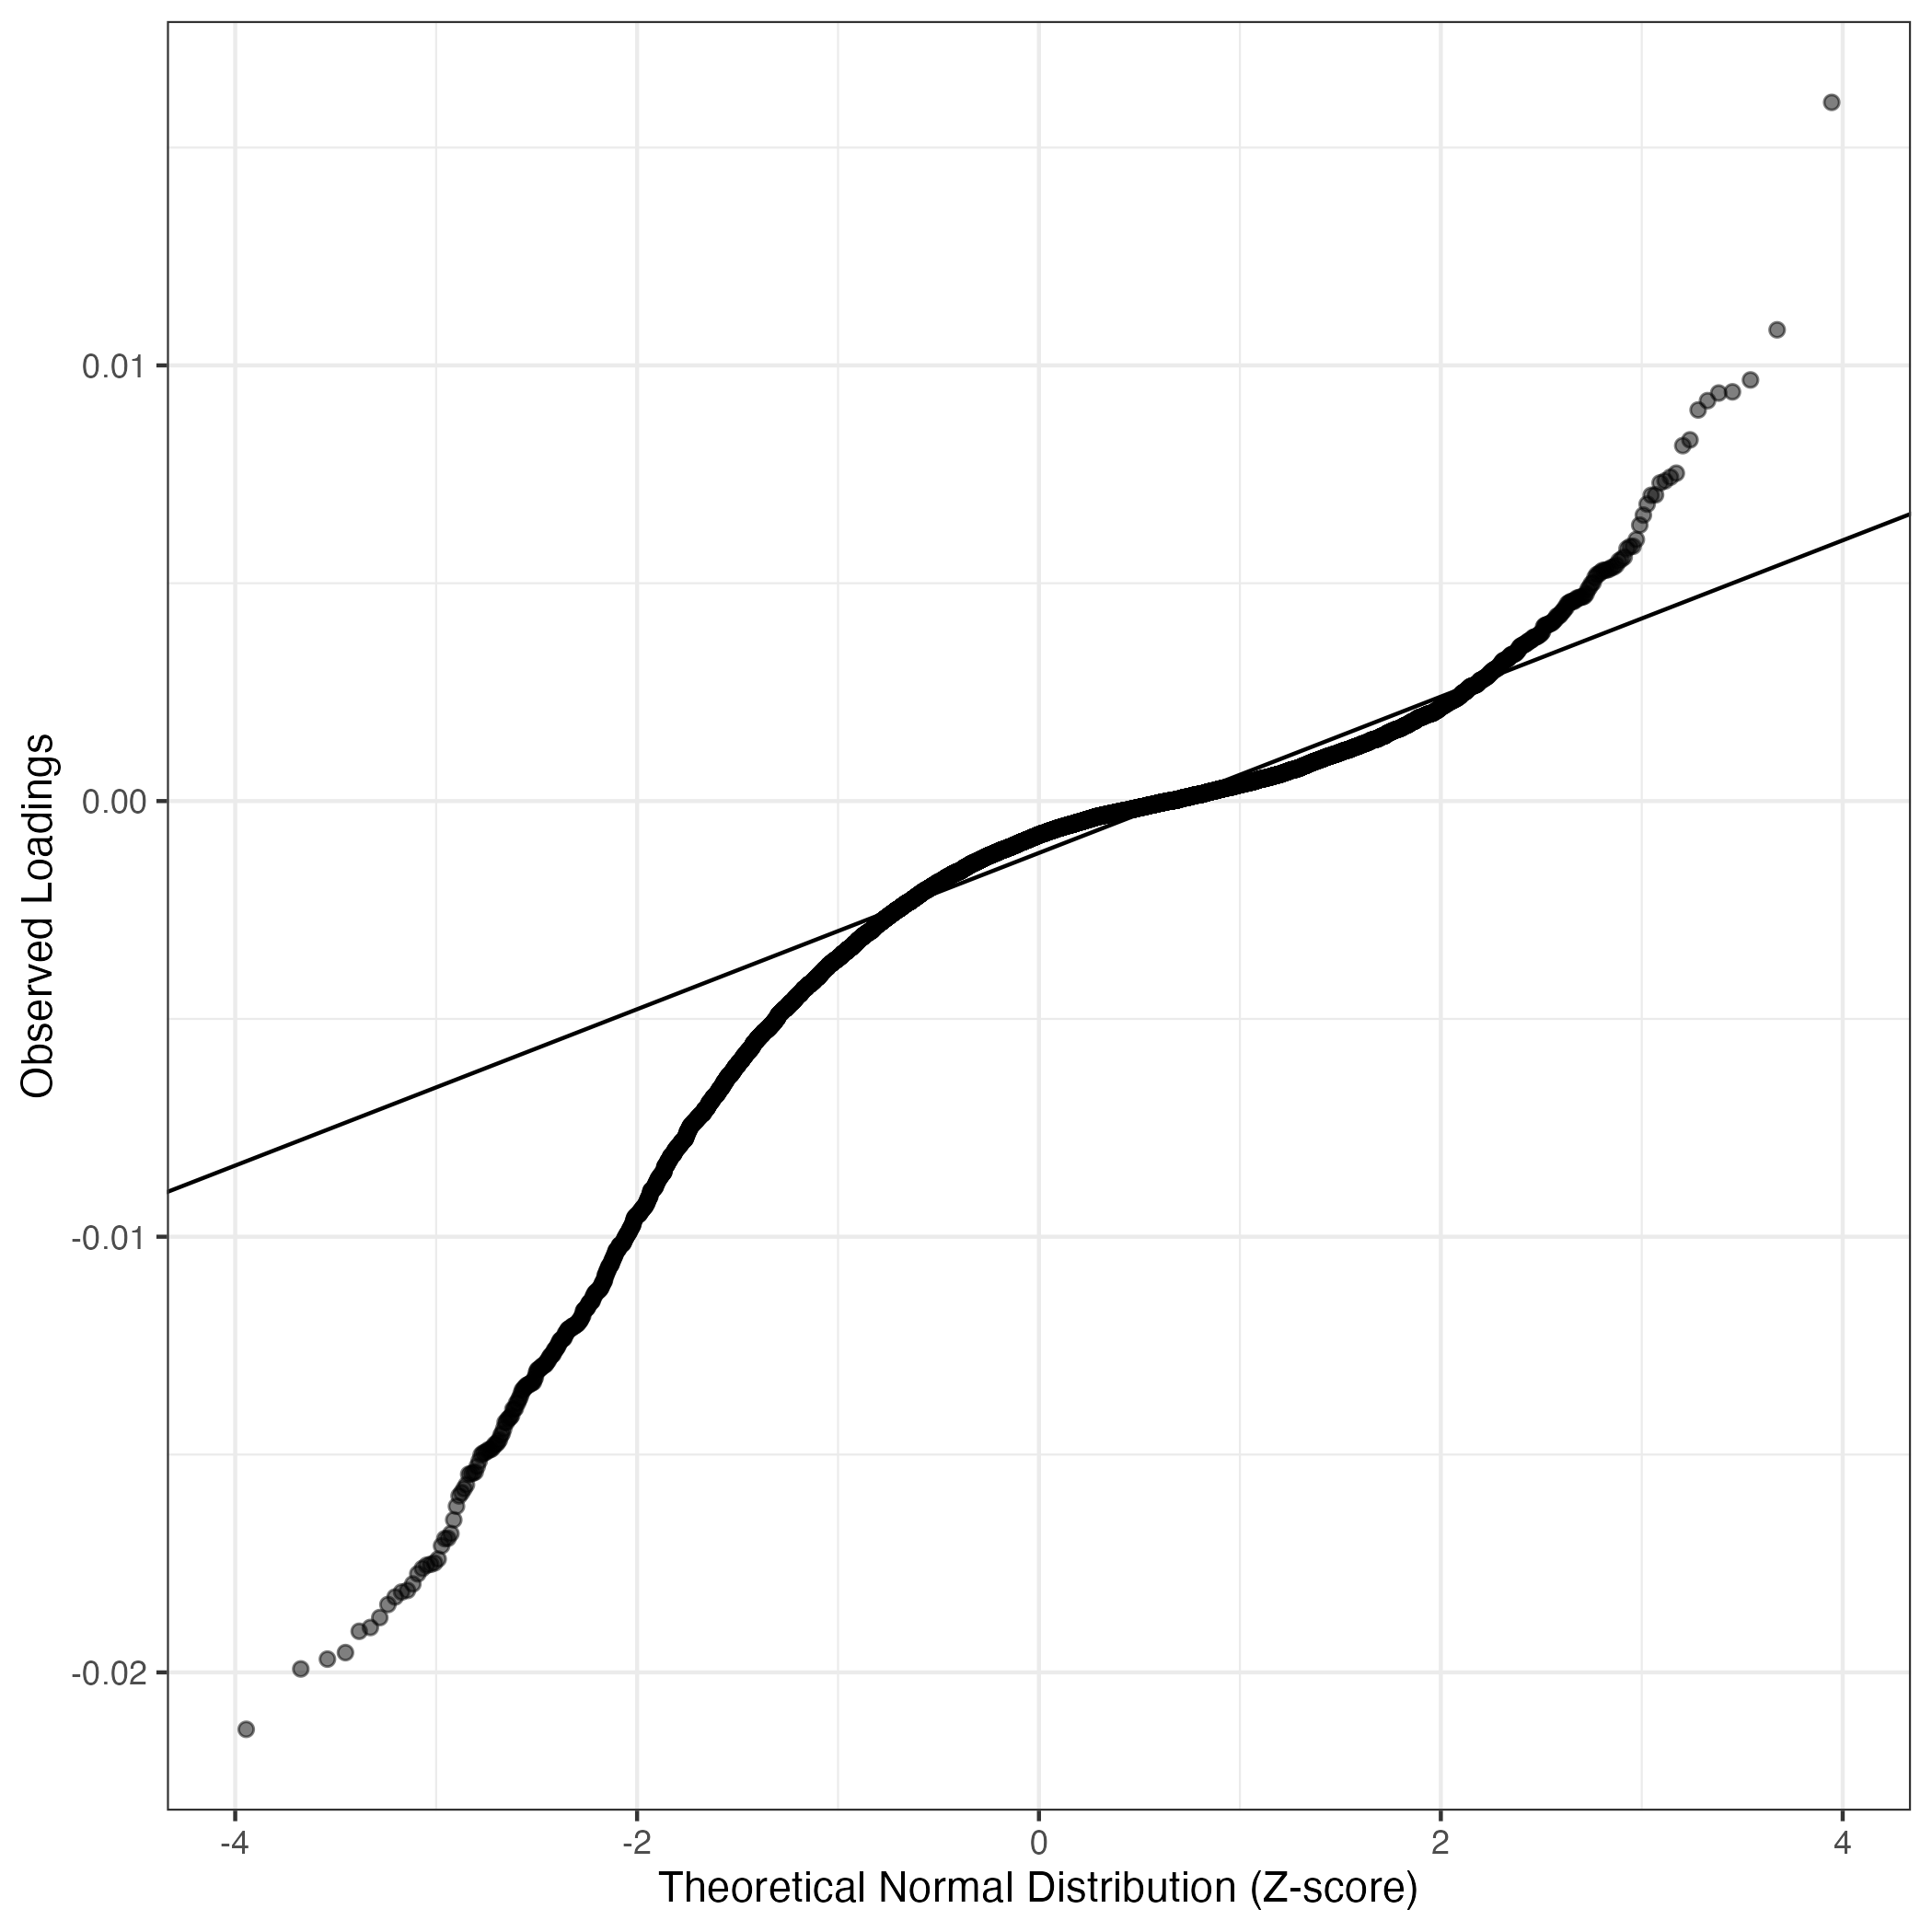
QQ-plot of gene loadings, averaged over both independent splits of the data
This plot highlights the relative contribution of each gene to the GEP
Top genes driving this program.
Note: Decartes website is buggy, try refreshing. Also, Decartes fetal adrenal data have been collected at specific time points (89-122 days), all possible cell types of interest may not be represented, do not overinterpret.
The Mean Count column shows the mean read count in cells scoring highly (H > 50) on this gene expression program.
| Gene | Loading | Gene.Name | GTEx | DepMap | Descartes | Mean.Counts | Mean.Tpm | |
|---|---|---|---|---|---|---|---|---|
| 1 | NEAT1 | 0.0160377 | nuclear paraspeckle assembly transcript 1 | GTEx | DepMap | Descartes | 70.27 | 243.50 |
| 2 | FBN1 | 0.0108167 | fibrillin 1 | GTEx | DepMap | Descartes | 3.31 | 20.87 |
| 3 | GPNMB | 0.0096662 | glycoprotein nmb | GTEx | DepMap | Descartes | 2.06 | 48.20 |
| 4 | XIST | 0.0093931 | X inactive specific transcript | GTEx | DepMap | Descartes | 5.00 | 19.28 |
| 5 | DST | 0.0093653 | dystonin | GTEx | DepMap | Descartes | 8.01 | 25.60 |
| 6 | PXDN | 0.0091903 | peroxidasin | GTEx | DepMap | Descartes | 3.41 | 31.36 |
| 7 | LAMB1 | 0.0089770 | laminin subunit beta 1 | GTEx | DepMap | Descartes | 3.00 | 38.98 |
| 8 | LRP1B | 0.0082905 | LDL receptor related protein 1B | GTEx | DepMap | Descartes | 0.64 | 3.80 |
| 9 | MALAT1 | 0.0081589 | metastasis associated lung adenocarcinoma transcript 1 | GTEx | DepMap | Descartes | 363.11 | 3532.25 |
| 10 | SYT4 | 0.0075257 | synaptotagmin 4 | GTEx | DepMap | Descartes | 5.05 | 73.42 |
| 11 | COL3A1 | 0.0074350 | collagen type III alpha 1 chain | GTEx | DepMap | Descartes | 7.28 | 101.15 |
| 12 | MRC2 | 0.0073489 | mannose receptor C type 2 | GTEx | DepMap | Descartes | 1.36 | 15.79 |
| 13 | PCOLCE | 0.0073031 | procollagen C-endopeptidase enhancer | GTEx | DepMap | Descartes | 9.00 | 301.77 |
| 14 | TPBG | 0.0070279 | trophoblast glycoprotein | GTEx | DepMap | Descartes | 2.52 | 26.26 |
| 15 | TSPAN8 | 0.0070188 | tetraspanin 8 | GTEx | DepMap | Descartes | 1.97 | 77.81 |
| 16 | SEMA3C | 0.0068156 | semaphorin 3C | GTEx | DepMap | Descartes | 1.80 | 26.81 |
| 17 | PSAP | 0.0065634 | prosaposin | GTEx | DepMap | Descartes | 3.88 | 89.42 |
| 18 | AHNAK | 0.0063343 | AHNAK nucleoprotein | GTEx | DepMap | Descartes | 8.15 | 29.81 |
| 19 | EMILIN1 | 0.0060039 | elastin microfibril interfacer 1 | GTEx | DepMap | Descartes | 2.75 | 46.25 |
| 20 | LRP1 | 0.0058483 | LDL receptor related protein 1 | GTEx | DepMap | Descartes | 1.12 | 5.20 |
| 21 | C7 | 0.0058403 | complement C7 | GTEx | DepMap | Descartes | 3.97 | 36.83 |
| 22 | ADAM22 | 0.0057910 | ADAM metallopeptidase domain 22 | GTEx | DepMap | Descartes | 1.44 | 8.40 |
| 23 | PCDHGA7 | 0.0055999 | protocadherin gamma subfamily A, 7 | GTEx | DepMap | Descartes | 0.21 | 3.18 |
| 24 | LTBP1 | 0.0055519 | latent transforming growth factor beta binding protein 1 | GTEx | DepMap | Descartes | 1.82 | 20.51 |
| 25 | C1QTNF6 | 0.0055102 | C1q and TNF related 6 | GTEx | DepMap | Descartes | 0.50 | 5.66 |
| 26 | APLP2 | 0.0054178 | amyloid beta precursor like protein 2 | GTEx | DepMap | Descartes | 5.08 | 85.97 |
| 27 | LGR5 | 0.0053743 | leucine rich repeat containing G protein-coupled receptor 5 | GTEx | DepMap | Descartes | 0.93 | 12.63 |
| 28 | LAMA5 | 0.0053591 | laminin subunit alpha 5 | GTEx | DepMap | Descartes | 0.78 | 4.99 |
| 29 | CLU | 0.0053231 | clusterin | GTEx | DepMap | Descartes | 4.04 | 93.42 |
| 30 | TM7SF2 | 0.0053045 | transmembrane 7 superfamily member 2 | GTEx | DepMap | Descartes | 2.11 | 55.21 |
| 31 | PRKCA | 0.0052970 | protein kinase C alpha | GTEx | DepMap | Descartes | 2.33 | 18.44 |
| 32 | TRIM56 | 0.0052932 | tripartite motif containing 56 | GTEx | DepMap | Descartes | 0.54 | 4.42 |
| 33 | XYLT1 | 0.0052554 | xylosyltransferase 1 | GTEx | DepMap | Descartes | 0.62 | 4.00 |
| 34 | RNF213 | 0.0052103 | ring finger protein 213 | GTEx | DepMap | Descartes | 1.97 | 6.51 |
| 35 | FSTL1 | 0.0051975 | follistatin like 1 | GTEx | DepMap | Descartes | 1.85 | 22.71 |
| 36 | F10 | 0.0051291 | coagulation factor X | GTEx | DepMap | Descartes | 0.22 | 9.42 |
| 37 | APOE | 0.0050132 | apolipoprotein E | GTEx | DepMap | Descartes | 4.08 | 209.02 |
| 38 | MEG3 | 0.0049870 | maternally expressed 3 | GTEx | DepMap | Descartes | 5.32 | 12.83 |
| 39 | CCNL2 | 0.0049105 | cyclin L2 | GTEx | DepMap | Descartes | 1.24 | 25.39 |
| 40 | LGALS3BP | 0.0048557 | galectin 3 binding protein | GTEx | DepMap | Descartes | 5.18 | 142.45 |
| 41 | CTSD | 0.0047632 | cathepsin D | GTEx | DepMap | Descartes | 3.07 | 91.86 |
| 42 | LTBP3 | 0.0047108 | latent transforming growth factor beta binding protein 3 | GTEx | DepMap | Descartes | 1.18 | 15.14 |
| 43 | MATN2 | 0.0046903 | matrilin 2 | GTEx | DepMap | Descartes | 0.61 | 11.27 |
| 44 | UNC5C | 0.0046808 | unc-5 netrin receptor C | GTEx | DepMap | Descartes | 1.52 | 9.35 |
| 45 | AKAP6 | 0.0046780 | A-kinase anchoring protein 6 | GTEx | DepMap | Descartes | 0.73 | 3.00 |
| 46 | VTN | 0.0046583 | vitronectin | GTEx | DepMap | Descartes | 0.25 | 8.58 |
| 47 | SSC5D | 0.0046577 | scavenger receptor cysteine rich family member with 5 domains | GTEx | DepMap | Descartes | 0.25 | 3.92 |
| 48 | NRP1 | 0.0046235 | neuropilin 1 | GTEx | DepMap | Descartes | 1.30 | 14.92 |
| 49 | LAMB2 | 0.0045877 | laminin subunit beta 2 | GTEx | DepMap | Descartes | 0.47 | 5.23 |
| 50 | CYBA | 0.0045829 | cytochrome b-245 alpha chain | GTEx | DepMap | Descartes | 3.19 | 126.67 |
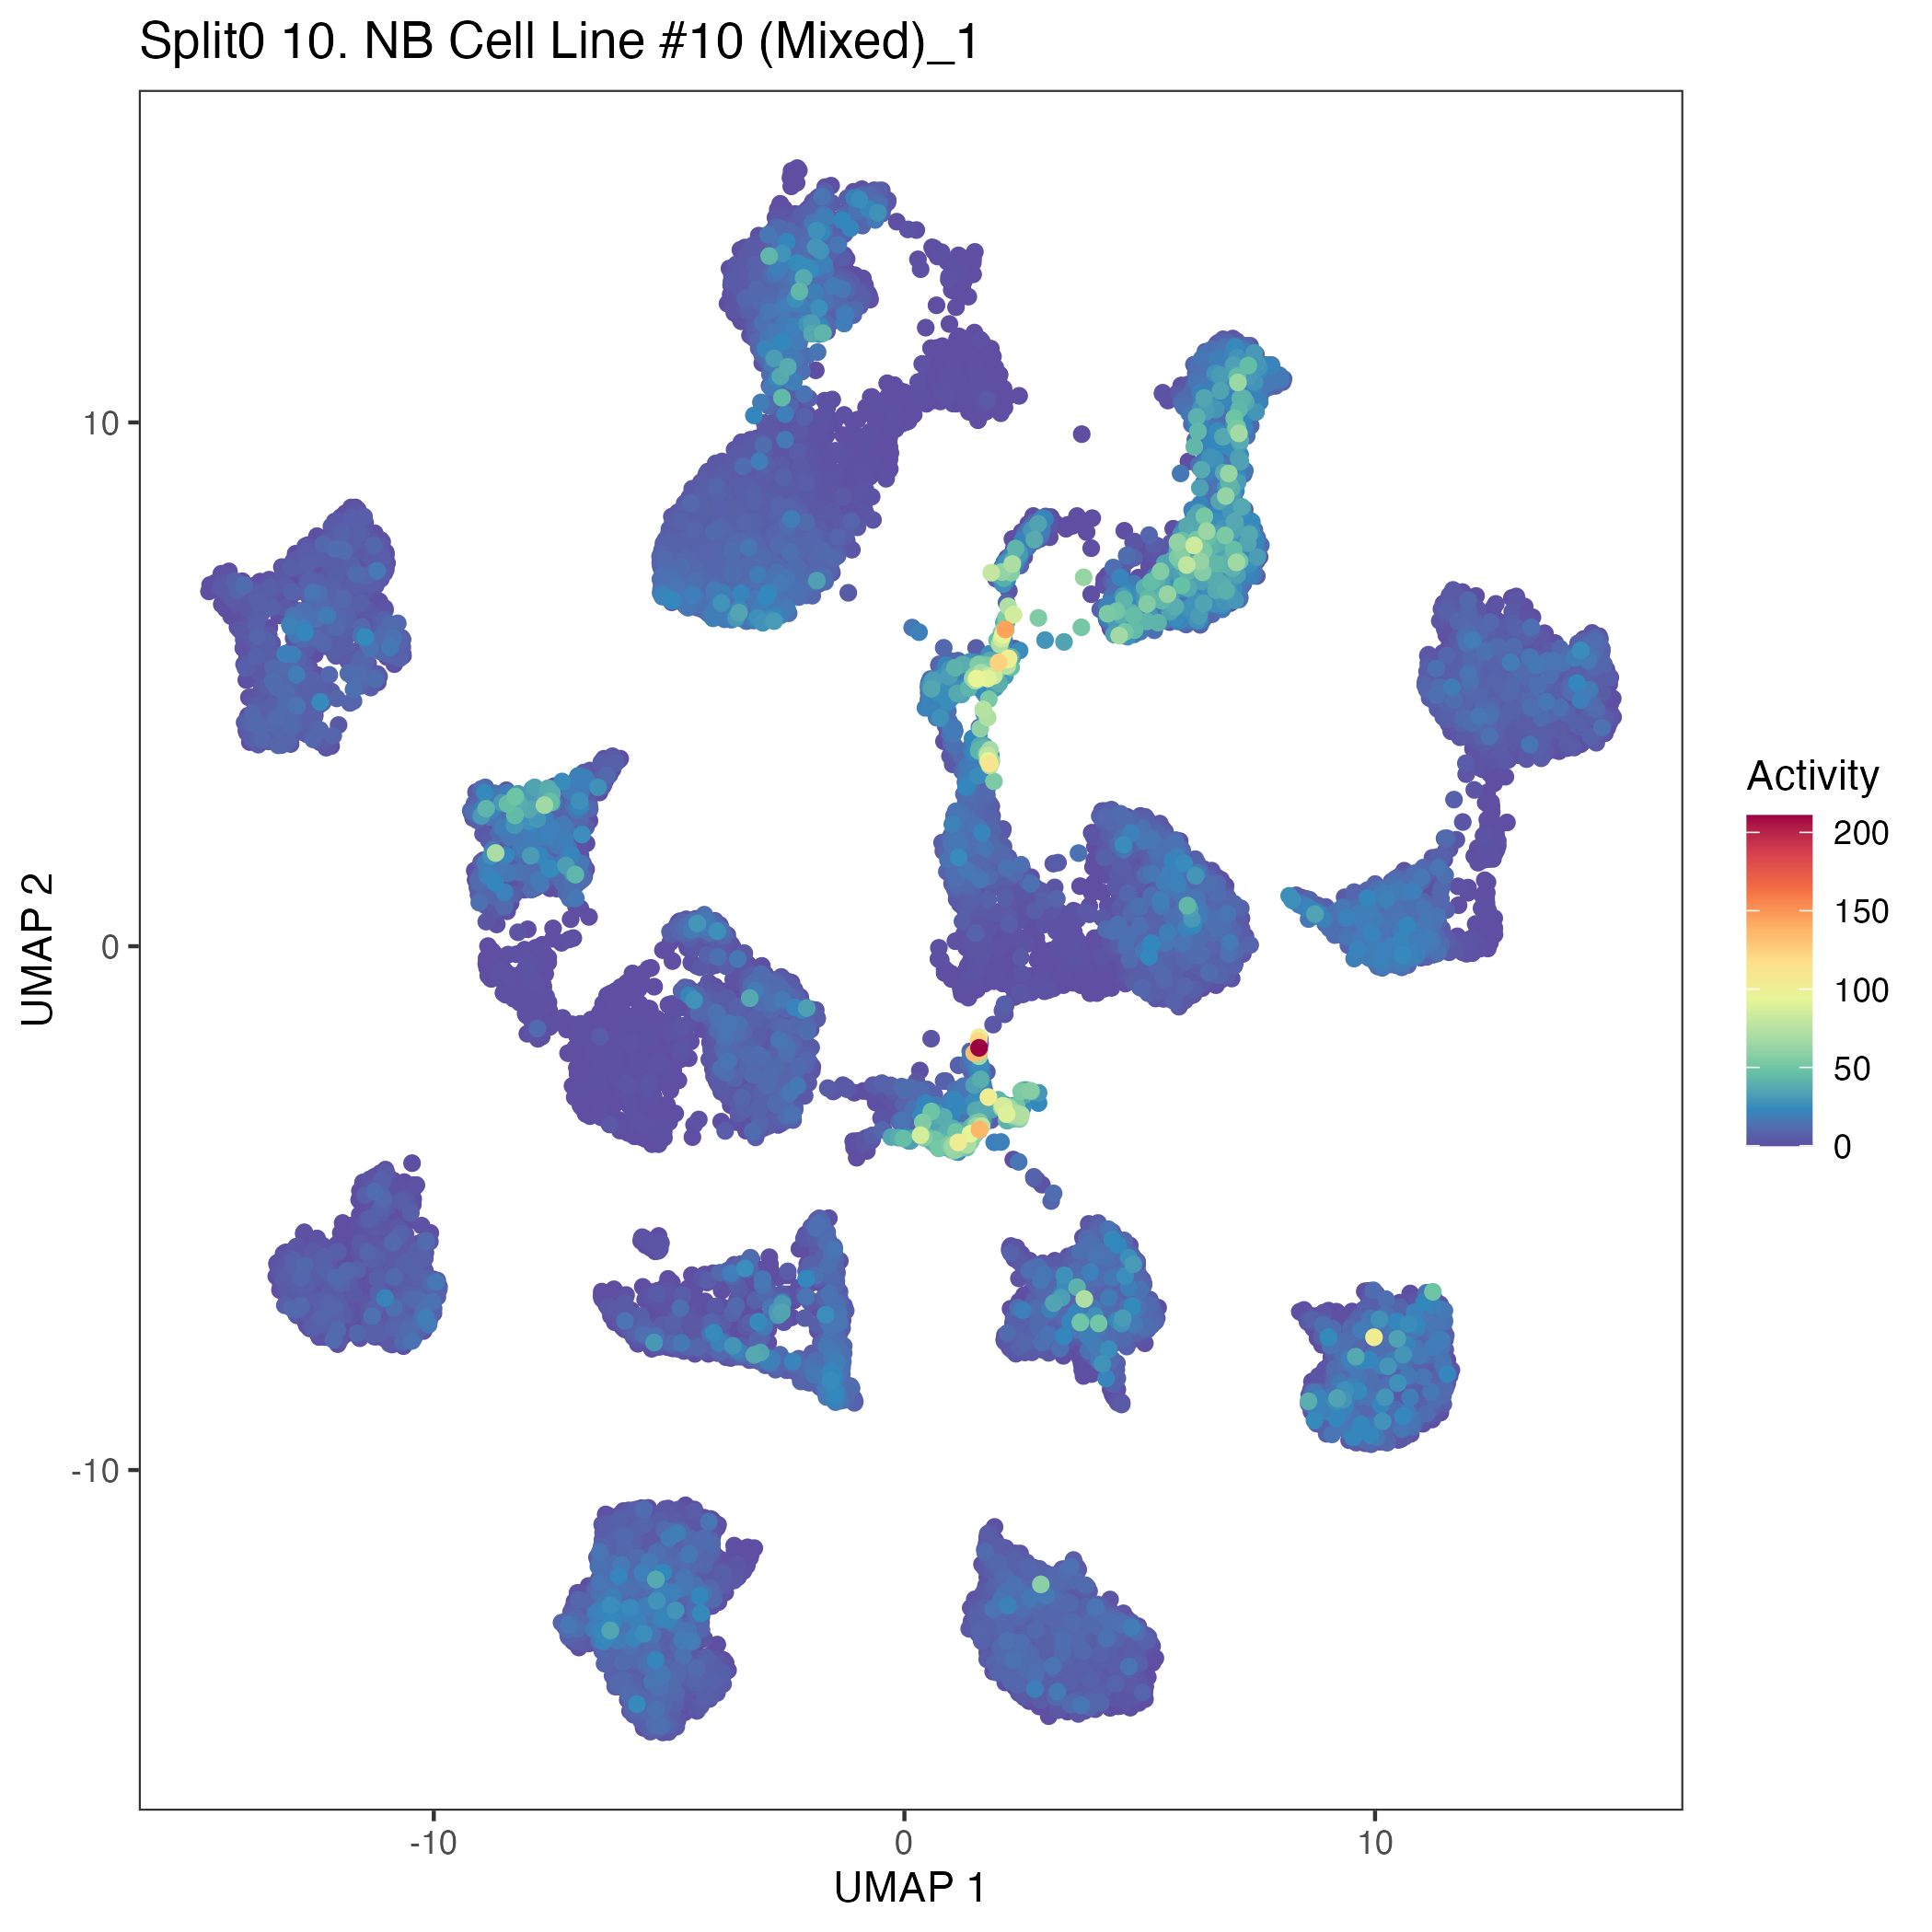
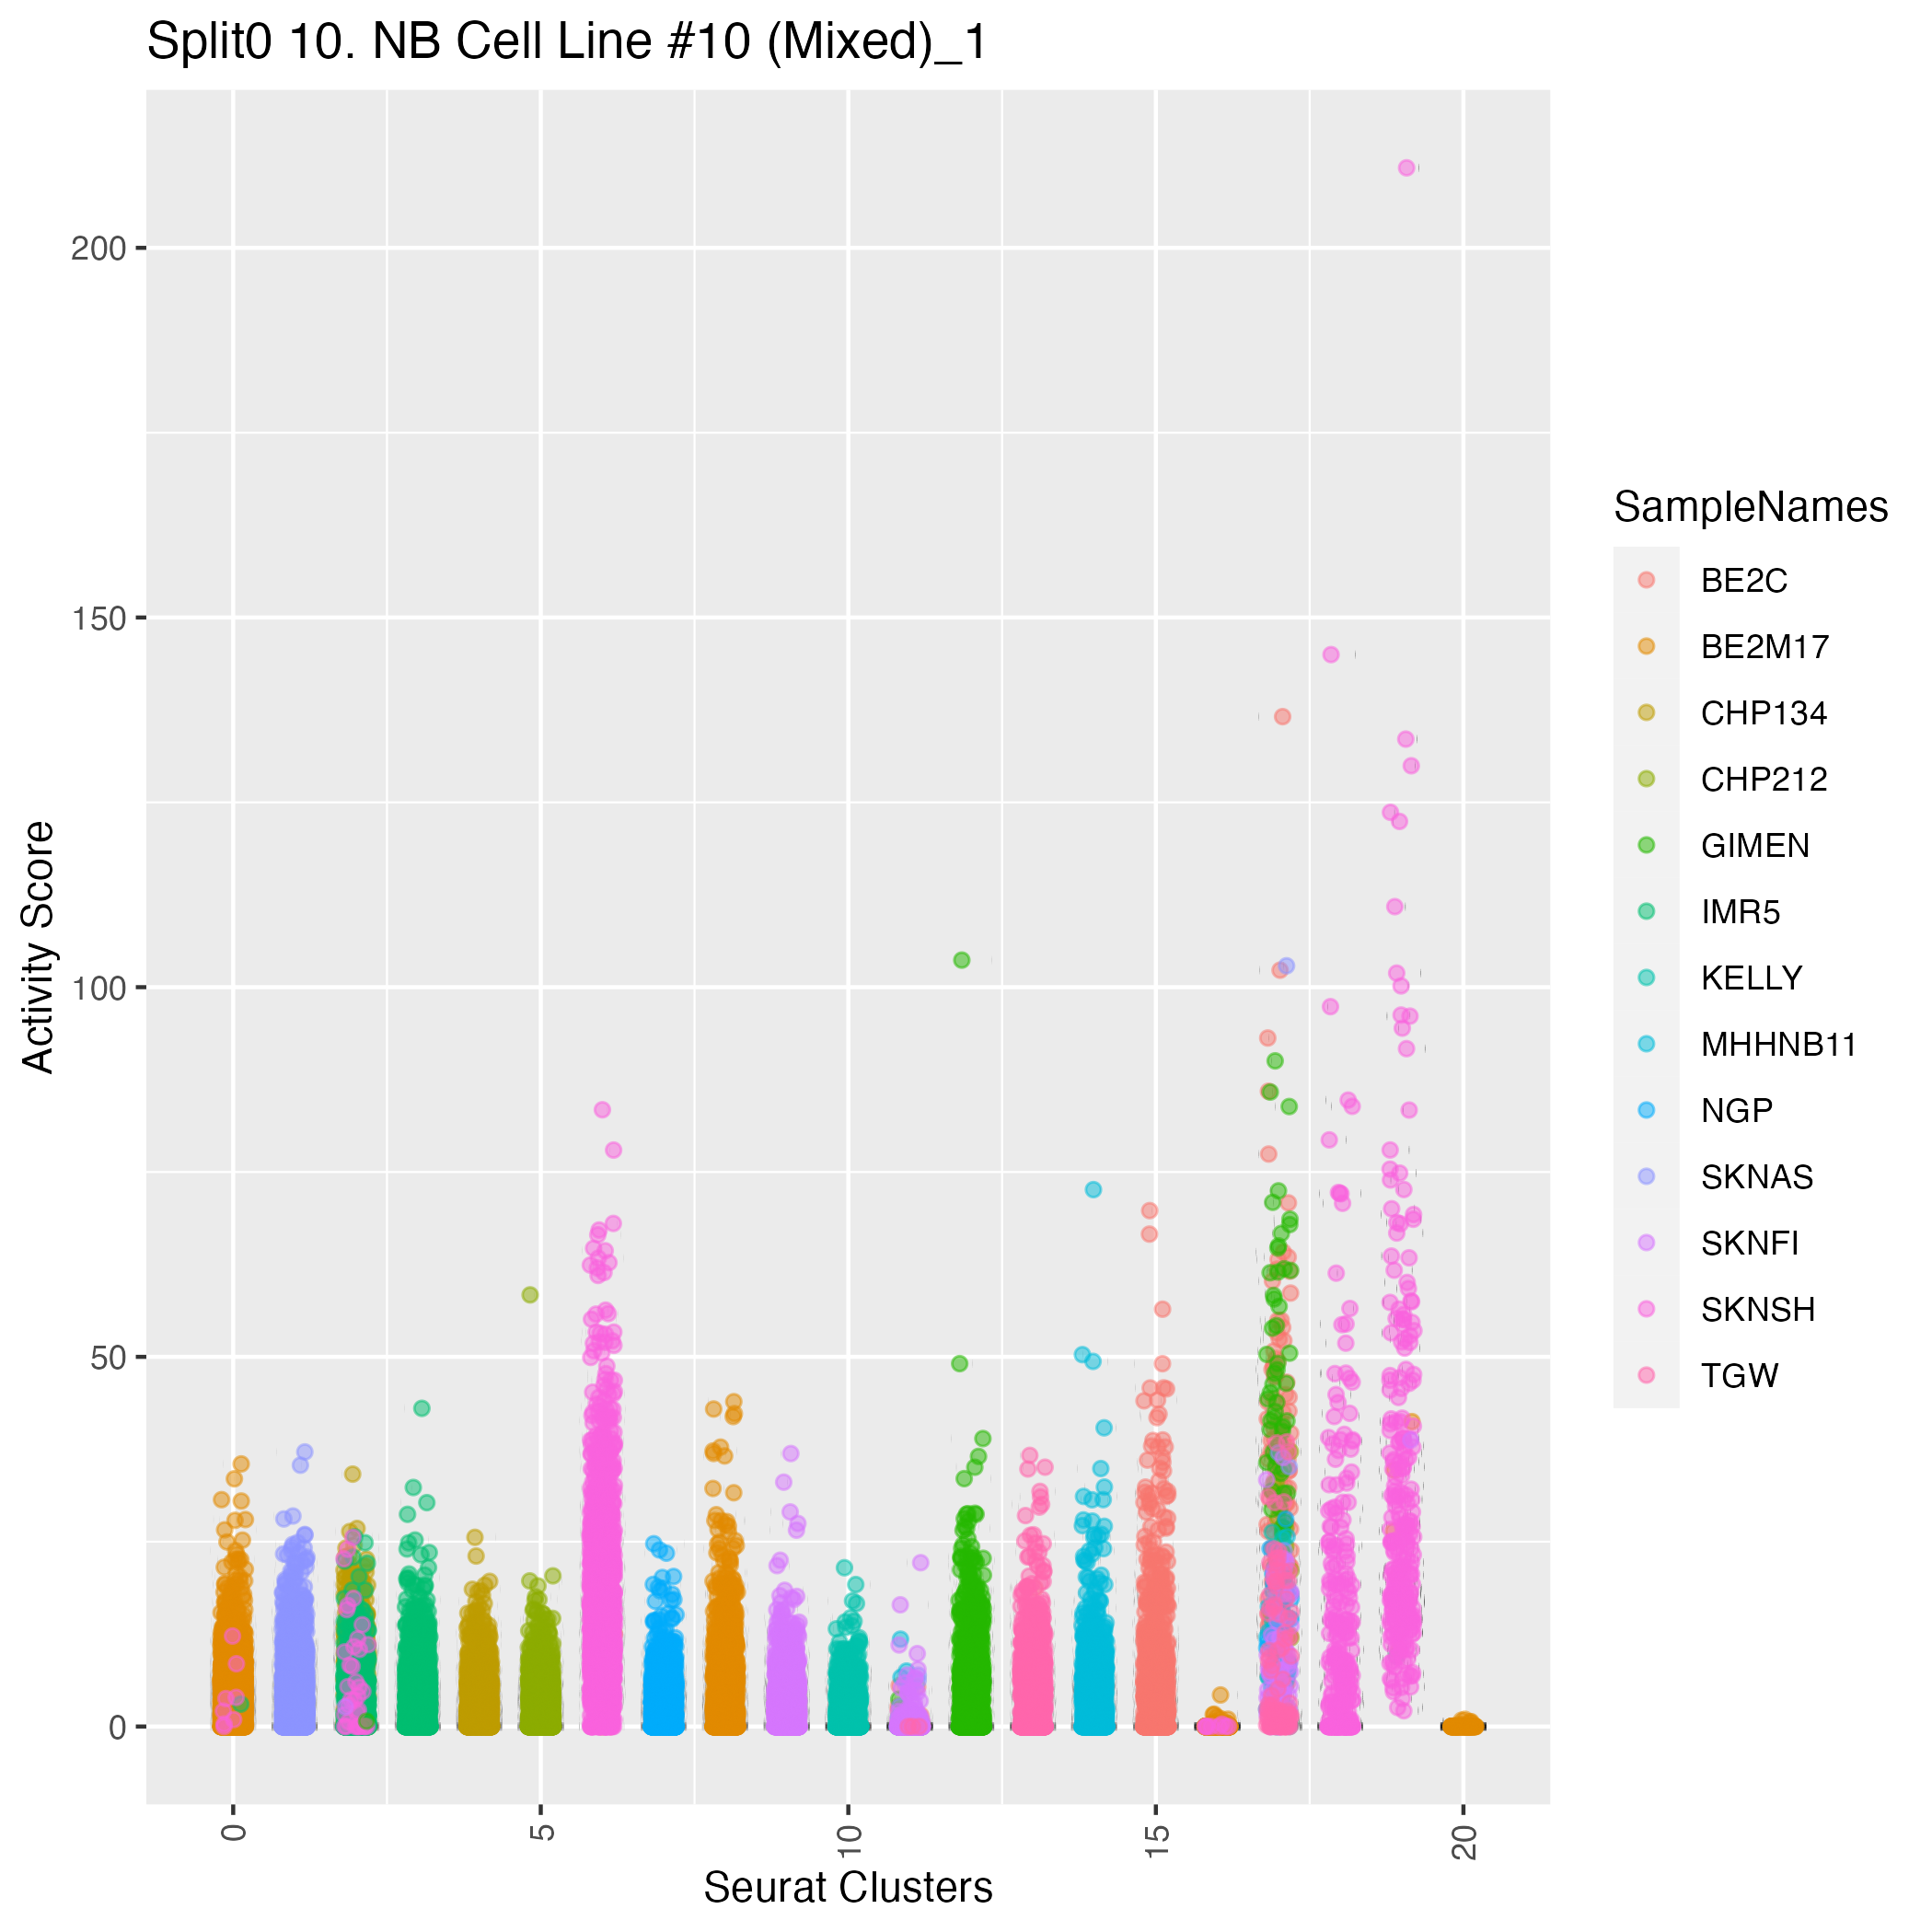
UMAP plots showing activity of gene expression program identified in community:10. NB Cell Line #10 (Mixed)
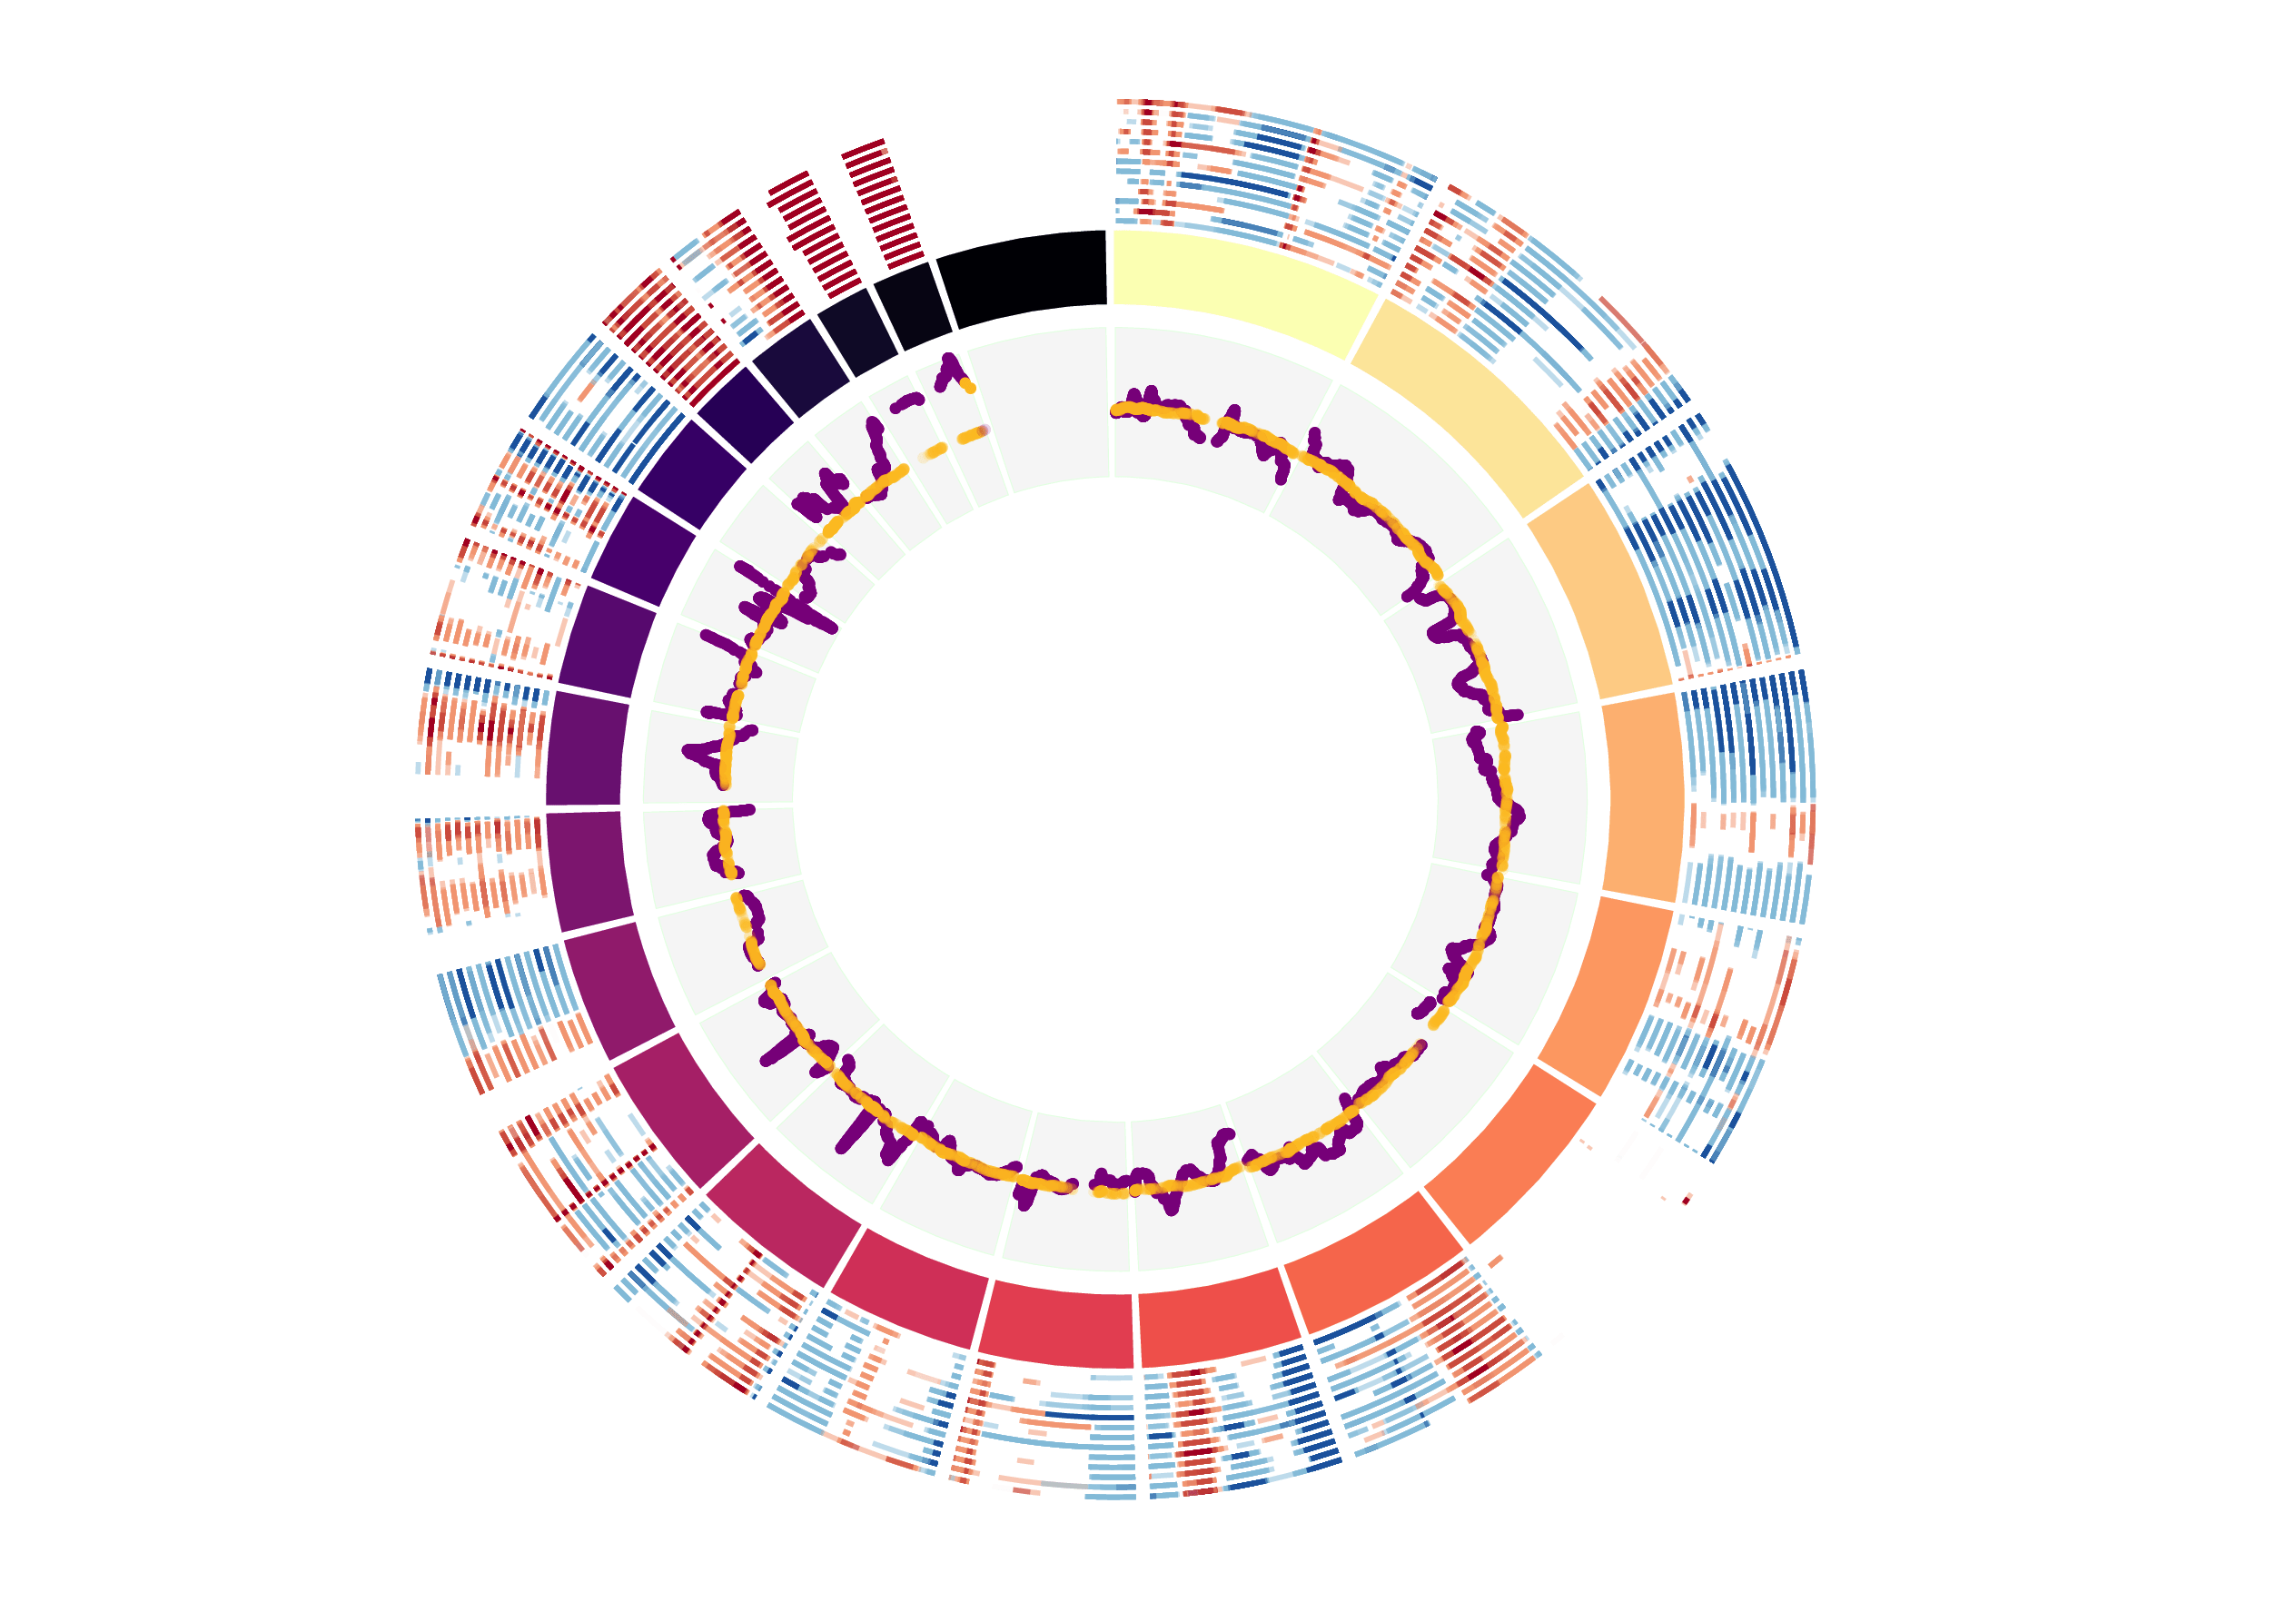
CNV Data procured from inferCNV.
Outer tracks are putative CNV regions (gains = red, losses = blue) for each patient
Inner track is expression data representing:
The top cells expressing this GEP (purple)
Random cells (n =50) from the reference set used in inferCNV (orange)
Gene set Enrichments for this program, caculated from top 50 genes
mSigDB Cell Types Gene Set:
| P-value | OR | Lower 95% CI | FDR | FWER | Genes Found | Gene Set Size | |
|---|---|---|---|---|---|---|---|
| DESCARTES_FETAL_THYMUS_STROMAL_CELLS | 1.10e-10 | 24.58 | 10.73 | 1.85e-08 | 7.39e-08 | 10FBN1, COL3A1, MRC2, PCOLCE, SEMA3C, EMILIN1, LRP1, FSTL1, LGALS3BP, SSC5D |
137 |
| CUI_DEVELOPING_HEART_C3_FIBROBLAST_LIKE_CELL | 6.54e-10 | 25.38 | 10.58 | 7.32e-08 | 4.39e-07 | 9FBN1, LAMB1, MRC2, PCOLCE, LRP1, C7, FSTL1, MEG3, MATN2 |
117 |
| RUBENSTEIN_SKELETAL_MUSCLE_FBN1_FAP_CELLS | 2.84e-12 | 17.68 | 8.71 | 1.31e-09 | 1.91e-09 | 14FBN1, GPNMB, DST, COL3A1, PCOLCE, SEMA3C, PSAP, AHNAK, LRP1, CLU, FSTL1, F10, MEG3, LAMB2 |
289 |
| TRAVAGLINI_LUNG_ADVENTITIAL_FIBROBLAST_CELL | 3.90e-12 | 17.24 | 8.49 | 1.31e-09 | 2.62e-09 | 14FBN1, GPNMB, COL3A1, MRC2, PCOLCE, SEMA3C, LRP1, C7, FSTL1, MEG3, LGALS3BP, MATN2, NRP1, LAMB2 |
296 |
| MENON_FETAL_KIDNEY_3_STROMAL_CELLS | 7.32e-07 | 22.70 | 7.67 | 3.51e-05 | 4.91e-04 | 6XIST, DST, PXDN, COL3A1, FSTL1, MEG3 |
81 |
| HU_FETAL_RETINA_RPE | 5.57e-11 | 15.75 | 7.59 | 1.24e-08 | 3.73e-08 | 13NEAT1, FBN1, GPNMB, PXDN, SEMA3C, PSAP, LTBP1, APLP2, FSTL1, APOE, CTSD, LTBP3, LAMB2 |
292 |
| RUBENSTEIN_SKELETAL_MUSCLE_FAP_CELLS | 2.68e-08 | 16.14 | 6.79 | 2.08e-06 | 1.80e-05 | 9GPNMB, MALAT1, COL3A1, PCOLCE, PSAP, LRP1, FSTL1, MEG3, LGALS3BP |
179 |
| AIZARANI_LIVER_C21_STELLATE_CELLS_1 | 5.33e-08 | 14.83 | 6.24 | 3.58e-06 | 3.58e-05 | 9FBN1, LAMB1, COL3A1, PCOLCE, LRP1, C7, FSTL1, LGALS3BP, MATN2 |
194 |
| GAO_LARGE_INTESTINE_24W_C1_DCLK1POS_PROGENITOR | 2.37e-06 | 18.31 | 6.23 | 9.96e-05 | 1.59e-03 | 6COL3A1, MRC2, PCOLCE, C7, C1QTNF6, MATN2 |
99 |
| GAO_LARGE_INTESTINE_ADULT_CJ_IMMUNE_CELLS | 3.42e-10 | 10.94 | 5.51 | 4.58e-08 | 2.29e-07 | 15FBN1, PXDN, COL3A1, MRC2, PCOLCE, EMILIN1, LRP1, LAMA5, FSTL1, F10, APOE, MEG3, UNC5C, NRP1, LAMB2 |
505 |
| FAN_OVARY_CL5_HEALTHY_SELECTABLE_FOLLICLE_THECAL_CELL | 2.80e-08 | 11.49 | 5.25 | 2.08e-06 | 1.88e-05 | 11PXDN, LAMB1, COL3A1, PCOLCE, EMILIN1, C7, FSTL1, APOE, MEG3, MATN2, NRP1 |
318 |
| HU_FETAL_RETINA_FIBROBLAST | 1.78e-08 | 10.59 | 4.99 | 1.71e-06 | 1.20e-05 | 12FBN1, PXDN, LAMB1, COL3A1, MRC2, PCOLCE, TPBG, AHNAK, EMILIN1, FSTL1, LAMB2, CYBA |
385 |
| FAN_OVARY_CL6_PUTATIVE_EARLY_ATRETIC_FOLLICLE_THECAL_CELL_2 | 1.86e-07 | 10.78 | 4.76 | 1.04e-05 | 1.25e-04 | 10COL3A1, PSAP, EMILIN1, C7, FSTL1, APOE, MEG3, LGALS3BP, CTSD, MATN2 |
300 |
| CUI_DEVELOPING_HEART_TRABECULAR_ATRIAL_CARDIOMYOCYTE | 5.80e-06 | 11.82 | 4.43 | 2.18e-04 | 3.89e-03 | 7DST, MALAT1, PSAP, LTBP1, APLP2, LGALS3BP, LAMB2 |
179 |
| MENON_FETAL_KIDNEY_4_PODOCYTES | 1.43e-05 | 10.23 | 3.83 | 4.58e-04 | 9.63e-03 | 7NEAT1, DST, MALAT1, PSAP, AHNAK, APLP2, CCNL2 |
206 |
| BUSSLINGER_ESOPHAGEAL_QUIESCENT_BASAL_CELLS | 2.38e-04 | 14.88 | 3.79 | 5.32e-03 | 1.60e-01 | 4GPNMB, DST, LAMA5, CLU |
77 |
| AIZARANI_LIVER_C33_STELLATE_CELLS_2 | 1.33e-04 | 11.47 | 3.49 | 3.30e-03 | 8.91e-02 | 5DST, PXDN, LAMB1, COL3A1, C7 |
126 |
| MANNO_MIDBRAIN_NEUROTYPES_HPERIC | 1.17e-07 | 6.87 | 3.47 | 7.15e-06 | 7.87e-05 | 15FBN1, GPNMB, PXDN, LAMB1, COL3A1, MRC2, PCOLCE, EMILIN1, LRP1, RNF213, FSTL1, APOE, LGALS3BP, LAMB2, CYBA |
795 |
| LAKE_ADULT_KIDNEY_C26_MESANGIAL_CELLS | 6.36e-05 | 9.97 | 3.42 | 1.78e-03 | 4.27e-02 | 6NEAT1, DST, AHNAK, C7, PRKCA, UNC5C |
177 |
| CUI_DEVELOPING_HEART_SMOOTH_MUSCLE_CELL | 8.97e-04 | 17.71 | 3.40 | 1.67e-02 | 6.02e-01 | 3COL3A1, PCOLCE, F10 |
48 |
Dowload full table
mSigDB Hallmark Gene Sets:
| P-value | OR | Lower 95% CI | FDR | FWER | Genes Found | Gene Set Size | |
|---|---|---|---|---|---|---|---|
| HALLMARK_ANGIOGENESIS | 1.18e-05 | 33.91 | 8.38 | 2.97e-04 | 5.91e-04 | 4COL3A1, FSTL1, VTN, NRP1 |
36 |
| HALLMARK_EPITHELIAL_MESENCHYMAL_TRANSITION | 1.19e-05 | 10.54 | 3.95 | 2.97e-04 | 5.94e-04 | 7FBN1, DST, COL3A1, PCOLCE, LRP1, FSTL1, MATN2 |
200 |
| HALLMARK_COAGULATION | 2.09e-03 | 8.11 | 2.09 | 3.05e-02 | 1.05e-01 | 4FBN1, LRP1, CLU, F10 |
138 |
| HALLMARK_UV_RESPONSE_DN | 2.44e-03 | 7.76 | 2.00 | 3.05e-02 | 1.22e-01 | 4COL3A1, LTBP1, PRKCA, NRP1 |
144 |
| HALLMARK_HEDGEHOG_SIGNALING | 8.94e-03 | 15.30 | 1.73 | 7.45e-02 | 4.47e-01 | 2UNC5C, NRP1 |
36 |
| HALLMARK_COMPLEMENT | 7.71e-03 | 5.55 | 1.44 | 7.45e-02 | 3.85e-01 | 4LRP1, CLU, F10, CTSD |
200 |
| HALLMARK_CHOLESTEROL_HOMEOSTASIS | 3.47e-02 | 7.23 | 0.84 | 2.48e-01 | 1.00e+00 | 2CLU, TM7SF2 |
74 |
| HALLMARK_XENOBIOTIC_METABOLISM | 4.35e-02 | 4.05 | 0.80 | 2.72e-01 | 1.00e+00 | 3F10, APOE, VTN |
200 |
| HALLMARK_PROTEIN_SECRETION | 5.52e-02 | 5.54 | 0.64 | 3.07e-01 | 1.00e+00 | 2DST, TSPAN8 |
96 |
| HALLMARK_IL2_STAT5_SIGNALING | 1.83e-01 | 2.64 | 0.31 | 5.78e-01 | 1.00e+00 | 2AHNAK, NRP1 |
199 |
| HALLMARK_HYPOXIA | 1.85e-01 | 2.63 | 0.31 | 5.78e-01 | 1.00e+00 | 2TPBG, PRKCA |
200 |
| HALLMARK_ADIPOGENESIS | 1.85e-01 | 2.63 | 0.31 | 5.78e-01 | 1.00e+00 | 2APLP2, APOE |
200 |
| HALLMARK_MYOGENESIS | 1.85e-01 | 2.63 | 0.31 | 5.78e-01 | 1.00e+00 | 2COL3A1, CLU |
200 |
| HALLMARK_INTERFERON_GAMMA_RESPONSE | 1.85e-01 | 2.63 | 0.31 | 5.78e-01 | 1.00e+00 | 2RNF213, LGALS3BP |
200 |
| HALLMARK_KRAS_SIGNALING_UP | 1.85e-01 | 2.63 | 0.31 | 5.78e-01 | 1.00e+00 | 2GPNMB, NRP1 |
200 |
| HALLMARK_NOTCH_SIGNALING | 1.20e-01 | 8.23 | 0.20 | 5.78e-01 | 1.00e+00 | 1PRKCA |
32 |
| HALLMARK_INTERFERON_ALPHA_RESPONSE | 3.20e-01 | 2.66 | 0.07 | 9.41e-01 | 1.00e+00 | 1LGALS3BP |
97 |
| HALLMARK_PEROXISOME | 3.39e-01 | 2.48 | 0.06 | 9.41e-01 | 1.00e+00 | 1SEMA3C |
104 |
| HALLMARK_FATTY_ACID_METABOLISM | 4.66e-01 | 1.62 | 0.04 | 9.77e-01 | 1.00e+00 | 1XIST |
158 |
| HALLMARK_APOPTOSIS | 4.72e-01 | 1.59 | 0.04 | 9.77e-01 | 1.00e+00 | 1CLU |
161 |
Dowload full table
KEGG Pathways:
| P-value | OR | Lower 95% CI | FDR | FWER | Genes Found | Gene Set Size | |
|---|---|---|---|---|---|---|---|
| KEGG_ECM_RECEPTOR_INTERACTION | 1.93e-05 | 17.57 | 5.30 | 3.59e-03 | 3.59e-03 | 5LAMB1, COL3A1, LAMA5, VTN, LAMB2 |
84 |
| KEGG_FOCAL_ADHESION | 1.20e-04 | 8.83 | 3.04 | 1.12e-02 | 2.24e-02 | 6LAMB1, COL3A1, LAMA5, PRKCA, VTN, LAMB2 |
199 |
| KEGG_SMALL_CELL_LUNG_CANCER | 4.44e-03 | 9.85 | 1.92 | 2.75e-01 | 8.25e-01 | 3LAMB1, LAMA5, LAMB2 |
84 |
| KEGG_AXON_GUIDANCE | 1.42e-02 | 6.33 | 1.24 | 6.62e-01 | 1.00e+00 | 3SEMA3C, UNC5C, NRP1 |
129 |
| KEGG_COMPLEMENT_AND_COAGULATION_CASCADES | 3.05e-02 | 7.77 | 0.90 | 1.00e+00 | 1.00e+00 | 2C7, F10 |
69 |
| KEGG_PATHWAYS_IN_CANCER | 3.70e-02 | 3.39 | 0.88 | 1.00e+00 | 1.00e+00 | 4LAMB1, LAMA5, PRKCA, LAMB2 |
325 |
| KEGG_LEUKOCYTE_TRANSENDOTHELIAL_MIGRATION | 7.67e-02 | 4.57 | 0.53 | 1.00e+00 | 1.00e+00 | 2PRKCA, CYBA |
116 |
| KEGG_LYSOSOME | 8.24e-02 | 4.38 | 0.51 | 1.00e+00 | 1.00e+00 | 2PSAP, CTSD |
121 |
| KEGG_STEROID_BIOSYNTHESIS | 6.56e-02 | 15.93 | 0.37 | 1.00e+00 | 1.00e+00 | 1TM7SF2 |
17 |
| KEGG_ALZHEIMERS_DISEASE | 1.39e-01 | 3.18 | 0.37 | 1.00e+00 | 1.00e+00 | 2LRP1, APOE |
166 |
| KEGG_GLYCOSAMINOGLYCAN_BIOSYNTHESIS_CHONDROITIN_SULFATE | 8.40e-02 | 12.14 | 0.29 | 1.00e+00 | 1.00e+00 | 1XYLT1 |
22 |
| KEGG_GLYCOSAMINOGLYCAN_BIOSYNTHESIS_HEPARAN_SULFATE | 9.85e-02 | 10.19 | 0.24 | 1.00e+00 | 1.00e+00 | 1XYLT1 |
26 |
| KEGG_PRION_DISEASES | 1.30e-01 | 7.50 | 0.18 | 1.00e+00 | 1.00e+00 | 1C7 |
35 |
| KEGG_ALDOSTERONE_REGULATED_SODIUM_REABSORPTION | 1.54e-01 | 6.22 | 0.15 | 1.00e+00 | 1.00e+00 | 1PRKCA |
42 |
| KEGG_VIBRIO_CHOLERAE_INFECTION | 1.94e-01 | 4.81 | 0.12 | 1.00e+00 | 1.00e+00 | 1PRKCA |
54 |
| KEGG_NON_SMALL_CELL_LUNG_CANCER | 1.94e-01 | 4.81 | 0.12 | 1.00e+00 | 1.00e+00 | 1PRKCA |
54 |
| KEGG_PATHOGENIC_ESCHERICHIA_COLI_INFECTION | 2.00e-01 | 4.64 | 0.11 | 1.00e+00 | 1.00e+00 | 1PRKCA |
56 |
| KEGG_GLIOMA | 2.28e-01 | 3.99 | 0.10 | 1.00e+00 | 1.00e+00 | 1PRKCA |
65 |
| KEGG_LONG_TERM_POTENTIATION | 2.43e-01 | 3.70 | 0.09 | 1.00e+00 | 1.00e+00 | 1PRKCA |
70 |
| KEGG_LONG_TERM_DEPRESSION | 2.43e-01 | 3.70 | 0.09 | 1.00e+00 | 1.00e+00 | 1PRKCA |
70 |
Dowload full table
CHR Positional Gene Sets:
| P-value | OR | Lower 95% CI | FDR | FWER | Genes Found | Gene Set Size | |
|---|---|---|---|---|---|---|---|
| chr11q13 | 7.84e-02 | 2.61 | 0.68 | 1.00e+00 | 1.00e+00 | 4NEAT1, MALAT1, TM7SF2, LTBP3 |
421 |
| chr12q21 | 9.06e-02 | 4.13 | 0.48 | 1.00e+00 | 1.00e+00 | 2TSPAN8, LGR5 |
128 |
| chr7q21 | 1.36e-01 | 3.21 | 0.38 | 1.00e+00 | 1.00e+00 | 2SEMA3C, ADAM22 |
164 |
| chr7q22 | 2.03e-01 | 2.47 | 0.29 | 1.00e+00 | 1.00e+00 | 2PCOLCE, TRIM56 |
213 |
| chr17q25 | 3.22e-01 | 1.77 | 0.21 | 1.00e+00 | 1.00e+00 | 2RNF213, LGALS3BP |
297 |
| chr2q22 | 2.37e-01 | 3.81 | 0.09 | 1.00e+00 | 1.00e+00 | 1LRP1B |
68 |
| chr4q22 | 2.43e-01 | 3.70 | 0.09 | 1.00e+00 | 1.00e+00 | 1UNC5C |
70 |
| chr6q14 | 3.09e-01 | 2.77 | 0.07 | 1.00e+00 | 1.00e+00 | 1TPBG |
93 |
| chr17q24 | 3.12e-01 | 2.74 | 0.07 | 1.00e+00 | 1.00e+00 | 1PRKCA |
94 |
| chr18q12 | 3.17e-01 | 2.68 | 0.07 | 1.00e+00 | 1.00e+00 | 1SYT4 |
96 |
| chr7p15 | 3.17e-01 | 2.68 | 0.07 | 1.00e+00 | 1.00e+00 | 1GPNMB |
96 |
| chr2p22 | 3.23e-01 | 2.63 | 0.06 | 1.00e+00 | 1.00e+00 | 1LTBP1 |
98 |
| chr14q12 | 3.31e-01 | 2.55 | 0.06 | 1.00e+00 | 1.00e+00 | 1AKAP6 |
101 |
| chr2q32 | 3.49e-01 | 2.38 | 0.06 | 1.00e+00 | 1.00e+00 | 1COL3A1 |
108 |
| chr17q23 | 3.59e-01 | 2.30 | 0.06 | 1.00e+00 | 1.00e+00 | 1MRC2 |
112 |
| chr2p25 | 3.72e-01 | 2.20 | 0.05 | 1.00e+00 | 1.00e+00 | 1PXDN |
117 |
| chr19q13 | 4.39e-01 | 0.45 | 0.05 | 1.00e+00 | 1.00e+00 | 2APOE, SSC5D |
1165 |
| chr5p13 | 3.99e-01 | 2.01 | 0.05 | 1.00e+00 | 1.00e+00 | 1C7 |
128 |
| chr8p21 | 3.99e-01 | 2.01 | 0.05 | 1.00e+00 | 1.00e+00 | 1CLU |
128 |
| chr7q31 | 4.01e-01 | 1.99 | 0.05 | 1.00e+00 | 1.00e+00 | 1LAMB1 |
129 |
Dowload full table
Transcription Factor Targets:
| P-value | OR | Lower 95% CI | FDR | FWER | Genes Found | Gene Set Size | |
|---|---|---|---|---|---|---|---|
| CEBPE_TARGET_GENES | 3.53e-04 | 24.91 | 4.72 | 4.00e-01 | 4.00e-01 | 3MALAT1, TSPAN8, SEMA3C |
35 |
| STAT5B_01 | 3.07e-03 | 5.56 | 1.71 | 1.00e+00 | 1.00e+00 | 5PCOLCE, C7, CLU, VTN, NRP1 |
255 |
| ZNF239_TARGET_GENES | 9.92e-03 | 14.46 | 1.64 | 1.00e+00 | 1.00e+00 | 2NEAT1, TM7SF2 |
38 |
| EGR1_01 | 3.84e-03 | 5.26 | 1.62 | 1.00e+00 | 1.00e+00 | 5MRC2, PCOLCE, TPBG, APLP2, VTN |
269 |
| YKACATTT_UNKNOWN | 5.25e-03 | 4.87 | 1.50 | 1.00e+00 | 1.00e+00 | 5LRP1B, ADAM22, LTBP1, CLU, UNC5C |
290 |
| EGR2_01 | 7.45e-03 | 5.60 | 1.45 | 1.00e+00 | 1.00e+00 | 4MRC2, PCOLCE, AHNAK, VTN |
198 |
| MED25_TARGET_GENES | 9.53e-03 | 7.39 | 1.45 | 1.00e+00 | 1.00e+00 | 3NEAT1, MALAT1, LTBP1 |
111 |
| SOX11_TARGET_GENES | 1.31e-02 | 12.39 | 1.41 | 1.00e+00 | 1.00e+00 | 2XIST, MALAT1 |
44 |
| FOXC1_TARGET_GENES | 1.43e-02 | 11.83 | 1.35 | 1.00e+00 | 1.00e+00 | 2LRP1, LTBP3 |
46 |
| TTCYNRGAA_STAT5B_01 | 1.01e-02 | 4.13 | 1.27 | 1.00e+00 | 1.00e+00 | 5PCOLCE, C7, CLU, VTN, NRP1 |
341 |
| SUPT16H_TARGET_GENES | 5.64e-03 | 2.52 | 1.25 | 1.00e+00 | 1.00e+00 | 14NEAT1, FBN1, DST, MALAT1, MRC2, LRP1, TM7SF2, XYLT1, RNF213, CTSD, VTN, SSC5D, NRP1, LAMB2 |
1944 |
| AP3_Q6 | 1.64e-02 | 4.40 | 1.14 | 1.00e+00 | 1.00e+00 | 4LRP1, FSTL1, UNC5C, NRP1 |
251 |
| P53_02 | 1.73e-02 | 4.33 | 1.12 | 1.00e+00 | 1.00e+00 | 4SYT4, MRC2, AHNAK, AKAP6 |
255 |
| STAT_01 | 1.80e-02 | 4.28 | 1.11 | 1.00e+00 | 1.00e+00 | 4PCOLCE, CLU, VTN, NRP1 |
258 |
| P53_DECAMER_Q2 | 1.80e-02 | 4.28 | 1.11 | 1.00e+00 | 1.00e+00 | 4DST, LRP1, LTBP1, AKAP6 |
258 |
| STAT5A_01 | 1.82e-02 | 4.26 | 1.11 | 1.00e+00 | 1.00e+00 | 4PCOLCE, C7, VTN, NRP1 |
259 |
| MYOGENIN_Q6 | 1.82e-02 | 4.26 | 1.11 | 1.00e+00 | 1.00e+00 | 4SYT4, XYLT1, RNF213, CCNL2 |
259 |
| IK2_01 | 2.15e-02 | 4.04 | 1.05 | 1.00e+00 | 1.00e+00 | 4AHNAK, LRP1, LTBP1, RNF213 |
273 |
| IK1_01 | 2.38e-02 | 3.91 | 1.02 | 1.00e+00 | 1.00e+00 | 4AHNAK, LRP1, LTBP1, RNF213 |
282 |
| KMT2D_TARGET_GENES | 2.79e-02 | 2.58 | 0.98 | 1.00e+00 | 1.00e+00 | 7NEAT1, DST, MALAT1, CTSD, LTBP3, AKAP6, NRP1 |
796 |
Dowload full table
GO Biological Processes:
| P-value | OR | Lower 95% CI | FDR | FWER | Genes Found | Gene Set Size | |
|---|---|---|---|---|---|---|---|
| GOBP_BASEMENT_MEMBRANE_ASSEMBLY | 2.61e-05 | 66.24 | 11.62 | 4.00e-02 | 1.95e-01 | 3PXDN, LAMB1, LAMB2 |
15 |
| GOBP_EXTRACELLULAR_MATRIX_ASSEMBLY | 8.71e-07 | 34.63 | 10.20 | 6.52e-03 | 6.52e-03 | 5PXDN, LAMB1, EMILIN1, LTBP3, LAMB2 |
45 |
| GOBP_REGULATION_OF_CDC42_PROTEIN_SIGNAL_TRANSDUCTION | 3.22e-04 | 103.49 | 9.64 | 8.93e-02 | 1.00e+00 | 2APOE, NRP1 |
7 |
| GOBP_MAINTENANCE_OF_PROTEIN_LOCATION_IN_EXTRACELLULAR_REGION | 3.22e-04 | 103.49 | 9.64 | 8.93e-02 | 1.00e+00 | 2FBN1, LTBP1 |
7 |
| GOBP_POSITIVE_REGULATION_OF_AMYLOID_BETA_CLEARANCE | 3.22e-04 | 103.49 | 9.64 | 8.93e-02 | 1.00e+00 | 2LRP1, APOE |
7 |
| GOBP_REGULATION_OF_AMYLOID_BETA_CLEARANCE | 5.49e-05 | 49.70 | 8.99 | 4.35e-02 | 4.11e-01 | 3LRP1, CLU, APOE |
19 |
| GOBP_DENDRITE_ARBORIZATION | 4.28e-04 | 86.37 | 8.33 | 1.09e-01 | 1.00e+00 | 2TPBG, NRP1 |
8 |
| GOBP_SEQUESTERING_OF_EXTRACELLULAR_LIGAND_FROM_RECEPTOR | 6.85e-04 | 64.86 | 6.55 | 1.35e-01 | 1.00e+00 | 2FBN1, LTBP1 |
10 |
| GOBP_ELASTIC_FIBER_ASSEMBLY | 6.85e-04 | 64.86 | 6.55 | 1.35e-01 | 1.00e+00 | 2EMILIN1, LTBP3 |
10 |
| GOBP_TRANSFORMING_GROWTH_FACTOR_BETA_ACTIVATION | 8.35e-04 | 57.69 | 5.91 | 1.45e-01 | 1.00e+00 | 2LTBP1, LTBP3 |
11 |
| GOBP_BASEMENT_MEMBRANE_ORGANIZATION | 2.22e-04 | 29.50 | 5.54 | 8.28e-02 | 1.00e+00 | 3PXDN, LAMB1, LAMB2 |
30 |
| GOBP_EXTRACELLULAR_REGULATION_OF_SIGNAL_TRANSDUCTION | 9.99e-04 | 51.89 | 5.39 | 1.59e-01 | 1.00e+00 | 2FBN1, LTBP1 |
12 |
| GOBP_NEGATIVE_REGULATION_OF_AMYLOID_FIBRIL_FORMATION | 9.99e-04 | 51.89 | 5.39 | 1.59e-01 | 1.00e+00 | 2CLU, APOE |
12 |
| GOBP_CDC42_PROTEIN_SIGNAL_TRANSDUCTION | 1.37e-03 | 43.30 | 4.59 | 1.90e-01 | 1.00e+00 | 2APOE, NRP1 |
14 |
| GOBP_AMYLOID_BETA_CLEARANCE | 4.51e-04 | 22.75 | 4.33 | 1.09e-01 | 1.00e+00 | 3LRP1, CLU, APOE |
38 |
| GOBP_LIPOPROTEIN_CATABOLIC_PROCESS | 1.58e-03 | 39.95 | 4.27 | 2.00e-01 | 1.00e+00 | 2APOE, CTSD |
15 |
| GOBP_REGULATION_OF_AMYLOID_FIBRIL_FORMATION | 1.58e-03 | 39.95 | 4.27 | 2.00e-01 | 1.00e+00 | 2CLU, APOE |
15 |
| GOBP_GANGLION_DEVELOPMENT | 1.80e-03 | 37.11 | 3.99 | 2.17e-01 | 1.00e+00 | 2UNC5C, NRP1 |
16 |
| GOBP_AXON_EXTENSION | 8.31e-05 | 12.74 | 3.87 | 4.78e-02 | 6.21e-01 | 5SEMA3C, LRP1, APOE, NRP1, LAMB2 |
114 |
| GOBP_NEURON_PROJECTION_EXTENSION | 4.18e-05 | 10.78 | 3.70 | 4.35e-02 | 3.13e-01 | 6SYT4, SEMA3C, LRP1, APOE, NRP1, LAMB2 |
164 |
Dowload full table
Immunological Gene Sets:
| P-value | OR | Lower 95% CI | FDR | FWER | Genes Found | Gene Set Size | |
|---|---|---|---|---|---|---|---|
| GSE21360_NAIVE_VS_PRIMARY_MEMORY_CD8_TCELL_DN | 7.19e-05 | 9.74 | 3.35 | 3.01e-01 | 3.50e-01 | 6AHNAK, LRP1, APLP2, XYLT1, LGALS3BP, NRP1 |
181 |
| GSE43955_TH0_VS_TGFB_IL6_TH17_ACT_CD4_TCELL_1H_DN | 1.24e-04 | 8.78 | 3.02 | 3.01e-01 | 6.03e-01 | 6FBN1, SYT4, TPBG, SEMA3C, PSAP, FSTL1 |
200 |
| GSE6259_CD4_TCELL_VS_CD8_TCELL_UP | 8.02e-04 | 7.63 | 2.34 | 4.78e-01 | 1.00e+00 | 5PCOLCE, LAMA5, FSTL1, CTSD, LAMB2 |
187 |
| GSE22611_MUTANT_NOD2_VS_CTRL_TRANSDUCED_HEK293T_CELL_DN | 9.88e-04 | 7.27 | 2.23 | 4.78e-01 | 1.00e+00 | 5GPNMB, LRP1B, F10, LGALS3BP, UNC5C |
196 |
| GSE21546_WT_VS_SAP1A_KO_AND_ELK1_KO_ANTI_CD3_STIM_DP_THYMOCYTES_UP | 1.06e-03 | 7.16 | 2.19 | 4.78e-01 | 1.00e+00 | 5GPNMB, LTBP1, XYLT1, FSTL1, AKAP6 |
199 |
| GSE17721_4_VS_24H_CPG_BMDC_UP | 1.08e-03 | 7.12 | 2.18 | 4.78e-01 | 1.00e+00 | 5MRC2, TPBG, F10, CCNL2, MATN2 |
200 |
| GSE24634_TEFF_VS_TCONV_DAY10_IN_CULTURE_DN | 1.08e-03 | 7.12 | 2.18 | 4.78e-01 | 1.00e+00 | 5GPNMB, PSAP, APLP2, VTN, NRP1 |
200 |
| GSE2405_HEAT_KILLED_LYSATE_VS_LIVE_A_PHAGOCYTOPHILUM_STIM_NEUTROPHIL_24H_UP | 1.08e-03 | 7.12 | 2.18 | 4.78e-01 | 1.00e+00 | 5PSAP, AHNAK, LRP1, APLP2, CLU |
200 |
| GSE5679_CTRL_VS_PPARG_LIGAND_ROSIGLITAZONE_TREATED_DC_DN | 1.08e-03 | 7.12 | 2.18 | 4.78e-01 | 1.00e+00 | 5AHNAK, PRKCA, CCNL2, LTBP3, MATN2 |
200 |
| GSE21379_WT_VS_SAP_KO_TFH_CD4_TCELL_UP | 1.08e-03 | 7.12 | 2.18 | 4.78e-01 | 1.00e+00 | 5PXDN, CLU, MEG3, NRP1, LAMB2 |
200 |
| GSE24726_WT_VS_E2_2_KO_PDC_DAY6_POST_DELETION_DN | 1.08e-03 | 7.12 | 2.18 | 4.78e-01 | 1.00e+00 | 5XIST, MALAT1, LRP1, APOE, NRP1 |
200 |
| GSE7509_FCGRIIB_VS_TNFA_IL1B_IL6_PGE_STIM_DC_DN | 3.10e-03 | 7.25 | 1.87 | 8.35e-01 | 1.00e+00 | 4XIST, DST, MALAT1, CCNL2 |
154 |
| GSE37605_NOD_VS_C57BL6_IRES_GFP_TREG_UP | 3.47e-03 | 7.01 | 1.81 | 8.35e-01 | 1.00e+00 | 4XIST, APLP2, XYLT1, NRP1 |
159 |
| GSE3565_DUSP1_VS_WT_SPLENOCYTES_UP | 3.79e-03 | 6.83 | 1.77 | 8.35e-01 | 1.00e+00 | 4AHNAK, XYLT1, CTSD, NRP1 |
163 |
| GSE6259_FLT3L_INDUCED_DEC205_POS_DC_VS_CD8_TCELL_DN | 4.58e-03 | 6.47 | 1.67 | 8.35e-01 | 1.00e+00 | 4LTBP1, RNF213, LGALS3BP, CYBA |
172 |
| GSE21360_PRIMARY_VS_QUATERNARY_MEMORY_CD8_TCELL_UP | 4.77e-03 | 6.39 | 1.65 | 8.35e-01 | 1.00e+00 | 4GPNMB, AHNAK, RNF213, LGALS3BP |
174 |
| GSE6259_33D1_POS_DC_VS_CD4_TCELL_DN | 4.96e-03 | 6.32 | 1.63 | 8.35e-01 | 1.00e+00 | 4GPNMB, DST, ADAM22, APOE |
176 |
| GSE21360_NAIVE_VS_SECONDARY_MEMORY_CD8_TCELL_DN | 4.96e-03 | 6.32 | 1.63 | 8.35e-01 | 1.00e+00 | 4AHNAK, APLP2, RNF213, LGALS3BP |
176 |
| GSE3565_CTRL_VS_LPS_INJECTED_DUSP1_KO_SPLENOCYTES_UP | 5.47e-03 | 6.14 | 1.59 | 8.35e-01 | 1.00e+00 | 4AHNAK, XYLT1, CTSD, NRP1 |
181 |
| GSE35543_IN_VIVO_NTREG_VS_CONVERTED_EX_ITREG_UP | 6.70e-03 | 5.78 | 1.50 | 8.35e-01 | 1.00e+00 | 4SYT4, SEMA3C, MATN2, LAMB2 |
192 |
Top Ranked Transcription Factors for this Gene Expression Program:
| Gene Symbol | TF Rank | DNA Binding Domain | Motif Status | IUPAC PWM | GTEx | DepMap | Decartes |
|---|---|---|---|---|---|---|---|
| FBN1 | 2 | No | Unlikely to be sequence specific TF | Not a DNA binding protein | No motif | None | None |
| CLU | 29 | No | Unlikely to be sequence specific TF | Not a DNA binding protein | No motif | None | Included only because GO says positive regulation of NF-kappaB transcription factor activity, but there is no DBD and no evidence of DNA binding. |
| PLXNB2 | 85 | No | Unlikely to be sequence specific TF | Not a DNA binding protein | No motif | None | None |
| NOTCH2 | 105 | No | Unlikely to be sequence specific TF | Not a DNA binding protein | No motif | None | Transmembrane receptor protein that operates far upstream in the signaling cascade |
| PLXNA4 | 112 | No | Unlikely to be sequence specific TF | Not a DNA binding protein | No motif | None | Protein is a semaphorin receptor that operates far upstream on the signaling cascade (PMID: 12591607). |
| MACF1 | 134 | No | Unlikely to be sequence specific TF | Not a DNA binding protein | No motif | None | Included only because Vasquerizas 2009 includes it with an x. No DBD and no other data to support being a TF. |
| GLIS3 | 146 | Yes | Known motif | Monomer or homomultimer | High-throughput in vitro | None | None |
| NFKBIZ | 153 | No | Unlikely to be sequence specific TF | Not a DNA binding protein | No motif | None | None |
| NFE2L1 | 160 | Yes | Known motif | Obligate heteromer | In vivo/Misc source | Only known motifs are from Transfac or HocoMoco - origin is uncertain | Tested on HT-SELEX and PBM. Neither yielded a motif. Likely an obligate heteromer (PMID: 23661758). |
| UBR4 | 165 | No | Unlikely to be sequence specific TF | Not a DNA binding protein | No motif | None | None |
| RUNX1 | 170 | Yes | Known motif | Monomer or homomultimer | In vivo/Misc source | Only known motifs are from Transfac or HocoMoco - origin is uncertain | None |
| PLXNB3 | 214 | No | Unlikely to be sequence specific TF | Not a DNA binding protein | No motif | None | Protein is a semaphorin receptor that operates far upstream on the signaling cascade. |
| HOOK2 | 224 | No | Unlikely to be sequence specific TF | Not a DNA binding protein | No motif | None | Based on the alignments, the protein is only weakly related to the other bZIP proteins and lacks the basic region required for DNA binding |
| NPAS2 | 226 | Yes | Known motif | Monomer or homomultimer | High-throughput in vitro | None | None |
| EDA2R | 241 | No | Unlikely to be sequence specific TF | Not a DNA binding protein | No motif | None | Included only because GO says positive regulation of sequence-specific DNA binding transcription factor activity. Not DNA binding. |
| KMT2C | 244 | No | Unlikely to be sequence specific TF | Low specificity DNA-binding protein | No motif | Has a putative AT-hook | Based on the alignment, it is quite different from all other HMG proteins. It is borderline to say that it is a HMG at all. |
| ATXN7 | 249 | No | Unlikely to be sequence specific TF | Not a DNA binding protein | No motif | None | ATXN7 SCA7 domain facilitates interactions with histone dimers (PMID: 20634802) |
| TCF25 | 259 | No | Unlikely to be sequence specific TF | Not a DNA binding protein | No motif | None | Only evidence is based on (PMID:16574069), which claims that hnulp1 (TCF25) contains a possible bHLH domain and that it represses transcription in a Gal4-forced recruitment assay. |
| GOLGB1 | 280 | No | Unlikely to be sequence specific TF | Not a DNA binding protein | No motif | None | Golgi resident transmembrane protein that regulates glycosylation of other proteins (PMID: 27226319) |
| LRP6 | 286 | No | Unlikely to be sequence specific TF | Not a DNA binding protein | No motif | None | Cell surface receptor that is in the beginning of the WNT signaling cascade. GO annotation has no evidence of DNA-binding activity (PMID: 14739301). |
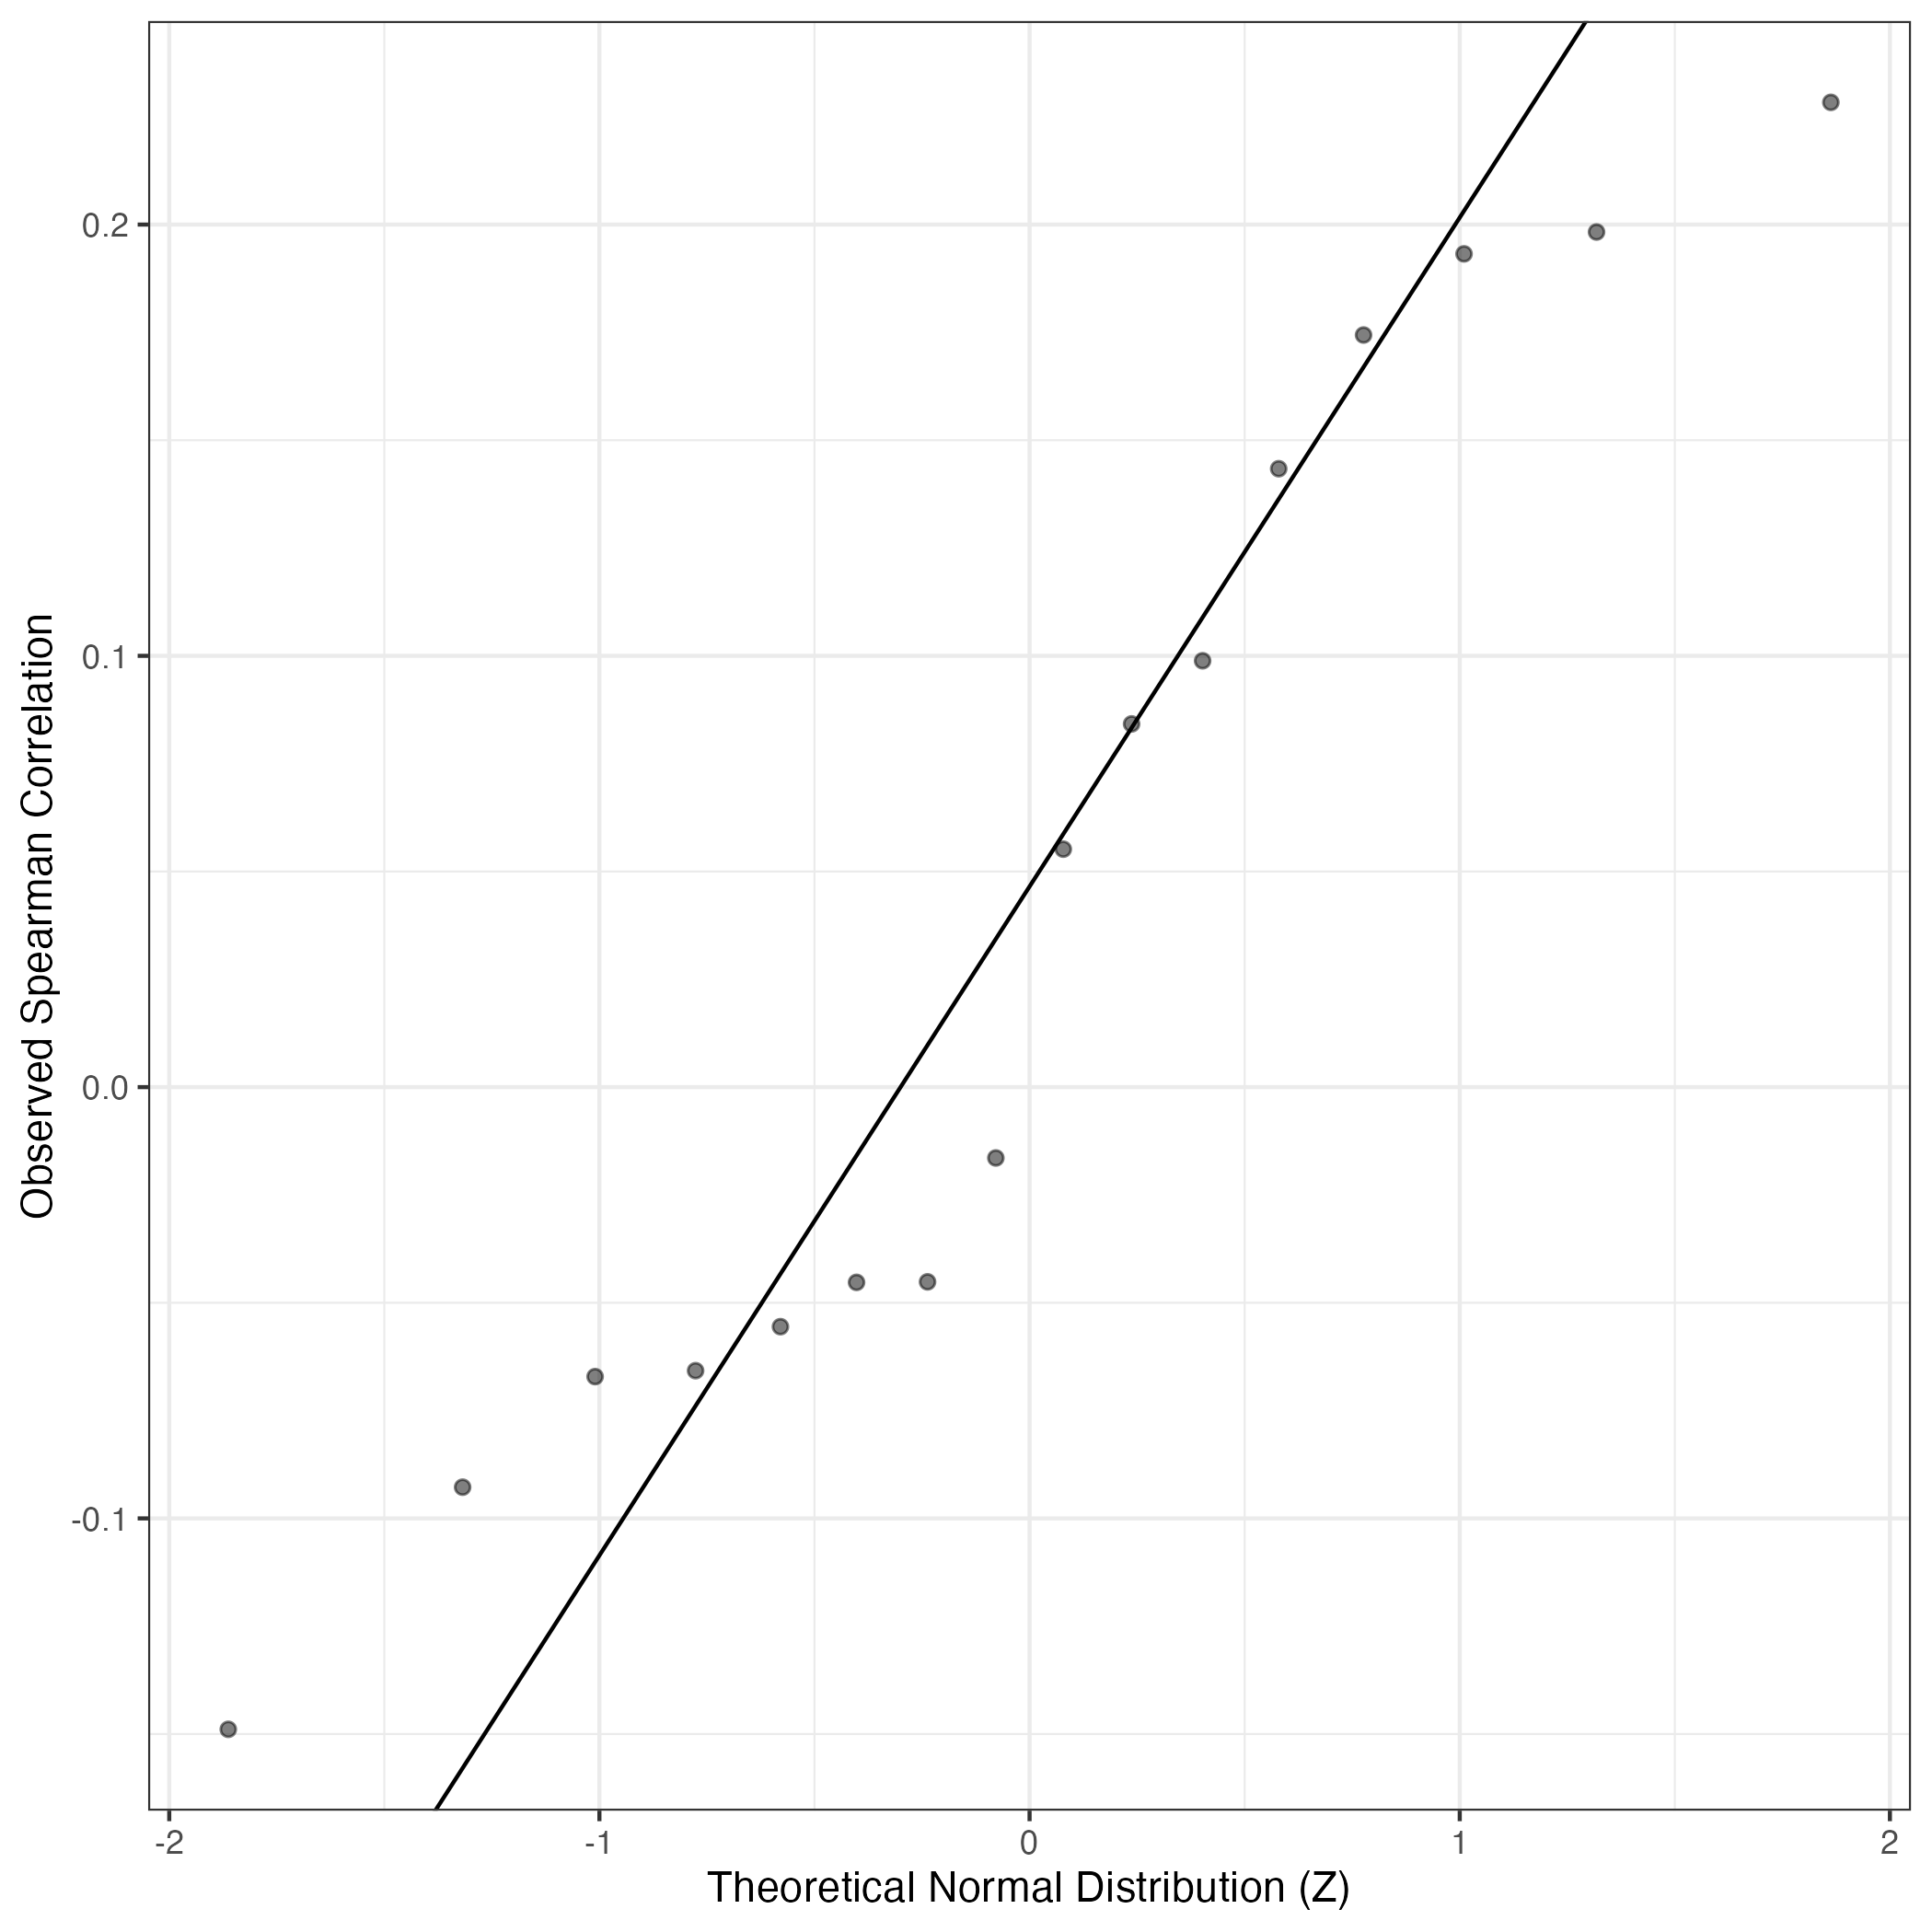
QQ Plot showing correlations with other Gene Expression Programs in this dataset, calculated by Spearman correlation:
Interactive QQ-plot of gene loadings:
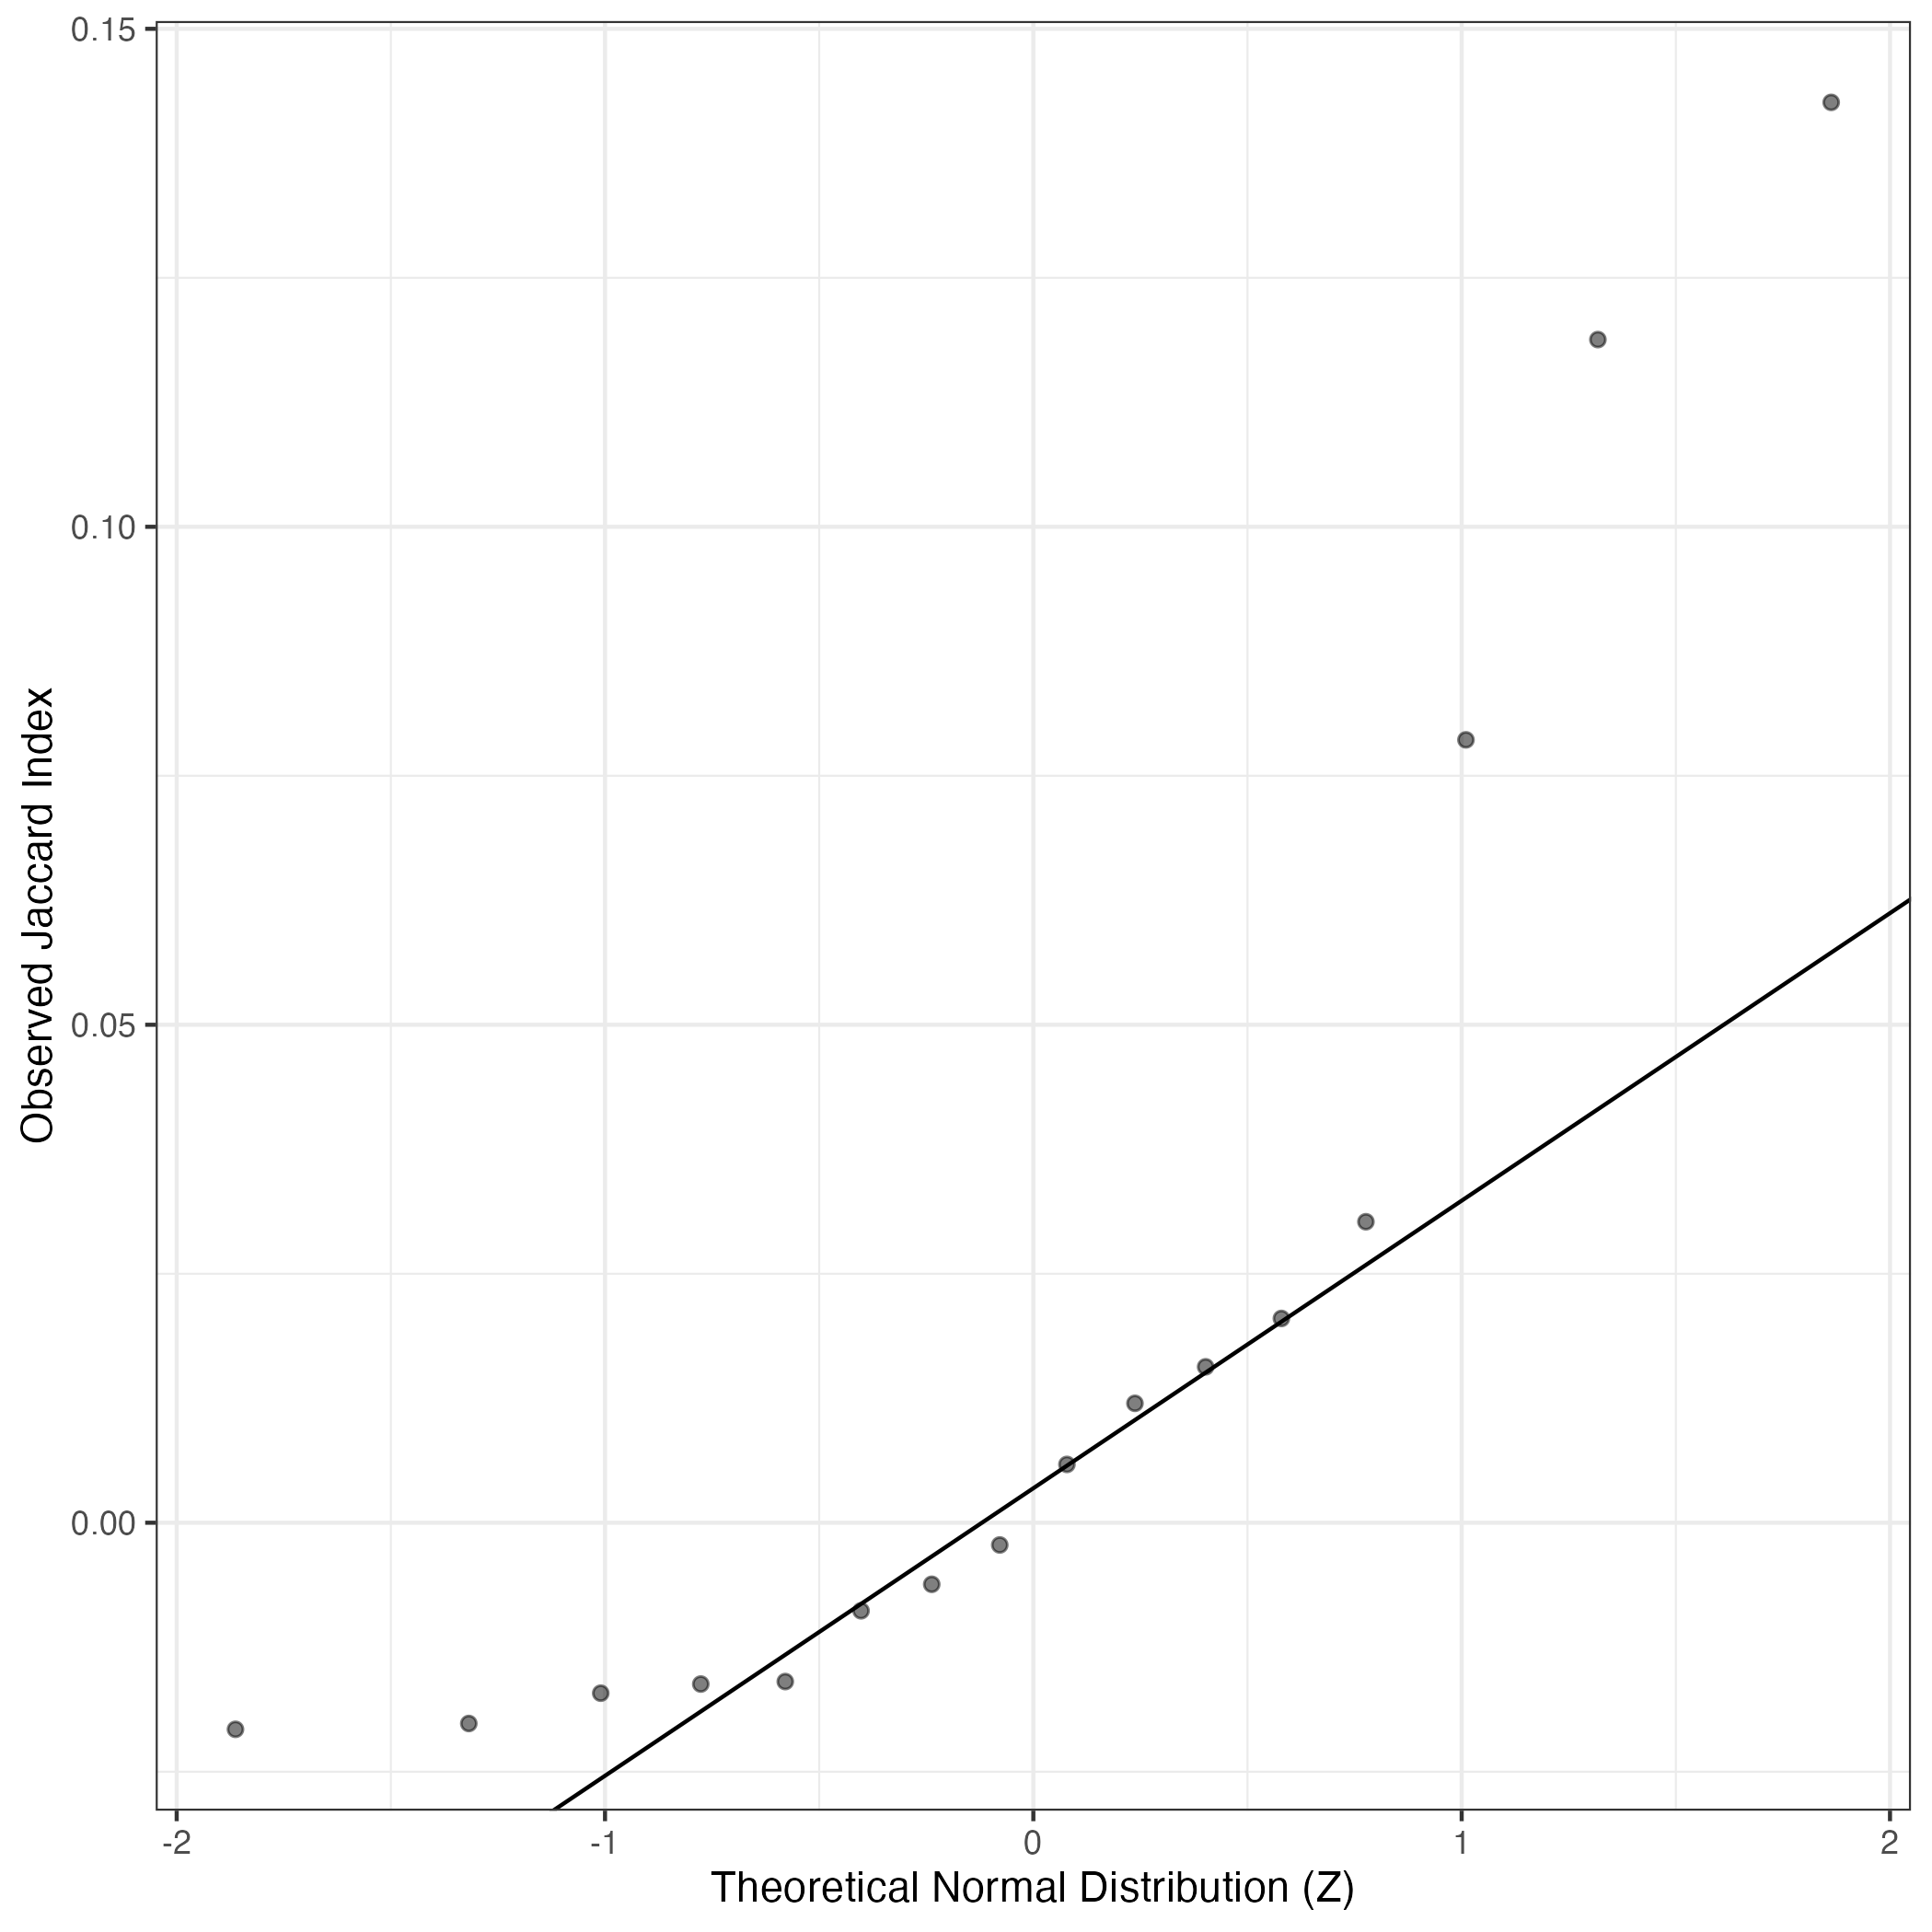
A similar QQ-plot as above, but only for instances where the H value is e.g. > 25, i.e. we are confident that the expression program is active above noise. Agreemenet between these binary vectors is tested using the Jaccard Index, with the P-values calculated by an exact test:
Interactive QQ-plot:
Singler cell type annotations for the top 50 cells on this program.
| Cell ID | Singler label | Singler Delta | Activity Score | Top Singler Raw Scores |
|---|---|---|---|---|
| SKNSH_TCGATTTGTGGATCGA-1 | Neurons | 0.08 | 210.82 | Raw ScoresNeurons:adrenal_medulla_cell_line: 0.18, Smooth_muscle_cells:vascular: 0.17, Neuroepithelial_cell:ESC-derived: 0.17, Fibroblasts:foreskin: 0.16, MSC: 0.16, iPS_cells:foreskin_fibrobasts: 0.16, Smooth_muscle_cells:umbilical_vein: 0.16, Tissue_stem_cells:lipoma-derived_MSC: 0.16, Endothelial_cells:HUVEC:FPV-infected: 0.16, iPS_cells:CRL2097_foreskin: 0.16 |
| SKNSH_TCATCCGGTTCAAGGG-1 | Smooth_muscle_cells | 0.18 | 144.98 | Raw ScoresMSC: 0.4, Smooth_muscle_cells:vascular: 0.39, Fibroblasts:foreskin: 0.39, iPS_cells:CRL2097_foreskin: 0.39, iPS_cells:skin_fibroblast: 0.38, iPS_cells:foreskin_fibrobasts: 0.38, Smooth_muscle_cells:vascular:IL-17: 0.37, Tissue_stem_cells:lipoma-derived_MSC: 0.37, Neurons:Schwann_cell: 0.37, iPS_cells:PDB_fibroblasts: 0.37 |
| BE2C_ATCGGATAGCCAAGTG-1 | Neurons | 0.10 | 136.59 | Raw ScoresNeurons:adrenal_medulla_cell_line: 0.28, Neuroepithelial_cell:ESC-derived: 0.24, Tissue_stem_cells:CD326-CD56+: 0.24, iPS_cells:CRL2097_foreskin-derived:undiff.: 0.23, iPS_cells:fibroblast-derived:Retroviral_transf: 0.23, iPS_cells:PDB_2lox-22: 0.23, iPS_cells:fibroblast-derived:Direct_del._reprog: 0.23, iPS_cells:PDB_2lox-17: 0.23, iPS_cells:PDB_1lox-17Puro-10: 0.23, iPS_cells:PDB_1lox-21Puro-20: 0.23 |
| SKNSH_TCAATCTCACCTCGTT-1 | Fibroblasts | 0.05 | 133.55 | Raw ScoresFibroblasts:breast: 0.12, Smooth_muscle_cells:vascular: 0.11, iPS_cells:adipose_stem_cells: 0.11, Fibroblasts:foreskin: 0.11, Neurons:Schwann_cell: 0.11, Smooth_muscle_cells:vascular:IL-17: 0.11, Tissue_stem_cells:BM_MSC:osteogenic: 0.11, Chondrocytes:MSC-derived: 0.11, iPS_cells:foreskin_fibrobasts: 0.11, Osteoblasts: 0.11 |
| SKNSH_TACTTCATCTTCCTAA-1 | Neurons | 0.05 | 129.95 | Raw ScoresNeurons:adrenal_medulla_cell_line: 0.17, Endothelial_cells:HUVEC:FPV-infected: 0.16, Endothelial_cells:HUVEC: 0.15, Endothelial_cells:HUVEC:H5N1-infected: 0.15, Endothelial_cells:HUVEC:VEGF: 0.15, Endothelial_cells:HUVEC:PR8-infected: 0.15, Endothelial_cells:HUVEC:IL-1b: 0.15, Neurons:Schwann_cell: 0.15, Endothelial_cells:HUVEC:Borrelia_burgdorferi: 0.15, Smooth_muscle_cells:vascular: 0.15 |
| SKNSH_CAGTTAGCAATGTCTG-1 | Neurons | 0.14 | 123.65 | Raw ScoresSmooth_muscle_cells:vascular: 0.27, Smooth_muscle_cells:bronchial: 0.27, Fibroblasts:breast: 0.27, iPS_cells:CRL2097_foreskin: 0.27, Smooth_muscle_cells:bronchial:vit_D: 0.27, Smooth_muscle_cells:vascular:IL-17: 0.27, iPS_cells:skin_fibroblast: 0.26, MSC: 0.26, Neurons:Schwann_cell: 0.26, Osteoblasts: 0.26 |
| SKNSH_CAAGGGATCCCGTAAA-1 | Neurons | 0.05 | 122.42 | Raw ScoresNeurons:adrenal_medulla_cell_line: 0.14, Neuroepithelial_cell:ESC-derived: 0.14, iPS_cells:PDB_2lox-5: 0.13, iPS_cells:PDB_2lox-22: 0.13, iPS_cells:PDB_1lox-17Puro-5: 0.13, iPS_cells:PDB_2lox-17: 0.13, iPS_cells:PDB_2lox-21: 0.13, iPS_cells:PDB_1lox-21Puro-20: 0.13, iPS_cells:PDB_1lox-17Puro-10: 0.13, iPS_cells:PDB_1lox-21Puro-26: 0.13 |
| SKNSH_GATAGCTTCCACTAGA-1 | Neurons | 0.03 | 110.89 | Raw ScoresiPS_cells:CRL2097_foreskin-derived:d20_hepatic_diff: 0.13, Neurons:adrenal_medulla_cell_line: 0.13, Endothelial_cells:HUVEC:VEGF: 0.13, Smooth_muscle_cells:bronchial:vit_D: 0.13, Endothelial_cells:HUVEC: 0.13, Smooth_muscle_cells:bronchial: 0.13, Endothelial_cells:HUVEC:B._anthracis_LT: 0.13, Endothelial_cells:HUVEC:FPV-infected: 0.13, Tissue_stem_cells:CD326-CD56+: 0.13, Endothelial_cells:HUVEC:H5N1-infected: 0.13 |
| GIMEN_TTAGGCATCTGTCTCG-1 | MSC | 0.28 | 103.66 | Raw ScoresMSC: 0.45, Smooth_muscle_cells:vascular: 0.43, Fibroblasts:foreskin: 0.42, Tissue_stem_cells:dental_pulp: 0.41, iPS_cells:skin_fibroblast: 0.41, iPS_cells:CRL2097_foreskin: 0.41, iPS_cells:foreskin_fibrobasts: 0.41, Tissue_stem_cells:lipoma-derived_MSC: 0.41, iPS_cells:PDB_fibroblasts: 0.4, Smooth_muscle_cells:umbilical_vein: 0.4 |
| SKNAS_CTTGAGATCCAGTACA-1 | Smooth_muscle_cells | 0.16 | 102.89 | Raw ScoresSmooth_muscle_cells:vascular: 0.19, Smooth_muscle_cells:vascular:IL-17: 0.19, Fibroblasts:breast: 0.17, Tissue_stem_cells:BM_MSC: 0.17, Tissue_stem_cells:BM_MSC:osteogenic: 0.17, iPS_cells:fibroblasts: 0.17, Osteoblasts: 0.17, iPS_cells:adipose_stem_cells: 0.17, Fibroblasts:foreskin: 0.17, iPS_cells:skin_fibroblast: 0.17 |
| BE2C_CAGCACGTCAGCCTCT-1 | Neurons | 0.09 | 102.30 | Raw ScoresNeurons:adrenal_medulla_cell_line: 0.19, Neuroepithelial_cell:ESC-derived: 0.17, iPS_cells:CRL2097_foreskin-derived:undiff.: 0.16, iPS_cells:PDB_1lox-17Puro-5: 0.16, iPS_cells:PDB_1lox-17Puro-10: 0.16, iPS_cells:PDB_1lox-21Puro-20: 0.16, iPS_cells:PDB_1lox-21Puro-26: 0.15, iPS_cells:PDB_2lox-5: 0.15, iPS_cells:PDB_2lox-22: 0.15, iPS_cells:PDB_2lox-17: 0.15 |
| SKNSH_TGAGGAGTCGCTCTAC-1 | Smooth_muscle_cells | 0.18 | 101.90 | Raw ScoresiPS_cells:CRL2097_foreskin: 0.33, Smooth_muscle_cells:vascular: 0.33, MSC: 0.33, Neurons:adrenal_medulla_cell_line: 0.32, Smooth_muscle_cells:vascular:IL-17: 0.32, Smooth_muscle_cells:bronchial: 0.32, Smooth_muscle_cells:bronchial:vit_D: 0.32, Fibroblasts:breast: 0.32, iPS_cells:skin_fibroblast: 0.32, iPS_cells:foreskin_fibrobasts: 0.32 |
| SKNSH_GGCAGTCCATTGGCAT-1 | Neurons | 0.04 | 100.17 | Raw ScoresNeurons:adrenal_medulla_cell_line: 0.15, Neuroepithelial_cell:ESC-derived: 0.14, Endothelial_cells:HUVEC:FPV-infected: 0.14, Endothelial_cells:HUVEC: 0.14, Neurons:Schwann_cell: 0.14, Endothelial_cells:HUVEC:IL-1b: 0.14, Endothelial_cells:HUVEC:H5N1-infected: 0.14, Smooth_muscle_cells:vascular: 0.14, MSC: 0.13, Fibroblasts:foreskin: 0.13 |
| SKNSH_ATTTCACAGAAGAGCA-1 | Smooth_muscle_cells | 0.22 | 97.37 | Raw ScoresiPS_cells:CRL2097_foreskin: 0.37, MSC: 0.36, Fibroblasts:breast: 0.36, Smooth_muscle_cells:vascular: 0.36, Fibroblasts:foreskin: 0.36, iPS_cells:skin_fibroblast: 0.36, Smooth_muscle_cells:vascular:IL-17: 0.36, iPS_cells:foreskin_fibrobasts: 0.36, Smooth_muscle_cells:bronchial: 0.35, Smooth_muscle_cells:bronchial:vit_D: 0.35 |
| SKNSH_GGTGGCTAGATTGCGG-1 | Smooth_muscle_cells | 0.18 | 96.23 | Raw ScoresSmooth_muscle_cells:vascular: 0.34, Neurons:adrenal_medulla_cell_line: 0.34, Fibroblasts:breast: 0.33, Smooth_muscle_cells:vascular:IL-17: 0.33, Smooth_muscle_cells:bronchial: 0.33, iPS_cells:CRL2097_foreskin: 0.33, MSC: 0.33, Smooth_muscle_cells:bronchial:vit_D: 0.33, iPS_cells:skin_fibroblast: 0.32, Neurons:Schwann_cell: 0.32 |
| SKNSH_AGAGAGCAGGTTACAA-1 | MSC | 0.04 | 96.08 | Raw ScoresNeurons:adrenal_medulla_cell_line: 0.11, MSC: 0.11, Fibroblasts:foreskin: 0.11, iPS_cells:CRL2097_foreskin: 0.11, Smooth_muscle_cells:bronchial: 0.11, Neuroepithelial_cell:ESC-derived: 0.1, iPS_cells:foreskin_fibrobasts: 0.1, Smooth_muscle_cells:vascular: 0.1, Smooth_muscle_cells:bronchial:vit_D: 0.1, Fibroblasts:breast: 0.1 |
| SKNSH_CGAGAAGGTCCCTAAA-1 | Neurons | 0.13 | 94.46 | Raw ScoresNeurons:adrenal_medulla_cell_line: 0.23, Smooth_muscle_cells:vascular: 0.22, iPS_cells:CRL2097_foreskin: 0.21, MSC: 0.21, Smooth_muscle_cells:bronchial: 0.21, Smooth_muscle_cells:bronchial:vit_D: 0.21, Fibroblasts:breast: 0.21, Fibroblasts:foreskin: 0.21, Smooth_muscle_cells:vascular:IL-17: 0.21, iPS_cells:foreskin_fibrobasts: 0.21 |
| BE2C_TTTCCTCAGCGCCTTG-1 | Neurons | 0.06 | 93.12 | Raw ScoresNeurons:adrenal_medulla_cell_line: 0.15, Neurons:Schwann_cell: 0.12, Endothelial_cells:HUVEC:FPV-infected: 0.12, iPS_cells:skin_fibroblast-derived: 0.12, iPS_cells:adipose_stem_cell-derived:lentiviral: 0.12, iPS_cells:iPS:minicircle-derived: 0.12, Embryonic_stem_cells: 0.12, Endothelial_cells:HUVEC:PR8-infected: 0.12, iPS_cells:adipose_stem_cell-derived:minicircle-derived: 0.12, Endothelial_cells:HUVEC: 0.12 |
| SKNSH_TTTGGAGTCCAGTGTA-1 | Smooth_muscle_cells | 0.15 | 91.68 | Raw ScoresiPS_cells:CRL2097_foreskin: 0.31, Smooth_muscle_cells:vascular: 0.3, MSC: 0.3, Fibroblasts:breast: 0.3, Smooth_muscle_cells:vascular:IL-17: 0.3, iPS_cells:skin_fibroblast: 0.3, iPS_cells:foreskin_fibrobasts: 0.3, Smooth_muscle_cells:bronchial: 0.29, Smooth_muscle_cells:bronchial:vit_D: 0.29, iPS_cells:adipose_stem_cells: 0.29 |
| GIMEN_CATGCCTCATCTTAGG-1 | Fibroblasts | 0.06 | 90.03 | Raw ScoresiPS_cells:CRL2097_foreskin: 0.11, Neurons:Schwann_cell: 0.11, Smooth_muscle_cells:vascular: 0.11, Tissue_stem_cells:iliac_MSC: 0.11, Smooth_muscle_cells:bronchial:vit_D: 0.11, Fibroblasts:breast: 0.11, MSC: 0.1, Fibroblasts:foreskin: 0.1, Smooth_muscle_cells:bronchial: 0.1, Smooth_muscle_cells:vascular:IL-17: 0.1 |
| BE2C_GAGACCCTCTTCTAAC-1 | Neurons | 0.23 | 85.92 | Raw ScoresNeurons:adrenal_medulla_cell_line: 0.52, Neuroepithelial_cell:ESC-derived: 0.43, iPS_cells:PDB_2lox-22: 0.41, iPS_cells:PDB_1lox-21Puro-20: 0.41, iPS_cells:PDB_1lox-21Puro-26: 0.41, iPS_cells:PDB_2lox-21: 0.41, iPS_cells:PDB_2lox-17: 0.41, iPS_cells:PDB_1lox-17Puro-10: 0.41, iPS_cells:PDB_2lox-5: 0.41, Tissue_stem_cells:CD326-CD56+: 0.41 |
| GIMEN_CGGACACTCAGGAAGC-1 | MSC | 0.09 | 85.82 | Raw ScoresSmooth_muscle_cells:vascular: 0.15, MSC: 0.15, Endothelial_cells:HUVEC:VEGF: 0.14, Endothelial_cells:HUVEC: 0.14, Endothelial_cells:HUVEC:FPV-infected: 0.14, Endothelial_cells:HUVEC:H5N1-infected: 0.14, Endothelial_cells:lymphatic: 0.14, Fibroblasts:foreskin: 0.14, Endothelial_cells:blood_vessel: 0.13, Endothelial_cells:HUVEC:PR8-infected: 0.13 |
| SKNSH_AGTACTGGTCTGTCCT-1 | Smooth_muscle_cells | 0.24 | 84.73 | Raw ScoresiPS_cells:CRL2097_foreskin: 0.46, MSC: 0.46, iPS_cells:skin_fibroblast: 0.45, iPS_cells:foreskin_fibrobasts: 0.45, Fibroblasts:breast: 0.45, Smooth_muscle_cells:vascular: 0.45, Smooth_muscle_cells:vascular:IL-17: 0.45, Fibroblasts:foreskin: 0.45, Smooth_muscle_cells:bronchial: 0.45, Tissue_stem_cells:BM_MSC: 0.44 |
| SKNSH_CATACTTTCAAACTGC-1 | MSC | 0.22 | 83.88 | Raw ScoresMSC: 0.33, iPS_cells:skin_fibroblast: 0.32, iPS_cells:CRL2097_foreskin: 0.31, iPS_cells:foreskin_fibrobasts: 0.31, Smooth_muscle_cells:vascular: 0.31, Fibroblasts:foreskin: 0.31, Fibroblasts:breast: 0.31, iPS_cells:PDB_fibroblasts: 0.3, Tissue_stem_cells:dental_pulp: 0.3, Tissue_stem_cells:lipoma-derived_MSC: 0.3 |
| GIMEN_TGCAGTATCTGGGTCG-1 | MSC | 0.08 | 83.85 | Raw ScoresMSC: 0.14, iPS_cells:skin_fibroblast: 0.14, Tissue_stem_cells:lipoma-derived_MSC: 0.14, Fibroblasts:foreskin: 0.13, Tissue_stem_cells:adipose-derived_MSC_AM3: 0.13, iPS_cells:PDB_fibroblasts: 0.13, Smooth_muscle_cells:vascular: 0.13, iPS_cells:fibroblasts: 0.13, iPS_cells:CRL2097_foreskin: 0.13, iPS_cells:foreskin_fibrobasts: 0.13 |
| SKNSH_GGGCCATCAGAGTTGG-1 | Neurons | 0.21 | 83.42 | Raw ScoresNeurons:adrenal_medulla_cell_line: 0.46, iPS_cells:CRL2097_foreskin: 0.42, Neurons:Schwann_cell: 0.42, Smooth_muscle_cells:vascular: 0.42, MSC: 0.42, Fibroblasts:breast: 0.42, iPS_cells:foreskin_fibrobasts: 0.41, Smooth_muscle_cells:bronchial: 0.41, Smooth_muscle_cells:bronchial:vit_D: 0.41, Smooth_muscle_cells:vascular:IL-17: 0.41 |
| SKNSH_GAAGGACAGCAGAAAG-1 | MSC | 0.14 | 83.38 | Raw ScoresMSC: 0.26, iPS_cells:CRL2097_foreskin: 0.26, Fibroblasts:foreskin: 0.26, Smooth_muscle_cells:vascular: 0.26, iPS_cells:skin_fibroblast: 0.25, iPS_cells:foreskin_fibrobasts: 0.25, Fibroblasts:breast: 0.25, iPS_cells:PDB_fibroblasts: 0.25, iPS_cells:fibroblasts: 0.25, Neurons:Schwann_cell: 0.24 |
| SKNSH_GGTGGCTTCGTAGCCG-1 | Smooth_muscle_cells | 0.22 | 79.35 | Raw ScoresMSC: 0.51, Fibroblasts:breast: 0.51, iPS_cells:foreskin_fibrobasts: 0.51, iPS_cells:skin_fibroblast: 0.5, iPS_cells:CRL2097_foreskin: 0.5, Smooth_muscle_cells:vascular:IL-17: 0.5, Smooth_muscle_cells:vascular: 0.5, Smooth_muscle_cells:bronchial: 0.5, Smooth_muscle_cells:bronchial:vit_D: 0.5, Fibroblasts:foreskin: 0.5 |
| SKNSH_GGGTCACCAACTGAAA-1 | Neurons | 0.03 | 77.98 | Raw ScoresNeurons:adrenal_medulla_cell_line: 0.14, Neurons:Schwann_cell: 0.13, Fibroblasts:foreskin: 0.13, iPS_cells:CRL2097_foreskin-derived:undiff.: 0.13, iPS_cells:fibroblast-derived:Retroviral_transf: 0.13, iPS_cells:adipose_stem_cell-derived:lentiviral: 0.13, iPS_cells:iPS:minicircle-derived: 0.13, iPS_cells:fibroblast-derived:Direct_del._reprog: 0.12, iPS_cells:skin_fibroblast-derived: 0.12, Embryonic_stem_cells: 0.12 |
| SKNSH_GTGCTTCCAGCTGTGC-1 | Neurons | 0.17 | 77.97 | Raw ScoresNeurons:adrenal_medulla_cell_line: 0.44, MSC: 0.41, Neurons:Schwann_cell: 0.4, Smooth_muscle_cells:vascular: 0.4, Fibroblasts:breast: 0.4, iPS_cells:skin_fibroblast: 0.4, Smooth_muscle_cells:vascular:IL-17: 0.4, iPS_cells:CRL2097_foreskin: 0.4, Fibroblasts:foreskin: 0.4, iPS_cells:foreskin_fibrobasts: 0.4 |
| BE2C_ATCGTAGTCAGGACGA-1 | Neurons | 0.05 | 77.43 | Raw ScoresNeurons:adrenal_medulla_cell_line: 0.15, Neuroepithelial_cell:ESC-derived: 0.14, iPS_cells:PDB_2lox-22: 0.13, iPS_cells:CRL2097_foreskin-derived:undiff.: 0.13, iPS_cells:PDB_2lox-17: 0.13, Tissue_stem_cells:CD326-CD56+: 0.13, iPS_cells:PDB_2lox-21: 0.13, iPS_cells:fibroblast-derived:Retroviral_transf: 0.13, iPS_cells:iPS:minicircle-derived: 0.13, iPS_cells:PDB_2lox-5: 0.13 |
| SKNSH_CCACGAGAGAATAGTC-1 | Neurons | 0.13 | 75.39 | Raw ScoresMSC: 0.29, Fibroblasts:foreskin: 0.28, iPS_cells:CRL2097_foreskin: 0.28, iPS_cells:skin_fibroblast: 0.28, Neurons:adrenal_medulla_cell_line: 0.28, iPS_cells:foreskin_fibrobasts: 0.27, Smooth_muscle_cells:vascular: 0.27, Neurons:Schwann_cell: 0.27, iPS_cells:fibroblasts: 0.27, Tissue_stem_cells:lipoma-derived_MSC: 0.27 |
| SKNSH_TAGTGCAAGACCCGCT-1 | MSC | 0.18 | 74.85 | Raw ScoresMSC: 0.31, iPS_cells:skin_fibroblast: 0.3, iPS_cells:CRL2097_foreskin: 0.3, Smooth_muscle_cells:vascular: 0.3, Fibroblasts:foreskin: 0.29, iPS_cells:foreskin_fibrobasts: 0.29, iPS_cells:fibroblasts: 0.29, iPS_cells:PDB_fibroblasts: 0.29, Fibroblasts:breast: 0.29, Tissue_stem_cells:lipoma-derived_MSC: 0.28 |
| SKNSH_ATCATTCGTTCAATCG-1 | MSC | 0.13 | 73.92 | Raw ScoresMSC: 0.24, Smooth_muscle_cells:vascular: 0.23, iPS_cells:CRL2097_foreskin: 0.23, Smooth_muscle_cells:vascular:IL-17: 0.23, Fibroblasts:breast: 0.23, Fibroblasts:foreskin: 0.22, iPS_cells:skin_fibroblast: 0.22, Neurons:Schwann_cell: 0.22, iPS_cells:foreskin_fibrobasts: 0.22, iPS_cells:fibroblasts: 0.22 |
| SKNSH_CGGGTGTGTGGTTCTA-1 | MSC | 0.14 | 72.63 | Raw ScoresMSC: 0.24, Fibroblasts:foreskin: 0.24, Smooth_muscle_cells:vascular: 0.23, iPS_cells:skin_fibroblast: 0.23, iPS_cells:CRL2097_foreskin: 0.23, Neurons:Schwann_cell: 0.23, Tissue_stem_cells:dental_pulp: 0.23, iPS_cells:foreskin_fibrobasts: 0.23, iPS_cells:PDB_fibroblasts: 0.22, iPS_cells:fibroblasts: 0.22 |
| MHHNB11_GGGATGACACCGTGCA-1 | Neurons | 0.35 | 72.62 | Raw ScoresNeurons:adrenal_medulla_cell_line: 0.73, Neuroepithelial_cell:ESC-derived: 0.6, iPS_cells:PDB_1lox-21Puro-20: 0.58, iPS_cells:PDB_1lox-21Puro-26: 0.58, iPS_cells:PDB_1lox-17Puro-10: 0.57, iPS_cells:PDB_2lox-22: 0.57, iPS_cells:PDB_1lox-17Puro-5: 0.57, Astrocyte:Embryonic_stem_cell-derived: 0.57, iPS_cells:PDB_2lox-21: 0.56, iPS_cells:PDB_2lox-17: 0.56 |
| GIMEN_ATAGGCTCACAAGTGG-1 | Smooth_muscle_cells | 0.07 | 72.45 | Raw ScoresSmooth_muscle_cells:vascular: 0.18, MSC: 0.17, Fibroblasts:foreskin: 0.17, Neurons:Schwann_cell: 0.16, Tissue_stem_cells:lipoma-derived_MSC: 0.16, iPS_cells:skin_fibroblast: 0.16, Fibroblasts:breast: 0.16, Smooth_muscle_cells:vascular:IL-17: 0.16, iPS_cells:CRL2097_foreskin: 0.16, iPS_cells:foreskin_fibrobasts: 0.16 |
| SKNSH_CCCTGATGTACTGACT-1 | Smooth_muscle_cells | 0.19 | 72.23 | Raw ScoresSmooth_muscle_cells:bronchial: 0.26, iPS_cells:CRL2097_foreskin: 0.26, Smooth_muscle_cells:bronchial:vit_D: 0.26, Smooth_muscle_cells:vascular: 0.26, MSC: 0.26, Smooth_muscle_cells:vascular:IL-17: 0.25, Fibroblasts:breast: 0.25, Fibroblasts:foreskin: 0.25, iPS_cells:skin_fibroblast: 0.25, iPS_cells:foreskin_fibrobasts: 0.25 |
| SKNSH_TGTTTGTCAATTGCGT-1 | Smooth_muscle_cells | 0.22 | 72.11 | Raw ScoresFibroblasts:breast: 0.46, Smooth_muscle_cells:vascular: 0.46, Smooth_muscle_cells:vascular:IL-17: 0.46, MSC: 0.45, iPS_cells:skin_fibroblast: 0.45, iPS_cells:CRL2097_foreskin: 0.45, Smooth_muscle_cells:bronchial: 0.45, iPS_cells:foreskin_fibrobasts: 0.45, Smooth_muscle_cells:bronchial:vit_D: 0.45, iPS_cells:adipose_stem_cells: 0.44 |
| SKNSH_AAGACAACAGTCACGC-1 | Fibroblasts | 0.16 | 72.07 | Raw ScoresiPS_cells:CRL2097_foreskin: 0.24, MSC: 0.24, Smooth_muscle_cells:vascular: 0.24, Smooth_muscle_cells:vascular:IL-17: 0.24, iPS_cells:skin_fibroblast: 0.23, Fibroblasts:foreskin: 0.23, Fibroblasts:breast: 0.23, iPS_cells:foreskin_fibrobasts: 0.23, Smooth_muscle_cells:bronchial: 0.23, Smooth_muscle_cells:bronchial:vit_D: 0.23 |
| GIMEN_GCGTGCATCGACTCCT-1 | MSC | 0.07 | 70.90 | Raw ScoresMSC: 0.27, Neurons:adrenal_medulla_cell_line: 0.26, Endothelial_cells:HUVEC:IL-1b: 0.26, Endothelial_cells:HUVEC: 0.26, Tissue_stem_cells:lipoma-derived_MSC: 0.26, Fibroblasts:foreskin: 0.26, Tissue_stem_cells:adipose-derived_MSC_AM3: 0.26, iPS_cells:skin_fibroblast: 0.26, Neuroepithelial_cell:ESC-derived: 0.26, Neurons:Schwann_cell: 0.25 |
| BE2C_TAGACCAGTCCCTGAG-1 | Neurons | 0.10 | 70.82 | Raw ScoresNeurons:adrenal_medulla_cell_line: 0.23, Neuroepithelial_cell:ESC-derived: 0.2, iPS_cells:PDB_2lox-22: 0.2, iPS_cells:PDB_2lox-17: 0.2, Embryonic_stem_cells: 0.2, iPS_cells:adipose_stem_cell-derived:minicircle-derived: 0.2, iPS_cells:PDB_2lox-21: 0.2, iPS_cells:PDB_1lox-21Puro-20: 0.2, iPS_cells:fibroblast-derived:Retroviral_transf: 0.2, iPS_cells:PDB_2lox-5: 0.2 |
| SKNSH_AGACCCGCATACTGAC-1 | MSC | 0.28 | 70.77 | Raw ScoresMSC: 0.59, iPS_cells:skin_fibroblast: 0.57, Fibroblasts:foreskin: 0.57, iPS_cells:foreskin_fibrobasts: 0.57, Tissue_stem_cells:lipoma-derived_MSC: 0.56, iPS_cells:CRL2097_foreskin: 0.56, Smooth_muscle_cells:umbilical_vein: 0.56, Smooth_muscle_cells:vascular: 0.55, iPS_cells:PDB_fibroblasts: 0.55, Tissue_stem_cells:adipose-derived_MSC_AM3: 0.55 |
| SKNSH_TACCGGGCATCCCGTT-1 | Fibroblasts | 0.04 | 70.03 | Raw ScoresSmooth_muscle_cells:umbilical_vein: 0.14, Tissue_stem_cells:lipoma-derived_MSC: 0.14, Tissue_stem_cells:adipose-derived_MSC_AM3: 0.14, Fibroblasts:foreskin: 0.14, MSC: 0.14, iPS_cells:foreskin_fibrobasts: 0.13, Tissue_stem_cells:dental_pulp: 0.13, Smooth_muscle_cells:vascular: 0.13, iPS_cells:CRL2097_foreskin: 0.13, Smooth_muscle_cells:vascular:IL-17: 0.13 |
| BE2C_CTAACCCGTAGCGTCC-1 | Neurons | 0.22 | 69.78 | Raw ScoresNeurons:adrenal_medulla_cell_line: 0.56, Neuroepithelial_cell:ESC-derived: 0.46, iPS_cells:PDB_1lox-21Puro-20: 0.45, iPS_cells:PDB_1lox-21Puro-26: 0.45, iPS_cells:PDB_1lox-17Puro-10: 0.45, iPS_cells:PDB_2lox-22: 0.44, iPS_cells:PDB_1lox-17Puro-5: 0.44, iPS_cells:PDB_2lox-17: 0.44, iPS_cells:PDB_2lox-21: 0.44, Embryonic_stem_cells: 0.44 |
| SKNSH_AACCACACAGCGACCT-1 | Neurons | 0.09 | 69.25 | Raw ScoresNeurons:adrenal_medulla_cell_line: 0.17, iPS_cells:CRL2097_foreskin: 0.15, Smooth_muscle_cells:vascular: 0.15, Fibroblasts:breast: 0.15, iPS_cells:skin_fibroblast: 0.15, MSC: 0.15, iPS_cells:fibroblasts: 0.15, Smooth_muscle_cells:vascular:IL-17: 0.15, iPS_cells:PDB_fibroblasts: 0.14, iPS_cells:foreskin_fibrobasts: 0.14 |
| GIMEN_GGGAGTATCACTACGA-1 | MSC | 0.09 | 68.63 | Raw ScoresSmooth_muscle_cells:vascular: 0.15, MSC: 0.14, Smooth_muscle_cells:bronchial: 0.14, Smooth_muscle_cells:bronchial:vit_D: 0.14, Smooth_muscle_cells:vascular:IL-17: 0.14, iPS_cells:skin_fibroblast: 0.14, iPS_cells:fibroblasts: 0.13, Neurons:Schwann_cell: 0.13, Fibroblasts:foreskin: 0.13, iPS_cells:PDB_fibroblasts: 0.13 |
| SKNSH_TGCACGGAGCTCAGAG-1 | Neurons | 0.11 | 68.61 | Raw ScoresNeurons:adrenal_medulla_cell_line: 0.22, Smooth_muscle_cells:bronchial: 0.22, Smooth_muscle_cells:bronchial:vit_D: 0.22, iPS_cells:CRL2097_foreskin: 0.22, Smooth_muscle_cells:vascular: 0.22, Smooth_muscle_cells:vascular:IL-17: 0.22, Fibroblasts:breast: 0.22, MSC: 0.21, iPS_cells:skin_fibroblast: 0.21, iPS_cells:adipose_stem_cells: 0.21 |
| SKNSH_AGAAATGAGTTCCAGT-1 | Neuroepithelial_cell | 0.07 | 68.17 | Raw ScoresNeuroepithelial_cell:ESC-derived: 0.14, Embryonic_stem_cells: 0.13, iPS_cells:CRL2097_foreskin-derived:d20_hepatic_diff: 0.13, Tissue_stem_cells:CD326-CD56+: 0.13, Fibroblasts:breast: 0.13, Neurons:adrenal_medulla_cell_line: 0.13, iPS_cells:fibroblast-derived:Direct_del._reprog: 0.13, MSC: 0.13, Tissue_stem_cells:iliac_MSC: 0.13, Tissue_stem_cells:lipoma-derived_MSC: 0.13 |
| SKNSH_TCGGGTGAGAGGTCGT-1 | Neurons | 0.26 | 68.04 | Raw ScoresNeurons:adrenal_medulla_cell_line: 0.58, Neuroepithelial_cell:ESC-derived: 0.49, Tissue_stem_cells:CD326-CD56+: 0.47, Astrocyte:Embryonic_stem_cell-derived: 0.46, Embryonic_stem_cells: 0.46, iPS_cells:PDB_2lox-22: 0.46, iPS_cells:PDB_1lox-21Puro-20: 0.46, iPS_cells:CRL2097_foreskin-derived:undiff.: 0.46, iPS_cells:PDB_2lox-21: 0.46, MSC: 0.46 |
Below shows the significant enrichments of this GEP for literature curated gene lists
This data was procured from existing single cell RNA-seq maps of neuroblastoma or related relevant data.
High ranks indicate this gene is a driver of this GEP.
These curated gene list are ranked by the P-value (on this GEP) of their constituent genes.
The Mean Count column shows the mean read count in cells scoring highly (H > 50) on this gene expression program.
Inflammatory CAF
These marker genes were curated across cancer subtypes in multiple organ systems as reviewed in Lavie et. al. (PMID 35883004) and contain inflammatory specific CAF genes:
Wilcoxon ranksum test P-value for gene set overrepresentation: 1.77e-04
Mean rank of genes in gene set: 3689.36
Rank on gene expression program of genes in gene set:
| Genes | Weight | Rank | GTEx | DepMap | Decartes | Mean.Counts | Mean.TPM |
|---|---|---|---|---|---|---|---|
| C7 | 0.0058403 | 21 | GTEx | DepMap | Descartes | 3.97 | 36.83 |
| PDGFD | 0.0030701 | 140 | GTEx | DepMap | Descartes | 0.20 | 3.14 |
| PDGFRB | 0.0027684 | 177 | GTEx | DepMap | Descartes | 0.53 | 5.82 |
| HGF | 0.0019391 | 352 | GTEx | DepMap | Descartes | 3.20 | 39.32 |
| LIF | 0.0013447 | 643 | GTEx | DepMap | Descartes | 0.02 | 0.81 |
| C3 | 0.0010157 | 953 | GTEx | DepMap | Descartes | 0.00 | 0.00 |
| CFB | 0.0007076 | 1318 | GTEx | DepMap | Descartes | 0.01 | 0.34 |
| IGF1 | 0.0006425 | 1405 | GTEx | DepMap | Descartes | 0.00 | 0.00 |
| IL33 | 0.0005148 | 1658 | GTEx | DepMap | Descartes | 0.01 | 0.49 |
| PDGFRA | 0.0003557 | 2047 | GTEx | DepMap | Descartes | 0.38 | 3.75 |
| RGMA | 0.0002076 | 2496 | GTEx | DepMap | Descartes | 0.00 | 0.00 |
| SERPING1 | 0.0000500 | 3022 | GTEx | DepMap | Descartes | 0.16 | 4.17 |
| PDPN | -0.0000188 | 3325 | GTEx | DepMap | Descartes | 0.00 | 0.00 |
| CXCL14 | -0.0001307 | 3785 | GTEx | DepMap | Descartes | 0.00 | 0.00 |
| IL10 | -0.0002084 | 4125 | GTEx | DepMap | Descartes | 0.00 | 0.00 |
| SCARA5 | -0.0002215 | 4198 | GTEx | DepMap | Descartes | 0.00 | 0.00 |
| CFD | -0.0003470 | 4799 | GTEx | DepMap | Descartes | 0.01 | 0.48 |
| CXCL2 | -0.0005267 | 5435 | GTEx | DepMap | Descartes | 0.00 | 0.00 |
| SCARA3 | -0.0007534 | 6210 | GTEx | DepMap | Descartes | 0.15 | 2.15 |
| GPX3 | -0.0008128 | 6361 | GTEx | DepMap | Descartes | 0.12 | 3.75 |
| IGFBP6 | -0.0009846 | 6813 | GTEx | DepMap | Descartes | 1.97 | 95.32 |
| CCL2 | -0.0011128 | 7149 | GTEx | DepMap | Descartes | 0.23 | 25.77 |
| IL1R1 | -0.0015436 | 8099 | GTEx | DepMap | Descartes | 0.09 | 1.32 |
| CXCL12 | -0.0015482 | 8106 | GTEx | DepMap | Descartes | 0.09 | 1.84 |
| SOD2 | -0.0025546 | 9597 | GTEx | DepMap | Descartes | 0.63 | 1.95 |
Myofibroblastic CAF
These marker genes were curated across cancer subtypes in multiple organ systems as reviewed in Lavie et. al. (PMID 35883004) and contain myofibroblastic specific CAF genes:
Wilcoxon ranksum test P-value for gene set overrepresentation: 1.51e-03
Mean rank of genes in gene set: 4742.92
Rank on gene expression program of genes in gene set:
| Genes | Weight | Rank | GTEx | DepMap | Decartes | Mean.Counts | Mean.TPM |
|---|---|---|---|---|---|---|---|
| COL3A1 | 0.0074350 | 11 | GTEx | DepMap | Descartes | 7.28 | 101.15 |
| THBS2 | 0.0037708 | 84 | GTEx | DepMap | Descartes | 0.36 | 4.32 |
| TNC | 0.0036756 | 93 | GTEx | DepMap | Descartes | 0.97 | 6.90 |
| COL11A1 | 0.0033579 | 117 | GTEx | DepMap | Descartes | 0.07 | 0.74 |
| MMP11 | 0.0032267 | 129 | GTEx | DepMap | Descartes | 0.39 | 6.73 |
| COL5A1 | 0.0031547 | 135 | GTEx | DepMap | Descartes | 0.70 | 6.77 |
| VCAN | 0.0030492 | 142 | GTEx | DepMap | Descartes | 2.74 | 15.75 |
| FN1 | 0.0021965 | 274 | GTEx | DepMap | Descartes | 4.12 | 37.60 |
| MEF2C | 0.0014448 | 569 | GTEx | DepMap | Descartes | 0.32 | 2.61 |
| WNT5A | 0.0013621 | 630 | GTEx | DepMap | Descartes | 0.29 | 3.72 |
| COL13A1 | 0.0013240 | 656 | GTEx | DepMap | Descartes | 0.08 | 2.14 |
| MYLK | 0.0013209 | 660 | GTEx | DepMap | Descartes | 1.65 | 9.98 |
| COL1A2 | 0.0011707 | 788 | GTEx | DepMap | Descartes | 0.44 | 6.61 |
| TGFB2 | 0.0008615 | 1117 | GTEx | DepMap | Descartes | 0.12 | 1.45 |
| TGFBR2 | 0.0007573 | 1230 | GTEx | DepMap | Descartes | 0.31 | 4.33 |
| ITGA7 | 0.0006758 | 1359 | GTEx | DepMap | Descartes | 0.03 | 0.51 |
| POSTN | 0.0005461 | 1587 | GTEx | DepMap | Descartes | 0.74 | 15.88 |
| COL10A1 | 0.0005131 | 1663 | GTEx | DepMap | Descartes | 0.01 | 0.08 |
| MYH11 | 0.0004940 | 1714 | GTEx | DepMap | Descartes | 0.00 | 0.00 |
| THBS1 | 0.0004430 | 1818 | GTEx | DepMap | Descartes | 1.11 | 10.82 |
| COL5A2 | 0.0004400 | 1825 | GTEx | DepMap | Descartes | 0.18 | 2.48 |
| TMEM119 | 0.0004224 | 1870 | GTEx | DepMap | Descartes | 0.48 | 7.60 |
| COL14A1 | 0.0003101 | 2188 | GTEx | DepMap | Descartes | 0.00 | 0.00 |
| COL8A1 | 0.0002567 | 2346 | GTEx | DepMap | Descartes | 0.23 | 3.21 |
| ACTG2 | -0.0000617 | 3499 | GTEx | DepMap | Descartes | 0.00 | 0.00 |
| THY1 | -0.0001342 | 3805 | GTEx | DepMap | Descartes | 4.68 | 58.73 |
| MMP2 | -0.0003501 | 4814 | GTEx | DepMap | Descartes | 2.78 | 37.39 |
| COL12A1 | -0.0004296 | 5093 | GTEx | DepMap | Descartes | 0.06 | 0.30 |
| IGFBP3 | -0.0004820 | 5277 | GTEx | DepMap | Descartes | 1.17 | 29.03 |
| COL4A1 | -0.0006089 | 5744 | GTEx | DepMap | Descartes | 0.34 | 3.09 |
| DCN | -0.0008165 | 6373 | GTEx | DepMap | Descartes | 0.12 | 1.45 |
| TGFBR1 | -0.0012002 | 7374 | GTEx | DepMap | Descartes | 0.32 | 2.47 |
| VEGFA | -0.0012075 | 7386 | GTEx | DepMap | Descartes | 0.41 | 1.05 |
| BGN | -0.0012522 | 7509 | GTEx | DepMap | Descartes | 0.29 | 7.08 |
| COL15A1 | -0.0016592 | 8311 | GTEx | DepMap | Descartes | 0.00 | 0.00 |
| PGF | -0.0019523 | 8806 | GTEx | DepMap | Descartes | 0.09 | 0.97 |
| COL1A1 | -0.0019570 | 8815 | GTEx | DepMap | Descartes | 4.36 | 51.78 |
| TGFB1 | -0.0022006 | 9157 | GTEx | DepMap | Descartes | 1.24 | 26.58 |
| MYL9 | -0.0023373 | 9339 | GTEx | DepMap | Descartes | 0.00 | 0.00 |
| ACTA2 | -0.0023770 | 9384 | GTEx | DepMap | Descartes | 0.31 | 12.82 |
| IGFBP7 | -0.0025130 | 9556 | GTEx | DepMap | Descartes | 0.09 | 4.09 |
| HOPX | -0.0029339 | 9986 | GTEx | DepMap | Descartes | 0.00 | 0.00 |
| LUM | -0.0029889 | 10034 | GTEx | DepMap | Descartes | 0.46 | 9.72 |
| CNN2 | -0.0038102 | 10712 | GTEx | DepMap | Descartes | 0.50 | 11.14 |
| TAGLN | -0.0043604 | 11049 | GTEx | DepMap | Descartes | 0.39 | 8.18 |
| TPM2 | -0.0055695 | 11573 | GTEx | DepMap | Descartes | 3.11 | 59.28 |
| RGS5 | -0.0063788 | 11796 | GTEx | DepMap | Descartes | 29.36 | 155.90 |
| CNN3 | -0.0069684 | 11920 | GTEx | DepMap | Descartes | 3.55 | 62.73 |
| TPM1 | -0.0078902 | 12086 | GTEx | DepMap | Descartes | 11.92 | 159.35 |
Stromal 2 (Hanemaaijer)
Marker genes obtained from Supplementary Table SD of Hanemaaijer et al (PMID 33500353). The authors generated single-cell RNA-seq data (sort-seq, 2,229 cells total) from mouse adrenal glads at E13.5, E14.5, E17.5, E18.5, P1 and P5. These were marker genes that matched with a similar dataset generated by Furlan et al (PMID 28684471). This particular set of markers are for Stroma subcluster:
Wilcoxon ranksum test P-value for gene set overrepresentation: 2.03e-03
Mean rank of genes in gene set: 3270.58
Rank on gene expression program of genes in gene set:
| Genes | Weight | Rank | GTEx | DepMap | Decartes | Mean.Counts | Mean.TPM |
|---|---|---|---|---|---|---|---|
| FBN1 | 0.0108167 | 2 | GTEx | DepMap | Descartes | 3.31 | 20.87 |
| FSTL1 | 0.0051975 | 35 | GTEx | DepMap | Descartes | 1.85 | 22.71 |
| ITM2A | 0.0015594 | 515 | GTEx | DepMap | Descartes | 0.10 | 3.35 |
| POSTN | 0.0005461 | 1587 | GTEx | DepMap | Descartes | 0.74 | 15.88 |
| COL5A2 | 0.0004400 | 1825 | GTEx | DepMap | Descartes | 0.18 | 2.48 |
| FBN2 | 0.0003958 | 1944 | GTEx | DepMap | Descartes | 0.17 | 0.57 |
| COL14A1 | 0.0003101 | 2188 | GTEx | DepMap | Descartes | 0.00 | 0.00 |
| GSN | 0.0001221 | 2786 | GTEx | DepMap | Descartes | 0.51 | 4.50 |
| PENK | -0.0003358 | 4739 | GTEx | DepMap | Descartes | 0.00 | 0.00 |
| SFRP1 | -0.0010644 | 7013 | GTEx | DepMap | Descartes | 4.37 | 39.84 |
| IGFBP5 | -0.0011052 | 7134 | GTEx | DepMap | Descartes | 2.74 | 19.99 |
| GAS1 | -0.0024588 | 9479 | GTEx | DepMap | Descartes | 0.21 | 4.17 |
Below shows ranks on this GEP for literature curated gene lists for large gene sets
These include those reported as mesenchymal/adrenergic by Van Groningen et al.
High ranks indicate this gene is a driver of this GEP (note these results are not ordered).
The Mean Count column shows the mean read count in cells scoring highly (H > 50) on this gene expression program.
VanGroningen Adrenergic Genes
Adrenergic marker genes from Supplementary Table 2 of Van Groningen et al. Nature Genetics 2017. These genes were identified by differential expression analysis of mesenchymal-like and adrenergic-like neuroblastoma cell lines.
Wilcoxon ranksum test P-value for gene set overrepresentation: 1.00e+00
Mean rank of genes in gene set: 8067.2
Median rank of genes in gene set: 8994
Rank on gene expression program of top 30 genes in gene set:
| Genes | Weight | Rank | GTEx | DepMap | Descartes | Mean.Counts | Mean.TPM |
|---|---|---|---|---|---|---|---|
| SYT4 | 0.0075257 | 10 | GTEx | DepMap | Descartes | 5.05 | 73.42 |
| ADAM22 | 0.0057910 | 22 | GTEx | DepMap | Descartes | 1.44 | 8.40 |
| SLIT3 | 0.0033737 | 114 | GTEx | DepMap | Descartes | 2.99 | 17.43 |
| SYNPO2 | 0.0033574 | 118 | GTEx | DepMap | Descartes | 4.10 | 13.72 |
| NRCAM | 0.0023748 | 233 | GTEx | DepMap | Descartes | 0.80 | 4.95 |
| STRA6 | 0.0020276 | 312 | GTEx | DepMap | Descartes | 0.28 | 8.71 |
| KIDINS220 | 0.0019179 | 363 | GTEx | DepMap | Descartes | 2.13 | 12.39 |
| RET | 0.0018244 | 394 | GTEx | DepMap | Descartes | 0.72 | 7.60 |
| THSD7A | 0.0017908 | 406 | GTEx | DepMap | Descartes | 0.91 | 2.93 |
| RIMBP2 | 0.0016594 | 459 | GTEx | DepMap | Descartes | 0.27 | 2.76 |
| EML6 | 0.0016448 | 471 | GTEx | DepMap | Descartes | 0.16 | 1.20 |
| NCAM1 | 0.0014941 | 545 | GTEx | DepMap | Descartes | 0.99 | 7.49 |
| RNF150 | 0.0013864 | 620 | GTEx | DepMap | Descartes | 0.88 | 4.16 |
| PRSS12 | 0.0011240 | 832 | GTEx | DepMap | Descartes | 1.49 | 18.34 |
| RBMS3 | 0.0010635 | 897 | GTEx | DepMap | Descartes | 2.62 | 15.07 |
| KIF5C | 0.0010192 | 946 | GTEx | DepMap | Descartes | 1.35 | 5.20 |
| RPS6KA2 | 0.0010036 | 961 | GTEx | DepMap | Descartes | 0.83 | 6.43 |
| TH | 0.0009560 | 1013 | GTEx | DepMap | Descartes | 0.15 | 6.37 |
| DIABLO | 0.0009493 | 1020 | GTEx | DepMap | Descartes | 0.16 | 3.55 |
| ABCA3 | 0.0006531 | 1390 | GTEx | DepMap | Descartes | 0.24 | 2.14 |
| SV2C | 0.0005860 | 1507 | GTEx | DepMap | Descartes | 0.19 | 0.70 |
| ANK2 | 0.0005690 | 1542 | GTEx | DepMap | Descartes | 0.41 | 1.58 |
| MIAT | 0.0005524 | 1571 | GTEx | DepMap | Descartes | 0.28 | 2.41 |
| MAGI3 | 0.0005309 | 1624 | GTEx | DepMap | Descartes | 0.96 | 6.37 |
| SCN3A | 0.0005065 | 1685 | GTEx | DepMap | Descartes | 0.15 | 0.92 |
| AUTS2 | 0.0004807 | 1737 | GTEx | DepMap | Descartes | 0.77 | 4.89 |
| BMPR1B | 0.0004180 | 1882 | GTEx | DepMap | Descartes | 0.35 | 2.49 |
| CACNA2D2 | 0.0004073 | 1912 | GTEx | DepMap | Descartes | 0.19 | 1.37 |
| ALK | 0.0003751 | 1999 | GTEx | DepMap | Descartes | 0.12 | 0.52 |
| CADM1 | 0.0003747 | 2001 | GTEx | DepMap | Descartes | 1.06 | 6.11 |
VanGroningen Mesenchymal Genes
Mesenchymal marker genes from Supplementary Table 2 of Van Groningen et al. Nature Genetics 2017. These genes were identified by differential expression analysis of mesenchymal-like and adrenergic-like neuroblastoma cell lines.
Wilcoxon ranksum test P-value for gene set overrepresentation: 3.05e-07
Mean rank of genes in gene set: 5423.76
Median rank of genes in gene set: 5462
Rank on gene expression program of top 30 genes in gene set:
| Genes | Weight | Rank | GTEx | DepMap | Descartes | Mean.Counts | Mean.TPM |
|---|---|---|---|---|---|---|---|
| FBN1 | 0.0108167 | 2 | GTEx | DepMap | Descartes | 3.31 | 20.87 |
| PXDN | 0.0091903 | 6 | GTEx | DepMap | Descartes | 3.41 | 31.36 |
| LAMB1 | 0.0089770 | 7 | GTEx | DepMap | Descartes | 3.00 | 38.98 |
| COL3A1 | 0.0074350 | 11 | GTEx | DepMap | Descartes | 7.28 | 101.15 |
| MRC2 | 0.0073489 | 12 | GTEx | DepMap | Descartes | 1.36 | 15.79 |
| TPBG | 0.0070279 | 14 | GTEx | DepMap | Descartes | 2.52 | 26.26 |
| SEMA3C | 0.0068156 | 16 | GTEx | DepMap | Descartes | 1.80 | 26.81 |
| EMILIN1 | 0.0060039 | 19 | GTEx | DepMap | Descartes | 2.75 | 46.25 |
| LTBP1 | 0.0055519 | 24 | GTEx | DepMap | Descartes | 1.82 | 20.51 |
| FSTL1 | 0.0051975 | 35 | GTEx | DepMap | Descartes | 1.85 | 22.71 |
| APOE | 0.0050132 | 37 | GTEx | DepMap | Descartes | 4.08 | 209.02 |
| NRP1 | 0.0046235 | 48 | GTEx | DepMap | Descartes | 1.30 | 14.92 |
| IGF2R | 0.0044457 | 55 | GTEx | DepMap | Descartes | 1.58 | 7.38 |
| LRRC17 | 0.0044349 | 56 | GTEx | DepMap | Descartes | 4.19 | 125.49 |
| ATP2B4 | 0.0042753 | 60 | GTEx | DepMap | Descartes | 1.64 | 12.14 |
| LRP10 | 0.0041779 | 64 | GTEx | DepMap | Descartes | 1.49 | 12.87 |
| RRBP1 | 0.0040901 | 68 | GTEx | DepMap | Descartes | 1.73 | 24.02 |
| IL13RA1 | 0.0040831 | 69 | GTEx | DepMap | Descartes | 0.61 | 9.43 |
| SLC38A2 | 0.0040549 | 71 | GTEx | DepMap | Descartes | 2.26 | 32.75 |
| GNS | 0.0038174 | 80 | GTEx | DepMap | Descartes | 1.00 | 13.15 |
| MGP | 0.0038026 | 82 | GTEx | DepMap | Descartes | 6.96 | 256.79 |
| GRN | 0.0037026 | 90 | GTEx | DepMap | Descartes | 3.05 | 90.95 |
| TNC | 0.0036756 | 93 | GTEx | DepMap | Descartes | 0.97 | 6.90 |
| PDIA3 | 0.0035822 | 100 | GTEx | DepMap | Descartes | 5.11 | 88.71 |
| NOTCH2 | 0.0035344 | 105 | GTEx | DepMap | Descartes | 0.39 | 2.53 |
| MAML2 | 0.0034097 | 110 | GTEx | DepMap | Descartes | 0.73 | 7.29 |
| LAMC1 | 0.0034079 | 111 | GTEx | DepMap | Descartes | 1.41 | 12.67 |
| APP | 0.0033814 | 113 | GTEx | DepMap | Descartes | 3.17 | 52.01 |
| COL11A1 | 0.0033579 | 117 | GTEx | DepMap | Descartes | 0.07 | 0.74 |
| PLEKHH2 | 0.0032741 | 123 | GTEx | DepMap | Descartes | 0.12 | 1.42 |
Descartes adrenocortical markers
Top 50 marker genes of adrenocortical cells in the Decartes fetal adrenal single cell map (https://atlas.brotmanbaty.org/bbi/human-gene-expression-during-development/cell/adrenocortical/in/adrenal)
Wilcoxon ranksum test P-value for gene set overrepresentation: 9.37e-03
Mean rank of genes in gene set: 4857.64
Median rank of genes in gene set: 4619.5
Rank on gene expression program of top 30 genes in gene set:
| Genes | Weight | Rank | GTEx | DepMap | Descartes | Mean.Counts | Mean.TPM |
|---|---|---|---|---|---|---|---|
| CLU | 0.0053231 | 29 | GTEx | DepMap | Descartes | 4.04 | 93.42 |
| TM7SF2 | 0.0053045 | 30 | GTEx | DepMap | Descartes | 2.11 | 55.21 |
| IGF1R | 0.0036120 | 97 | GTEx | DepMap | Descartes | 0.90 | 4.67 |
| NPC1 | 0.0015199 | 530 | GTEx | DepMap | Descartes | 0.16 | 2.03 |
| POR | 0.0010723 | 884 | GTEx | DepMap | Descartes | 0.65 | 14.34 |
| GRAMD1B | 0.0010122 | 956 | GTEx | DepMap | Descartes | 0.10 | 0.79 |
| LDLR | 0.0009176 | 1055 | GTEx | DepMap | Descartes | 0.39 | 5.47 |
| SCAP | 0.0006197 | 1440 | GTEx | DepMap | Descartes | 0.54 | 6.70 |
| SCARB1 | 0.0003144 | 2168 | GTEx | DepMap | Descartes | 0.40 | 4.07 |
| DHCR7 | 0.0001540 | 2652 | GTEx | DepMap | Descartes | 0.23 | 4.80 |
| DNER | 0.0000397 | 3053 | GTEx | DepMap | Descartes | 0.07 | 0.89 |
| HMGCR | 0.0000023 | 3219 | GTEx | DepMap | Descartes | 0.54 | 5.87 |
| PDE10A | -0.0000023 | 3249 | GTEx | DepMap | Descartes | 0.07 | 0.64 |
| ERN1 | -0.0000126 | 3301 | GTEx | DepMap | Descartes | 0.08 | 0.59 |
| FREM2 | -0.0000514 | 3460 | GTEx | DepMap | Descartes | 0.00 | 0.00 |
| SGCZ | -0.0000589 | 3487 | GTEx | DepMap | Descartes | 0.00 | 0.00 |
| INHA | -0.0000682 | 3530 | GTEx | DepMap | Descartes | 0.01 | 0.26 |
| FRMD5 | -0.0001783 | 3989 | GTEx | DepMap | Descartes | 0.18 | 2.13 |
| MSMO1 | -0.0004741 | 5250 | GTEx | DepMap | Descartes | 0.61 | 12.32 |
| SLC1A2 | -0.0004765 | 5261 | GTEx | DepMap | Descartes | 0.00 | 0.00 |
| SLC16A9 | -0.0004874 | 5296 | GTEx | DepMap | Descartes | 0.21 | 2.49 |
| STAR | -0.0005892 | 5671 | GTEx | DepMap | Descartes | 0.00 | 0.00 |
| PEG3 | -0.0005904 | 5676 | GTEx | DepMap | Descartes | 0.05 | NA |
| SH3PXD2B | -0.0006682 | 5936 | GTEx | DepMap | Descartes | 0.31 | 2.05 |
| PAPSS2 | -0.0009183 | 6637 | GTEx | DepMap | Descartes | 0.68 | 9.82 |
| FDXR | -0.0010374 | 6944 | GTEx | DepMap | Descartes | 0.97 | 18.76 |
| HMGCS1 | -0.0010555 | 6986 | GTEx | DepMap | Descartes | 0.50 | 5.87 |
| SH3BP5 | -0.0010881 | 7073 | GTEx | DepMap | Descartes | 0.68 | 9.26 |
| APOC1 | -0.0013652 | 7751 | GTEx | DepMap | Descartes | 0.14 | 15.47 |
| DHCR24 | -0.0013742 | 7773 | GTEx | DepMap | Descartes | 0.65 | 4.21 |
Descartes chromaffin markers
Top 50 marker genes of chromaffin cells in the Decartes fetal adrenal single cell map (https://atlas.brotmanbaty.org/bbi/human-gene-expression-during-development/cell/chromaffin/in/adrenal)
Wilcoxon ranksum test P-value for gene set overrepresentation: 9.69e-01
Mean rank of genes in gene set: 7326.83
Median rank of genes in gene set: 6718
Rank on gene expression program of top 30 genes in gene set:
| Genes | Weight | Rank | GTEx | DepMap | Descartes | Mean.Counts | Mean.TPM |
|---|---|---|---|---|---|---|---|
| PLXNA4 | 0.0033847 | 112 | GTEx | DepMap | Descartes | 0.48 | 2.36 |
| SYNPO2 | 0.0033574 | 118 | GTEx | DepMap | Descartes | 4.10 | 13.72 |
| SLC44A5 | 0.0013069 | 671 | GTEx | DepMap | Descartes | 0.23 | 3.25 |
| SLC6A2 | 0.0012717 | 698 | GTEx | DepMap | Descartes | 0.91 | 6.89 |
| ALK | 0.0003751 | 1999 | GTEx | DepMap | Descartes | 0.12 | 0.52 |
| IL7 | -0.0000313 | 3375 | GTEx | DepMap | Descartes | 0.27 | 6.58 |
| TMEM132C | -0.0002197 | 4181 | GTEx | DepMap | Descartes | 0.00 | 0.00 |
| HS3ST5 | -0.0002222 | 4204 | GTEx | DepMap | Descartes | 0.11 | 1.70 |
| EPHA6 | -0.0002343 | 4257 | GTEx | DepMap | Descartes | 0.01 | 0.01 |
| FAT3 | -0.0002596 | 4374 | GTEx | DepMap | Descartes | 0.01 | 0.03 |
| PTCHD1 | -0.0003497 | 4812 | GTEx | DepMap | Descartes | 0.01 | 0.07 |
| EYA4 | -0.0004379 | 5119 | GTEx | DepMap | Descartes | 0.12 | 0.36 |
| RGMB | -0.0004396 | 5125 | GTEx | DepMap | Descartes | 0.22 | 3.77 |
| CNKSR2 | -0.0004693 | 5231 | GTEx | DepMap | Descartes | 0.09 | 0.66 |
| ANKFN1 | -0.0007528 | 6207 | GTEx | DepMap | Descartes | 0.00 | 0.00 |
| TMEFF2 | -0.0007748 | 6264 | GTEx | DepMap | Descartes | 0.04 | 0.93 |
| RYR2 | -0.0008034 | 6341 | GTEx | DepMap | Descartes | 0.01 | 0.04 |
| RBFOX1 | -0.0008325 | 6420 | GTEx | DepMap | Descartes | 0.06 | 0.14 |
| GREM1 | -0.0008765 | 6532 | GTEx | DepMap | Descartes | 0.24 | 0.98 |
| NTRK1 | -0.0009409 | 6701 | GTEx | DepMap | Descartes | 0.08 | 1.09 |
| RPH3A | -0.0009466 | 6718 | GTEx | DepMap | Descartes | 0.34 | 1.64 |
| REEP1 | -0.0010630 | 7009 | GTEx | DepMap | Descartes | 0.02 | 0.15 |
| KCNB2 | -0.0014628 | 7962 | GTEx | DepMap | Descartes | 0.00 | 0.00 |
| STMN2 | -0.0018544 | 8655 | GTEx | DepMap | Descartes | 15.12 | 209.79 |
| ISL1 | -0.0020382 | 8936 | GTEx | DepMap | Descartes | 1.78 | 31.26 |
| EYA1 | -0.0022154 | 9173 | GTEx | DepMap | Descartes | 0.29 | 1.43 |
| CNTFR | -0.0023176 | 9303 | GTEx | DepMap | Descartes | 0.59 | 8.13 |
| MARCH11 | -0.0028205 | 9888 | GTEx | DepMap | Descartes | 1.01 | NA |
| NPY | -0.0031660 | 10207 | GTEx | DepMap | Descartes | 4.00 | 412.72 |
| MAP1B | -0.0036827 | 10622 | GTEx | DepMap | Descartes | 16.34 | 78.95 |
Descartes Vascular_endothelial markers
Top 50 marker genes of Vascular_endothelial cells in the Decartes fetal adrenal single cell map (https://atlas.brotmanbaty.org/bbi/human-gene-expression-during-development/cell/vascular_endothelial/in/adrenal)
Wilcoxon ranksum test P-value for gene set overrepresentation: 6.84e-04
Mean rank of genes in gene set: 4396.5
Median rank of genes in gene set: 3962
Rank on gene expression program of top 30 genes in gene set:
| Genes | Weight | Rank | GTEx | DepMap | Descartes | Mean.Counts | Mean.TPM |
|---|---|---|---|---|---|---|---|
| SLCO2A1 | 0.0014010 | 608 | GTEx | DepMap | Descartes | 0.02 | 0.31 |
| CHRM3 | 0.0012022 | 757 | GTEx | DepMap | Descartes | 0.59 | 1.80 |
| CEACAM1 | 0.0011343 | 824 | GTEx | DepMap | Descartes | 0.01 | 0.19 |
| PTPRB | 0.0009787 | 987 | GTEx | DepMap | Descartes | 0.13 | 0.79 |
| EHD3 | 0.0007445 | 1250 | GTEx | DepMap | Descartes | 0.35 | 4.01 |
| CLDN5 | 0.0005517 | 1574 | GTEx | DepMap | Descartes | 0.01 | 0.02 |
| CYP26B1 | 0.0003239 | 2136 | GTEx | DepMap | Descartes | 0.00 | 0.00 |
| MMRN2 | 0.0002868 | 2256 | GTEx | DepMap | Descartes | 0.01 | 0.17 |
| TEK | 0.0001253 | 2775 | GTEx | DepMap | Descartes | 0.01 | 0.01 |
| ROBO4 | 0.0000811 | 2922 | GTEx | DepMap | Descartes | 0.00 | 0.00 |
| FLT4 | 0.0000610 | 2995 | GTEx | DepMap | Descartes | 0.00 | 0.00 |
| PODXL | 0.0000204 | 3132 | GTEx | DepMap | Descartes | 0.34 | 3.39 |
| MYRIP | 0.0000130 | 3164 | GTEx | DepMap | Descartes | 0.28 | 2.70 |
| KDR | 0.0000108 | 3174 | GTEx | DepMap | Descartes | 0.00 | 0.00 |
| SHANK3 | -0.0000316 | 3378 | GTEx | DepMap | Descartes | 0.02 | 0.12 |
| CDH5 | -0.0000342 | 3397 | GTEx | DepMap | Descartes | 0.00 | 0.00 |
| KANK3 | -0.0000665 | 3522 | GTEx | DepMap | Descartes | 0.00 | 0.00 |
| NR5A2 | -0.0000999 | 3667 | GTEx | DepMap | Descartes | 0.00 | 0.00 |
| BTNL9 | -0.0001599 | 3918 | GTEx | DepMap | Descartes | 0.00 | 0.00 |
| TMEM88 | -0.0001828 | 4006 | GTEx | DepMap | Descartes | 0.04 | 1.92 |
| GALNT15 | -0.0001927 | 4064 | GTEx | DepMap | Descartes | 0.01 | NA |
| TIE1 | -0.0002039 | 4108 | GTEx | DepMap | Descartes | 0.00 | 0.00 |
| F8 | -0.0002104 | 4134 | GTEx | DepMap | Descartes | 0.04 | 0.25 |
| SHE | -0.0002533 | 4352 | GTEx | DepMap | Descartes | 0.00 | 0.00 |
| RASIP1 | -0.0002897 | 4527 | GTEx | DepMap | Descartes | 0.00 | 0.00 |
| CALCRL | -0.0003301 | 4713 | GTEx | DepMap | Descartes | 0.00 | 0.00 |
| CRHBP | -0.0003304 | 4716 | GTEx | DepMap | Descartes | 0.00 | 0.00 |
| PLVAP | -0.0003941 | 4970 | GTEx | DepMap | Descartes | 0.00 | 0.00 |
| CDH13 | -0.0004499 | 5160 | GTEx | DepMap | Descartes | 0.19 | 1.68 |
| EFNB2 | -0.0006335 | 5833 | GTEx | DepMap | Descartes | 0.55 | 3.72 |
Descartes stromal markers
Top 50 marker genes of stromal cells in the Decartes fetal adrenal single cell map (https://atlas.brotmanbaty.org/bbi/human-gene-expression-during-development/cell/stromal/in/adrenal)
Wilcoxon ranksum test P-value for gene set overrepresentation: 3.05e-07
Mean rank of genes in gene set: 3555.7
Median rank of genes in gene set: 3395.5
Rank on gene expression program of top 30 genes in gene set:
| Genes | Weight | Rank | GTEx | DepMap | Descartes | Mean.Counts | Mean.TPM |
|---|---|---|---|---|---|---|---|
| COL3A1 | 0.0074350 | 11 | GTEx | DepMap | Descartes | 7.28 | 101.15 |
| PCOLCE | 0.0073031 | 13 | GTEx | DepMap | Descartes | 9.00 | 301.77 |
| C7 | 0.0058403 | 21 | GTEx | DepMap | Descartes | 3.97 | 36.83 |
| LRRC17 | 0.0044349 | 56 | GTEx | DepMap | Descartes | 4.19 | 125.49 |
| MGP | 0.0038026 | 82 | GTEx | DepMap | Descartes | 6.96 | 256.79 |
| FREM1 | 0.0021872 | 279 | GTEx | DepMap | Descartes | 0.08 | 0.34 |
| COL6A3 | 0.0020674 | 305 | GTEx | DepMap | Descartes | 0.12 | 1.71 |
| ISLR | 0.0018101 | 401 | GTEx | DepMap | Descartes | 0.04 | 0.82 |
| PAMR1 | 0.0015103 | 533 | GTEx | DepMap | Descartes | 0.01 | 0.33 |
| COL27A1 | 0.0014662 | 562 | GTEx | DepMap | Descartes | 0.06 | 0.82 |
| PCDH18 | 0.0013390 | 645 | GTEx | DepMap | Descartes | 0.26 | 3.17 |
| EDNRA | 0.0012639 | 703 | GTEx | DepMap | Descartes | 0.16 | 1.63 |
| COL1A2 | 0.0011707 | 788 | GTEx | DepMap | Descartes | 0.44 | 6.61 |
| CDH11 | 0.0008104 | 1171 | GTEx | DepMap | Descartes | 0.77 | 7.28 |
| DKK2 | 0.0007413 | 1252 | GTEx | DepMap | Descartes | 0.82 | 10.01 |
| POSTN | 0.0005461 | 1587 | GTEx | DepMap | Descartes | 0.74 | 15.88 |
| OGN | 0.0005311 | 1622 | GTEx | DepMap | Descartes | 0.00 | 0.00 |
| ELN | 0.0003744 | 2004 | GTEx | DepMap | Descartes | 0.07 | 1.45 |
| PDGFRA | 0.0003557 | 2047 | GTEx | DepMap | Descartes | 0.38 | 3.75 |
| LAMC3 | 0.0002903 | 2245 | GTEx | DepMap | Descartes | 0.00 | 0.00 |
| CLDN11 | 0.0000753 | 2947 | GTEx | DepMap | Descartes | 0.02 | 0.59 |
| HHIP | 0.0000276 | 3096 | GTEx | DepMap | Descartes | 0.15 | 1.70 |
| BICC1 | -0.0001059 | 3695 | GTEx | DepMap | Descartes | 0.26 | 1.96 |
| ADAMTS2 | -0.0001841 | 4014 | GTEx | DepMap | Descartes | 0.11 | 0.13 |
| GAS2 | -0.0002168 | 4169 | GTEx | DepMap | Descartes | 0.04 | 0.97 |
| ABCC9 | -0.0002212 | 4196 | GTEx | DepMap | Descartes | 0.03 | 0.15 |
| SCARA5 | -0.0002215 | 4198 | GTEx | DepMap | Descartes | 0.00 | 0.00 |
| CD248 | -0.0003070 | 4603 | GTEx | DepMap | Descartes | 0.20 | 3.52 |
| SFRP2 | -0.0003349 | 4735 | GTEx | DepMap | Descartes | 0.00 | 0.00 |
| ITGA11 | -0.0004038 | 5000 | GTEx | DepMap | Descartes | 0.01 | 0.07 |
Descartes sympathoblasts markers
Top 50 marker genes of sympathoblasts cells in the Decartes fetal adrenal single cell map (https://atlas.brotmanbaty.org/bbi/human-gene-expression-during-development/cell/sympathoblasts/in/adrenal)
Wilcoxon ranksum test P-value for gene set overrepresentation: 8.19e-04
Mean rank of genes in gene set: 4427.13
Median rank of genes in gene set: 4290.5
Rank on gene expression program of top 30 genes in gene set:
| Genes | Weight | Rank | GTEx | DepMap | Descartes | Mean.Counts | Mean.TPM |
|---|---|---|---|---|---|---|---|
| FGF14 | 0.0027902 | 172 | GTEx | DepMap | Descartes | 1.05 | 3.96 |
| GRM7 | 0.0018250 | 392 | GTEx | DepMap | Descartes | 0.10 | 0.84 |
| EML6 | 0.0016448 | 471 | GTEx | DepMap | Descartes | 0.16 | 1.20 |
| KCTD16 | 0.0016293 | 481 | GTEx | DepMap | Descartes | 0.26 | 0.96 |
| CNTN3 | 0.0009896 | 978 | GTEx | DepMap | Descartes | 0.02 | 0.20 |
| AGBL4 | 0.0006642 | 1374 | GTEx | DepMap | Descartes | 0.04 | 0.79 |
| CCSER1 | 0.0004682 | 1761 | GTEx | DepMap | Descartes | 0.07 | NA |
| UNC80 | 0.0004130 | 1898 | GTEx | DepMap | Descartes | 0.17 | 0.57 |
| PACRG | 0.0003737 | 2007 | GTEx | DepMap | Descartes | 0.05 | 2.20 |
| TBX20 | 0.0003022 | 2208 | GTEx | DepMap | Descartes | 0.01 | 0.50 |
| PCSK2 | 0.0002545 | 2351 | GTEx | DepMap | Descartes | 0.00 | 0.00 |
| SORCS3 | 0.0001447 | 2697 | GTEx | DepMap | Descartes | 0.00 | 0.00 |
| LAMA3 | 0.0001333 | 2744 | GTEx | DepMap | Descartes | 0.01 | 0.02 |
| NTNG1 | 0.0000746 | 2949 | GTEx | DepMap | Descartes | 0.25 | 1.24 |
| SLC24A2 | -0.0000078 | 3280 | GTEx | DepMap | Descartes | 0.00 | 0.00 |
| KSR2 | -0.0000772 | 3563 | GTEx | DepMap | Descartes | 0.01 | 0.03 |
| CDH18 | -0.0001111 | 3711 | GTEx | DepMap | Descartes | 0.09 | 0.67 |
| CDH12 | -0.0001833 | 4008 | GTEx | DepMap | Descartes | 0.00 | 0.00 |
| SLC18A1 | -0.0002067 | 4116 | GTEx | DepMap | Descartes | 0.46 | 1.24 |
| ROBO1 | -0.0002780 | 4465 | GTEx | DepMap | Descartes | 0.28 | 1.97 |
| PENK | -0.0003358 | 4739 | GTEx | DepMap | Descartes | 0.00 | 0.00 |
| DGKK | -0.0004250 | 5076 | GTEx | DepMap | Descartes | 0.04 | 0.07 |
| CHGB | -0.0004494 | 5158 | GTEx | DepMap | Descartes | 1.12 | 21.58 |
| FAM155A | -0.0004780 | 5262 | GTEx | DepMap | Descartes | 0.46 | 2.57 |
| TIAM1 | -0.0005409 | 5486 | GTEx | DepMap | Descartes | 0.24 | 1.28 |
| GALNTL6 | -0.0005977 | 5700 | GTEx | DepMap | Descartes | 0.03 | 0.05 |
| SLC35F3 | -0.0006081 | 5740 | GTEx | DepMap | Descartes | 0.03 | 0.38 |
| ARC | -0.0006161 | 5772 | GTEx | DepMap | Descartes | 0.13 | 1.38 |
| TENM1 | -0.0007477 | 6181 | GTEx | DepMap | Descartes | 0.00 | NA |
| GRID2 | -0.0007975 | 6326 | GTEx | DepMap | Descartes | 0.03 | 0.48 |
Descartes erythroblasts markers
Top 50 marker genes of erythroblasts cells in the Decartes fetal adrenal single cell map (https://atlas.brotmanbaty.org/bbi/human-gene-expression-during-development/cell/erythroblasts/in/adrenal)
Wilcoxon ranksum test P-value for gene set overrepresentation: 3.08e-01
Mean rank of genes in gene set: 5937.34
Median rank of genes in gene set: 6123
Rank on gene expression program of top 30 genes in gene set:
| Genes | Weight | Rank | GTEx | DepMap | Descartes | Mean.Counts | Mean.TPM |
|---|---|---|---|---|---|---|---|
| SLC4A1 | 0.0018204 | 397 | GTEx | DepMap | Descartes | 0.01 | 0.13 |
| SPECC1 | 0.0015287 | 527 | GTEx | DepMap | Descartes | 0.65 | 6.06 |
| SOX6 | 0.0003561 | 2046 | GTEx | DepMap | Descartes | 0.18 | 0.67 |
| RAPGEF2 | 0.0002839 | 2270 | GTEx | DepMap | Descartes | 0.50 | 3.16 |
| ALAS2 | 0.0002035 | 2505 | GTEx | DepMap | Descartes | 0.00 | 0.00 |
| SLC25A37 | 0.0002000 | 2516 | GTEx | DepMap | Descartes | 0.79 | 9.77 |
| RHD | 0.0000858 | 2903 | GTEx | DepMap | Descartes | 0.00 | 0.00 |
| TFR2 | 0.0000651 | 2979 | GTEx | DepMap | Descartes | 0.04 | 0.36 |
| ANK1 | -0.0001332 | 3799 | GTEx | DepMap | Descartes | 0.08 | 0.21 |
| GYPC | -0.0001992 | 4090 | GTEx | DepMap | Descartes | 0.00 | 0.00 |
| RGS6 | -0.0003884 | 4952 | GTEx | DepMap | Descartes | 0.00 | 0.00 |
| SPTB | -0.0003967 | 4980 | GTEx | DepMap | Descartes | 0.01 | 0.06 |
| CPOX | -0.0006273 | 5809 | GTEx | DepMap | Descartes | 0.12 | 1.93 |
| DENND4A | -0.0007193 | 6094 | GTEx | DepMap | Descartes | 0.23 | 1.82 |
| SLC25A21 | -0.0007303 | 6123 | GTEx | DepMap | Descartes | 0.01 | 0.07 |
| TMCC2 | -0.0007629 | 6237 | GTEx | DepMap | Descartes | 0.02 | 0.11 |
| ABCB10 | -0.0008156 | 6371 | GTEx | DepMap | Descartes | 0.15 | 1.31 |
| TRAK2 | -0.0009415 | 6703 | GTEx | DepMap | Descartes | 0.47 | 4.13 |
| GCLC | -0.0010904 | 7083 | GTEx | DepMap | Descartes | 0.24 | 2.41 |
| SELENBP1 | -0.0010962 | 7100 | GTEx | DepMap | Descartes | 0.00 | 0.00 |
| FECH | -0.0014823 | 7989 | GTEx | DepMap | Descartes | 0.16 | 0.77 |
| MARCH3 | -0.0015281 | 8072 | GTEx | DepMap | Descartes | 0.17 | NA |
| XPO7 | -0.0017494 | 8485 | GTEx | DepMap | Descartes | 0.37 | 3.41 |
| CAT | -0.0023299 | 9326 | GTEx | DepMap | Descartes | 0.36 | 7.31 |
| SNCA | -0.0027419 | 9807 | GTEx | DepMap | Descartes | 0.26 | 4.66 |
| MICAL2 | -0.0032983 | 10310 | GTEx | DepMap | Descartes | 0.26 | 2.56 |
| BLVRB | -0.0039914 | 10825 | GTEx | DepMap | Descartes | 0.57 | 20.68 |
| TSPAN5 | -0.0040224 | 10838 | GTEx | DepMap | Descartes | 0.93 | 7.36 |
| EPB41 | -0.0043592 | 11047 | GTEx | DepMap | Descartes | 0.82 | 4.49 |
| NA | NA | NA | NA | NA | NA | NA | NA |
Descartes myeloid markers
Top 50 marker genes of myeloid cells in the Decartes fetal adrenal single cell map (https://atlas.brotmanbaty.org/bbi/human-gene-expression-during-development/cell/myeloid/in/adrenal)
Wilcoxon ranksum test P-value for gene set overrepresentation: 8.46e-06
Mean rank of genes in gene set: 3750.5
Median rank of genes in gene set: 3322
Rank on gene expression program of top 30 genes in gene set:
| Genes | Weight | Rank | GTEx | DepMap | Descartes | Mean.Counts | Mean.TPM |
|---|---|---|---|---|---|---|---|
| CTSD | 0.0047632 | 41 | GTEx | DepMap | Descartes | 3.07 | 91.86 |
| HRH1 | 0.0042434 | 63 | GTEx | DepMap | Descartes | 0.28 | 3.73 |
| ABCA1 | 0.0041605 | 65 | GTEx | DepMap | Descartes | 0.28 | 1.85 |
| MERTK | 0.0022282 | 268 | GTEx | DepMap | Descartes | 0.06 | 1.35 |
| FMN1 | 0.0019221 | 361 | GTEx | DepMap | Descartes | 0.88 | 4.88 |
| CTSS | 0.0018338 | 389 | GTEx | DepMap | Descartes | 0.04 | 1.16 |
| PTPRE | 0.0016765 | 449 | GTEx | DepMap | Descartes | 0.99 | 9.34 |
| ITPR2 | 0.0009178 | 1054 | GTEx | DepMap | Descartes | 0.74 | 3.40 |
| SPP1 | 0.0008518 | 1126 | GTEx | DepMap | Descartes | 0.04 | 1.14 |
| TGFBI | 0.0008168 | 1162 | GTEx | DepMap | Descartes | 2.09 | 26.10 |
| MS4A4A | 0.0007910 | 1194 | GTEx | DepMap | Descartes | 0.00 | 0.00 |
| CTSB | 0.0007310 | 1265 | GTEx | DepMap | Descartes | 2.01 | 27.33 |
| SLC1A3 | 0.0003662 | 2026 | GTEx | DepMap | Descartes | 0.00 | 0.00 |
| IFNGR1 | 0.0002987 | 2218 | GTEx | DepMap | Descartes | 0.23 | 5.18 |
| LGMN | 0.0001561 | 2645 | GTEx | DepMap | Descartes | 0.34 | 9.99 |
| SFMBT2 | 0.0001495 | 2674 | GTEx | DepMap | Descartes | 0.11 | 0.93 |
| MARCH1 | 0.0000785 | 2932 | GTEx | DepMap | Descartes | 0.01 | NA |
| HCK | 0.0000593 | 3005 | GTEx | DepMap | Descartes | 0.00 | 0.00 |
| SLCO2B1 | 0.0000222 | 3125 | GTEx | DepMap | Descartes | 0.00 | 0.00 |
| ADAP2 | -0.0000657 | 3519 | GTEx | DepMap | Descartes | 0.00 | 0.00 |
| FGL2 | -0.0000712 | 3542 | GTEx | DepMap | Descartes | 0.00 | 0.00 |
| ATP8B4 | -0.0001178 | 3730 | GTEx | DepMap | Descartes | 0.00 | 0.00 |
| MSR1 | -0.0002036 | 4107 | GTEx | DepMap | Descartes | 0.01 | 0.01 |
| CYBB | -0.0002091 | 4129 | GTEx | DepMap | Descartes | 0.00 | 0.00 |
| CSF1R | -0.0002404 | 4292 | GTEx | DepMap | Descartes | 0.01 | 0.09 |
| CD74 | -0.0002604 | 4376 | GTEx | DepMap | Descartes | 0.00 | 0.00 |
| CD14 | -0.0002669 | 4411 | GTEx | DepMap | Descartes | 0.00 | 0.00 |
| SLC9A9 | -0.0002916 | 4534 | GTEx | DepMap | Descartes | 0.01 | 0.07 |
| CD163 | -0.0003186 | 4656 | GTEx | DepMap | Descartes | 0.00 | 0.00 |
| CPVL | -0.0005374 | 5474 | GTEx | DepMap | Descartes | 0.17 | 5.70 |
Descartes Schwann markers
Top 50 marker genes of Schwann cells in the Decartes fetal adrenal single cell map (https://atlas.brotmanbaty.org/bbi/human-gene-expression-during-development/cell/schwann/in/adrenal)
Wilcoxon ranksum test P-value for gene set overrepresentation: 3.61e-06
Mean rank of genes in gene set: 3828.75
Median rank of genes in gene set: 3752
Rank on gene expression program of top 30 genes in gene set:
| Genes | Weight | Rank | GTEx | DepMap | Descartes | Mean.Counts | Mean.TPM |
|---|---|---|---|---|---|---|---|
| DST | 0.0093653 | 5 | GTEx | DepMap | Descartes | 8.01 | 25.60 |
| LAMB1 | 0.0089770 | 7 | GTEx | DepMap | Descartes | 3.00 | 38.98 |
| SORCS1 | 0.0042488 | 62 | GTEx | DepMap | Descartes | 0.80 | 5.90 |
| LAMC1 | 0.0034079 | 111 | GTEx | DepMap | Descartes | 1.41 | 12.67 |
| VCAN | 0.0030492 | 142 | GTEx | DepMap | Descartes | 2.74 | 15.75 |
| COL18A1 | 0.0028870 | 159 | GTEx | DepMap | Descartes | 1.27 | 12.51 |
| PLCE1 | 0.0027278 | 179 | GTEx | DepMap | Descartes | 0.60 | 3.45 |
| PTN | 0.0026492 | 192 | GTEx | DepMap | Descartes | 3.25 | 119.30 |
| HMGA2 | 0.0014838 | 553 | GTEx | DepMap | Descartes | 0.58 | 7.80 |
| ADAMTS5 | 0.0006608 | 1379 | GTEx | DepMap | Descartes | 0.60 | 4.45 |
| OLFML2A | 0.0006470 | 1399 | GTEx | DepMap | Descartes | 0.02 | 0.26 |
| TRPM3 | 0.0005639 | 1553 | GTEx | DepMap | Descartes | 0.04 | 0.46 |
| COL5A2 | 0.0004400 | 1825 | GTEx | DepMap | Descartes | 0.18 | 2.48 |
| XKR4 | 0.0002721 | 2300 | GTEx | DepMap | Descartes | 0.00 | 0.00 |
| PAG1 | 0.0001847 | 2558 | GTEx | DepMap | Descartes | 0.11 | 0.60 |
| ERBB3 | 0.0001356 | 2733 | GTEx | DepMap | Descartes | 0.01 | 0.16 |
| SCN7A | 0.0000682 | 2969 | GTEx | DepMap | Descartes | 0.03 | 0.14 |
| EGFLAM | 0.0000632 | 2985 | GTEx | DepMap | Descartes | 0.01 | 0.20 |
| KCTD12 | 0.0000072 | 3195 | GTEx | DepMap | Descartes | 0.86 | 5.96 |
| PLP1 | -0.0000151 | 3317 | GTEx | DepMap | Descartes | 0.00 | 0.00 |
| PTPRZ1 | -0.0000244 | 3346 | GTEx | DepMap | Descartes | 0.00 | 0.00 |
| FIGN | -0.0000710 | 3541 | GTEx | DepMap | Descartes | 0.26 | 1.70 |
| IL1RAPL2 | -0.0001701 | 3963 | GTEx | DepMap | Descartes | 0.00 | 0.00 |
| NRXN3 | -0.0001725 | 3969 | GTEx | DepMap | Descartes | 0.01 | 0.03 |
| IL1RAPL1 | -0.0002032 | 4104 | GTEx | DepMap | Descartes | 0.07 | 0.90 |
| PPP2R2B | -0.0002215 | 4199 | GTEx | DepMap | Descartes | 0.96 | 5.00 |
| STARD13 | -0.0003005 | 4576 | GTEx | DepMap | Descartes | 0.09 | 1.13 |
| COL25A1 | -0.0003087 | 4613 | GTEx | DepMap | Descartes | 0.01 | 0.03 |
| LRRTM4 | -0.0003151 | 4645 | GTEx | DepMap | Descartes | 0.01 | 0.10 |
| SOX5 | -0.0003194 | 4663 | GTEx | DepMap | Descartes | 0.05 | 0.57 |
Descartes Megakaryocytes markers
Top 50 marker genes of Megakaryocytes cells in the Decartes fetal adrenal single cell map (https://atlas.brotmanbaty.org/bbi/human-gene-expression-during-development/cell/megakaryocytes/in/adrenal)
Wilcoxon ranksum test P-value for gene set overrepresentation: 4.93e-02
Mean rank of genes in gene set: 5384.71
Median rank of genes in gene set: 4748
Rank on gene expression program of top 30 genes in gene set:
| Genes | Weight | Rank | GTEx | DepMap | Descartes | Mean.Counts | Mean.TPM |
|---|---|---|---|---|---|---|---|
| LTBP1 | 0.0055519 | 24 | GTEx | DepMap | Descartes | 1.82 | 20.51 |
| MYLK | 0.0013209 | 660 | GTEx | DepMap | Descartes | 1.65 | 9.98 |
| MED12L | 0.0007849 | 1200 | GTEx | DepMap | Descartes | 0.04 | 0.25 |
| FLNA | 0.0007826 | 1204 | GTEx | DepMap | Descartes | 3.66 | 26.26 |
| SLC2A3 | 0.0007266 | 1277 | GTEx | DepMap | Descartes | 0.06 | 0.95 |
| ITGB3 | 0.0005307 | 1625 | GTEx | DepMap | Descartes | 0.01 | 0.25 |
| ARHGAP6 | 0.0005265 | 1633 | GTEx | DepMap | Descartes | 0.15 | 0.82 |
| THBS1 | 0.0004430 | 1818 | GTEx | DepMap | Descartes | 1.11 | 10.82 |
| P2RX1 | 0.0004178 | 1884 | GTEx | DepMap | Descartes | 0.00 | 0.00 |
| MCTP1 | 0.0002755 | 2290 | GTEx | DepMap | Descartes | 0.06 | 1.32 |
| ITGA2B | 0.0002545 | 2352 | GTEx | DepMap | Descartes | 0.01 | 0.09 |
| INPP4B | 0.0002459 | 2373 | GTEx | DepMap | Descartes | 0.09 | 0.66 |
| SLC24A3 | 0.0002279 | 2433 | GTEx | DepMap | Descartes | 0.00 | 0.00 |
| GSN | 0.0001221 | 2786 | GTEx | DepMap | Descartes | 0.51 | 4.50 |
| GP1BA | 0.0000758 | 2944 | GTEx | DepMap | Descartes | 0.00 | 0.00 |
| STOM | 0.0000155 | 3154 | GTEx | DepMap | Descartes | 0.29 | 6.93 |
| TUBB1 | 0.0000137 | 3159 | GTEx | DepMap | Descartes | 0.00 | 0.00 |
| PLEK | -0.0000313 | 3376 | GTEx | DepMap | Descartes | 0.00 | 0.00 |
| VCL | -0.0000410 | 3427 | GTEx | DepMap | Descartes | 1.99 | 15.34 |
| SPN | -0.0001499 | 3876 | GTEx | DepMap | Descartes | 0.00 | 0.00 |
| MMRN1 | -0.0002396 | 4286 | GTEx | DepMap | Descartes | 0.00 | 0.00 |
| PSTPIP2 | -0.0003139 | 4636 | GTEx | DepMap | Descartes | 0.09 | 2.15 |
| DOK6 | -0.0003383 | 4748 | GTEx | DepMap | Descartes | 0.40 | 1.60 |
| UBASH3B | -0.0003762 | 4908 | GTEx | DepMap | Descartes | 0.12 | 0.94 |
| CD84 | -0.0003764 | 4910 | GTEx | DepMap | Descartes | 0.00 | 0.00 |
| MYH9 | -0.0004549 | 5177 | GTEx | DepMap | Descartes | 2.65 | 19.31 |
| FLI1 | -0.0005056 | 5367 | GTEx | DepMap | Descartes | 0.01 | 0.05 |
| ANGPT1 | -0.0005901 | 5674 | GTEx | DepMap | Descartes | 0.07 | 1.25 |
| STON2 | -0.0007070 | 6059 | GTEx | DepMap | Descartes | 0.03 | 0.11 |
| RAB27B | -0.0009976 | 6839 | GTEx | DepMap | Descartes | 0.18 | 1.25 |
Descartes Lyphoid markers
Top 50 marker genes of Lyphoid cells in the Decartes fetal adrenal single cell map (https://atlas.brotmanbaty.org/bbi/human-gene-expression-during-development/cell/lymphoid/in/adrenal)
Wilcoxon ranksum test P-value for gene set overrepresentation: 2.74e-01
Mean rank of genes in gene set: 5940.1
Median rank of genes in gene set: 5572
Rank on gene expression program of top 30 genes in gene set:
| Genes | Weight | Rank | GTEx | DepMap | Descartes | Mean.Counts | Mean.TPM |
|---|---|---|---|---|---|---|---|
| ANKRD44 | 0.0019541 | 346 | GTEx | DepMap | Descartes | 0.29 | 1.84 |
| SORL1 | 0.0011606 | 796 | GTEx | DepMap | Descartes | 0.14 | 0.76 |
| PLEKHA2 | 0.0010345 | 929 | GTEx | DepMap | Descartes | 0.37 | 4.32 |
| BCL2 | 0.0009646 | 1003 | GTEx | DepMap | Descartes | 0.35 | 2.20 |
| MCTP2 | 0.0007639 | 1219 | GTEx | DepMap | Descartes | 0.01 | 0.19 |
| CD44 | 0.0007634 | 1221 | GTEx | DepMap | Descartes | 1.40 | 16.59 |
| PDE3B | 0.0004921 | 1723 | GTEx | DepMap | Descartes | 0.20 | 1.53 |
| ARID5B | 0.0003250 | 2131 | GTEx | DepMap | Descartes | 1.36 | 10.07 |
| SCML4 | 0.0002309 | 2419 | GTEx | DepMap | Descartes | 0.00 | 0.00 |
| RAP1GAP2 | 0.0002100 | 2488 | GTEx | DepMap | Descartes | 0.20 | 1.69 |
| ABLIM1 | 0.0001376 | 2726 | GTEx | DepMap | Descartes | 0.92 | 6.54 |
| SAMD3 | 0.0000020 | 3222 | GTEx | DepMap | Descartes | 0.01 | 0.21 |
| RCSD1 | -0.0000830 | 3586 | GTEx | DepMap | Descartes | 0.00 | 0.00 |
| PRKCH | -0.0001477 | 3870 | GTEx | DepMap | Descartes | 0.01 | 0.26 |
| IKZF1 | -0.0002069 | 4119 | GTEx | DepMap | Descartes | 0.00 | 0.00 |
| LEF1 | -0.0002943 | 4547 | GTEx | DepMap | Descartes | 0.05 | 0.51 |
| CCL5 | -0.0003184 | 4655 | GTEx | DepMap | Descartes | 0.00 | 0.00 |
| SKAP1 | -0.0003862 | 4944 | GTEx | DepMap | Descartes | 0.00 | 0.00 |
| BACH2 | -0.0004944 | 5321 | GTEx | DepMap | Descartes | 0.07 | 0.30 |
| DOCK10 | -0.0005276 | 5439 | GTEx | DepMap | Descartes | 0.08 | 0.57 |
| ARHGAP15 | -0.0005529 | 5540 | GTEx | DepMap | Descartes | 0.00 | 0.00 |
| WIPF1 | -0.0005708 | 5604 | GTEx | DepMap | Descartes | 0.48 | 4.40 |
| NCALD | -0.0005872 | 5663 | GTEx | DepMap | Descartes | 0.18 | 1.73 |
| FOXP1 | -0.0008730 | 6521 | GTEx | DepMap | Descartes | 1.23 | 6.18 |
| MBNL1 | -0.0009304 | 6668 | GTEx | DepMap | Descartes | 0.77 | 7.83 |
| TOX | -0.0012608 | 7523 | GTEx | DepMap | Descartes | 0.52 | 5.12 |
| LCP1 | -0.0012887 | 7595 | GTEx | DepMap | Descartes | 0.00 | 0.00 |
| ITPKB | -0.0014449 | 7923 | GTEx | DepMap | Descartes | 0.04 | 0.33 |
| PITPNC1 | -0.0017835 | 8537 | GTEx | DepMap | Descartes | 0.28 | 1.61 |
| STK39 | -0.0021508 | 9093 | GTEx | DepMap | Descartes | 0.55 | 7.42 |
Below shows the ranks on this GEP for immune marker gene lists curated by CellTypist (https://www.celltypist.org/encyclopedia).
High ranks indicate this gene is a driver of this GEP.
These curated gene list are ranked by P-value (on this GEP) of their constituent genes.
The Mean Count column shows the mean read count in cells scoring highly (H > 50) on this gene expression program.
Monocytes: Monocytes (model markers)
myeloid mononuclear recirculating leukocytes that are capable of differentiating into macrophages and myeloid lineage dendritic cells:
Wilcoxon ranksum test P-value for gene set overrepresentation: 1.11e-02
Mean rank of genes in gene set: 1493
Rank on gene expression program of genes in gene set:
| Genes | Weight | Rank | GTEx | DepMap | Decartes | Mean.Counts | Mean.TPM |
|---|---|---|---|---|---|---|---|
| NEAT1 | 0.0160377 | 1 | GTEx | DepMap | Descartes | 70.27 | 243.50 |
| SAT1 | 0.0025288 | 210 | GTEx | DepMap | Descartes | 0.91 | 44.41 |
| TYROBP | -0.0002361 | 4268 | GTEx | DepMap | Descartes | 0.00 | 0.00 |
T cells: Tem/Effector helper T cells (curated markers)
CD4+ helper T lymphocytes mainly localized in lymphoid and peripheral tissues and presenting an immediate:
Wilcoxon ranksum test P-value for gene set overrepresentation: 3.10e-02
Mean rank of genes in gene set: 2371
Rank on gene expression program of genes in gene set:
| Genes | Weight | Rank | GTEx | DepMap | Decartes | Mean.Counts | Mean.TPM |
|---|---|---|---|---|---|---|---|
| ITGB1 | 0.0023114 | 248 | GTEx | DepMap | Descartes | 10.77 | 166.62 |
| KLRB1 | 0.0000012 | 3227 | GTEx | DepMap | Descartes | 0.00 | 0.00 |
| AQP3 | -0.0000934 | 3638 | GTEx | DepMap | Descartes | 0.03 | 0.42 |
T cells: CD8a/a (model markers)
unconventional T lymphocytes with CD8 alpha/alpha homodimers binding MHC molecules:
Wilcoxon ranksum test P-value for gene set overrepresentation: 4.02e-02
Mean rank of genes in gene set: 3881.57
Rank on gene expression program of genes in gene set:
| Genes | Weight | Rank | GTEx | DepMap | Decartes | Mean.Counts | Mean.TPM |
|---|---|---|---|---|---|---|---|
| MALAT1 | 0.0081589 | 9 | GTEx | DepMap | Descartes | 363.11 | 3532.25 |
| NUCB2 | 0.0001014 | 2843 | GTEx | DepMap | Descartes | 1.15 | 21.00 |
| PRKCH | -0.0001477 | 3870 | GTEx | DepMap | Descartes | 0.01 | 0.26 |
| CD8A | -0.0002369 | 4273 | GTEx | DepMap | Descartes | 0.00 | 0.00 |
| LEF1 | -0.0002943 | 4547 | GTEx | DepMap | Descartes | 0.05 | 0.51 |
| CTSW | -0.0004754 | 5257 | GTEx | DepMap | Descartes | 0.00 | 0.00 |
| CD27 | -0.0008158 | 6372 | GTEx | DepMap | Descartes | 0.00 | 0.00 |