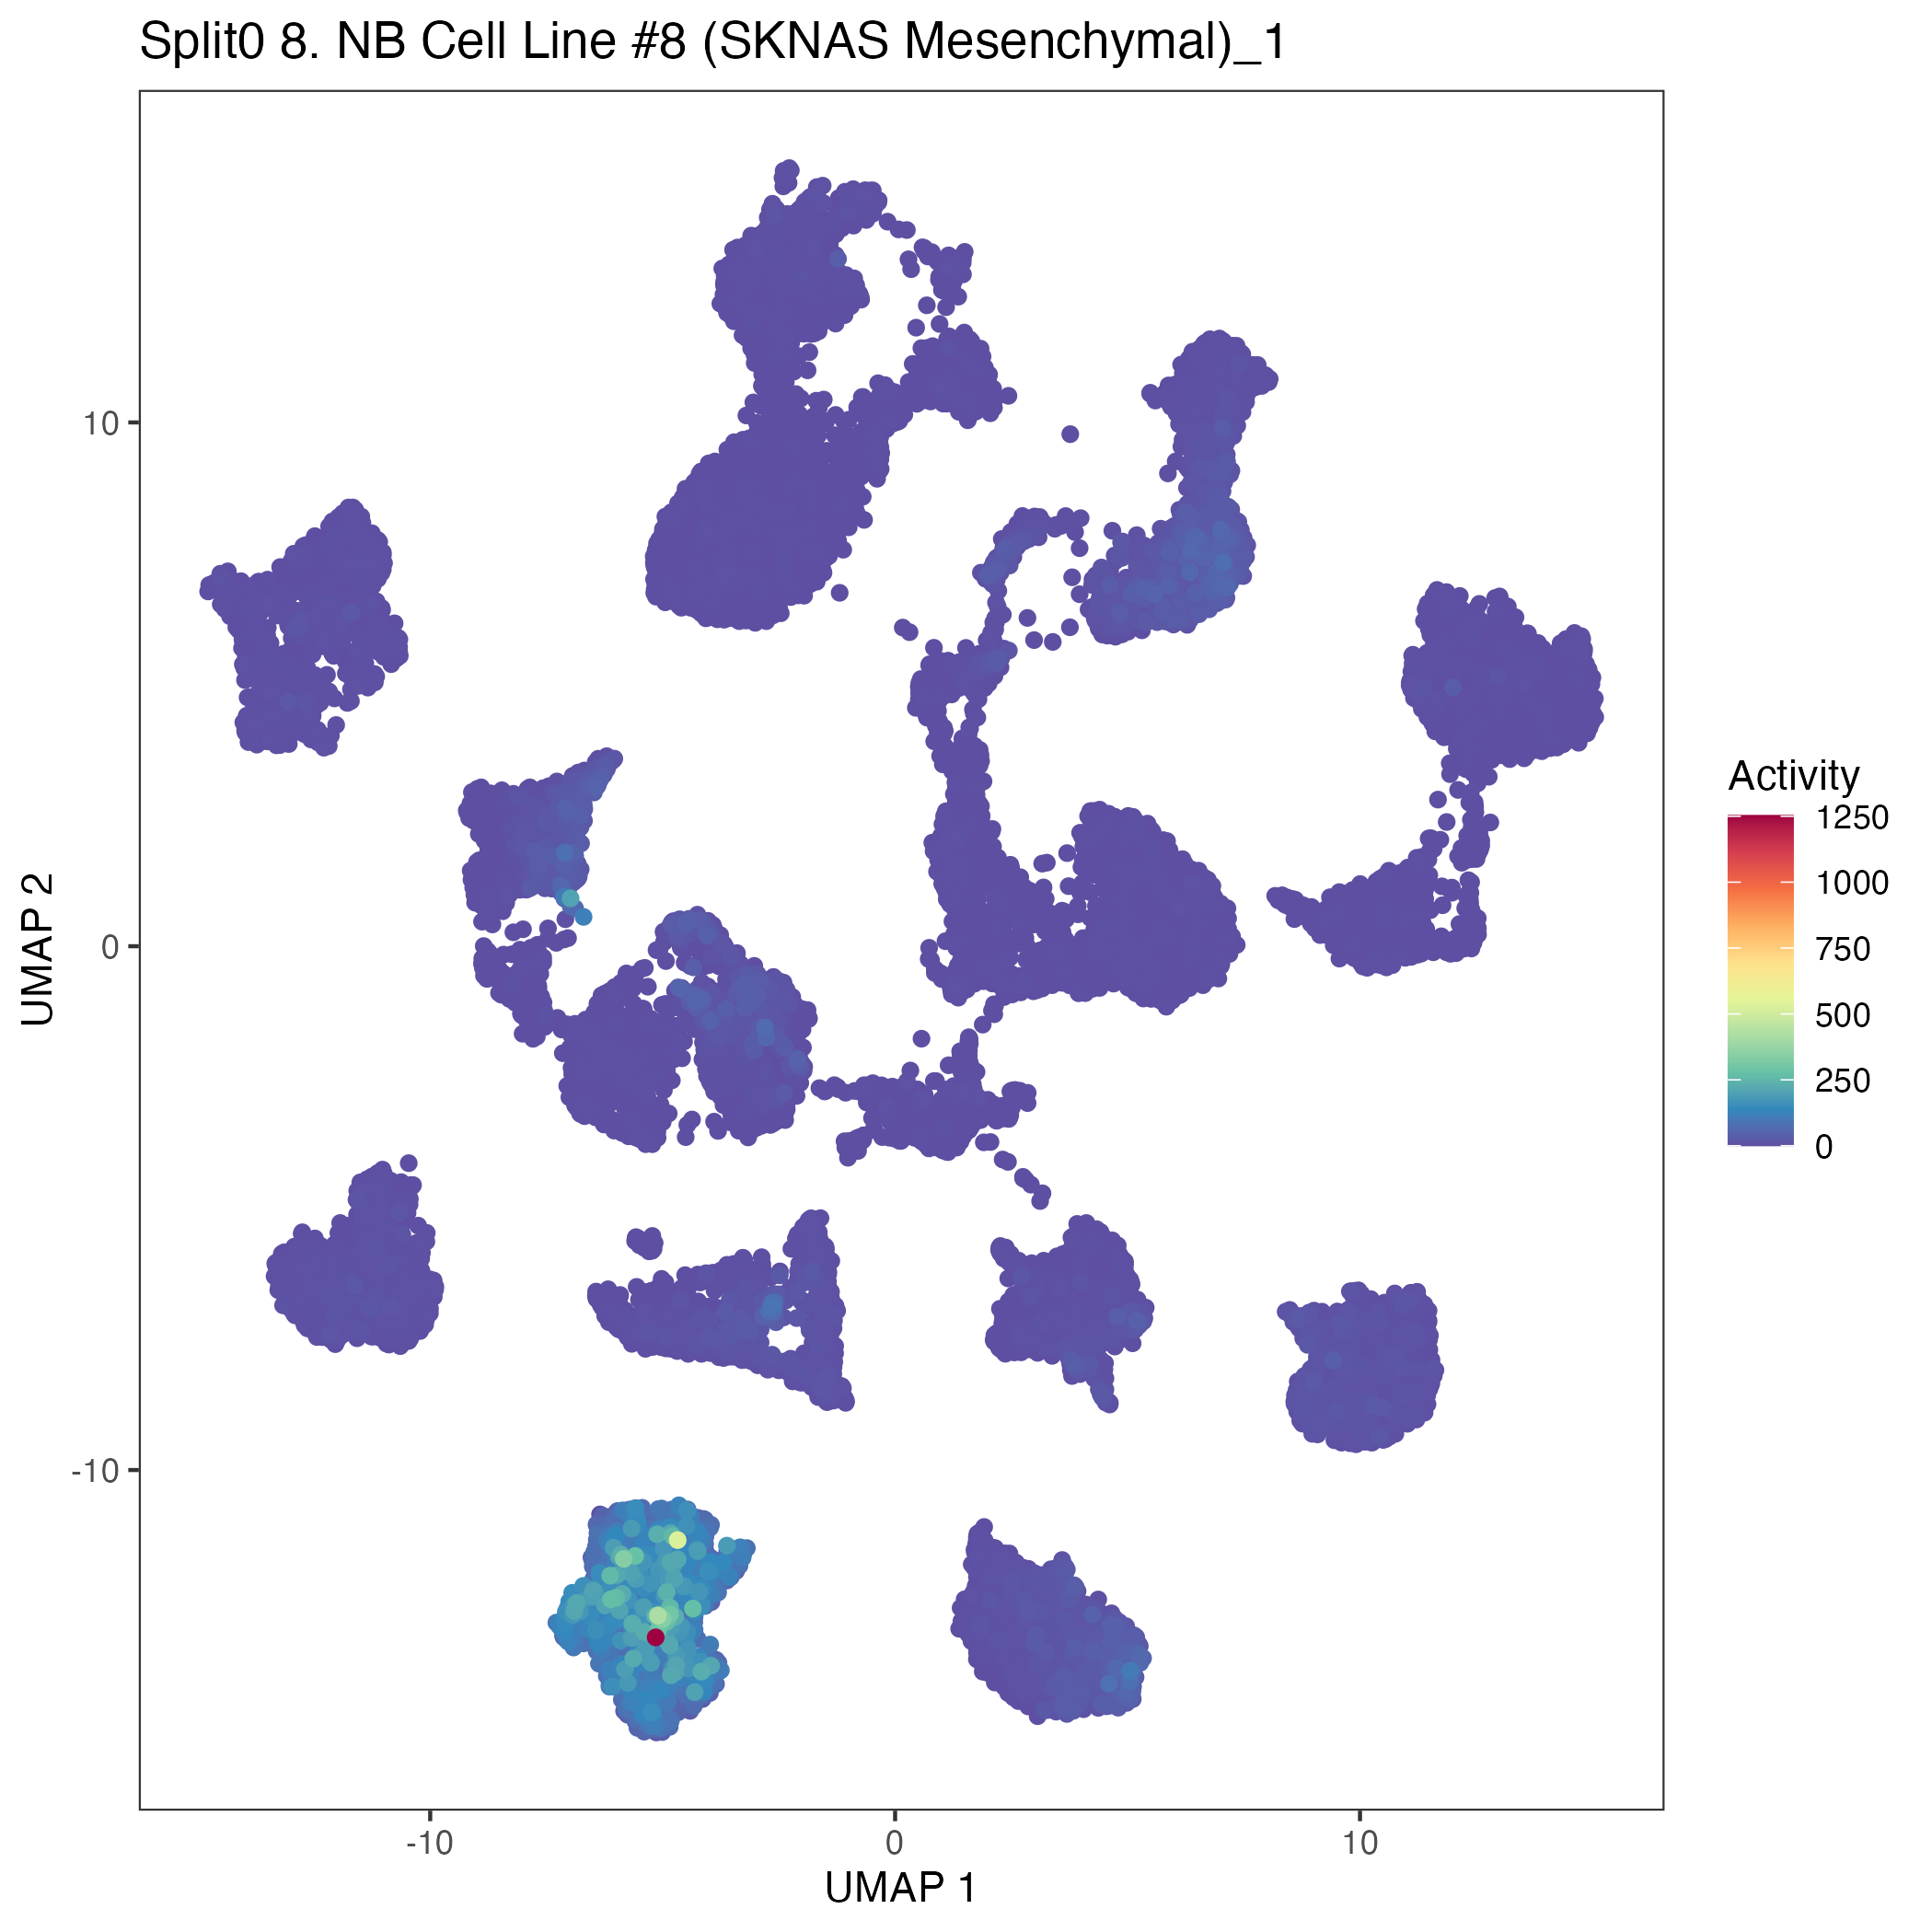
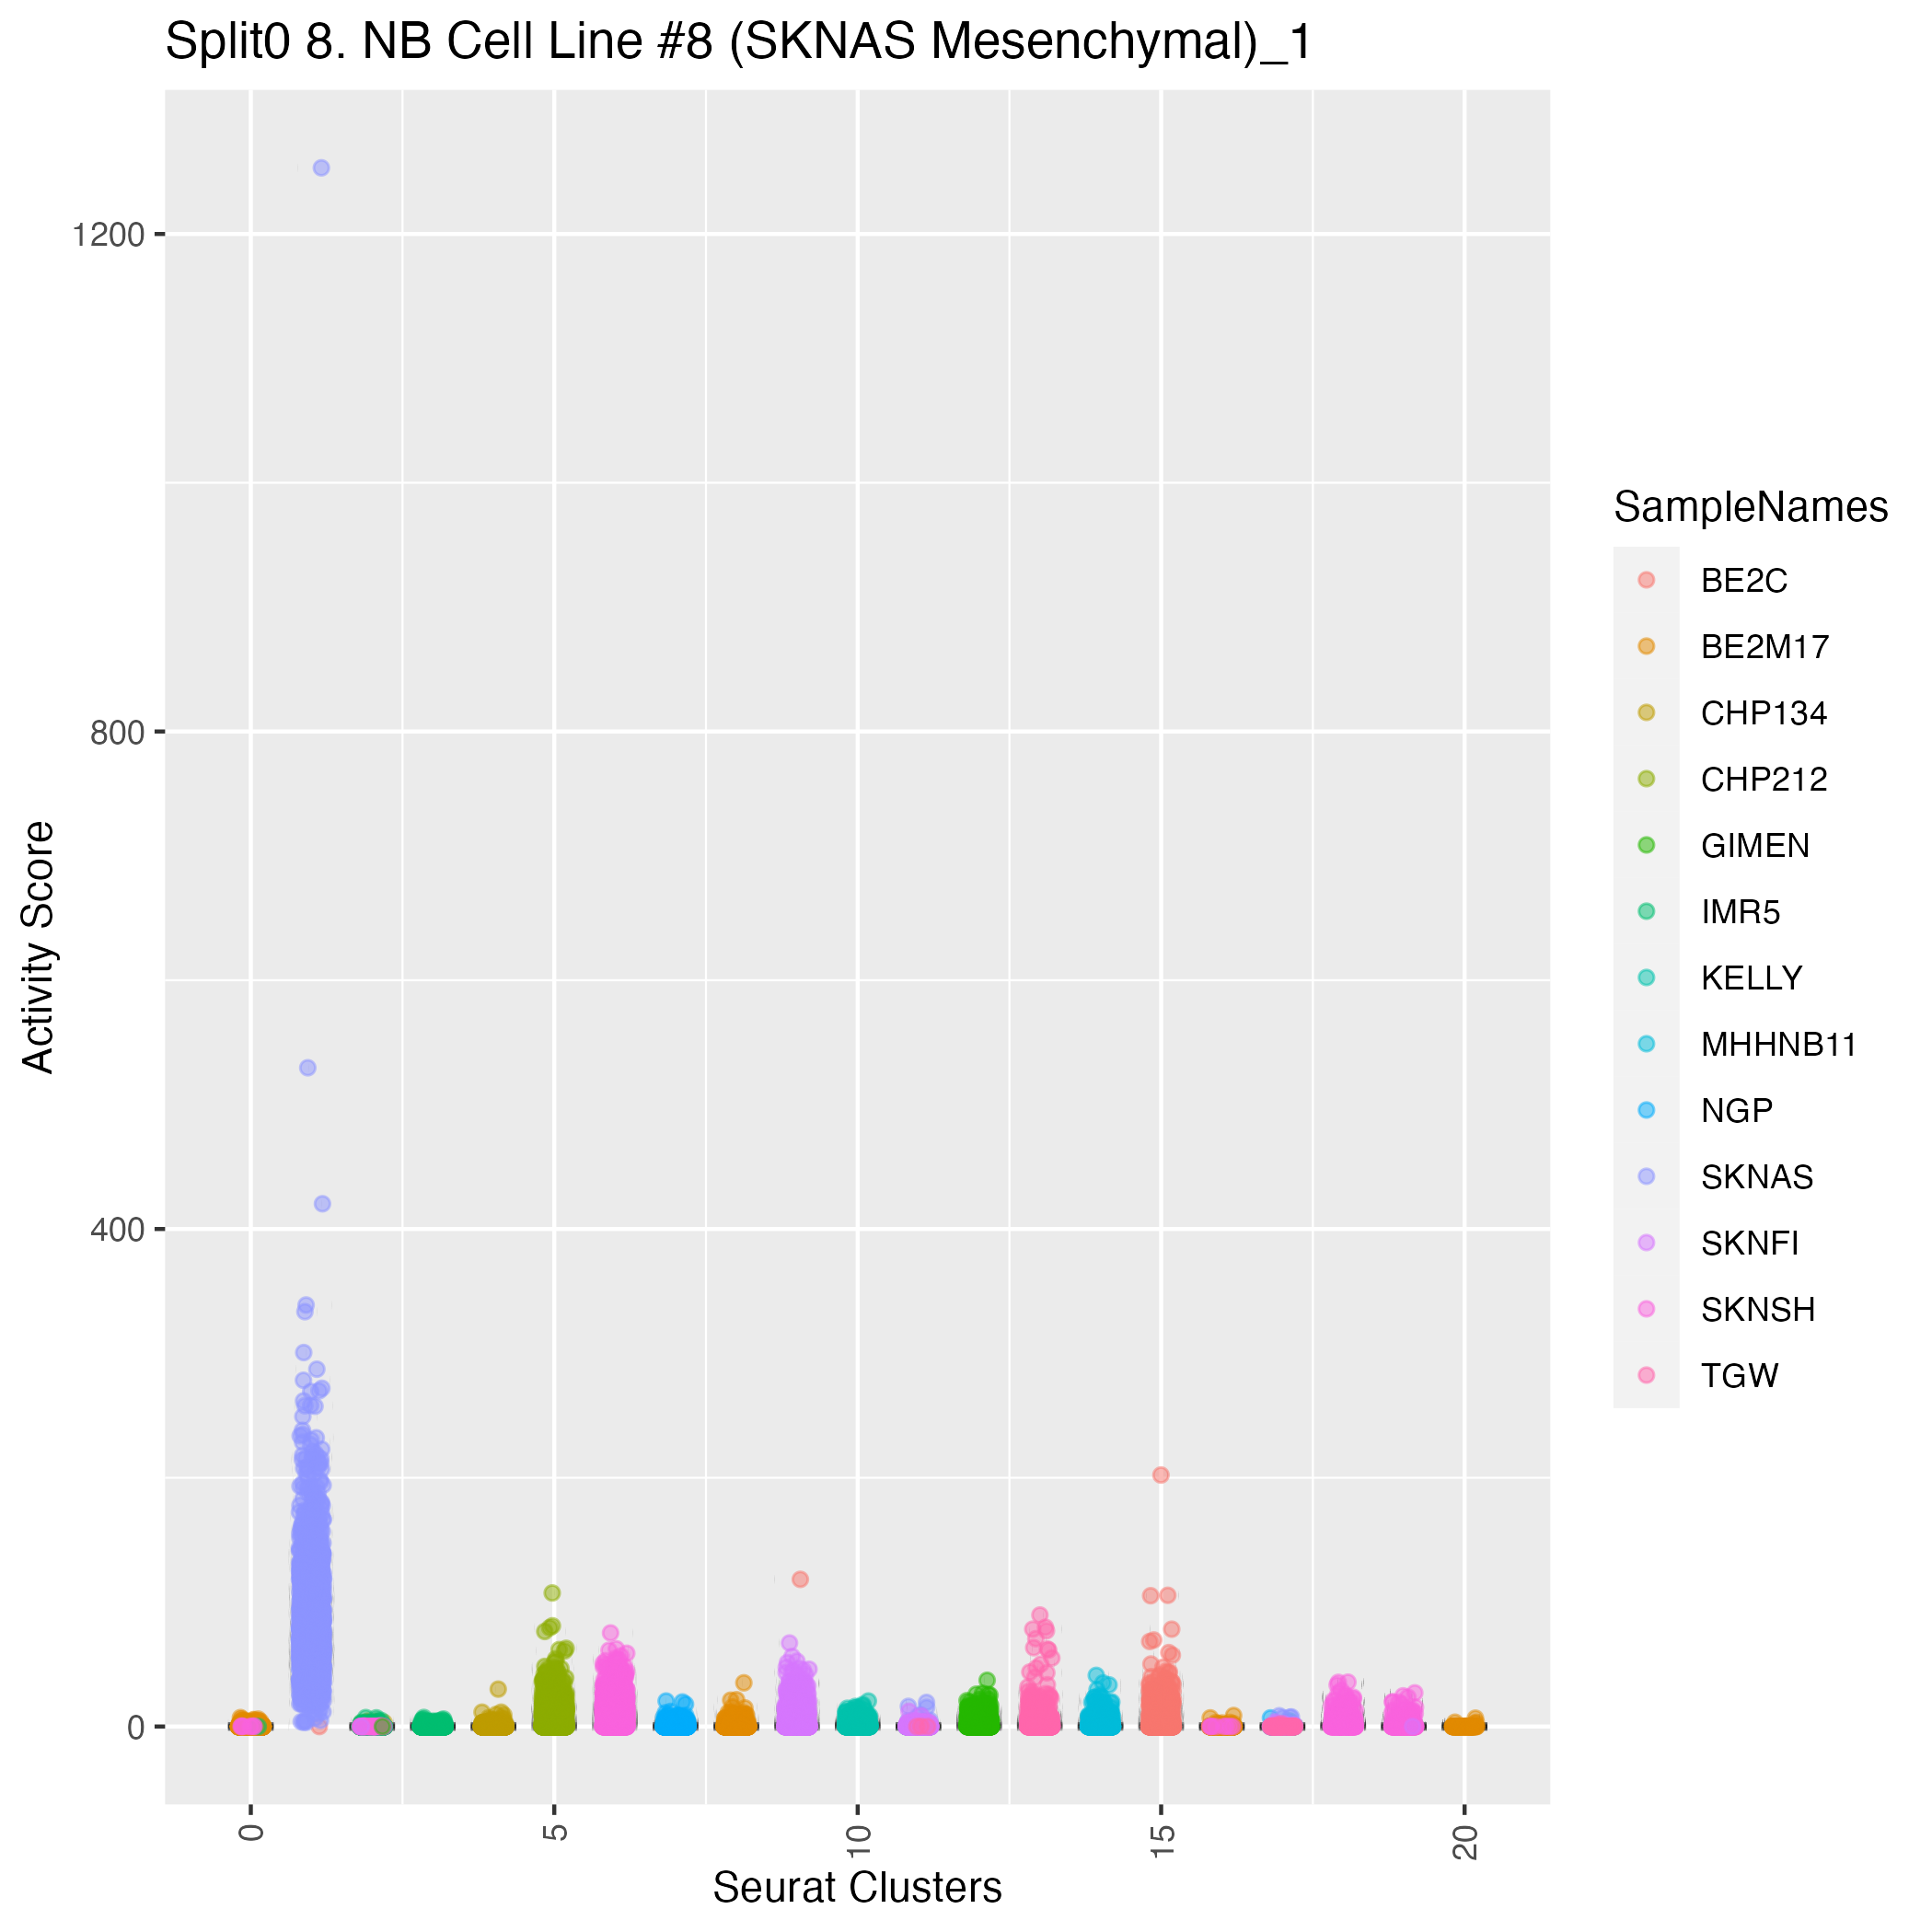
Program: 8. NB Cell Line #8 (SKNAS Mesenchymal).
Program description and justification of annotation: 8.
Submit a comment on this gene expression program’s interpretation: CLICK
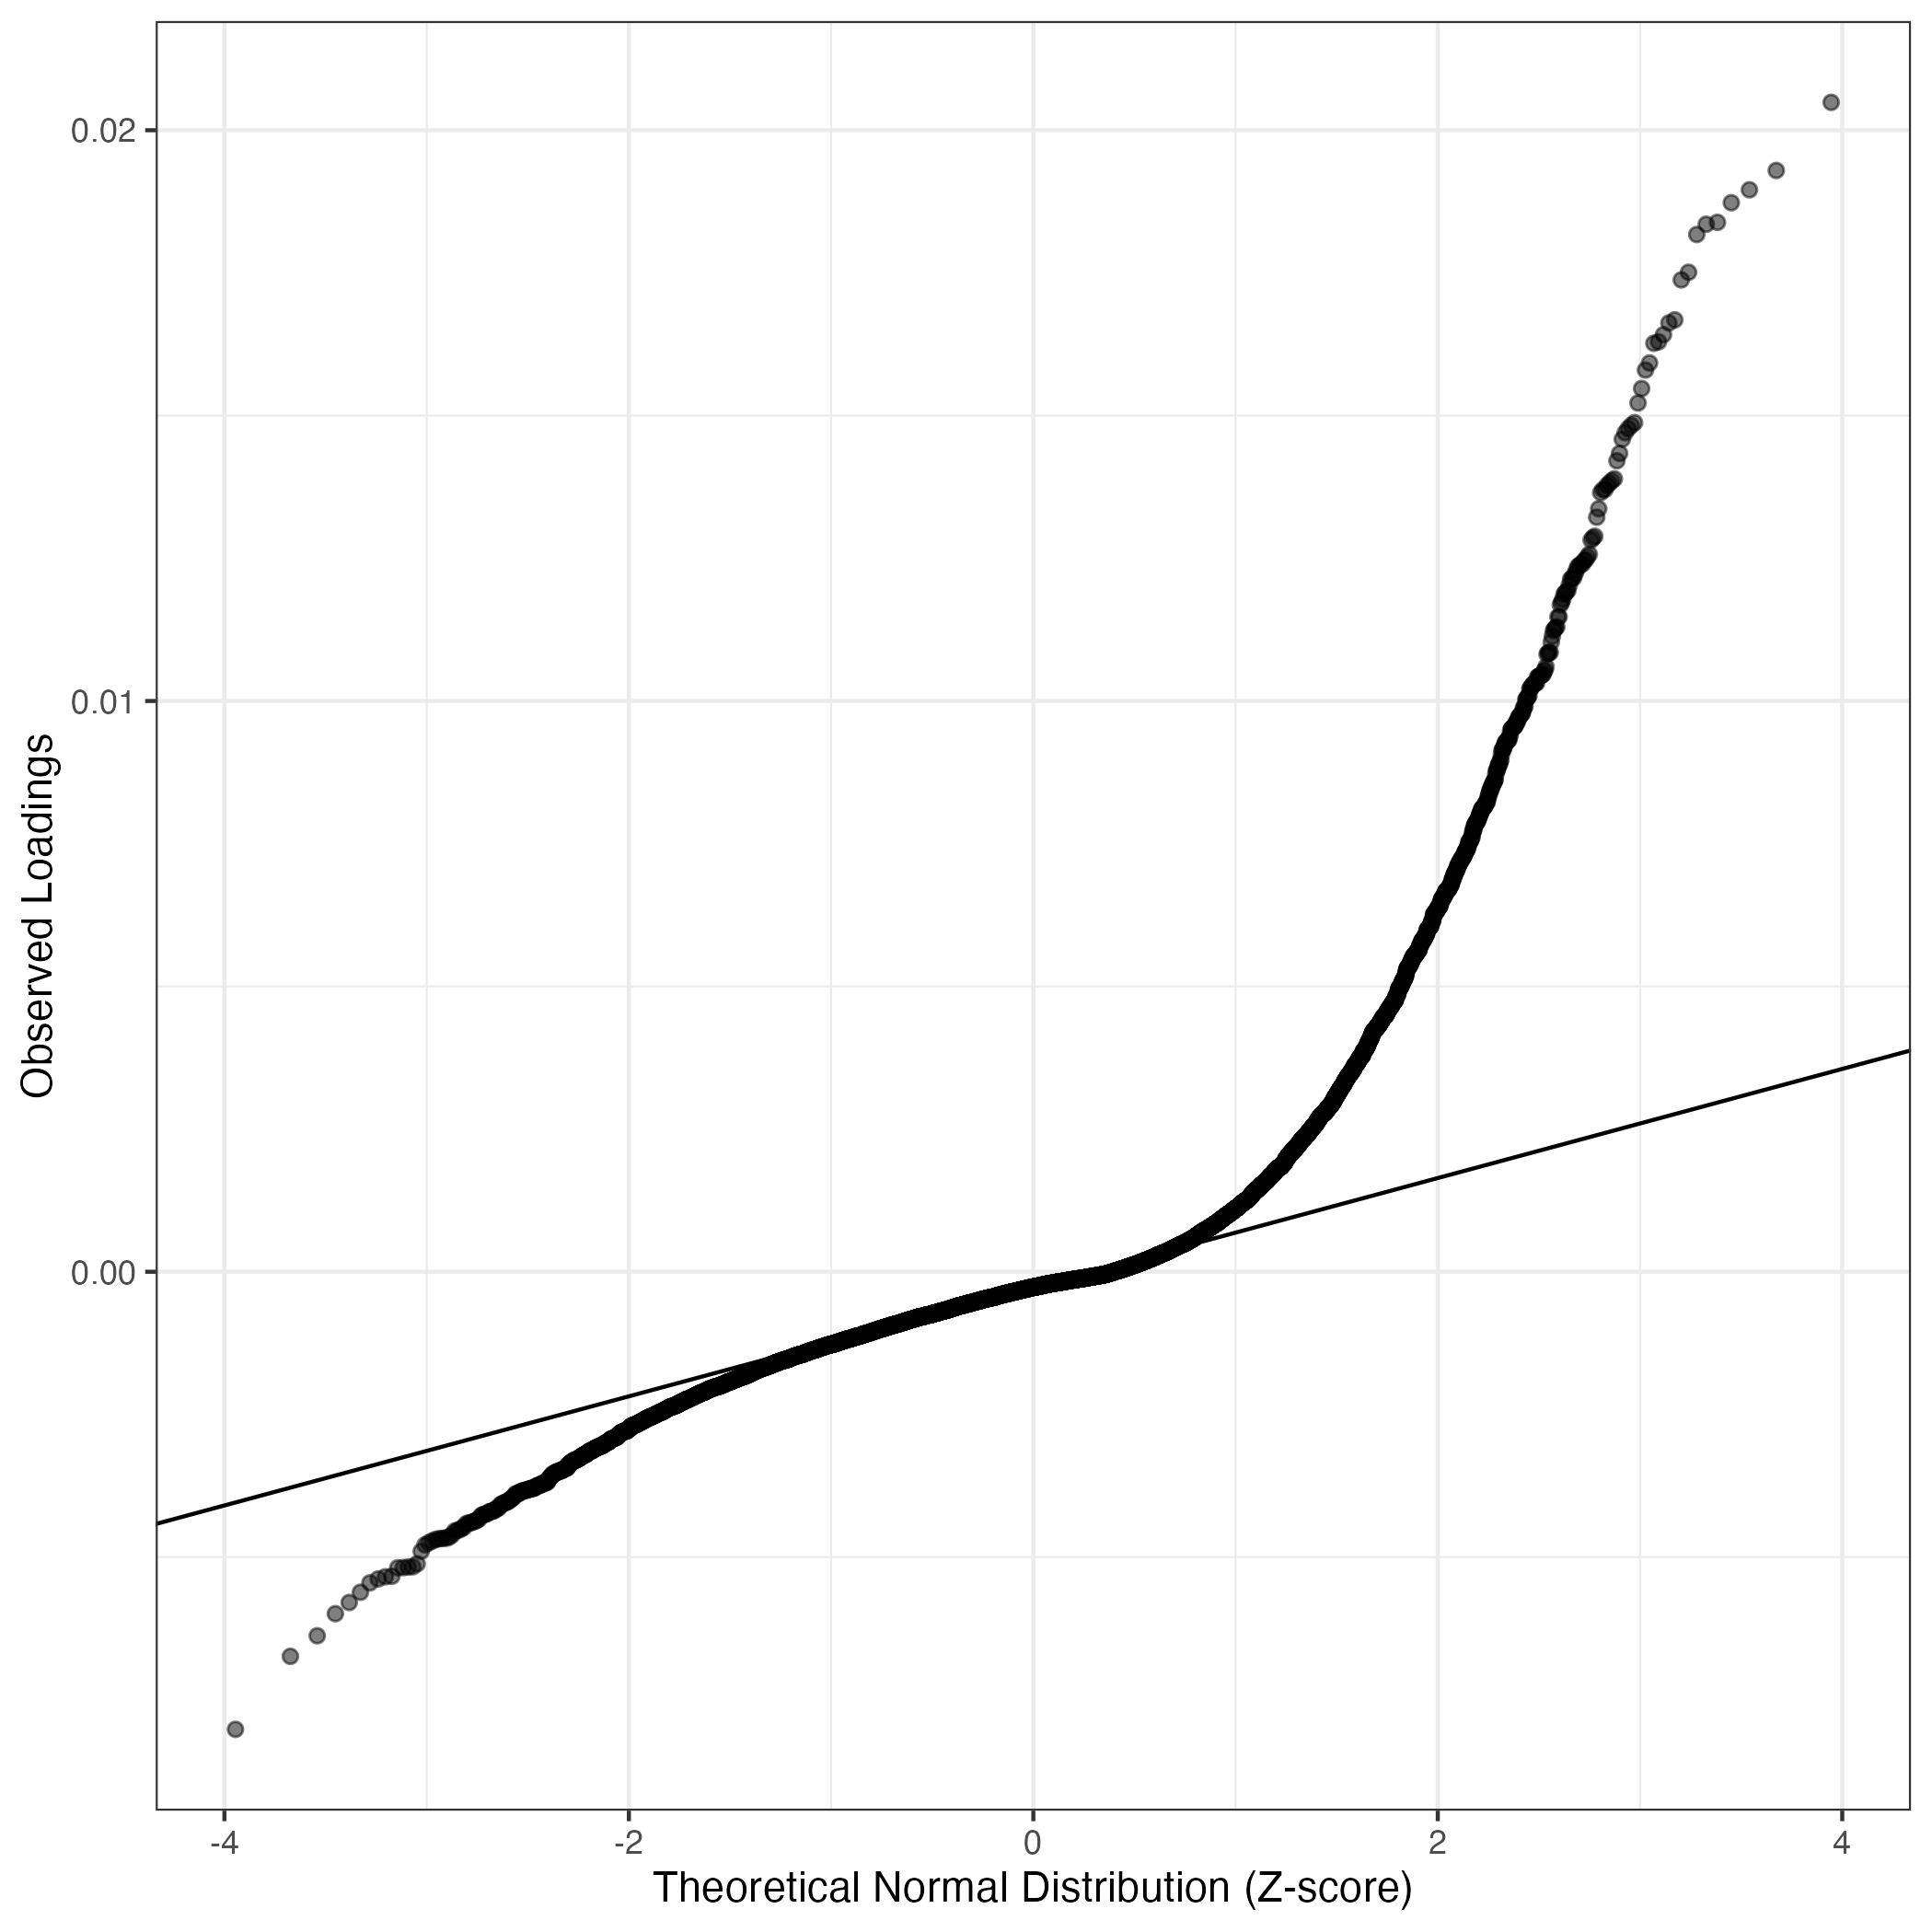
QQ-plot of gene loadings, averaged over both independent splits of the data
This plot highlights the relative contribution of each gene to the GEP
Top genes driving this program.
Note: Decartes website is buggy, try refreshing. Also, Decartes fetal adrenal data have been collected at specific time points (89-122 days), all possible cell types of interest may not be represented, do not overinterpret.
The Mean Count column shows the mean read count in cells scoring highly (H > 50) on this gene expression program.
| Gene | Loading | Gene.Name | GTEx | DepMap | Descartes | Mean.Counts | Mean.Tpm | |
|---|---|---|---|---|---|---|---|---|
| 1 | IFITM3 | 0.0204881 | interferon induced transmembrane protein 3 | GTEx | DepMap | Descartes | 7.66 | 560.37 |
| 2 | SH3BGRL3 | 0.0192947 | SH3 domain binding glutamate rich protein like 3 | GTEx | DepMap | Descartes | 40.90 | 2637.64 |
| 3 | FTH1 | 0.0189562 | ferritin heavy chain 1 | GTEx | DepMap | Descartes | 222.31 | 9126.40 |
| 4 | S100A11 | 0.0187302 | S100 calcium binding protein A11 | GTEx | DepMap | Descartes | 80.30 | 7360.19 |
| 5 | SPRY1 | 0.0183860 | sprouty RTK signaling antagonist 1 | GTEx | DepMap | Descartes | 7.85 | 164.08 |
| 6 | S100A4 | 0.0183527 | S100 calcium binding protein A4 | GTEx | DepMap | Descartes | 80.72 | 5366.38 |
| 7 | IER3 | 0.0181730 | immediate early response 3 | GTEx | DepMap | Descartes | 17.03 | 697.85 |
| 8 | S100A16 | 0.0175113 | S100 calcium binding protein A16 | GTEx | DepMap | Descartes | 20.28 | 893.20 |
| 9 | RGS13 | 0.0173778 | regulator of G protein signaling 13 | GTEx | DepMap | Descartes | 2.41 | 24.90 |
| 10 | PTPRC | 0.0166774 | protein tyrosine phosphatase receptor type C | GTEx | DepMap | Descartes | 4.20 | 43.46 |
| 11 | IL13RA2 | 0.0166232 | interleukin 13 receptor subunit alpha 2 | GTEx | DepMap | Descartes | 10.85 | 388.85 |
| 12 | S100A3 | 0.0164179 | S100 calcium binding protein A3 | GTEx | DepMap | Descartes | 2.52 | 155.19 |
| 13 | HGF | 0.0162934 | hepatocyte growth factor | GTEx | DepMap | Descartes | 17.90 | 168.94 |
| 14 | CYGB | 0.0162670 | cytoglobin | GTEx | DepMap | Descartes | 9.77 | 259.09 |
| 15 | PSMB9 | 0.0159216 | proteasome 20S subunit beta 9 | GTEx | DepMap | Descartes | 2.72 | 53.18 |
| 16 | SSR2 | 0.0157984 | signal sequence receptor subunit 2 | GTEx | DepMap | Descartes | 36.44 | 358.87 |
| 17 | LUM | 0.0154739 | lumican | GTEx | DepMap | Descartes | 13.33 | 277.64 |
| 18 | LTBR | 0.0152213 | lymphotoxin beta receptor | GTEx | DepMap | Descartes | 0.93 | 20.79 |
| 19 | CFI | 0.0148760 | complement factor I | GTEx | DepMap | Descartes | 2.15 | 53.82 |
| 20 | VAMP5 | 0.0148288 | vesicle associated membrane protein 5 | GTEx | DepMap | Descartes | 5.31 | 422.96 |
| 21 | ID3 | 0.0147730 | inhibitor of DNA binding 3, HLH protein | GTEx | DepMap | Descartes | 35.14 | 1904.52 |
| 22 | TIMP1 | 0.0146998 | TIMP metallopeptidase inhibitor 1 | GTEx | DepMap | Descartes | 22.86 | 1063.43 |
| 23 | GSDMD | 0.0145873 | gasdermin D | GTEx | DepMap | Descartes | 2.38 | 37.72 |
| 24 | CRABP2 | 0.0143381 | cellular retinoic acid binding protein 2 | GTEx | DepMap | Descartes | 15.45 | 825.78 |
| 25 | PPIC | 0.0142090 | peptidylprolyl isomerase C | GTEx | DepMap | Descartes | 3.96 | 150.71 |
| 26 | ID1 | 0.0138930 | inhibitor of DNA binding 1, HLH protein | GTEx | DepMap | Descartes | 28.65 | 1238.69 |
| 27 | GUK1 | 0.0138597 | guanylate kinase 1 | GTEx | DepMap | Descartes | 37.20 | 733.74 |
| 28 | UBL5 | 0.0138189 | ubiquitin like 5 | GTEx | DepMap | Descartes | 51.16 | 1728.17 |
| 29 | FERMT3 | 0.0137798 | FERM domain containing kindlin 3 | GTEx | DepMap | Descartes | 1.56 | 34.99 |
| 30 | PSMB8 | 0.0137062 | proteasome 20S subunit beta 8 | GTEx | DepMap | Descartes | 3.34 | 75.87 |
| 31 | NDUFB9 | 0.0137016 | NADH:ubiquinone oxidoreductase subunit B9 | GTEx | DepMap | Descartes | 29.63 | 523.17 |
| 32 | CD81 | 0.0136508 | CD81 molecule | GTEx | DepMap | Descartes | 22.40 | 221.33 |
| 33 | COL6A2 | 0.0133682 | collagen type VI alpha 2 chain | GTEx | DepMap | Descartes | 5.67 | 89.04 |
| 34 | PPIA | 0.0132197 | peptidylprolyl isomerase A | GTEx | DepMap | Descartes | 108.15 | 2525.97 |
| 35 | PYCARD | 0.0128863 | PYD and CARD domain containing | GTEx | DepMap | Descartes | 1.28 | 61.86 |
| 36 | FXYD5 | 0.0128574 | FXYD domain containing ion transport regulator 5 | GTEx | DepMap | Descartes | 3.55 | 108.11 |
| 37 | LAMTOR2 | 0.0128194 | late endosomal/lysosomal adaptor, MAPK and MTOR activator 2 | GTEx | DepMap | Descartes | 16.15 | 936.72 |
| 38 | UQCRQ | 0.0125722 | ubiquinol-cytochrome c reductase complex III subunit VII | GTEx | DepMap | Descartes | 41.12 | 1289.51 |
| 39 | PPP1R14B | 0.0125299 | protein phosphatase 1 regulatory inhibitor subunit 14B | GTEx | DepMap | Descartes | 54.89 | 2756.93 |
| 40 | APOE | 0.0124783 | apolipoprotein E | GTEx | DepMap | Descartes | 11.85 | 580.18 |
| 41 | UQCRH | 0.0124570 | ubiquinol-cytochrome c reductase hinge protein | GTEx | DepMap | Descartes | 74.58 | 5366.34 |
| 42 | GAS1 | 0.0124027 | growth arrest specific 1 | GTEx | DepMap | Descartes | 2.87 | 50.74 |
| 43 | LYPD6B | 0.0124005 | LY6/PLAUR domain containing 6B | GTEx | DepMap | Descartes | 1.34 | 40.02 |
| 44 | EVA1B | 0.0123684 | eva-1 homolog B | GTEx | DepMap | Descartes | 3.52 | NA |
| 45 | OST4 | 0.0123572 | oligosaccharyltransferase complex subunit 4, non-catalytic | GTEx | DepMap | Descartes | 41.96 | 3741.42 |
| 46 | ARPC1B | 0.0122888 | actin related protein ⅔ complex subunit 1B | GTEx | DepMap | Descartes | 13.27 | 386.45 |
| 47 | TWIST2 | 0.0122221 | twist family bHLH transcription factor 2 | GTEx | DepMap | Descartes | 1.16 | 46.42 |
| 48 | ASS1 | 0.0121539 | argininosuccinate synthase 1 | GTEx | DepMap | Descartes | 18.12 | 499.44 |
| 49 | SEC61G | 0.0121511 | SEC61 translocon subunit gamma | GTEx | DepMap | Descartes | 33.31 | 1336.89 |
| 50 | QSOX1 | 0.0121332 | quiescin sulfhydryl oxidase 1 | GTEx | DepMap | Descartes | 6.05 | 32.17 |
UMAP plots showing activity of gene expression program identified in community:8. NB Cell Line #8 (SKNAS Mesenchymal)
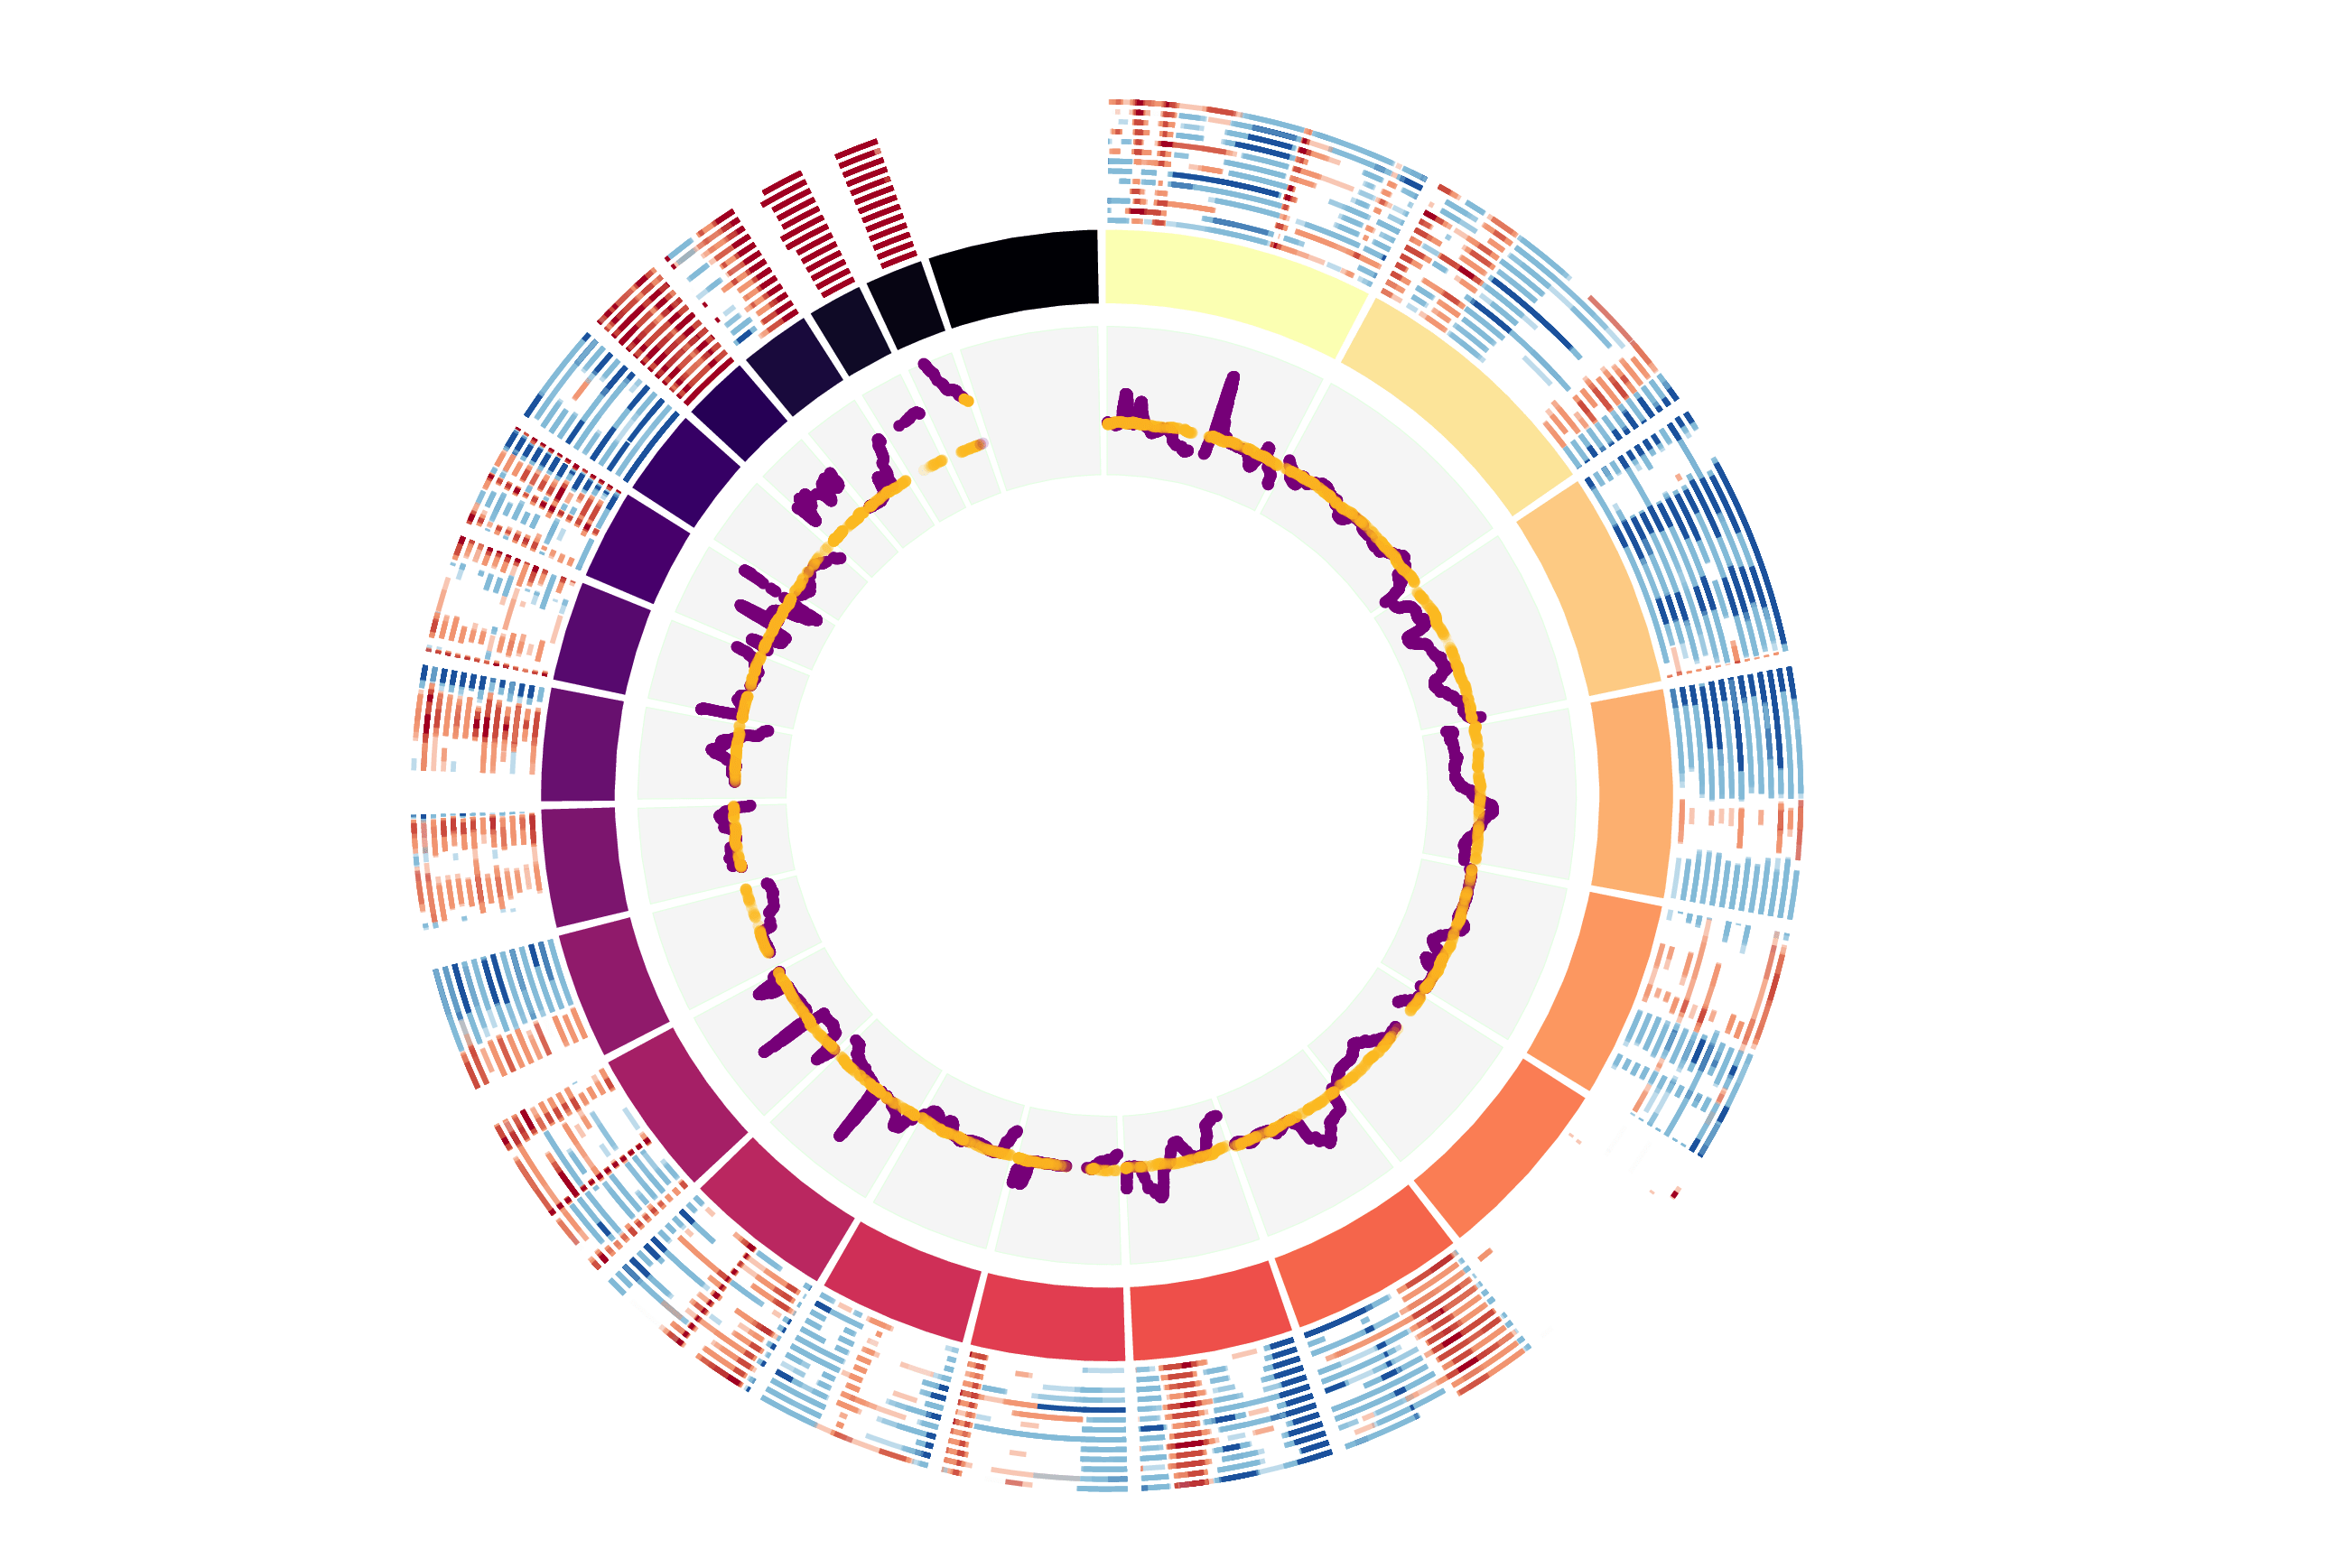
CNV Data procured from inferCNV.
Outer tracks are putative CNV regions (gains = red, losses = blue) for each patient
Inner track is expression data representing:
The top cells expressing this GEP (purple)
Random cells (n =50) from the reference set used in inferCNV (orange)
Gene set Enrichments for this program, caculated from top 50 genes
mSigDB Cell Types Gene Set:
| P-value | OR | Lower 95% CI | FDR | FWER | Genes Found | Gene Set Size | |
|---|---|---|---|---|---|---|---|
| FAN_EMBRYONIC_CTX_BIG_GROUPS_BRAIN_IMMUNE | 2.35e-10 | 22.64 | 9.89 | 5.63e-08 | 1.58e-07 | 10IFITM3, SH3BGRL3, S100A11, S100A4, PTPRC, PSMB9, FERMT3, PSMB8, FXYD5, ARPC1B |
148 |
| DURANTE_ADULT_OLFACTORY_NEUROEPITHELIUM_FIBROBLASTS_STROMAL_CELLS | 7.87e-07 | 22.40 | 7.58 | 3.52e-05 | 5.28e-04 | 6IFITM3, HGF, LUM, TIMP1, CRABP2, COL6A2 |
82 |
| RUBENSTEIN_SKELETAL_MUSCLE_MYELOID_CELLS | 3.14e-11 | 14.60 | 7.20 | 2.10e-08 | 2.10e-08 | 14SH3BGRL3, FTH1, S100A11, S100A4, IER3, PTPRC, SSR2, TIMP1, PYCARD, FXYD5, LAMTOR2, UQCRH, OST4, ARPC1B |
347 |
| FAN_OVARY_CL12_T_LYMPHOCYTE_NK_CELL_2 | 1.90e-07 | 15.56 | 6.20 | 1.16e-05 | 1.28e-04 | 8SH3BGRL3, FTH1, S100A11, S100A4, PTPRC, FXYD5, OST4, ARPC1B |
161 |
| TRAVAGLINI_LUNG_CAPILLARY_INTERMEDIATE_2_CELL | 2.52e-10 | 12.34 | 6.10 | 5.63e-08 | 1.69e-07 | 14IFITM3, SH3BGRL3, FTH1, S100A4, S100A3, PSMB9, VAMP5, GUK1, UBL5, NDUFB9, PPIA, UQCRQ, OST4, SEC61G |
408 |
| FAN_EMBRYONIC_CTX_BIG_GROUPS_BRAIN_ENDOTHELIAL | 8.18e-10 | 12.48 | 6.03 | 1.37e-07 | 5.49e-07 | 13IFITM3, S100A16, LTBR, VAMP5, ID3, TIMP1, GSDMD, PPIC, ID1, PSMB8, COL6A2, FXYD5, EVA1B |
365 |
| FAN_OVARY_CL7_ANGEIOGENIC_ENDOTHELIAL_CELL | 3.62e-08 | 12.96 | 5.71 | 4.05e-06 | 2.43e-05 | 10IFITM3, S100A16, PSMB9, VAMP5, ID3, ID1, GUK1, PSMB8, FXYD5, ARPC1B |
251 |
| RUBENSTEIN_SKELETAL_MUSCLE_FAP_CELLS | 4.24e-07 | 13.93 | 5.56 | 2.19e-05 | 2.85e-04 | 8S100A11, SPRY1, S100A4, SSR2, LUM, TIMP1, CD81, COL6A2 |
179 |
| MENON_FETAL_KIDNEY_10_IMMUNE_CELLS | 1.82e-05 | 17.79 | 5.37 | 4.57e-04 | 1.22e-02 | 5SH3BGRL3, S100A11, S100A4, PTPRC, ARPC1B |
83 |
| DURANTE_ADULT_OLFACTORY_NEUROEPITHELIUM_DENDRITIC_CELLS | 6.23e-06 | 15.35 | 5.24 | 1.90e-04 | 4.18e-03 | 6SH3BGRL3, FTH1, S100A4, PTPRC, TIMP1, PYCARD |
117 |
| AIZARANI_LIVER_C21_STELLATE_CELLS_1 | 7.76e-07 | 12.80 | 5.12 | 3.52e-05 | 5.20e-04 | 8IFITM3, IER3, HGF, LUM, TIMP1, CD81, COL6A2, QSOX1 |
194 |
| RUBENSTEIN_SKELETAL_MUSCLE_FBN1_FAP_CELLS | 1.33e-07 | 11.20 | 4.94 | 1.07e-05 | 8.90e-05 | 10SH3BGRL3, FTH1, S100A11, S100A4, TIMP1, PPIC, COL6A2, GAS1, OST4, SEC61G |
289 |
| FAN_OVARY_CL4_T_LYMPHOCYTE_NK_CELL_1 | 3.91e-07 | 11.58 | 4.89 | 2.19e-05 | 2.62e-04 | 9SH3BGRL3, FTH1, S100A11, S100A4, PTPRC, PSMB9, GUK1, FXYD5, ARPC1B |
246 |
| FAN_OVARY_CL13_MONOCYTE_MACROPHAGE | 1.17e-08 | 9.87 | 4.78 | 1.56e-06 | 7.82e-06 | 13SH3BGRL3, FTH1, S100A11, S100A4, IER3, PTPRC, PSMB9, TIMP1, FERMT3, PYCARD, FXYD5, LAMTOR2, ARPC1B |
458 |
| FAN_OVARY_CL2_PUTATIVE_EARLY_ATRETIC_FOLLICLE_THECAL_CELL_1 | 4.05e-05 | 14.93 | 4.52 | 8.50e-04 | 2.72e-02 | 5IFITM3, LUM, COL6A2, APOE, OST4 |
98 |
| RUBENSTEIN_SKELETAL_MUSCLE_ENDOTHELIAL_CELLS | 1.53e-05 | 13.01 | 4.45 | 4.46e-04 | 1.03e-02 | 6IFITM3, S100A16, VAMP5, ID3, PPIC, ID1 |
137 |
| FAN_EMBRYONIC_CTX_BRAIN_MYELOID | 1.66e-05 | 12.81 | 4.39 | 4.57e-04 | 1.11e-02 | 6IFITM3, S100A11, S100A4, PSMB9, TIMP1, FXYD5 |
139 |
| RUBENSTEIN_SKELETAL_MUSCLE_NK_CELLS | 2.40e-06 | 10.92 | 4.38 | 8.47e-05 | 1.61e-03 | 8SH3BGRL3, S100A4, PTPRC, PSMB9, SSR2, UBL5, OST4, ARPC1B |
226 |
| HU_FETAL_RETINA_FIBROBLAST | 1.85e-07 | 9.43 | 4.32 | 1.16e-05 | 1.24e-04 | 11IFITM3, S100A11, LUM, CFI, ID3, TIMP1, ID1, CD81, COL6A2, FXYD5, EVA1B |
385 |
| FAN_OVARY_CL16_LYMPHATIC_ENDOTHELIAL_CELL | 2.91e-06 | 10.63 | 4.26 | 9.75e-05 | 1.95e-03 | 8IFITM3, SH3BGRL3, S100A16, CFI, PPIC, GUK1, FXYD5, ARPC1B |
232 |
Dowload full table
mSigDB Hallmark Gene Sets:
| P-value | OR | Lower 95% CI | FDR | FWER | Genes Found | Gene Set Size | |
|---|---|---|---|---|---|---|---|
| HALLMARK_ANGIOGENESIS | 3.84e-04 | 24.16 | 4.58 | 1.02e-02 | 1.92e-02 | 3S100A4, LUM, TIMP1 |
36 |
| HALLMARK_APOPTOSIS | 4.10e-04 | 8.90 | 2.72 | 1.02e-02 | 2.05e-02 | 5IFITM3, IER3, HGF, LUM, TIMP1 |
161 |
| HALLMARK_EPITHELIAL_MESENCHYMAL_TRANSITION | 1.08e-03 | 7.12 | 2.18 | 1.80e-02 | 5.40e-02 | 5LUM, TIMP1, COL6A2, GAS1, QSOX1 |
200 |
| HALLMARK_INTERFERON_ALPHA_RESPONSE | 6.61e-03 | 8.48 | 1.66 | 7.71e-02 | 3.30e-01 | 3IFITM3, PSMB9, PSMB8 |
97 |
| HALLMARK_INTERFERON_GAMMA_RESPONSE | 7.71e-03 | 5.55 | 1.44 | 7.71e-02 | 3.85e-01 | 4IFITM3, PSMB9, VAMP5, PSMB8 |
200 |
| HALLMARK_TGF_BETA_SIGNALING | 1.94e-02 | 10.01 | 1.15 | 1.61e-01 | 9.68e-01 | 2ID3, ID1 |
54 |
| HALLMARK_GLYCOLYSIS | 4.35e-02 | 4.05 | 0.80 | 2.72e-01 | 1.00e+00 | 3IER3, PPIA, QSOX1 |
200 |
| HALLMARK_P53_PATHWAY | 4.35e-02 | 4.05 | 0.80 | 2.72e-01 | 1.00e+00 | 3S100A4, IER3, CD81 |
200 |
| HALLMARK_COAGULATION | 1.03e-01 | 3.83 | 0.45 | 5.71e-01 | 1.00e+00 | 2CFI, TIMP1 |
138 |
| HALLMARK_IL2_STAT5_SIGNALING | 1.83e-01 | 2.64 | 0.31 | 5.78e-01 | 1.00e+00 | 2IFITM3, CD81 |
199 |
| HALLMARK_HYPOXIA | 1.85e-01 | 2.63 | 0.31 | 5.78e-01 | 1.00e+00 | 2S100A4, IER3 |
200 |
| HALLMARK_ADIPOGENESIS | 1.85e-01 | 2.63 | 0.31 | 5.78e-01 | 1.00e+00 | 2UQCRQ, APOE |
200 |
| HALLMARK_COMPLEMENT | 1.85e-01 | 2.63 | 0.31 | 5.78e-01 | 1.00e+00 | 2PSMB9, TIMP1 |
200 |
| HALLMARK_OXIDATIVE_PHOSPHORYLATION | 1.85e-01 | 2.63 | 0.31 | 5.78e-01 | 1.00e+00 | 2UQCRQ, UQCRH |
200 |
| HALLMARK_ALLOGRAFT_REJECTION | 1.85e-01 | 2.63 | 0.31 | 5.78e-01 | 1.00e+00 | 2PTPRC, TIMP1 |
200 |
| HALLMARK_APICAL_SURFACE | 1.61e-01 | 5.93 | 0.14 | 5.78e-01 | 1.00e+00 | 1GAS1 |
44 |
| HALLMARK_CHOLESTEROL_HOMEOSTASIS | 2.55e-01 | 3.49 | 0.09 | 7.50e-01 | 1.00e+00 | 1S100A11 |
74 |
| HALLMARK_IL6_JAK_STAT3_SIGNALING | 2.93e-01 | 2.97 | 0.07 | 8.13e-01 | 1.00e+00 | 1LTBR |
87 |
| HALLMARK_PEROXISOME | 3.39e-01 | 2.48 | 0.06 | 8.82e-01 | 1.00e+00 | 1CRABP2 |
104 |
| HALLMARK_SPERMATOGENESIS | 4.15e-01 | 1.90 | 0.05 | 8.82e-01 | 1.00e+00 | 1IL13RA2 |
135 |
Dowload full table
KEGG Pathways:
| P-value | OR | Lower 95% CI | FDR | FWER | Genes Found | Gene Set Size | |
|---|---|---|---|---|---|---|---|
| KEGG_ALZHEIMERS_DISEASE | 4.04e-03 | 6.71 | 1.73 | 7.04e-01 | 7.52e-01 | 4NDUFB9, UQCRQ, APOE, UQCRH |
166 |
| KEGG_PROTEASOME | 1.43e-02 | 11.83 | 1.35 | 7.04e-01 | 1.00e+00 | 2PSMB9, PSMB8 |
46 |
| KEGG_PARKINSONS_DISEASE | 1.45e-02 | 6.28 | 1.23 | 7.04e-01 | 1.00e+00 | 3NDUFB9, UQCRQ, UQCRH |
130 |
| KEGG_OXIDATIVE_PHOSPHORYLATION | 1.51e-02 | 6.18 | 1.22 | 7.04e-01 | 1.00e+00 | 3NDUFB9, UQCRQ, UQCRH |
132 |
| KEGG_HUNTINGTONS_DISEASE | 3.45e-02 | 4.46 | 0.88 | 1.00e+00 | 1.00e+00 | 3NDUFB9, UQCRQ, UQCRH |
182 |
| KEGG_CARDIAC_MUSCLE_CONTRACTION | 3.90e-02 | 6.76 | 0.78 | 1.00e+00 | 1.00e+00 | 2UQCRQ, UQCRH |
79 |
| KEGG_TGF_BETA_SIGNALING_PATHWAY | 4.54e-02 | 6.20 | 0.72 | 1.00e+00 | 1.00e+00 | 2ID3, ID1 |
86 |
| KEGG_FC_GAMMA_R_MEDIATED_PHAGOCYTOSIS | 5.52e-02 | 5.54 | 0.64 | 1.00e+00 | 1.00e+00 | 2PTPRC, ARPC1B |
96 |
| KEGG_JAK_STAT_SIGNALING_PATHWAY | 1.24e-01 | 3.40 | 0.40 | 1.00e+00 | 1.00e+00 | 2SPRY1, IL13RA2 |
155 |
| KEGG_FOCAL_ADHESION | 1.83e-01 | 2.64 | 0.31 | 1.00e+00 | 1.00e+00 | 2HGF, COL6A2 |
199 |
| KEGG_PROTEIN_EXPORT | 9.13e-02 | 11.08 | 0.26 | 1.00e+00 | 1.00e+00 | 1SEC61G |
24 |
| KEGG_CYTOKINE_CYTOKINE_RECEPTOR_INTERACTION | 2.77e-01 | 1.98 | 0.23 | 1.00e+00 | 1.00e+00 | 2HGF, LTBR |
265 |
| KEGG_ALANINE_ASPARTATE_AND_GLUTAMATE_METABOLISM | 1.20e-01 | 8.23 | 0.20 | 1.00e+00 | 1.00e+00 | 1ASS1 |
32 |
| KEGG_PRIMARY_IMMUNODEFICIENCY | 1.30e-01 | 7.50 | 0.18 | 1.00e+00 | 1.00e+00 | 1PTPRC |
35 |
| KEGG_SNARE_INTERACTIONS_IN_VESICULAR_TRANSPORT | 1.41e-01 | 6.89 | 0.17 | 1.00e+00 | 1.00e+00 | 1VAMP5 |
38 |
| KEGG_PORPHYRIN_AND_CHLOROPHYLL_METABOLISM | 1.51e-01 | 6.37 | 0.15 | 1.00e+00 | 1.00e+00 | 1FTH1 |
41 |
| KEGG_INTESTINAL_IMMUNE_NETWORK_FOR_IGA_PRODUCTION | 1.74e-01 | 5.43 | 0.13 | 1.00e+00 | 1.00e+00 | 1LTBR |
48 |
| KEGG_ARGININE_AND_PROLINE_METABOLISM | 1.94e-01 | 4.81 | 0.12 | 1.00e+00 | 1.00e+00 | 1ASS1 |
54 |
| KEGG_VIBRIO_CHOLERAE_INFECTION | 1.94e-01 | 4.81 | 0.12 | 1.00e+00 | 1.00e+00 | 1SEC61G |
54 |
| KEGG_CYTOSOLIC_DNA_SENSING_PATHWAY | 1.97e-01 | 4.72 | 0.12 | 1.00e+00 | 1.00e+00 | 1PYCARD |
55 |
Dowload full table
CHR Positional Gene Sets:
| P-value | OR | Lower 95% CI | FDR | FWER | Genes Found | Gene Set Size | |
|---|---|---|---|---|---|---|---|
| chr1q22 | 3.13e-02 | 7.66 | 0.88 | 1.00e+00 | 1.00e+00 | 2SSR2, LAMTOR2 |
70 |
| chr1q31 | 3.21e-02 | 7.55 | 0.87 | 1.00e+00 | 1.00e+00 | 2RGS13, PTPRC |
71 |
| chr1q21 | 6.42e-02 | 2.80 | 0.73 | 1.00e+00 | 1.00e+00 | 4S100A11, S100A4, S100A16, S100A3 |
392 |
| chr6p21 | 4.27e-01 | 1.72 | 0.34 | 1.00e+00 | 1.00e+00 | 3IER3, PSMB9, PSMB8 |
467 |
| chr8q24 | 3.56e-01 | 1.63 | 0.19 | 1.00e+00 | 1.00e+00 | 2GSDMD, NDUFB9 |
321 |
| chr11q13 | 6.78e-01 | 1.24 | 0.15 | 1.00e+00 | 1.00e+00 | 2FERMT3, PPP1R14B |
421 |
| chr7p13 | 1.81e-01 | 5.21 | 0.13 | 1.00e+00 | 1.00e+00 | 1PPIA |
50 |
| chr2q23 | 1.84e-01 | 5.10 | 0.12 | 1.00e+00 | 1.00e+00 | 1LYPD6B |
51 |
| chr1p33 | 2.13e-01 | 4.32 | 0.11 | 1.00e+00 | 1.00e+00 | 1UQCRH |
60 |
| chr1p36 | 1.00e+00 | 0.80 | 0.09 | 1.00e+00 | 1.00e+00 | 2SH3BGRL3, ID3 |
656 |
| chr7p11 | 2.78e-01 | 3.15 | 0.08 | 1.00e+00 | 1.00e+00 | 1SEC61G |
82 |
| chr4q25 | 2.93e-01 | 2.97 | 0.07 | 1.00e+00 | 1.00e+00 | 1CFI |
87 |
| chrXq23 | 2.98e-01 | 2.90 | 0.07 | 1.00e+00 | 1.00e+00 | 1IL13RA2 |
89 |
| chr5q23 | 3.57e-01 | 2.32 | 0.06 | 1.00e+00 | 1.00e+00 | 1PPIC |
111 |
| chr19q13 | 4.39e-01 | 0.45 | 0.05 | 1.00e+00 | 1.00e+00 | 2FXYD5, APOE |
1165 |
| chr12q21 | 3.99e-01 | 2.01 | 0.05 | 1.00e+00 | 1.00e+00 | 1LUM |
128 |
| chr2p23 | 4.38e-01 | 1.77 | 0.04 | 1.00e+00 | 1.00e+00 | 1OST4 |
145 |
| chr1q25 | 4.70e-01 | 1.60 | 0.04 | 1.00e+00 | 1.00e+00 | 1QSOX1 |
160 |
| chr7q21 | 4.78e-01 | 1.56 | 0.04 | 1.00e+00 | 1.00e+00 | 1HGF |
164 |
| chr9q21 | 5.25e-01 | 1.36 | 0.03 | 1.00e+00 | 1.00e+00 | 1GAS1 |
188 |
Dowload full table
Transcription Factor Targets:
| P-value | OR | Lower 95% CI | FDR | FWER | Genes Found | Gene Set Size | |
|---|---|---|---|---|---|---|---|
| STTTCRNTTT_IRF_Q6 | 9.02e-04 | 7.43 | 2.27 | 6.20e-01 | 1.00e+00 | 5HGF, PSMB9, VAMP5, GSDMD, PSMB8 |
192 |
| IRF2_01 | 1.64e-03 | 8.69 | 2.24 | 6.20e-01 | 1.00e+00 | 4PSMB9, GSDMD, PSMB8, FXYD5 |
129 |
| ZBED4_TARGET_GENES | 4.49e-03 | 6.51 | 1.68 | 1.00e+00 | 1.00e+00 | 4IER3, S100A16, UQCRQ, SEC61G |
171 |
| TEAD2_TARGET_GENES | 5.24e-03 | 2.67 | 1.27 | 1.00e+00 | 1.00e+00 | 12S100A11, S100A16, PSMB9, GUK1, PSMB8, NDUFB9, PPIA, LAMTOR2, UQCRQ, PPP1R14B, UQCRH, SEC61G |
1494 |
| ZMYM2_TARGET_GENES | 1.42e-02 | 6.33 | 1.24 | 1.00e+00 | 1.00e+00 | 3PPIC, PPIA, PPP1R14B |
129 |
| IRF1_01 | 1.73e-02 | 4.33 | 1.12 | 1.00e+00 | 1.00e+00 | 4PSMB9, GSDMD, PSMB8, FXYD5 |
255 |
| RYTTCCTG_ETS2_B | 1.83e-02 | 2.49 | 1.06 | 1.00e+00 | 1.00e+00 | 9FTH1, PTPRC, HGF, LTBR, VAMP5, ID3, TIMP1, FERMT3, FXYD5 |
1112 |
| DLX6_TARGET_GENES | 2.48e-02 | 2.89 | 1.00 | 1.00e+00 | 1.00e+00 | 6FTH1, LTBR, ID1, UQCRQ, PPP1R14B, UQCRH |
596 |
| PSMB5_TARGET_GENES | 3.11e-02 | 3.59 | 0.93 | 1.00e+00 | 1.00e+00 | 4FTH1, IER3, ID1, PPP1R14B |
307 |
| FOXJ2_01 | 3.69e-02 | 4.34 | 0.86 | 1.00e+00 | 1.00e+00 | 3IER3, ID1, TWIST2 |
187 |
| ZNF92_TARGET_GENES | 9.61e-02 | 1.92 | 0.82 | 1.00e+00 | 1.00e+00 | 9CYGB, VAMP5, FERMT3, CD81, PPIA, FXYD5, PPP1R14B, EVA1B, ASS1 |
1440 |
| WGTTNNNNNAAA_UNKNOWN | 5.91e-02 | 2.53 | 0.78 | 1.00e+00 | 1.00e+00 | 5IER3, RGS13, CYGB, CFI, UBL5 |
554 |
| HNF3B_01 | 5.65e-02 | 3.63 | 0.72 | 1.00e+00 | 1.00e+00 | 3IER3, ID1, TWIST2 |
223 |
| SFMBT1_TARGET_GENES | 1.81e-01 | 1.66 | 0.71 | 1.00e+00 | 1.00e+00 | 9SH3BGRL3, S100A16, RGS13, PSMB9, ID3, PPIC, ASS1, SEC61G, QSOX1 |
1661 |
| CREB3L4_TARGET_GENES | 1.61e-01 | 1.69 | 0.68 | 1.00e+00 | 1.00e+00 | 8SH3BGRL3, SPRY1, IER3, S100A16, PPIC, GUK1, PPIA, UQCRQ |
1418 |
| ETS_Q4 | 7.52e-02 | 3.20 | 0.63 | 1.00e+00 | 1.00e+00 | 3LTBR, FXYD5, ARPC1B |
252 |
| ICSBP_Q6 | 7.59e-02 | 3.19 | 0.63 | 1.00e+00 | 1.00e+00 | 3PSMB9, GSDMD, PSMB8 |
253 |
| CREL_01 | 7.87e-02 | 3.14 | 0.62 | 1.00e+00 | 1.00e+00 | 3IER3, HGF, NDUFB9 |
257 |
| UBP1_TARGET_GENES | 2.98e-01 | 1.44 | 0.61 | 1.00e+00 | 1.00e+00 | 9S100A11, SPRY1, PSMB9, LTBR, GUK1, PSMB8, PPIA, FXYD5, UQCRQ |
1915 |
| PEA3_Q6 | 8.29e-02 | 3.07 | 0.61 | 1.00e+00 | 1.00e+00 | 3PTPRC, LTBR, FERMT3 |
263 |
Dowload full table
GO Biological Processes:
| P-value | OR | Lower 95% CI | FDR | FWER | Genes Found | Gene Set Size | |
|---|---|---|---|---|---|---|---|
| GOBP_MITOCHONDRIAL_ELECTRON_TRANSPORT_UBIQUINOL_TO_CYTOCHROME_C | 1.37e-03 | 43.30 | 4.59 | 8.47e-01 | 1.00e+00 | 2UQCRQ, UQCRH |
14 |
| GOBP_POSITIVE_REGULATION_OF_EXTRINSIC_APOPTOTIC_SIGNALING_PATHWAY | 8.97e-04 | 17.71 | 3.40 | 6.71e-01 | 1.00e+00 | 3PTPRC, LTBR, PYCARD |
48 |
| GOBP_POSITIVE_REGULATION_OF_ALPHA_BETA_T_CELL_PROLIFERATION | 3.10e-03 | 27.37 | 3.01 | 1.00e+00 | 1.00e+00 | 2PTPRC, CD81 |
21 |
| GOBP_PROTEASOMAL_UBIQUITIN_INDEPENDENT_PROTEIN_CATABOLIC_PROCESS | 3.40e-03 | 26.01 | 2.87 | 1.00e+00 | 1.00e+00 | 2PSMB9, PSMB8 |
22 |
| GOBP_POSITIVE_REGULATION_OF_ANTIGEN_RECEPTOR_MEDIATED_SIGNALING_PATHWAY | 3.72e-03 | 24.78 | 2.74 | 1.00e+00 | 1.00e+00 | 2PTPRC, CD81 |
23 |
| GOBP_REGULATION_OF_MEMBRANE_PROTEIN_ECTODOMAIN_PROTEOLYSIS | 3.72e-03 | 24.78 | 2.74 | 1.00e+00 | 1.00e+00 | 2TIMP1, APOE |
23 |
| GOBP_NEGATIVE_REGULATION_OF_VIRAL_LIFE_CYCLE | 4.05e-03 | 23.65 | 2.62 | 1.00e+00 | 1.00e+00 | 2IFITM3, PPIA |
24 |
| GOBP_PLATELET_DEGRANULATION | 1.59e-03 | 8.76 | 2.26 | 8.52e-01 | 1.00e+00 | 4HGF, TIMP1, FERMT3, QSOX1 |
128 |
| GOBP_MYELOID_DENDRITIC_CELL_ACTIVATION | 5.87e-03 | 19.27 | 2.16 | 1.00e+00 | 1.00e+00 | 2LTBR, PYCARD |
29 |
| GOBP_MYELOID_LEUKOCYTE_MEDIATED_IMMUNITY | 2.04e-04 | 5.07 | 2.16 | 4.52e-01 | 1.00e+00 | 9FTH1, S100A11, PTPRC, IL13RA2, GSDMD, PPIA, PYCARD, LAMTOR2, QSOX1 |
550 |
| GOBP_LOCALIZATION_WITHIN_MEMBRANE | 3.23e-03 | 11.08 | 2.16 | 1.00e+00 | 1.00e+00 | 3PTPRC, CD81, APOE |
75 |
| GOBP_MYELOID_LEUKOCYTE_ACTIVATION | 1.50e-04 | 4.82 | 2.14 | 4.52e-01 | 1.00e+00 | 10FTH1, S100A11, PTPRC, IL13RA2, LTBR, GSDMD, PPIA, PYCARD, LAMTOR2, QSOX1 |
659 |
| GOBP_EXOCYTOSIS | 7.77e-05 | 4.49 | 2.13 | 4.52e-01 | 5.81e-01 | 12FTH1, S100A11, PTPRC, IL13RA2, HGF, TIMP1, GSDMD, FERMT3, PPIA, PYCARD, LAMTOR2, QSOX1 |
891 |
| GOBP_REGULATION_OF_MAP_KINASE_ACTIVITY | 1.16e-03 | 5.66 | 1.96 | 7.88e-01 | 1.00e+00 | 6SPRY1, PTPRC, HGF, CD81, PPIA, APOE |
307 |
| GOBP_CELL_ACTIVATION_INVOLVED_IN_IMMUNE_RESPONSE | 3.02e-04 | 4.39 | 1.95 | 4.52e-01 | 1.00e+00 | 10FTH1, S100A11, PTPRC, IL13RA2, GSDMD, CD81, PPIA, PYCARD, LAMTOR2, QSOX1 |
722 |
| GOBP_LEUKOCYTE_MEDIATED_IMMUNITY | 2.96e-04 | 4.09 | 1.88 | 4.52e-01 | 1.00e+00 | 11FTH1, S100A11, PTPRC, IL13RA2, CFI, GSDMD, CD81, PPIA, PYCARD, LAMTOR2, QSOX1 |
873 |
| GOBP_ACTIVATION_OF_MAPK_ACTIVITY | 3.10e-03 | 7.25 | 1.87 | 1.00e+00 | 1.00e+00 | 4PTPRC, HGF, CD81, PPIA |
154 |
| GOBP_REGULATION_OF_EXTRINSIC_APOPTOTIC_SIGNALING_PATHWAY | 3.10e-03 | 7.25 | 1.87 | 1.00e+00 | 1.00e+00 | 4PTPRC, HGF, LTBR, PYCARD |
154 |
| GOBP_CELLULAR_RESPONSE_TO_LIPOPROTEIN_PARTICLE_STIMULUS | 8.00e-03 | 16.26 | 1.84 | 1.00e+00 | 1.00e+00 | 2CD81, APOE |
34 |
| GOBP_MAPK_CASCADE | 4.21e-04 | 3.91 | 1.80 | 4.56e-01 | 1.00e+00 | 11SPRY1, PTPRC, HGF, PSMB9, LTBR, PSMB8, CD81, PPIA, PYCARD, LAMTOR2, APOE |
912 |
Dowload full table
Immunological Gene Sets:
| P-value | OR | Lower 95% CI | FDR | FWER | Genes Found | Gene Set Size | |
|---|---|---|---|---|---|---|---|
| GSE19888_ADENOSINE_A3R_INH_PRETREAT_AND_ACT_BY_A3R_VS_TCELL_MEMBRANES_ACT_MAST_CELL_UP | 1.19e-05 | 10.54 | 3.95 | 5.79e-02 | 5.79e-02 | 7IFITM3, PTPRC, PSMB9, TIMP1, GSDMD, PSMB8, FXYD5 |
200 |
| GSE24026_PD1_LIGATION_VS_CTRL_IN_ACT_TCELL_LINE_UP | 1.14e-04 | 8.92 | 3.07 | 8.61e-02 | 5.55e-01 | 6SH3BGRL3, PTPRC, PSMB9, TIMP1, PSMB8, SEC61G |
197 |
| GSE37534_UNTREATED_VS_PIOGLITAZONE_TREATED_CD4_TCELL_PPARG1_AND_FOXP3_TRASDUCED_DN | 1.20e-04 | 8.83 | 3.04 | 8.61e-02 | 5.86e-01 | 6IFITM3, PSMB9, VAMP5, ID3, GSDMD, PSMB8 |
199 |
| GSE339_CD4POS_VS_CD8POS_DC_IN_CULTURE_DN | 1.24e-04 | 8.78 | 3.02 | 8.61e-02 | 6.03e-01 | 6IL13RA2, CRABP2, PSMB8, CD81, PPP1R14B, SEC61G |
200 |
| GSE5960_TH1_VS_ANERGIC_TH1_DN | 1.24e-04 | 8.78 | 3.02 | 8.61e-02 | 6.03e-01 | 6IER3, S100A3, VAMP5, ID1, CD81, ASS1 |
200 |
| GSE1925_CTRL_VS_IFNG_PRIMED_MACROPHAGE_24H_IFNG_STIM_DN | 1.24e-04 | 8.78 | 3.02 | 8.61e-02 | 6.03e-01 | 6IFITM3, S100A11, S100A16, PPIA, APOE, QSOX1 |
200 |
| GSE24726_WT_VS_E2_2_KO_PDC_DAY4_POST_DELETION_UP | 1.24e-04 | 8.78 | 3.02 | 8.61e-02 | 6.03e-01 | 6IFITM3, S100A11, PSMB9, PSMB8, UQCRQ, PPP1R14B |
200 |
| GSE3720_UNSTIM_VS_PMA_STIM_VD1_GAMMADELTA_TCELL_UP | 6.12e-04 | 8.12 | 2.49 | 1.31e-01 | 1.00e+00 | 5S100A11, GSDMD, PSMB8, NDUFB9, UQCRQ |
176 |
| GSE21360_NAIVE_VS_SECONDARY_MEMORY_CD8_TCELL_UP | 7.29e-04 | 7.80 | 2.39 | 1.31e-01 | 1.00e+00 | 5IER3, PPIC, PPP1R14B, EVA1B, QSOX1 |
183 |
| GSE22886_NAIVE_VS_IGG_IGA_MEMORY_BCELL_DN | 9.88e-04 | 7.27 | 2.23 | 1.31e-01 | 1.00e+00 | 5S100A4, PSMB9, PYCARD, UQCRH, ARPC1B |
196 |
| GSE21546_WT_VS_SAP1A_KO_DP_THYMOCYTES_UP | 9.88e-04 | 7.27 | 2.23 | 1.31e-01 | 1.00e+00 | 5IFITM3, IL13RA2, PSMB9, VAMP5, PSMB8 |
196 |
| GSE1925_3H_VS_24H_IFNG_STIM_MACROPHAGE_DN | 1.01e-03 | 7.23 | 2.22 | 1.31e-01 | 1.00e+00 | 5IFITM3, S100A11, S100A4, ID3, ARPC1B |
197 |
| GSE11057_NAIVE_VS_MEMORY_CD4_TCELL_DN | 1.03e-03 | 7.19 | 2.20 | 1.31e-01 | 1.00e+00 | 5SH3BGRL3, S100A11, S100A4, TIMP1, ARPC1B |
198 |
| GSE22886_CD4_TCELL_VS_BCELL_NAIVE_UP | 1.03e-03 | 7.19 | 2.20 | 1.31e-01 | 1.00e+00 | 5IFITM3, S100A4, TIMP1, GUK1, PPP1R14B |
198 |
| GSE2585_THYMIC_DC_VS_THYMIC_MACROPHAGE_DN | 1.03e-03 | 7.19 | 2.20 | 1.31e-01 | 1.00e+00 | 5S100A4, ID3, GSDMD, GUK1, LAMTOR2 |
198 |
| GSE45382_UNTREATED_VS_TGFB_TREATED_MACROPHAGES_UP | 1.03e-03 | 7.19 | 2.20 | 1.31e-01 | 1.00e+00 | 5SH3BGRL3, S100A4, FERMT3, CD81, PYCARD |
198 |
| GSE17721_POLYIC_VS_PAM3CSK4_6H_BMDC_DN | 1.06e-03 | 7.16 | 2.19 | 1.31e-01 | 1.00e+00 | 5FTH1, UBL5, FERMT3, UQCRQ, PPP1R14B |
199 |
| GSE29618_MONOCYTE_VS_PDC_UP | 1.06e-03 | 7.16 | 2.19 | 1.31e-01 | 1.00e+00 | 5S100A11, S100A4, IER3, PTPRC, TIMP1 |
199 |
| GSE360_CTRL_VS_L_MAJOR_DC_DN | 1.06e-03 | 7.16 | 2.19 | 1.31e-01 | 1.00e+00 | 5IFITM3, IER3, PSMB9, VAMP5, TIMP1 |
199 |
| GSE41978_ID2_KO_VS_BIM_KO_KLRG1_LOW_EFFECTOR_CD8_TCELL_UP | 1.06e-03 | 7.16 | 2.19 | 1.31e-01 | 1.00e+00 | 5IFITM3, PTPRC, PSMB9, LTBR, PSMB8 |
199 |
Top Ranked Transcription Factors for this Gene Expression Program:
| Gene Symbol | TF Rank | DNA Binding Domain | Motif Status | IUPAC PWM | GTEx | DepMap | Decartes |
|---|---|---|---|---|---|---|---|
| ID3 | 21 | No | Unlikely to be sequence specific TF | Not a DNA binding protein | No motif | None | ID bHLH proteins lack the basic region and should not be able to bind DNA. The HT-SELEX motif for ID4 is likely by a co-precipitated protein or it is a contamination |
| ID1 | 26 | No | Unlikely to be sequence specific TF | Not a DNA binding protein | No motif | None | ID bHLH proteins lack the basic region and should not be able to bind DNA. The HT-SELEX motif for ID4 is likely by a co-precipitated protein or it is a contamination |
| PYCARD | 35 | No | Unlikely to be sequence specific TF | Not a DNA binding protein | No motif | None | None |
| TWIST2 | 47 | Yes | Known motif | Monomer or homomultimer | 100 perc ID - in vitro | None | None |
| NR2F1 | 53 | Yes | Known motif | Monomer or homomultimer | High-throughput in vitro | None | None |
| TAF10 | 54 | No | Unlikely to be sequence specific TF | Not a DNA binding protein | No motif | None | General transcription factor |
| POLR2L | 90 | No | Unlikely to be sequence specific TF | Not a DNA binding protein | No motif | None | Does not contact DNA in the structure (PDB: 5FLM) |
| POLR2J | 97 | No | Unlikely to be sequence specific TF | Not a DNA binding protein | No motif | None | Does not contact DNA in the structure (PDB: 5FLM) |
| ZFP36 | 104 | No | ssDNA/RNA binding | Not a DNA binding protein | No motif | None | RNA binding protein (PMID: 10330172). |
| EIF3K | 107 | No | Unlikely to be sequence specific TF | Not a DNA binding protein | No motif | None | None |
| ATOH8 | 117 | Yes | Inferred motif | Monomer or homomultimer | High-throughput in vitro | None | None |
| NFKBIA | 118 | No | Unlikely to be sequence specific TF | Not a DNA binding protein | No motif | None | This is I kappa B alpha, which interacts with NFkappaB. No DBD, and evidence indicates that it is not a TF. |
| JUNB | 121 | Yes | Known motif | Monomer or homomultimer | High-throughput in vitro | None | Prefers forming heterodimers with FOS; FOSB; FOSL1 and FOSL2 over homodimers (PMID:12805554); but, clearly can bind DNA specifically in vitro. |
| NME2 | 123 | Yes | Likely to be sequence specific TF | Monomer or homomultimer | No motif | None | Binds to telomeres (PMID: 22135295). Binds specific sequences by gel-shift, and binding is impacted by a SNP (PMID: 23368879) |
| DRAP1 | 133 | Yes | Likely to be sequence specific TF | Obligate heteromer | No motif | None | Based on structure (PDB: 1JFI), it forms the obligate heterodimer DR1-DRAP1 that furthermore contacts TBP. Only makes contact with the minor groove in a histone-like interaction, which is probably non-specific (PMID: 11461703) |
| PPARG | 151 | Yes | Known motif | Monomer or homomultimer | 100 perc ID - in vitro | None | Also heterodimerizes. |
| PSMA6 | 173 | No | Unlikely to be sequence specific TF | Not a DNA binding protein | No motif | None | None |
| SP100 | 179 | Yes | Likely to be sequence specific TF | Monomer or homomultimer | No motif | None | Gel-shift experiments using human SP100 have shown binding to specific TTCG half sites (PMID: 11427895). |
| SP110 | 182 | Yes | Likely to be sequence specific TF | Monomer or homomultimer | No motif | None | None |
| MSC | 190 | Yes | Known motif | Monomer or homomultimer | High-throughput in vitro | None | None |
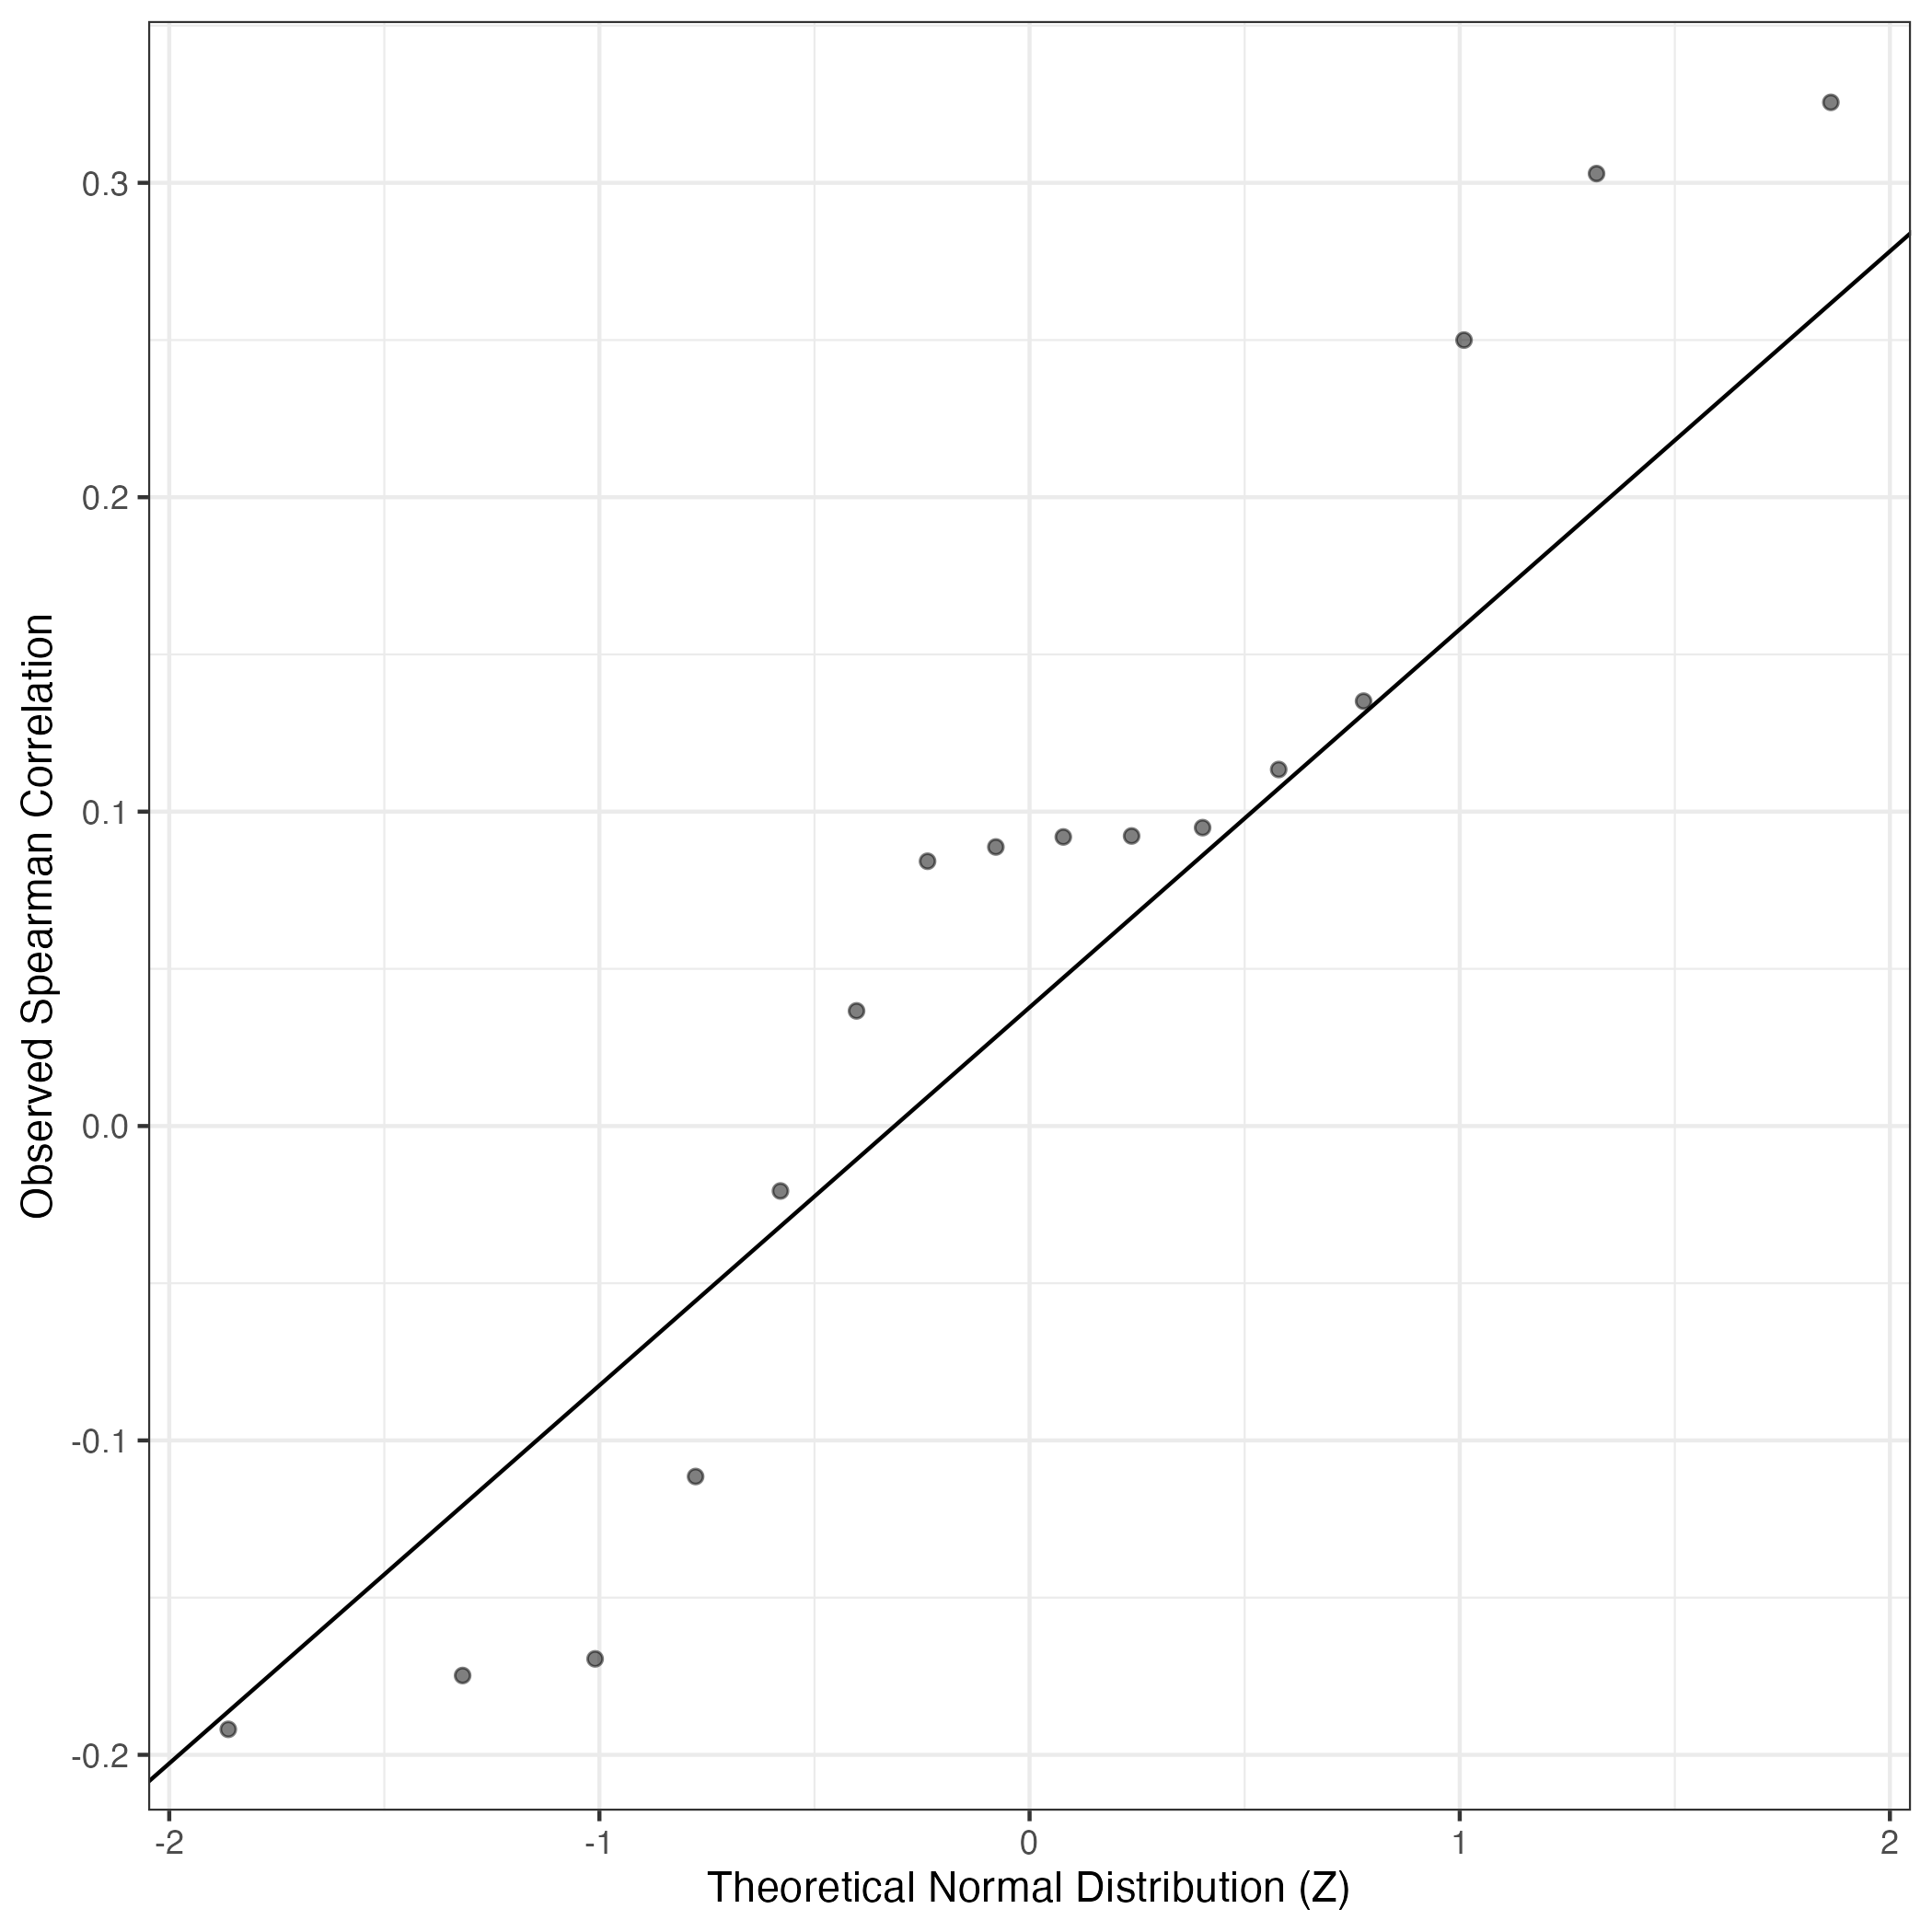
QQ Plot showing correlations with other Gene Expression Programs in this dataset, calculated by Spearman correlation:
Interactive QQ-plot of gene loadings:
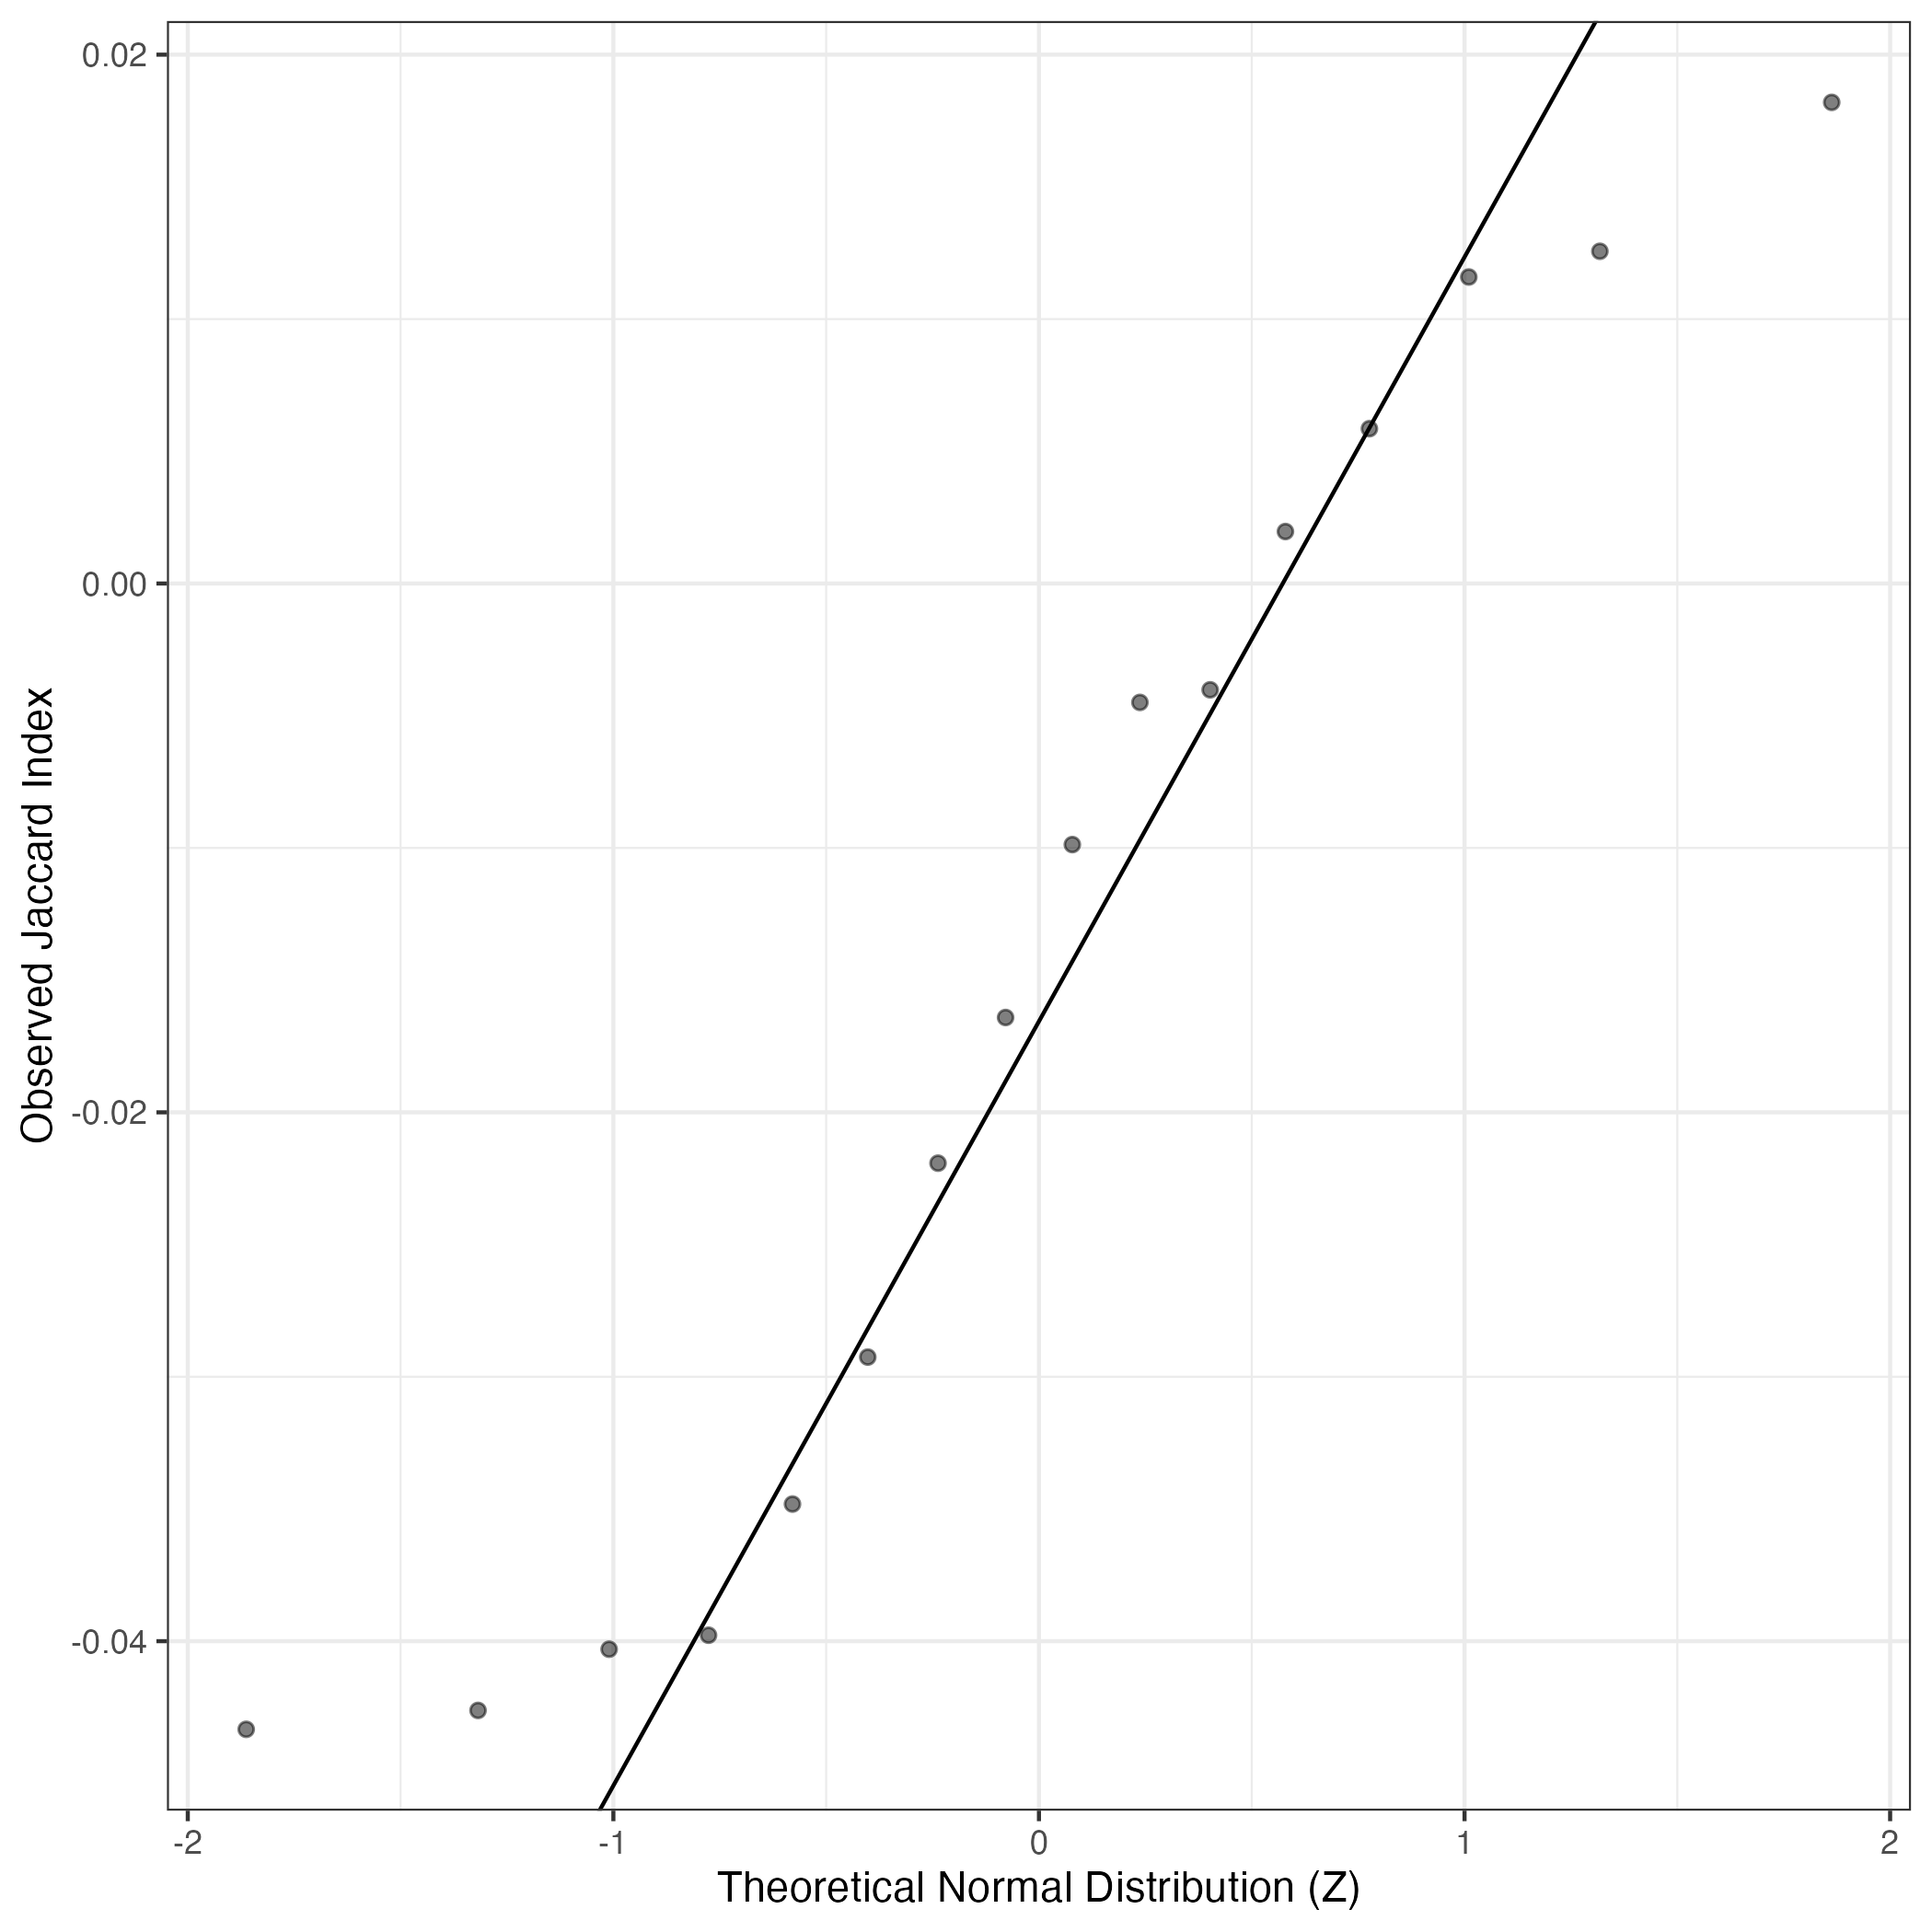
A similar QQ-plot as above, but only for instances where the H value is e.g. > 25, i.e. we are confident that the expression program is active above noise. Agreemenet between these binary vectors is tested using the Jaccard Index, with the P-values calculated by an exact test:
Interactive QQ-plot:
Singler cell type annotations for the top 50 cells on this program.
| Cell ID | Singler label | Singler Delta | Activity Score | Top Singler Raw Scores |
|---|---|---|---|---|
| SKNAS_ATCGATGAGGAGTCTG-1 | MSC | 0.17 | 1253.20 | Raw ScoresSmooth_muscle_cells:umbilical_vein: 0.57, MSC: 0.57, Neurons:adrenal_medulla_cell_line: 0.56, Tissue_stem_cells:lipoma-derived_MSC: 0.56, Fibroblasts:foreskin: 0.55, Tissue_stem_cells:adipose-derived_MSC_AM3: 0.55, Smooth_muscle_cells:vascular: 0.55, iPS_cells:foreskin_fibrobasts: 0.55, iPS_cells:skin_fibroblast: 0.54, Tissue_stem_cells:dental_pulp: 0.53 |
| SKNAS_CTGCATCCAATTGCTG-1 | Smooth_muscle_cells | 0.13 | 529.65 | Raw ScoresSmooth_muscle_cells:umbilical_vein: 0.51, MSC: 0.5, Smooth_muscle_cells:vascular: 0.49, Tissue_stem_cells:lipoma-derived_MSC: 0.49, iPS_cells:foreskin_fibrobasts: 0.49, Fibroblasts:foreskin: 0.49, Smooth_muscle_cells:vascular:IL-17: 0.48, Tissue_stem_cells:adipose-derived_MSC_AM3: 0.48, iPS_cells:skin_fibroblast: 0.48, Neurons:Schwann_cell: 0.48 |
| SKNAS_TAAGCCATCGACGATT-1 | Neurons | 0.14 | 420.29 | Raw ScoresSmooth_muscle_cells:umbilical_vein: 0.53, MSC: 0.52, Neurons:adrenal_medulla_cell_line: 0.51, Fibroblasts:foreskin: 0.51, Tissue_stem_cells:lipoma-derived_MSC: 0.51, Tissue_stem_cells:adipose-derived_MSC_AM3: 0.51, Smooth_muscle_cells:vascular: 0.51, iPS_cells:foreskin_fibrobasts: 0.5, iPS_cells:skin_fibroblast: 0.5, Fibroblasts:breast: 0.5 |
| SKNAS_TTACCGCGTAGCGTAG-1 | Smooth_muscle_cells | 0.16 | 338.89 | Raw ScoresSmooth_muscle_cells:umbilical_vein: 0.49, MSC: 0.49, Smooth_muscle_cells:vascular: 0.48, Smooth_muscle_cells:vascular:IL-17: 0.48, iPS_cells:skin_fibroblast: 0.48, iPS_cells:foreskin_fibrobasts: 0.48, Fibroblasts:breast: 0.48, Tissue_stem_cells:lipoma-derived_MSC: 0.47, iPS_cells:adipose_stem_cells: 0.47, Fibroblasts:foreskin: 0.47 |
| SKNAS_GGTGAAGCAGGTCCCA-1 | MSC | 0.20 | 333.52 | Raw ScoresMSC: 0.55, Smooth_muscle_cells:umbilical_vein: 0.54, Fibroblasts:foreskin: 0.53, iPS_cells:foreskin_fibrobasts: 0.53, Smooth_muscle_cells:vascular: 0.53, iPS_cells:skin_fibroblast: 0.53, Tissue_stem_cells:lipoma-derived_MSC: 0.53, Tissue_stem_cells:dental_pulp: 0.52, iPS_cells:CRL2097_foreskin: 0.52, Tissue_stem_cells:adipose-derived_MSC_AM3: 0.52 |
| SKNAS_CGAGTGCCACGTAGAG-1 | Neurons | 0.14 | 300.66 | Raw ScoresMSC: 0.55, Smooth_muscle_cells:umbilical_vein: 0.54, Neurons:adrenal_medulla_cell_line: 0.54, Tissue_stem_cells:lipoma-derived_MSC: 0.54, Tissue_stem_cells:adipose-derived_MSC_AM3: 0.53, Fibroblasts:foreskin: 0.53, iPS_cells:skin_fibroblast: 0.52, Smooth_muscle_cells:vascular: 0.52, Tissue_stem_cells:CD326-CD56+: 0.52, iPS_cells:foreskin_fibrobasts: 0.52 |
| SKNAS_AGTCATGAGCAAGCCA-1 | Neurons | 0.15 | 287.28 | Raw ScoresMSC: 0.53, Neurons:adrenal_medulla_cell_line: 0.53, Smooth_muscle_cells:umbilical_vein: 0.52, Tissue_stem_cells:lipoma-derived_MSC: 0.52, Tissue_stem_cells:adipose-derived_MSC_AM3: 0.51, Fibroblasts:foreskin: 0.51, Smooth_muscle_cells:vascular: 0.51, Tissue_stem_cells:CD326-CD56+: 0.5, Endothelial_cells:HUVEC:FPV-infected: 0.5, iPS_cells:skin_fibroblast: 0.5 |
| SKNAS_TGGAGAGTCACACCCT-1 | Neurons | 0.12 | 278.37 | Raw ScoresMSC: 0.54, Neurons:adrenal_medulla_cell_line: 0.53, Smooth_muscle_cells:umbilical_vein: 0.52, Tissue_stem_cells:lipoma-derived_MSC: 0.52, Tissue_stem_cells:adipose-derived_MSC_AM3: 0.51, Smooth_muscle_cells:vascular: 0.51, Fibroblasts:foreskin: 0.51, Endothelial_cells:HUVEC: 0.51, iPS_cells:skin_fibroblast: 0.5, Tissue_stem_cells:CD326-CD56+: 0.5 |
| SKNAS_GAAGGACGTATGACAA-1 | MSC | 0.16 | 271.94 | Raw ScoresMSC: 0.53, Tissue_stem_cells:lipoma-derived_MSC: 0.53, Smooth_muscle_cells:umbilical_vein: 0.53, Tissue_stem_cells:adipose-derived_MSC_AM3: 0.52, Fibroblasts:foreskin: 0.51, Smooth_muscle_cells:vascular: 0.51, iPS_cells:foreskin_fibrobasts: 0.51, iPS_cells:skin_fibroblast: 0.51, Neurons:adrenal_medulla_cell_line: 0.51, Tissue_stem_cells:dental_pulp: 0.5 |
| SKNAS_GGGAAGTGTGCTAGCC-1 | Neurons | 0.13 | 269.86 | Raw ScoresMSC: 0.52, Smooth_muscle_cells:umbilical_vein: 0.51, Neurons:adrenal_medulla_cell_line: 0.51, Tissue_stem_cells:lipoma-derived_MSC: 0.5, Tissue_stem_cells:adipose-derived_MSC_AM3: 0.5, Smooth_muscle_cells:vascular: 0.5, Fibroblasts:foreskin: 0.5, iPS_cells:skin_fibroblast: 0.49, Tissue_stem_cells:CD326-CD56+: 0.49, iPS_cells:foreskin_fibrobasts: 0.49 |
| SKNAS_TCATGGACAATGCTCA-1 | Smooth_muscle_cells | 0.16 | 269.41 | Raw ScoresSmooth_muscle_cells:umbilical_vein: 0.49, MSC: 0.48, Smooth_muscle_cells:vascular: 0.48, Smooth_muscle_cells:vascular:IL-17: 0.47, Fibroblasts:breast: 0.47, iPS_cells:foreskin_fibrobasts: 0.47, iPS_cells:skin_fibroblast: 0.47, Fibroblasts:foreskin: 0.47, iPS_cells:adipose_stem_cells: 0.47, iPS_cells:CRL2097_foreskin: 0.47 |
| SKNAS_GGGACTCGTGCGCTCA-1 | Smooth_muscle_cells | 0.15 | 261.85 | Raw ScoresMSC: 0.49, Smooth_muscle_cells:umbilical_vein: 0.49, Fibroblasts:foreskin: 0.48, iPS_cells:skin_fibroblast: 0.48, Smooth_muscle_cells:vascular: 0.48, iPS_cells:foreskin_fibrobasts: 0.48, Fibroblasts:breast: 0.48, Smooth_muscle_cells:vascular:IL-17: 0.47, iPS_cells:CRL2097_foreskin: 0.47, iPS_cells:adipose_stem_cells: 0.47 |
| SKNAS_GGGATGATCGCTGTCT-1 | MSC | 0.16 | 258.20 | Raw ScoresMSC: 0.5, Smooth_muscle_cells:umbilical_vein: 0.49, Smooth_muscle_cells:vascular: 0.48, Tissue_stem_cells:lipoma-derived_MSC: 0.48, Smooth_muscle_cells:vascular:IL-17: 0.48, Fibroblasts:foreskin: 0.48, iPS_cells:foreskin_fibrobasts: 0.47, iPS_cells:skin_fibroblast: 0.47, Tissue_stem_cells:adipose-derived_MSC_AM3: 0.47, Fibroblasts:breast: 0.47 |
| SKNAS_TTGCATTTCAACACCA-1 | Neurons | 0.13 | 257.87 | Raw ScoresSmooth_muscle_cells:umbilical_vein: 0.51, MSC: 0.51, Smooth_muscle_cells:vascular: 0.5, iPS_cells:foreskin_fibrobasts: 0.5, iPS_cells:skin_fibroblast: 0.5, Tissue_stem_cells:lipoma-derived_MSC: 0.5, Fibroblasts:foreskin: 0.49, Neurons:Schwann_cell: 0.49, Smooth_muscle_cells:vascular:IL-17: 0.49, Tissue_stem_cells:adipose-derived_MSC_AM3: 0.49 |
| SKNAS_AGCCACGCACTCATAG-1 | Smooth_muscle_cells | 0.17 | 257.47 | Raw ScoresSmooth_muscle_cells:umbilical_vein: 0.5, MSC: 0.5, Smooth_muscle_cells:vascular: 0.49, Smooth_muscle_cells:vascular:IL-17: 0.49, Fibroblasts:breast: 0.49, iPS_cells:foreskin_fibrobasts: 0.48, Fibroblasts:foreskin: 0.48, iPS_cells:adipose_stem_cells: 0.48, Tissue_stem_cells:lipoma-derived_MSC: 0.48, iPS_cells:skin_fibroblast: 0.48 |
| SKNAS_GGGTGAAAGATGGCGT-1 | MSC | 0.17 | 249.26 | Raw ScoresMSC: 0.53, Smooth_muscle_cells:umbilical_vein: 0.52, Neurons:adrenal_medulla_cell_line: 0.52, Tissue_stem_cells:lipoma-derived_MSC: 0.52, Smooth_muscle_cells:vascular: 0.52, Fibroblasts:foreskin: 0.52, Tissue_stem_cells:adipose-derived_MSC_AM3: 0.51, iPS_cells:foreskin_fibrobasts: 0.51, iPS_cells:skin_fibroblast: 0.51, Tissue_stem_cells:dental_pulp: 0.5 |
| SKNAS_CTACCTGGTACAATAG-1 | Smooth_muscle_cells | 0.16 | 238.15 | Raw ScoresSmooth_muscle_cells:umbilical_vein: 0.49, Smooth_muscle_cells:vascular: 0.49, MSC: 0.49, Smooth_muscle_cells:vascular:IL-17: 0.49, Fibroblasts:breast: 0.48, iPS_cells:skin_fibroblast: 0.48, iPS_cells:adipose_stem_cells: 0.48, iPS_cells:foreskin_fibrobasts: 0.48, Fibroblasts:foreskin: 0.48, Tissue_stem_cells:iliac_MSC: 0.48 |
| SKNAS_GTGAGTTCATATAGCC-1 | MSC | 0.17 | 234.85 | Raw ScoresMSC: 0.56, Smooth_muscle_cells:umbilical_vein: 0.54, Tissue_stem_cells:lipoma-derived_MSC: 0.54, Tissue_stem_cells:adipose-derived_MSC_AM3: 0.54, Neurons:adrenal_medulla_cell_line: 0.53, Fibroblasts:foreskin: 0.53, iPS_cells:skin_fibroblast: 0.52, Neurons:Schwann_cell: 0.52, Smooth_muscle_cells:vascular: 0.52, Tissue_stem_cells:CD326-CD56+: 0.52 |
| SKNAS_ATCAGGTCATGACCCG-1 | Smooth_muscle_cells | 0.15 | 233.72 | Raw ScoresSmooth_muscle_cells:umbilical_vein: 0.51, MSC: 0.51, Neurons:adrenal_medulla_cell_line: 0.5, Tissue_stem_cells:lipoma-derived_MSC: 0.49, Smooth_muscle_cells:vascular: 0.49, iPS_cells:skin_fibroblast: 0.49, iPS_cells:foreskin_fibrobasts: 0.49, Fibroblasts:foreskin: 0.49, Tissue_stem_cells:adipose-derived_MSC_AM3: 0.48, Smooth_muscle_cells:vascular:IL-17: 0.48 |
| SKNAS_TTGGGCGTCAGGACAG-1 | MSC | 0.19 | 232.13 | Raw ScoresMSC: 0.59, Tissue_stem_cells:lipoma-derived_MSC: 0.57, Smooth_muscle_cells:umbilical_vein: 0.57, Tissue_stem_cells:adipose-derived_MSC_AM3: 0.57, iPS_cells:skin_fibroblast: 0.56, Fibroblasts:foreskin: 0.56, Neurons:adrenal_medulla_cell_line: 0.56, Smooth_muscle_cells:vascular: 0.55, iPS_cells:foreskin_fibrobasts: 0.55, Tissue_stem_cells:dental_pulp: 0.54 |
| SKNAS_CTACCTGCATCCTATT-1 | Neurons | 0.16 | 230.32 | Raw ScoresMSC: 0.54, Neurons:adrenal_medulla_cell_line: 0.53, Smooth_muscle_cells:umbilical_vein: 0.53, Smooth_muscle_cells:vascular: 0.52, Tissue_stem_cells:lipoma-derived_MSC: 0.52, Fibroblasts:foreskin: 0.52, iPS_cells:skin_fibroblast: 0.52, iPS_cells:foreskin_fibrobasts: 0.52, Neurons:Schwann_cell: 0.52, Tissue_stem_cells:adipose-derived_MSC_AM3: 0.51 |
| SKNAS_TGGGATTCAACACACT-1 | MSC | 0.16 | 228.57 | Raw ScoresMSC: 0.52, Smooth_muscle_cells:umbilical_vein: 0.51, Tissue_stem_cells:lipoma-derived_MSC: 0.51, Fibroblasts:foreskin: 0.51, iPS_cells:skin_fibroblast: 0.51, Neurons:adrenal_medulla_cell_line: 0.51, iPS_cells:foreskin_fibrobasts: 0.5, Tissue_stem_cells:adipose-derived_MSC_AM3: 0.5, Smooth_muscle_cells:vascular: 0.5, Tissue_stem_cells:CD326-CD56+: 0.49 |
| SKNAS_ATCACGACAAATCAAG-1 | Neurons | 0.15 | 226.65 | Raw ScoresNeurons:adrenal_medulla_cell_line: 0.53, MSC: 0.52, Smooth_muscle_cells:umbilical_vein: 0.52, Tissue_stem_cells:lipoma-derived_MSC: 0.51, Smooth_muscle_cells:vascular: 0.51, Fibroblasts:foreskin: 0.51, Tissue_stem_cells:adipose-derived_MSC_AM3: 0.51, iPS_cells:skin_fibroblast: 0.5, iPS_cells:foreskin_fibrobasts: 0.5, Neurons:Schwann_cell: 0.5 |
| SKNAS_GTCATCCTCCCTCAAC-1 | Smooth_muscle_cells | 0.17 | 222.93 | Raw ScoresMSC: 0.5, Smooth_muscle_cells:umbilical_vein: 0.49, Smooth_muscle_cells:vascular: 0.49, iPS_cells:CRL2097_foreskin: 0.49, Tissue_stem_cells:lipoma-derived_MSC: 0.49, Smooth_muscle_cells:vascular:IL-17: 0.49, Neurons:adrenal_medulla_cell_line: 0.49, iPS_cells:skin_fibroblast: 0.48, iPS_cells:foreskin_fibrobasts: 0.48, Fibroblasts:breast: 0.48 |
| SKNAS_CGTAGTACAGAGCTAG-1 | Neurons | 0.15 | 220.94 | Raw ScoresNeurons:adrenal_medulla_cell_line: 0.53, MSC: 0.5, Smooth_muscle_cells:umbilical_vein: 0.49, Tissue_stem_cells:lipoma-derived_MSC: 0.49, Tissue_stem_cells:CD326-CD56+: 0.49, Tissue_stem_cells:adipose-derived_MSC_AM3: 0.49, Fibroblasts:foreskin: 0.48, Smooth_muscle_cells:vascular: 0.47, Endothelial_cells:HUVEC: 0.47, iPS_cells:skin_fibroblast: 0.47 |
| SKNAS_CGCATAATCGAGTGGA-1 | Neurons | 0.15 | 219.73 | Raw ScoresMSC: 0.51, Neurons:adrenal_medulla_cell_line: 0.51, Smooth_muscle_cells:umbilical_vein: 0.5, Tissue_stem_cells:lipoma-derived_MSC: 0.5, Smooth_muscle_cells:vascular: 0.5, Fibroblasts:foreskin: 0.49, iPS_cells:foreskin_fibrobasts: 0.49, Tissue_stem_cells:adipose-derived_MSC_AM3: 0.49, iPS_cells:skin_fibroblast: 0.49, Neurons:Schwann_cell: 0.49 |
| SKNAS_GGATCTAGTGAGTAGC-1 | MSC | 0.20 | 218.06 | Raw ScoresMSC: 0.57, Neurons:adrenal_medulla_cell_line: 0.57, Tissue_stem_cells:CD326-CD56+: 0.55, Tissue_stem_cells:lipoma-derived_MSC: 0.54, Smooth_muscle_cells:umbilical_vein: 0.54, Fibroblasts:foreskin: 0.54, iPS_cells:skin_fibroblast: 0.54, Neuroepithelial_cell:ESC-derived: 0.54, iPS_cells:foreskin_fibrobasts: 0.54, Tissue_stem_cells:adipose-derived_MSC_AM3: 0.54 |
| SKNAS_ACCGTTCAGTTACTCG-1 | Smooth_muscle_cells | 0.20 | 217.35 | Raw ScoresMSC: 0.53, Smooth_muscle_cells:umbilical_vein: 0.53, Smooth_muscle_cells:vascular: 0.52, Tissue_stem_cells:lipoma-derived_MSC: 0.52, Smooth_muscle_cells:vascular:IL-17: 0.51, iPS_cells:skin_fibroblast: 0.51, iPS_cells:foreskin_fibrobasts: 0.51, Fibroblasts:foreskin: 0.51, Tissue_stem_cells:adipose-derived_MSC_AM3: 0.51, iPS_cells:CRL2097_foreskin: 0.5 |
| SKNAS_TTAGGGTGTTAACCTG-1 | Neurons | 0.13 | 216.99 | Raw ScoresSmooth_muscle_cells:umbilical_vein: 0.53, MSC: 0.53, Neurons:adrenal_medulla_cell_line: 0.52, Tissue_stem_cells:lipoma-derived_MSC: 0.52, Tissue_stem_cells:adipose-derived_MSC_AM3: 0.51, Smooth_muscle_cells:vascular: 0.51, iPS_cells:foreskin_fibrobasts: 0.51, iPS_cells:skin_fibroblast: 0.51, Fibroblasts:foreskin: 0.51, Endothelial_cells:HUVEC: 0.5 |
| SKNAS_TTCACCGCAGGCCCTA-1 | Neurons | 0.13 | 215.86 | Raw ScoresNeurons:adrenal_medulla_cell_line: 0.53, MSC: 0.51, Smooth_muscle_cells:umbilical_vein: 0.51, Fibroblasts:foreskin: 0.5, Tissue_stem_cells:lipoma-derived_MSC: 0.5, Tissue_stem_cells:adipose-derived_MSC_AM3: 0.49, Smooth_muscle_cells:vascular: 0.49, iPS_cells:foreskin_fibrobasts: 0.49, iPS_cells:skin_fibroblast: 0.49, Tissue_stem_cells:CD326-CD56+: 0.49 |
| SKNAS_GCTACAAAGCTGAAGC-1 | Neurons | 0.15 | 215.32 | Raw ScoresSmooth_muscle_cells:umbilical_vein: 0.51, MSC: 0.51, Neurons:adrenal_medulla_cell_line: 0.51, Tissue_stem_cells:lipoma-derived_MSC: 0.49, Fibroblasts:foreskin: 0.49, iPS_cells:foreskin_fibrobasts: 0.49, Smooth_muscle_cells:vascular: 0.49, iPS_cells:skin_fibroblast: 0.49, Tissue_stem_cells:adipose-derived_MSC_AM3: 0.49, Tissue_stem_cells:dental_pulp: 0.48 |
| SKNAS_ATGACCAAGTTGTAAG-1 | Neurons | 0.12 | 214.96 | Raw ScoresNeurons:adrenal_medulla_cell_line: 0.46, MSC: 0.45, Smooth_muscle_cells:umbilical_vein: 0.45, Smooth_muscle_cells:vascular: 0.44, Fibroblasts:foreskin: 0.44, Tissue_stem_cells:dental_pulp: 0.44, iPS_cells:foreskin_fibrobasts: 0.44, Smooth_muscle_cells:vascular:IL-17: 0.44, Tissue_stem_cells:lipoma-derived_MSC: 0.44, Tissue_stem_cells:adipose-derived_MSC_AM3: 0.44 |
| SKNAS_ACAAAGACATCAGCGC-1 | Neurons | 0.16 | 214.53 | Raw ScoresNeurons:adrenal_medulla_cell_line: 0.52, MSC: 0.51, Smooth_muscle_cells:umbilical_vein: 0.51, Tissue_stem_cells:lipoma-derived_MSC: 0.5, iPS_cells:skin_fibroblast: 0.5, iPS_cells:foreskin_fibrobasts: 0.5, Tissue_stem_cells:adipose-derived_MSC_AM3: 0.49, Fibroblasts:foreskin: 0.49, Smooth_muscle_cells:vascular: 0.49, iPS_cells:CRL2097_foreskin: 0.49 |
| SKNAS_TGCAGTATCGAGAGCA-1 | Neurons | 0.14 | 212.29 | Raw ScoresNeurons:adrenal_medulla_cell_line: 0.53, MSC: 0.52, Smooth_muscle_cells:umbilical_vein: 0.5, Tissue_stem_cells:CD326-CD56+: 0.5, Smooth_muscle_cells:vascular: 0.49, Tissue_stem_cells:lipoma-derived_MSC: 0.49, Fibroblasts:foreskin: 0.49, iPS_cells:skin_fibroblast: 0.49, Tissue_stem_cells:adipose-derived_MSC_AM3: 0.49, Neurons:Schwann_cell: 0.49 |
| SKNAS_GATAGAACAGCTTCCT-1 | MSC | 0.20 | 211.86 | Raw ScoresMSC: 0.57, Tissue_stem_cells:lipoma-derived_MSC: 0.55, Smooth_muscle_cells:umbilical_vein: 0.54, Tissue_stem_cells:adipose-derived_MSC_AM3: 0.54, Neurons:adrenal_medulla_cell_line: 0.54, iPS_cells:skin_fibroblast: 0.53, Fibroblasts:foreskin: 0.53, Smooth_muscle_cells:vascular: 0.53, iPS_cells:foreskin_fibrobasts: 0.52, Neurons:Schwann_cell: 0.52 |
| SKNAS_ATTATCCTCTCTATGT-1 | Neurons | 0.15 | 211.01 | Raw ScoresNeurons:adrenal_medulla_cell_line: 0.53, MSC: 0.53, Tissue_stem_cells:lipoma-derived_MSC: 0.52, Tissue_stem_cells:adipose-derived_MSC_AM3: 0.51, Smooth_muscle_cells:umbilical_vein: 0.5, Fibroblasts:foreskin: 0.5, Smooth_muscle_cells:vascular: 0.5, iPS_cells:skin_fibroblast: 0.49, Endothelial_cells:HUVEC: 0.49, iPS_cells:foreskin_fibrobasts: 0.49 |
| SKNAS_ATCAGGTCAAATGAAC-1 | Neurons | 0.11 | 208.62 | Raw ScoresMSC: 0.53, Smooth_muscle_cells:umbilical_vein: 0.51, Tissue_stem_cells:lipoma-derived_MSC: 0.51, Tissue_stem_cells:adipose-derived_MSC_AM3: 0.51, Tissue_stem_cells:CD326-CD56+: 0.5, Fibroblasts:foreskin: 0.5, Neurons:Schwann_cell: 0.49, Endothelial_cells:HUVEC: 0.49, Smooth_muscle_cells:vascular: 0.49, iPS_cells:skin_fibroblast: 0.49 |
| SKNAS_GTCATCCTCCGCGGAT-1 | Neurons | 0.16 | 208.42 | Raw ScoresNeurons:adrenal_medulla_cell_line: 0.55, MSC: 0.54, Smooth_muscle_cells:umbilical_vein: 0.52, Tissue_stem_cells:lipoma-derived_MSC: 0.52, Tissue_stem_cells:CD326-CD56+: 0.52, Tissue_stem_cells:adipose-derived_MSC_AM3: 0.51, Fibroblasts:foreskin: 0.51, iPS_cells:skin_fibroblast: 0.5, Neuroepithelial_cell:ESC-derived: 0.5, Smooth_muscle_cells:vascular: 0.5 |
| SKNAS_TCTGGCTCAAAGCAAT-1 | MSC | 0.18 | 208.36 | Raw ScoresMSC: 0.53, Smooth_muscle_cells:umbilical_vein: 0.53, Tissue_stem_cells:lipoma-derived_MSC: 0.51, Smooth_muscle_cells:vascular: 0.51, Fibroblasts:foreskin: 0.51, Tissue_stem_cells:adipose-derived_MSC_AM3: 0.5, iPS_cells:skin_fibroblast: 0.5, iPS_cells:foreskin_fibrobasts: 0.5, Neurons:Schwann_cell: 0.5, Neurons:adrenal_medulla_cell_line: 0.49 |
| SKNAS_TGTTTGTCAGAGGCTA-1 | MSC | 0.13 | 207.73 | Raw ScoresMSC: 0.49, Tissue_stem_cells:lipoma-derived_MSC: 0.49, Tissue_stem_cells:adipose-derived_MSC_AM3: 0.48, Smooth_muscle_cells:umbilical_vein: 0.48, Neurons:adrenal_medulla_cell_line: 0.48, Fibroblasts:foreskin: 0.47, Smooth_muscle_cells:vascular: 0.47, iPS_cells:skin_fibroblast: 0.47, iPS_cells:foreskin_fibrobasts: 0.46, Neurons:Schwann_cell: 0.46 |
| SKNAS_GTGGTTATCCTTCGAC-1 | Smooth_muscle_cells | 0.14 | 206.84 | Raw ScoresNeurons:adrenal_medulla_cell_line: 0.48, Smooth_muscle_cells:umbilical_vein: 0.47, Smooth_muscle_cells:vascular: 0.47, MSC: 0.46, Smooth_muscle_cells:vascular:IL-17: 0.46, Fibroblasts:foreskin: 0.45, Fibroblasts:breast: 0.45, iPS_cells:foreskin_fibrobasts: 0.45, Tissue_stem_cells:lipoma-derived_MSC: 0.45, Smooth_muscle_cells:bronchial:vit_D: 0.45 |
| SKNAS_ACCTACCGTCAGGTGA-1 | MSC | 0.19 | 206.39 | Raw ScoresMSC: 0.55, Tissue_stem_cells:lipoma-derived_MSC: 0.53, Smooth_muscle_cells:umbilical_vein: 0.53, Tissue_stem_cells:adipose-derived_MSC_AM3: 0.53, Smooth_muscle_cells:vascular: 0.52, Fibroblasts:foreskin: 0.52, Neurons:adrenal_medulla_cell_line: 0.52, iPS_cells:skin_fibroblast: 0.52, iPS_cells:foreskin_fibrobasts: 0.52, iPS_cells:CRL2097_foreskin: 0.51 |
| SKNAS_CACCAAATCGCCATAA-1 | MSC | 0.17 | 203.85 | Raw ScoresMSC: 0.56, Tissue_stem_cells:lipoma-derived_MSC: 0.55, Smooth_muscle_cells:umbilical_vein: 0.54, Tissue_stem_cells:adipose-derived_MSC_AM3: 0.54, Smooth_muscle_cells:vascular: 0.54, Neurons:adrenal_medulla_cell_line: 0.54, Fibroblasts:foreskin: 0.54, iPS_cells:skin_fibroblast: 0.53, iPS_cells:foreskin_fibrobasts: 0.53, iPS_cells:CRL2097_foreskin: 0.52 |
| SKNAS_CGTAAGTAGGCCTTGC-1 | MSC | 0.18 | 203.04 | Raw ScoresMSC: 0.52, Smooth_muscle_cells:umbilical_vein: 0.51, iPS_cells:skin_fibroblast: 0.5, Tissue_stem_cells:lipoma-derived_MSC: 0.5, iPS_cells:foreskin_fibrobasts: 0.5, Fibroblasts:foreskin: 0.5, Smooth_muscle_cells:vascular: 0.5, iPS_cells:CRL2097_foreskin: 0.49, Tissue_stem_cells:adipose-derived_MSC_AM3: 0.49, Smooth_muscle_cells:vascular:IL-17: 0.49 |
| BE2C_GGGCCATGTCGCGGTT-1 | Neurons | 0.19 | 202.20 | Raw ScoresNeurons:adrenal_medulla_cell_line: 0.53, Endothelial_cells:HUVEC: 0.49, Endothelial_cells:HUVEC:B._anthracis_LT: 0.48, Endothelial_cells:HUVEC:IL-1b: 0.48, Endothelial_cells:HUVEC:VEGF: 0.48, Endothelial_cells:HUVEC:FPV-infected: 0.48, Endothelial_cells:HUVEC:H5N1-infected: 0.47, Endothelial_cells:HUVEC:Serum_Amyloid_A: 0.47, MSC: 0.47, Endothelial_cells:lymphatic: 0.47 |
| SKNAS_CTAACTTTCACCTCGT-1 | MSC | 0.15 | 200.43 | Raw ScoresNeurons:adrenal_medulla_cell_line: 0.55, MSC: 0.54, Tissue_stem_cells:lipoma-derived_MSC: 0.53, Tissue_stem_cells:adipose-derived_MSC_AM3: 0.53, Smooth_muscle_cells:umbilical_vein: 0.52, Fibroblasts:foreskin: 0.52, Smooth_muscle_cells:vascular: 0.51, iPS_cells:skin_fibroblast: 0.51, Endothelial_cells:HUVEC: 0.51, iPS_cells:foreskin_fibrobasts: 0.51 |
| SKNAS_ACTTCGCCAGAATTCC-1 | Smooth_muscle_cells | 0.16 | 198.20 | Raw ScoresMSC: 0.52, Smooth_muscle_cells:umbilical_vein: 0.52, Tissue_stem_cells:lipoma-derived_MSC: 0.51, Smooth_muscle_cells:vascular: 0.51, Neurons:adrenal_medulla_cell_line: 0.51, Fibroblasts:foreskin: 0.5, iPS_cells:skin_fibroblast: 0.5, Tissue_stem_cells:adipose-derived_MSC_AM3: 0.5, iPS_cells:foreskin_fibrobasts: 0.5, Smooth_muscle_cells:vascular:IL-17: 0.5 |
| SKNAS_CACTGTCGTTGTTTGG-1 | Neurons | 0.19 | 196.58 | Raw ScoresNeurons:adrenal_medulla_cell_line: 0.53, MSC: 0.5, Smooth_muscle_cells:umbilical_vein: 0.49, Smooth_muscle_cells:vascular: 0.48, Tissue_stem_cells:lipoma-derived_MSC: 0.48, Fibroblasts:breast: 0.48, Tissue_stem_cells:CD326-CD56+: 0.48, Fibroblasts:foreskin: 0.48, iPS_cells:foreskin_fibrobasts: 0.48, iPS_cells:skin_fibroblast: 0.48 |
| SKNAS_GAAACCTGTGTCATTG-1 | Neurons | 0.15 | 195.63 | Raw ScoresMSC: 0.5, Neurons:adrenal_medulla_cell_line: 0.49, Tissue_stem_cells:lipoma-derived_MSC: 0.48, Smooth_muscle_cells:umbilical_vein: 0.48, iPS_cells:skin_fibroblast: 0.47, Tissue_stem_cells:CD326-CD56+: 0.47, iPS_cells:foreskin_fibrobasts: 0.47, Fibroblasts:foreskin: 0.47, Tissue_stem_cells:adipose-derived_MSC_AM3: 0.47, iPS_cells:CRL2097_foreskin: 0.46 |
| SKNAS_AGGAATAAGGGTAATT-1 | Smooth_muscle_cells | 0.14 | 194.06 | Raw ScoresMSC: 0.43, Smooth_muscle_cells:umbilical_vein: 0.43, Smooth_muscle_cells:vascular:IL-17: 0.43, Smooth_muscle_cells:vascular: 0.43, iPS_cells:foreskin_fibrobasts: 0.43, Fibroblasts:foreskin: 0.43, Fibroblasts:breast: 0.42, iPS_cells:adipose_stem_cells: 0.42, iPS_cells:skin_fibroblast: 0.42, iPS_cells:CRL2097_foreskin: 0.42 |
Below shows the significant enrichments of this GEP for literature curated gene lists
This data was procured from existing single cell RNA-seq maps of neuroblastoma or related relevant data.
High ranks indicate this gene is a driver of this GEP.
These curated gene list are ranked by the P-value (on this GEP) of their constituent genes.
The Mean Count column shows the mean read count in cells scoring highly (H > 50) on this gene expression program.
Mesenchymal Fig 1D (Olsen)
Selected mesenchymal marker genes shown in Fig. 1D of Olsen et al. https://www.biorxiv.org/content/10.1101/2020.05.04.077057v1 - these are highly expressed in their mesenchymal cluster on their UMAP.:
Wilcoxon ranksum test P-value for gene set overrepresentation: 1.37e-05
Mean rank of genes in gene set: 2063.31
Rank on gene expression program of genes in gene set:
| Genes | Weight | Rank | GTEx | DepMap | Decartes | Mean.Counts | Mean.TPM |
|---|---|---|---|---|---|---|---|
| LUM | 0.0154739 | 17 | GTEx | DepMap | Descartes | 13.33 | 277.64 |
| COL6A2 | 0.0133682 | 33 | GTEx | DepMap | Descartes | 5.67 | 89.04 |
| DCN | 0.0117293 | 57 | GTEx | DepMap | Descartes | 4.66 | 37.46 |
| SPARC | 0.0111328 | 65 | GTEx | DepMap | Descartes | 10.09 | 147.85 |
| MGP | 0.0108435 | 69 | GTEx | DepMap | Descartes | 21.42 | 689.31 |
| BGN | 0.0080307 | 170 | GTEx | DepMap | Descartes | 3.43 | 77.82 |
| COL3A1 | 0.0071373 | 223 | GTEx | DepMap | Descartes | 9.42 | 91.63 |
| PDGFRA | 0.0027722 | 950 | GTEx | DepMap | Descartes | 1.63 | 14.22 |
| PRRX1 | 0.0022088 | 1202 | GTEx | DepMap | Descartes | 1.59 | 22.17 |
| COL1A1 | 0.0021199 | 1251 | GTEx | DepMap | Descartes | 9.37 | 81.51 |
| LEPR | 0.0008598 | 2278 | GTEx | DepMap | Descartes | 0.24 | 1.62 |
| CALD1 | -0.0006560 | 8295 | GTEx | DepMap | Descartes | 10.19 | 103.34 |
| COL1A2 | -0.0026084 | 12213 | GTEx | DepMap | Descartes | 0.00 | 0.01 |
Inflammatory CAF
These marker genes were curated across cancer subtypes in multiple organ systems as reviewed in Lavie et. al. (PMID 35883004) and contain inflammatory specific CAF genes:
Wilcoxon ranksum test P-value for gene set overrepresentation: 7.13e-04
Mean rank of genes in gene set: 3966.4
Rank on gene expression program of genes in gene set:
| Genes | Weight | Rank | GTEx | DepMap | Decartes | Mean.Counts | Mean.TPM |
|---|---|---|---|---|---|---|---|
| HGF | 0.0162934 | 13 | GTEx | DepMap | Descartes | 17.90 | 168.94 |
| CCL2 | 0.0117816 | 56 | GTEx | DepMap | Descartes | 8.80 | 519.45 |
| C7 | 0.0066044 | 263 | GTEx | DepMap | Descartes | 8.82 | 90.80 |
| IL1R1 | 0.0059854 | 324 | GTEx | DepMap | Descartes | 0.59 | 6.68 |
| IGFBP6 | 0.0045407 | 505 | GTEx | DepMap | Descartes | 2.33 | 98.67 |
| PDGFRA | 0.0027722 | 950 | GTEx | DepMap | Descartes | 1.63 | 14.22 |
| CXCL2 | 0.0022512 | 1180 | GTEx | DepMap | Descartes | 0.07 | 4.11 |
| C3 | 0.0018970 | 1354 | GTEx | DepMap | Descartes | 0.03 | 0.37 |
| CFB | 0.0015108 | 1633 | GTEx | DepMap | Descartes | 0.04 | 1.04 |
| LIF | 0.0014576 | 1670 | GTEx | DepMap | Descartes | 0.11 | 1.54 |
| IL33 | 0.0006612 | 2587 | GTEx | DepMap | Descartes | 0.04 | 0.83 |
| CXCL14 | 0.0006160 | 2651 | GTEx | DepMap | Descartes | 0.06 | 1.16 |
| SOD2 | 0.0003913 | 3103 | GTEx | DepMap | Descartes | 1.20 | 4.41 |
| IGF1 | 0.0000215 | 4248 | GTEx | DepMap | Descartes | 0.01 | 0.06 |
| IL10 | -0.0000584 | 4624 | GTEx | DepMap | Descartes | 0.00 | 0.00 |
| CXCL12 | -0.0000995 | 4941 | GTEx | DepMap | Descartes | 0.41 | 6.55 |
| PDPN | -0.0001056 | 4987 | GTEx | DepMap | Descartes | 0.00 | 0.00 |
| SCARA5 | -0.0001672 | 5520 | GTEx | DepMap | Descartes | 0.00 | 0.00 |
| PDGFD | -0.0002418 | 6077 | GTEx | DepMap | Descartes | 0.07 | 0.90 |
| GPX3 | -0.0002878 | 6380 | GTEx | DepMap | Descartes | 0.11 | 2.93 |
| CFD | -0.0003116 | 6524 | GTEx | DepMap | Descartes | 0.02 | 0.53 |
| RGMA | -0.0006769 | 8402 | GTEx | DepMap | Descartes | 0.01 | 0.02 |
| SERPING1 | -0.0010342 | 9830 | GTEx | DepMap | Descartes | 0.05 | 1.20 |
| PDGFRB | -0.0012329 | 10441 | GTEx | DepMap | Descartes | 0.39 | 3.53 |
| SCARA3 | -0.0014120 | 10897 | GTEx | DepMap | Descartes | 0.11 | 1.37 |
Bridge region mesenchymal-SCP transition (Olsen)
As above but for cells in the mesenchymal transitioning to SCP region:
Wilcoxon ranksum test P-value for gene set overrepresentation: 1.53e-03
Mean rank of genes in gene set: 82.33
Rank on gene expression program of genes in gene set:
| Genes | Weight | Rank | GTEx | DepMap | Decartes | Mean.Counts | Mean.TPM |
|---|---|---|---|---|---|---|---|
| IFITM3 | 0.0204881 | 1 | GTEx | DepMap | Descartes | 7.66 | 560.37 |
| B2M | 0.0108168 | 70 | GTEx | DepMap | Descartes | 44.73 | 970.70 |
| S100A10 | 0.0079129 | 176 | GTEx | DepMap | Descartes | 34.84 | 2518.79 |
Below shows ranks on this GEP for literature curated gene lists for large gene sets
These include those reported as mesenchymal/adrenergic by Van Groningen et al.
High ranks indicate this gene is a driver of this GEP (note these results are not ordered).
The Mean Count column shows the mean read count in cells scoring highly (H > 50) on this gene expression program.
VanGroningen Adrenergic Genes
Adrenergic marker genes from Supplementary Table 2 of Van Groningen et al. Nature Genetics 2017. These genes were identified by differential expression analysis of mesenchymal-like and adrenergic-like neuroblastoma cell lines.
Wilcoxon ranksum test P-value for gene set overrepresentation: 1.00e+00
Mean rank of genes in gene set: 9999.3
Median rank of genes in gene set: 11190
Rank on gene expression program of top 30 genes in gene set:
| Genes | Weight | Rank | GTEx | DepMap | Descartes | Mean.Counts | Mean.TPM |
|---|---|---|---|---|---|---|---|
| CYGB | 0.0162670 | 14 | GTEx | DepMap | Descartes | 9.77 | 259.09 |
| RGS5 | 0.0085898 | 143 | GTEx | DepMap | Descartes | 77.85 | 736.81 |
| PKIA | 0.0072684 | 211 | GTEx | DepMap | Descartes | 5.72 | 78.36 |
| NSG1 | 0.0063219 | 291 | GTEx | DepMap | Descartes | 6.06 | NA |
| CDKN2C | 0.0051262 | 419 | GTEx | DepMap | Descartes | 4.81 | 86.52 |
| INO80C | 0.0032679 | 790 | GTEx | DepMap | Descartes | 1.73 | 29.35 |
| NPY | 0.0028863 | 900 | GTEx | DepMap | Descartes | 32.60 | 2317.76 |
| AHSA1 | 0.0027526 | 961 | GTEx | DepMap | Descartes | 5.93 | 235.31 |
| FBXO8 | 0.0022689 | 1175 | GTEx | DepMap | Descartes | 3.61 | 96.11 |
| GGCT | 0.0015036 | 1638 | GTEx | DepMap | Descartes | 7.09 | 294.14 |
| LEPROTL1 | 0.0012155 | 1873 | GTEx | DepMap | Descartes | 3.58 | 55.40 |
| TUBB4B | 0.0011105 | 1986 | GTEx | DepMap | Descartes | 16.55 | 412.85 |
| SYT4 | 0.0009434 | 2182 | GTEx | DepMap | Descartes | 3.15 | 40.57 |
| ATP6V0E2 | 0.0008081 | 2356 | GTEx | DepMap | Descartes | 2.05 | 24.23 |
| PRSS12 | 0.0007753 | 2404 | GTEx | DepMap | Descartes | 3.90 | 43.96 |
| FAM167A | 0.0007719 | 2407 | GTEx | DepMap | Descartes | 0.60 | 8.27 |
| TMTC4 | 0.0007451 | 2447 | GTEx | DepMap | Descartes | 0.75 | 11.68 |
| TBC1D30 | 0.0005214 | 2811 | GTEx | DepMap | Descartes | 0.16 | 1.10 |
| CCDC167 | 0.0005012 | 2856 | GTEx | DepMap | Descartes | 4.58 | 387.48 |
| HMGA1 | 0.0004224 | 3033 | GTEx | DepMap | Descartes | 10.45 | 230.76 |
| BMPR1B | 0.0003288 | 3259 | GTEx | DepMap | Descartes | 0.53 | 5.56 |
| SEC11C | 0.0003098 | 3305 | GTEx | DepMap | Descartes | 3.59 | 85.03 |
| RGS17 | 0.0002526 | 3455 | GTEx | DepMap | Descartes | 0.55 | 3.61 |
| NFIL3 | 0.0002319 | 3517 | GTEx | DepMap | Descartes | 0.38 | 9.77 |
| TSPAN13 | 0.0002173 | 3559 | GTEx | DepMap | Descartes | 0.82 | 23.04 |
| ST3GAL6 | 0.0001846 | 3664 | GTEx | DepMap | Descartes | 1.22 | 19.12 |
| TBPL1 | 0.0001478 | 3775 | GTEx | DepMap | Descartes | 1.53 | 17.56 |
| LSM4 | 0.0001444 | 3789 | GTEx | DepMap | Descartes | 13.94 | 387.31 |
| SETD7 | 0.0001344 | 3819 | GTEx | DepMap | Descartes | 0.68 | 4.80 |
| RET | 0.0001287 | 3840 | GTEx | DepMap | Descartes | 1.97 | 19.35 |
VanGroningen Mesenchymal Genes
Mesenchymal marker genes from Supplementary Table 2 of Van Groningen et al. Nature Genetics 2017. These genes were identified by differential expression analysis of mesenchymal-like and adrenergic-like neuroblastoma cell lines.
Wilcoxon ranksum test P-value for gene set overrepresentation: 2.05e-28
Mean rank of genes in gene set: 4398.85
Median rank of genes in gene set: 2821
Rank on gene expression program of top 30 genes in gene set:
| Genes | Weight | Rank | GTEx | DepMap | Descartes | Mean.Counts | Mean.TPM |
|---|---|---|---|---|---|---|---|
| IFITM3 | 0.0204881 | 1 | GTEx | DepMap | Descartes | 7.66 | 560.37 |
| SPRY1 | 0.0183860 | 5 | GTEx | DepMap | Descartes | 7.85 | 164.08 |
| CFI | 0.0148760 | 19 | GTEx | DepMap | Descartes | 2.15 | 53.82 |
| ID3 | 0.0147730 | 21 | GTEx | DepMap | Descartes | 35.14 | 1904.52 |
| TIMP1 | 0.0146998 | 22 | GTEx | DepMap | Descartes | 22.86 | 1063.43 |
| CRABP2 | 0.0143381 | 24 | GTEx | DepMap | Descartes | 15.45 | 825.78 |
| PPIC | 0.0142090 | 25 | GTEx | DepMap | Descartes | 3.96 | 150.71 |
| ID1 | 0.0138930 | 26 | GTEx | DepMap | Descartes | 28.65 | 1238.69 |
| COL6A2 | 0.0133682 | 33 | GTEx | DepMap | Descartes | 5.67 | 89.04 |
| APOE | 0.0124783 | 40 | GTEx | DepMap | Descartes | 11.85 | 580.18 |
| GAS1 | 0.0124027 | 42 | GTEx | DepMap | Descartes | 2.87 | 50.74 |
| ARPC1B | 0.0122888 | 46 | GTEx | DepMap | Descartes | 13.27 | 386.45 |
| QSOX1 | 0.0121332 | 50 | GTEx | DepMap | Descartes | 6.05 | 32.17 |
| SQSTM1 | 0.0119391 | 52 | GTEx | DepMap | Descartes | 11.22 | 197.93 |
| OSTC | 0.0118713 | 55 | GTEx | DepMap | Descartes | 17.53 | 870.48 |
| RAB13 | 0.0112335 | 64 | GTEx | DepMap | Descartes | 14.66 | 370.04 |
| SPARC | 0.0111328 | 65 | GTEx | DepMap | Descartes | 10.09 | 147.85 |
| MYL12A | 0.0110297 | 66 | GTEx | DepMap | Descartes | 17.38 | 747.53 |
| CD63 | 0.0108499 | 68 | GTEx | DepMap | Descartes | 41.88 | 1809.15 |
| MGP | 0.0108435 | 69 | GTEx | DepMap | Descartes | 21.42 | 689.31 |
| B2M | 0.0108168 | 70 | GTEx | DepMap | Descartes | 44.73 | 970.70 |
| SRPX | 0.0104297 | 78 | GTEx | DepMap | Descartes | 1.77 | 49.36 |
| NQO1 | 0.0102715 | 86 | GTEx | DepMap | Descartes | 8.56 | 174.90 |
| POLR2L | 0.0100895 | 90 | GTEx | DepMap | Descartes | 22.49 | 1298.52 |
| PRDX6 | 0.0096348 | 106 | GTEx | DepMap | Descartes | 27.86 | 848.81 |
| EFEMP2 | 0.0095739 | 108 | GTEx | DepMap | Descartes | 2.99 | 69.71 |
| MYL12B | 0.0095206 | 112 | GTEx | DepMap | Descartes | 17.98 | 755.71 |
| TNFRSF1A | 0.0092874 | 122 | GTEx | DepMap | Descartes | 2.42 | 59.10 |
| RHOC | 0.0091516 | 127 | GTEx | DepMap | Descartes | 6.97 | 153.08 |
| MEST | 0.0090613 | 130 | GTEx | DepMap | Descartes | 4.56 | 78.95 |
Descartes adrenocortical markers
Top 50 marker genes of adrenocortical cells in the Decartes fetal adrenal single cell map (https://atlas.brotmanbaty.org/bbi/human-gene-expression-during-development/cell/adrenocortical/in/adrenal)
Wilcoxon ranksum test P-value for gene set overrepresentation: 8.72e-01
Mean rank of genes in gene set: 6959.69
Median rank of genes in gene set: 6966.5
Rank on gene expression program of top 30 genes in gene set:
| Genes | Weight | Rank | GTEx | DepMap | Descartes | Mean.Counts | Mean.TPM |
|---|---|---|---|---|---|---|---|
| BAIAP2L1 | 0.0028152 | 928 | GTEx | DepMap | Descartes | 0.20 | 2.73 |
| FDPS | 0.0016024 | 1556 | GTEx | DepMap | Descartes | 10.86 | 284.97 |
| SH3BP5 | 0.0008317 | 2323 | GTEx | DepMap | Descartes | 1.18 | 19.11 |
| PDE10A | 0.0007931 | 2375 | GTEx | DepMap | Descartes | 0.44 | 2.84 |
| DHCR7 | 0.0004785 | 2908 | GTEx | DepMap | Descartes | 0.83 | 16.26 |
| MSMO1 | 0.0004036 | 3079 | GTEx | DepMap | Descartes | 1.78 | 45.74 |
| TM7SF2 | 0.0003547 | 3187 | GTEx | DepMap | Descartes | 1.16 | 27.64 |
| FDX1 | 0.0003538 | 3190 | GTEx | DepMap | Descartes | 1.51 | 22.84 |
| APOC1 | 0.0002708 | 3409 | GTEx | DepMap | Descartes | 0.33 | 25.28 |
| POR | 0.0000102 | 4300 | GTEx | DepMap | Descartes | 0.81 | 17.06 |
| INHA | -0.0000130 | 4386 | GTEx | DepMap | Descartes | 0.01 | 0.45 |
| GSTA4 | -0.0000151 | 4397 | GTEx | DepMap | Descartes | 1.27 | 40.19 |
| ERN1 | -0.0001373 | 5262 | GTEx | DepMap | Descartes | 0.16 | 1.01 |
| DNER | -0.0001869 | 5687 | GTEx | DepMap | Descartes | 0.02 | 0.35 |
| CYB5B | -0.0002603 | 6206 | GTEx | DepMap | Descartes | 2.22 | 26.21 |
| NPC1 | -0.0002925 | 6411 | GTEx | DepMap | Descartes | 0.13 | 1.43 |
| SGCZ | -0.0003500 | 6757 | GTEx | DepMap | Descartes | 0.00 | 0.00 |
| FRMD5 | -0.0003780 | 6914 | GTEx | DepMap | Descartes | 0.14 | 1.44 |
| STAR | -0.0003967 | 7019 | GTEx | DepMap | Descartes | 0.00 | 0.03 |
| FREM2 | -0.0004082 | 7087 | GTEx | DepMap | Descartes | 0.00 | 0.00 |
| LDLR | -0.0005468 | 7802 | GTEx | DepMap | Descartes | 0.82 | 8.02 |
| FDXR | -0.0006855 | 8438 | GTEx | DepMap | Descartes | 0.54 | 11.22 |
| SCAP | -0.0007650 | 8810 | GTEx | DepMap | Descartes | 0.31 | 3.58 |
| GRAMD1B | -0.0008061 | 8997 | GTEx | DepMap | Descartes | 0.06 | 0.37 |
| SLC16A9 | -0.0008196 | 9054 | GTEx | DepMap | Descartes | 0.10 | 1.34 |
| SCARB1 | -0.0009203 | 9435 | GTEx | DepMap | Descartes | 0.47 | 4.17 |
| SH3PXD2B | -0.0010200 | 9786 | GTEx | DepMap | Descartes | 0.24 | 1.68 |
| IGF1R | -0.0010363 | 9841 | GTEx | DepMap | Descartes | 0.92 | 3.90 |
| SLC1A2 | -0.0010840 | 9989 | GTEx | DepMap | Descartes | 0.01 | 0.01 |
| PEG3 | -0.0013254 | 10698 | GTEx | DepMap | Descartes | 0.01 | NA |
Descartes chromaffin markers
Top 50 marker genes of chromaffin cells in the Decartes fetal adrenal single cell map (https://atlas.brotmanbaty.org/bbi/human-gene-expression-during-development/cell/chromaffin/in/adrenal)
Wilcoxon ranksum test P-value for gene set overrepresentation: 1.00e+00
Mean rank of genes in gene set: 9299.51
Median rank of genes in gene set: 10751
Rank on gene expression program of top 30 genes in gene set:
| Genes | Weight | Rank | GTEx | DepMap | Descartes | Mean.Counts | Mean.TPM |
|---|---|---|---|---|---|---|---|
| NPY | 0.0028863 | 900 | GTEx | DepMap | Descartes | 32.60 | 2317.76 |
| MAB21L2 | 0.0017642 | 1455 | GTEx | DepMap | Descartes | 3.39 | 72.15 |
| MLLT11 | 0.0007262 | 2488 | GTEx | DepMap | Descartes | 11.10 | 226.94 |
| GREM1 | 0.0006868 | 2551 | GTEx | DepMap | Descartes | 0.48 | 1.55 |
| NTRK1 | 0.0001078 | 3924 | GTEx | DepMap | Descartes | 0.46 | 8.59 |
| IL7 | 0.0000958 | 3961 | GTEx | DepMap | Descartes | 0.23 | 6.08 |
| SYNPO2 | 0.0000934 | 3968 | GTEx | DepMap | Descartes | 4.64 | 16.16 |
| TMEM132C | -0.0003061 | 6497 | GTEx | DepMap | Descartes | 0.00 | 0.00 |
| ANKFN1 | -0.0003170 | 6560 | GTEx | DepMap | Descartes | 0.00 | 0.00 |
| EPHA6 | -0.0005087 | 7617 | GTEx | DepMap | Descartes | 0.01 | 0.09 |
| TUBB2A | -0.0005289 | 7715 | GTEx | DepMap | Descartes | 2.30 | 68.79 |
| PTCHD1 | -0.0006759 | 8398 | GTEx | DepMap | Descartes | 0.01 | 0.04 |
| REEP1 | -0.0007926 | 8951 | GTEx | DepMap | Descartes | 0.01 | 0.13 |
| RYR2 | -0.0008717 | 9247 | GTEx | DepMap | Descartes | 0.10 | 0.34 |
| EYA1 | -0.0008772 | 9270 | GTEx | DepMap | Descartes | 0.35 | 4.22 |
| TMEFF2 | -0.0009252 | 9449 | GTEx | DepMap | Descartes | 0.02 | 0.17 |
| SLC44A5 | -0.0009645 | 9595 | GTEx | DepMap | Descartes | 0.03 | 0.35 |
| KCNB2 | -0.0010467 | 9873 | GTEx | DepMap | Descartes | 0.00 | 0.00 |
| HS3ST5 | -0.0011024 | 10046 | GTEx | DepMap | Descartes | 0.02 | 0.29 |
| RBFOX1 | -0.0012188 | 10404 | GTEx | DepMap | Descartes | 0.01 | 0.03 |
| EYA4 | -0.0013503 | 10751 | GTEx | DepMap | Descartes | 0.06 | 0.45 |
| FAT3 | -0.0013733 | 10816 | GTEx | DepMap | Descartes | 0.01 | 0.01 |
| ALK | -0.0013869 | 10847 | GTEx | DepMap | Descartes | 0.00 | 0.01 |
| CNKSR2 | -0.0014286 | 10934 | GTEx | DepMap | Descartes | 0.11 | 0.69 |
| PLXNA4 | -0.0014824 | 11056 | GTEx | DepMap | Descartes | 0.12 | 0.36 |
| RGMB | -0.0015548 | 11196 | GTEx | DepMap | Descartes | 0.29 | 3.01 |
| CNTFR | -0.0015980 | 11276 | GTEx | DepMap | Descartes | 0.47 | 11.04 |
| RPH3A | -0.0017293 | 11473 | GTEx | DepMap | Descartes | 0.03 | 0.27 |
| MAB21L1 | -0.0019111 | 11695 | GTEx | DepMap | Descartes | 3.17 | 60.36 |
| MARCH11 | -0.0019538 | 11746 | GTEx | DepMap | Descartes | 0.56 | NA |
Descartes Vascular_endothelial markers
Top 50 marker genes of Vascular_endothelial cells in the Decartes fetal adrenal single cell map (https://atlas.brotmanbaty.org/bbi/human-gene-expression-during-development/cell/vascular_endothelial/in/adrenal)
Wilcoxon ranksum test P-value for gene set overrepresentation: 1.41e-01
Mean rank of genes in gene set: 5643.16
Median rank of genes in gene set: 5447
Rank on gene expression program of top 30 genes in gene set:
| Genes | Weight | Rank | GTEx | DepMap | Descartes | Mean.Counts | Mean.TPM |
|---|---|---|---|---|---|---|---|
| ID1 | 0.0138930 | 26 | GTEx | DepMap | Descartes | 28.65 | 1238.69 |
| NPR1 | 0.0100816 | 91 | GTEx | DepMap | Descartes | 0.97 | 12.50 |
| PLVAP | 0.0027660 | 954 | GTEx | DepMap | Descartes | 0.02 | 0.50 |
| KDR | 0.0026646 | 999 | GTEx | DepMap | Descartes | 0.02 | 0.23 |
| PODXL | 0.0025867 | 1023 | GTEx | DepMap | Descartes | 0.68 | 5.31 |
| CRHBP | 0.0011616 | 1930 | GTEx | DepMap | Descartes | 0.00 | 0.20 |
| F8 | 0.0002472 | 3475 | GTEx | DepMap | Descartes | 0.04 | 0.22 |
| HYAL2 | 0.0002470 | 3477 | GTEx | DepMap | Descartes | 1.59 | 20.18 |
| GALNT15 | 0.0002161 | 3562 | GTEx | DepMap | Descartes | 0.01 | NA |
| RASIP1 | 0.0001092 | 3915 | GTEx | DepMap | Descartes | 0.02 | 0.38 |
| CALCRL | 0.0000787 | 4024 | GTEx | DepMap | Descartes | 0.04 | 0.31 |
| BTNL9 | 0.0000116 | 4294 | GTEx | DepMap | Descartes | 0.00 | 0.03 |
| ARHGAP29 | 0.0000054 | 4316 | GTEx | DepMap | Descartes | 1.59 | 9.57 |
| KANK3 | -0.0000877 | 4856 | GTEx | DepMap | Descartes | 0.00 | 0.02 |
| SHE | -0.0000911 | 4880 | GTEx | DepMap | Descartes | 0.00 | 0.00 |
| TEK | -0.0000954 | 4914 | GTEx | DepMap | Descartes | 0.00 | 0.01 |
| MMRN2 | -0.0001146 | 5064 | GTEx | DepMap | Descartes | 0.00 | 0.05 |
| CEACAM1 | -0.0001416 | 5304 | GTEx | DepMap | Descartes | 0.00 | 0.06 |
| TIE1 | -0.0001547 | 5416 | GTEx | DepMap | Descartes | 0.00 | 0.00 |
| CYP26B1 | -0.0001628 | 5478 | GTEx | DepMap | Descartes | 0.00 | 0.00 |
| SLCO2A1 | -0.0001722 | 5554 | GTEx | DepMap | Descartes | 0.00 | 0.03 |
| ROBO4 | -0.0001923 | 5721 | GTEx | DepMap | Descartes | 0.00 | 0.01 |
| NR5A2 | -0.0002141 | 5899 | GTEx | DepMap | Descartes | 0.00 | 0.00 |
| CDH13 | -0.0002308 | 6014 | GTEx | DepMap | Descartes | 0.04 | 0.26 |
| FLT4 | -0.0003559 | 6790 | GTEx | DepMap | Descartes | 0.00 | 0.01 |
| CLDN5 | -0.0004279 | 7179 | GTEx | DepMap | Descartes | 0.00 | 0.00 |
| SHANK3 | -0.0004359 | 7206 | GTEx | DepMap | Descartes | 0.03 | 0.17 |
| ESM1 | -0.0005140 | 7641 | GTEx | DepMap | Descartes | 0.00 | 0.00 |
| CDH5 | -0.0005504 | 7819 | GTEx | DepMap | Descartes | 0.00 | 0.00 |
| EHD3 | -0.0005667 | 7901 | GTEx | DepMap | Descartes | 0.14 | 1.45 |
Descartes stromal markers
Top 50 marker genes of stromal cells in the Decartes fetal adrenal single cell map (https://atlas.brotmanbaty.org/bbi/human-gene-expression-during-development/cell/stromal/in/adrenal)
Wilcoxon ranksum test P-value for gene set overrepresentation: 2.05e-05
Mean rank of genes in gene set: 4039.05
Median rank of genes in gene set: 2721.5
Rank on gene expression program of top 30 genes in gene set:
| Genes | Weight | Rank | GTEx | DepMap | Descartes | Mean.Counts | Mean.TPM |
|---|---|---|---|---|---|---|---|
| LUM | 0.0154739 | 17 | GTEx | DepMap | Descartes | 13.33 | 277.64 |
| DCN | 0.0117293 | 57 | GTEx | DepMap | Descartes | 4.66 | 37.46 |
| MGP | 0.0108435 | 69 | GTEx | DepMap | Descartes | 21.42 | 689.31 |
| ITGA11 | 0.0087714 | 139 | GTEx | DepMap | Descartes | 1.69 | 9.21 |
| COL3A1 | 0.0071373 | 223 | GTEx | DepMap | Descartes | 9.42 | 91.63 |
| PCOLCE | 0.0071101 | 225 | GTEx | DepMap | Descartes | 16.57 | 607.02 |
| C7 | 0.0066044 | 263 | GTEx | DepMap | Descartes | 8.82 | 90.80 |
| CD248 | 0.0052130 | 411 | GTEx | DepMap | Descartes | 1.15 | 23.42 |
| CDH11 | 0.0044669 | 521 | GTEx | DepMap | Descartes | 1.49 | 11.99 |
| PDGFRA | 0.0027722 | 950 | GTEx | DepMap | Descartes | 1.63 | 14.22 |
| GLI2 | 0.0026021 | 1016 | GTEx | DepMap | Descartes | 0.55 | 4.20 |
| PRRX1 | 0.0022088 | 1202 | GTEx | DepMap | Descartes | 1.59 | 22.17 |
| COL1A1 | 0.0021199 | 1251 | GTEx | DepMap | Descartes | 9.37 | 81.51 |
| ACTA2 | 0.0018812 | 1365 | GTEx | DepMap | Descartes | 0.72 | 25.76 |
| IGFBP3 | 0.0018054 | 1429 | GTEx | DepMap | Descartes | 2.00 | 36.30 |
| CCDC80 | 0.0011818 | 1914 | GTEx | DepMap | Descartes | 1.99 | 7.55 |
| COL27A1 | 0.0010799 | 2020 | GTEx | DepMap | Descartes | 0.12 | 0.90 |
| GAS2 | 0.0009126 | 2222 | GTEx | DepMap | Descartes | 0.16 | 3.57 |
| LRRC17 | 0.0007911 | 2379 | GTEx | DepMap | Descartes | 2.42 | 61.13 |
| COL6A3 | 0.0007739 | 2406 | GTEx | DepMap | Descartes | 0.53 | 2.90 |
| ELN | 0.0006717 | 2572 | GTEx | DepMap | Descartes | 0.18 | 2.53 |
| PCDH18 | 0.0005719 | 2720 | GTEx | DepMap | Descartes | 0.33 | 3.06 |
| CLDN11 | 0.0005707 | 2723 | GTEx | DepMap | Descartes | 0.07 | 1.29 |
| DKK2 | 0.0003719 | 3143 | GTEx | DepMap | Descartes | 0.76 | 11.29 |
| PAMR1 | 0.0002280 | 3534 | GTEx | DepMap | Descartes | 0.00 | 0.04 |
| ADAMTS2 | 0.0002224 | 3548 | GTEx | DepMap | Descartes | 0.12 | 1.04 |
| FREM1 | 0.0001650 | 3727 | GTEx | DepMap | Descartes | 0.07 | 0.40 |
| OGN | 0.0000476 | 4131 | GTEx | DepMap | Descartes | 0.01 | 0.21 |
| ABCA6 | -0.0000491 | 4558 | GTEx | DepMap | Descartes | 0.00 | 0.00 |
| SFRP2 | -0.0000669 | 4691 | GTEx | DepMap | Descartes | 0.00 | 0.00 |
Descartes sympathoblasts markers
Top 50 marker genes of sympathoblasts cells in the Decartes fetal adrenal single cell map (https://atlas.brotmanbaty.org/bbi/human-gene-expression-during-development/cell/sympathoblasts/in/adrenal)
Wilcoxon ranksum test P-value for gene set overrepresentation: 1.00e+00
Mean rank of genes in gene set: 8223.74
Median rank of genes in gene set: 8501.5
Rank on gene expression program of top 30 genes in gene set:
| Genes | Weight | Rank | GTEx | DepMap | Descartes | Mean.Counts | Mean.TPM |
|---|---|---|---|---|---|---|---|
| SLC35F3 | 0.0038486 | 647 | GTEx | DepMap | Descartes | 0.60 | 10.29 |
| ARC | 0.0000444 | 4153 | GTEx | DepMap | Descartes | 0.20 | 3.53 |
| PENK | 0.0000373 | 4188 | GTEx | DepMap | Descartes | 0.01 | 0.18 |
| NTNG1 | -0.0000744 | 4746 | GTEx | DepMap | Descartes | 0.25 | 2.71 |
| KCTD16 | -0.0001118 | 5032 | GTEx | DepMap | Descartes | 0.15 | 0.59 |
| LAMA3 | -0.0001130 | 5046 | GTEx | DepMap | Descartes | 0.01 | 0.04 |
| SLC24A2 | -0.0002372 | 6048 | GTEx | DepMap | Descartes | 0.00 | 0.00 |
| GALNTL6 | -0.0002655 | 6235 | GTEx | DepMap | Descartes | 0.07 | 0.91 |
| CDH12 | -0.0002679 | 6257 | GTEx | DepMap | Descartes | 0.00 | 0.00 |
| CDH18 | -0.0002765 | 6326 | GTEx | DepMap | Descartes | 0.04 | 0.50 |
| TENM1 | -0.0002942 | 6422 | GTEx | DepMap | Descartes | 0.02 | NA |
| SORCS3 | -0.0003051 | 6485 | GTEx | DepMap | Descartes | 0.00 | 0.00 |
| AGBL4 | -0.0003359 | 6664 | GTEx | DepMap | Descartes | 0.03 | 0.44 |
| PACRG | -0.0003385 | 6683 | GTEx | DepMap | Descartes | 0.00 | 0.15 |
| KSR2 | -0.0003493 | 6754 | GTEx | DepMap | Descartes | 0.00 | 0.01 |
| CNTN3 | -0.0003744 | 6895 | GTEx | DepMap | Descartes | 0.00 | 0.04 |
| TBX20 | -0.0004590 | 7351 | GTEx | DepMap | Descartes | 0.03 | 1.03 |
| ROBO1 | -0.0006752 | 8392 | GTEx | DepMap | Descartes | 0.69 | 5.05 |
| DGKK | -0.0006958 | 8482 | GTEx | DepMap | Descartes | 0.00 | 0.00 |
| ST18 | -0.0007051 | 8521 | GTEx | DepMap | Descartes | 0.00 | 0.01 |
| EML6 | -0.0007055 | 8524 | GTEx | DepMap | Descartes | 0.37 | 2.17 |
| FGF14 | -0.0007957 | 8962 | GTEx | DepMap | Descartes | 0.65 | 2.75 |
| PCSK2 | -0.0008350 | 9113 | GTEx | DepMap | Descartes | 0.00 | 0.00 |
| GRM7 | -0.0008458 | 9158 | GTEx | DepMap | Descartes | 0.01 | 0.06 |
| CCSER1 | -0.0008467 | 9160 | GTEx | DepMap | Descartes | 0.01 | NA |
| SPOCK3 | -0.0008576 | 9202 | GTEx | DepMap | Descartes | 0.06 | 1.10 |
| GCH1 | -0.0009421 | 9521 | GTEx | DepMap | Descartes | 0.16 | 3.06 |
| SLC18A1 | -0.0011820 | 10299 | GTEx | DepMap | Descartes | 0.05 | 0.79 |
| UNC80 | -0.0011914 | 10326 | GTEx | DepMap | Descartes | 0.01 | 0.04 |
| GRID2 | -0.0012203 | 10409 | GTEx | DepMap | Descartes | 0.01 | 0.09 |
Descartes erythroblasts markers
Top 50 marker genes of erythroblasts cells in the Decartes fetal adrenal single cell map (https://atlas.brotmanbaty.org/bbi/human-gene-expression-during-development/cell/erythroblasts/in/adrenal)
Wilcoxon ranksum test P-value for gene set overrepresentation: 4.77e-01
Mean rank of genes in gene set: 6236.24
Median rank of genes in gene set: 6360
Rank on gene expression program of top 30 genes in gene set:
| Genes | Weight | Rank | GTEx | DepMap | Descartes | Mean.Counts | Mean.TPM |
|---|---|---|---|---|---|---|---|
| BLVRB | 0.0092240 | 125 | GTEx | DepMap | Descartes | 3.75 | 136.08 |
| SELENBP1 | 0.0038511 | 645 | GTEx | DepMap | Descartes | 0.50 | 9.91 |
| CAT | 0.0025520 | 1038 | GTEx | DepMap | Descartes | 1.28 | 31.34 |
| MICAL2 | 0.0023980 | 1108 | GTEx | DepMap | Descartes | 0.91 | 7.39 |
| SNCA | 0.0021294 | 1246 | GTEx | DepMap | Descartes | 1.14 | 17.97 |
| MARCH3 | 0.0013459 | 1757 | GTEx | DepMap | Descartes | 0.62 | NA |
| TSPAN5 | 0.0008329 | 2320 | GTEx | DepMap | Descartes | 2.02 | 25.41 |
| SLC4A1 | 0.0001253 | 3854 | GTEx | DepMap | Descartes | 0.00 | 0.01 |
| FECH | 0.0000232 | 4237 | GTEx | DepMap | Descartes | 0.29 | 2.01 |
| ALAS2 | -0.0000698 | 4716 | GTEx | DepMap | Descartes | 0.00 | 0.00 |
| GYPC | -0.0000836 | 4824 | GTEx | DepMap | Descartes | 0.00 | 0.00 |
| RHD | -0.0000987 | 4933 | GTEx | DepMap | Descartes | 0.00 | 0.02 |
| RGS6 | -0.0001376 | 5263 | GTEx | DepMap | Descartes | 0.00 | 0.00 |
| SLC25A37 | -0.0002003 | 5779 | GTEx | DepMap | Descartes | 2.09 | 23.70 |
| CPOX | -0.0002835 | 6360 | GTEx | DepMap | Descartes | 0.24 | 4.62 |
| TMCC2 | -0.0003057 | 6491 | GTEx | DepMap | Descartes | 0.05 | 0.56 |
| SPTB | -0.0005048 | 7591 | GTEx | DepMap | Descartes | 0.02 | 0.08 |
| TFR2 | -0.0005958 | 8055 | GTEx | DepMap | Descartes | 0.05 | 0.75 |
| ABCB10 | -0.0006657 | 8343 | GTEx | DepMap | Descartes | 0.19 | 2.47 |
| SLC25A21 | -0.0007297 | 8636 | GTEx | DepMap | Descartes | 0.00 | 0.00 |
| TRAK2 | -0.0008199 | 9057 | GTEx | DepMap | Descartes | 0.50 | 4.18 |
| ANK1 | -0.0009560 | 9565 | GTEx | DepMap | Descartes | 0.00 | 0.00 |
| RAPGEF2 | -0.0009738 | 9627 | GTEx | DepMap | Descartes | 0.39 | 2.52 |
| XPO7 | -0.0010069 | 9748 | GTEx | DepMap | Descartes | 0.55 | 5.82 |
| DENND4A | -0.0010570 | 9897 | GTEx | DepMap | Descartes | 0.20 | 1.22 |
| GCLC | -0.0011727 | 10265 | GTEx | DepMap | Descartes | 0.32 | 4.39 |
| SOX6 | -0.0015039 | 11093 | GTEx | DepMap | Descartes | 0.02 | 0.08 |
| SPECC1 | -0.0021020 | 11898 | GTEx | DepMap | Descartes | 0.07 | 0.45 |
| EPB41 | -0.0031985 | 12380 | GTEx | DepMap | Descartes | 0.89 | 7.21 |
| NA | NA | NA | NA | NA | NA | NA | NA |
Descartes myeloid markers
Top 50 marker genes of myeloid cells in the Decartes fetal adrenal single cell map (https://atlas.brotmanbaty.org/bbi/human-gene-expression-during-development/cell/myeloid/in/adrenal)
Wilcoxon ranksum test P-value for gene set overrepresentation: 4.67e-02
Mean rank of genes in gene set: 5290.37
Median rank of genes in gene set: 5276.5
Rank on gene expression program of top 30 genes in gene set:
| Genes | Weight | Rank | GTEx | DepMap | Descartes | Mean.Counts | Mean.TPM |
|---|---|---|---|---|---|---|---|
| CTSD | 0.0072166 | 215 | GTEx | DepMap | Descartes | 4.95 | 122.88 |
| CTSB | 0.0048645 | 450 | GTEx | DepMap | Descartes | 3.59 | 51.09 |
| RGL1 | 0.0046617 | 481 | GTEx | DepMap | Descartes | 1.60 | 17.17 |
| CST3 | 0.0028802 | 903 | GTEx | DepMap | Descartes | 12.03 | 183.26 |
| PTPRE | 0.0023573 | 1127 | GTEx | DepMap | Descartes | 1.26 | 11.81 |
| CTSS | 0.0023438 | 1135 | GTEx | DepMap | Descartes | 0.11 | 1.53 |
| CTSC | 0.0010895 | 2005 | GTEx | DepMap | Descartes | 4.54 | 36.23 |
| CD14 | 0.0004739 | 2920 | GTEx | DepMap | Descartes | 0.02 | 0.71 |
| MERTK | 0.0003302 | 3255 | GTEx | DepMap | Descartes | 0.07 | 1.08 |
| LGMN | 0.0003116 | 3302 | GTEx | DepMap | Descartes | 0.59 | 14.16 |
| CSF1R | 0.0002616 | 3430 | GTEx | DepMap | Descartes | 0.00 | 0.04 |
| SLCO2B1 | 0.0001888 | 3651 | GTEx | DepMap | Descartes | 0.01 | 0.05 |
| CD163L1 | -0.0000447 | 4537 | GTEx | DepMap | Descartes | 1.30 | 14.21 |
| HCK | -0.0000646 | 4674 | GTEx | DepMap | Descartes | 0.00 | 0.00 |
| SPP1 | -0.0000994 | 4940 | GTEx | DepMap | Descartes | 0.03 | 0.56 |
| MS4A4A | -0.0001123 | 5040 | GTEx | DepMap | Descartes | 0.00 | 0.00 |
| FGD2 | -0.0001192 | 5105 | GTEx | DepMap | Descartes | 0.00 | 0.00 |
| CD163 | -0.0001272 | 5175 | GTEx | DepMap | Descartes | 0.00 | 0.00 |
| ADAP2 | -0.0001299 | 5203 | GTEx | DepMap | Descartes | 0.00 | 0.04 |
| TGFBI | -0.0001462 | 5350 | GTEx | DepMap | Descartes | 0.65 | 7.41 |
| ABCA1 | -0.0001700 | 5538 | GTEx | DepMap | Descartes | 0.08 | 0.45 |
| CD74 | -0.0001790 | 5599 | GTEx | DepMap | Descartes | 0.00 | 0.04 |
| CYBB | -0.0001850 | 5661 | GTEx | DepMap | Descartes | 0.00 | 0.00 |
| FGL2 | -0.0001891 | 5703 | GTEx | DepMap | Descartes | 0.00 | 0.00 |
| ATP8B4 | -0.0002249 | 5966 | GTEx | DepMap | Descartes | 0.00 | 0.00 |
| SFMBT2 | -0.0003057 | 6492 | GTEx | DepMap | Descartes | 0.18 | 1.23 |
| SLC9A9 | -0.0003254 | 6620 | GTEx | DepMap | Descartes | 0.00 | 0.07 |
| MSR1 | -0.0003454 | 6726 | GTEx | DepMap | Descartes | 0.00 | 0.00 |
| AXL | -0.0003686 | 6861 | GTEx | DepMap | Descartes | 0.62 | 6.09 |
| HRH1 | -0.0004176 | 7133 | GTEx | DepMap | Descartes | 0.05 | 0.49 |
Descartes Schwann markers
Top 50 marker genes of Schwann cells in the Decartes fetal adrenal single cell map (https://atlas.brotmanbaty.org/bbi/human-gene-expression-during-development/cell/schwann/in/adrenal)
Wilcoxon ranksum test P-value for gene set overrepresentation: 7.90e-01
Mean rank of genes in gene set: 6714.11
Median rank of genes in gene set: 7004.5
Rank on gene expression program of top 30 genes in gene set:
| Genes | Weight | Rank | GTEx | DepMap | Descartes | Mean.Counts | Mean.TPM |
|---|---|---|---|---|---|---|---|
| PTN | 0.0081589 | 161 | GTEx | DepMap | Descartes | 17.85 | 601.20 |
| VIM | 0.0038763 | 640 | GTEx | DepMap | Descartes | 87.24 | 1757.36 |
| SFRP1 | 0.0037791 | 654 | GTEx | DepMap | Descartes | 16.34 | 195.40 |
| VCAN | 0.0024894 | 1069 | GTEx | DepMap | Descartes | 4.46 | 19.70 |
| EDNRB | 0.0022403 | 1187 | GTEx | DepMap | Descartes | 0.08 | 0.98 |
| LAMC1 | 0.0021989 | 1206 | GTEx | DepMap | Descartes | 2.07 | 13.58 |
| GAS7 | 0.0021572 | 1229 | GTEx | DepMap | Descartes | 0.17 | 1.11 |
| KCTD12 | 0.0010919 | 2003 | GTEx | DepMap | Descartes | 1.25 | 10.69 |
| SOX5 | 0.0006086 | 2660 | GTEx | DepMap | Descartes | 0.31 | 2.51 |
| LRRTM4 | 0.0005688 | 2726 | GTEx | DepMap | Descartes | 0.03 | 0.47 |
| COL25A1 | 0.0004323 | 3009 | GTEx | DepMap | Descartes | 0.07 | 0.51 |
| PMP22 | 0.0003516 | 3196 | GTEx | DepMap | Descartes | 1.56 | 44.29 |
| EGFLAM | 0.0000257 | 4232 | GTEx | DepMap | Descartes | 0.06 | 0.77 |
| STARD13 | -0.0000024 | 4345 | GTEx | DepMap | Descartes | 0.15 | 1.39 |
| OLFML2A | -0.0000642 | 4665 | GTEx | DepMap | Descartes | 0.02 | 0.18 |
| ERBB3 | -0.0000913 | 4883 | GTEx | DepMap | Descartes | 0.01 | 0.09 |
| IL1RAPL2 | -0.0001011 | 4952 | GTEx | DepMap | Descartes | 0.00 | 0.00 |
| MPZ | -0.0001211 | 5125 | GTEx | DepMap | Descartes | 0.01 | 0.41 |
| PLP1 | -0.0001247 | 5156 | GTEx | DepMap | Descartes | 0.00 | 0.06 |
| XKR4 | -0.0002148 | 5903 | GTEx | DepMap | Descartes | 0.00 | 0.00 |
| COL18A1 | -0.0003061 | 6496 | GTEx | DepMap | Descartes | 0.69 | 5.19 |
| NRXN3 | -0.0003438 | 6711 | GTEx | DepMap | Descartes | 0.01 | 0.03 |
| IL1RAPL1 | -0.0004507 | 7298 | GTEx | DepMap | Descartes | 0.04 | 0.57 |
| GFRA3 | -0.0004667 | 7394 | GTEx | DepMap | Descartes | 0.00 | 0.00 |
| LAMB1 | -0.0005692 | 7918 | GTEx | DepMap | Descartes | 1.92 | 18.16 |
| SCN7A | -0.0006477 | 8275 | GTEx | DepMap | Descartes | 0.01 | 0.10 |
| PLCE1 | -0.0006659 | 8344 | GTEx | DepMap | Descartes | 0.38 | 1.73 |
| MDGA2 | -0.0007233 | 8603 | GTEx | DepMap | Descartes | 0.00 | 0.00 |
| HMGA2 | -0.0007869 | 8909 | GTEx | DepMap | Descartes | 1.04 | 6.64 |
| PAG1 | -0.0008871 | 9308 | GTEx | DepMap | Descartes | 0.12 | 0.58 |
Descartes Megakaryocytes markers
Top 50 marker genes of Megakaryocytes cells in the Decartes fetal adrenal single cell map (https://atlas.brotmanbaty.org/bbi/human-gene-expression-during-development/cell/megakaryocytes/in/adrenal)
Wilcoxon ranksum test P-value for gene set overrepresentation: 6.37e-01
Mean rank of genes in gene set: 6463.76
Median rank of genes in gene set: 6449
Rank on gene expression program of top 30 genes in gene set:
| Genes | Weight | Rank | GTEx | DepMap | Descartes | Mean.Counts | Mean.TPM |
|---|---|---|---|---|---|---|---|
| FERMT3 | 0.0137798 | 29 | GTEx | DepMap | Descartes | 1.56 | 34.99 |
| LIMS1 | 0.0074615 | 199 | GTEx | DepMap | Descartes | 7.01 | 83.87 |
| TGFB1 | 0.0062761 | 298 | GTEx | DepMap | Descartes | 2.87 | 52.46 |
| TMSB4X | 0.0061834 | 303 | GTEx | DepMap | Descartes | 89.56 | 2655.10 |
| P2RX1 | 0.0023257 | 1147 | GTEx | DepMap | Descartes | 0.01 | 0.14 |
| PDE3A | 0.0017484 | 1463 | GTEx | DepMap | Descartes | 0.38 | 2.69 |
| TPM4 | 0.0017069 | 1484 | GTEx | DepMap | Descartes | 11.61 | 124.91 |
| ITGB3 | 0.0010077 | 2100 | GTEx | DepMap | Descartes | 0.03 | 0.23 |
| FLNA | 0.0008891 | 2246 | GTEx | DepMap | Descartes | 4.29 | 24.97 |
| THBS1 | 0.0007116 | 2509 | GTEx | DepMap | Descartes | 1.50 | 9.79 |
| RAB27B | 0.0004854 | 2892 | GTEx | DepMap | Descartes | 0.40 | 3.08 |
| PLEK | 0.0001421 | 3798 | GTEx | DepMap | Descartes | 0.00 | 0.00 |
| PSTPIP2 | 0.0000886 | 3984 | GTEx | DepMap | Descartes | 0.10 | 1.81 |
| ZYX | 0.0000398 | 4177 | GTEx | DepMap | Descartes | 2.12 | 46.33 |
| GSN | 0.0000176 | 4268 | GTEx | DepMap | Descartes | 0.40 | 3.38 |
| SLC2A3 | -0.0000260 | 4442 | GTEx | DepMap | Descartes | 0.13 | 1.58 |
| MMRN1 | -0.0001072 | 5001 | GTEx | DepMap | Descartes | 0.00 | 0.00 |
| CD84 | -0.0001484 | 5369 | GTEx | DepMap | Descartes | 0.00 | 0.00 |
| VCL | -0.0001646 | 5497 | GTEx | DepMap | Descartes | 1.83 | 12.08 |
| ITGA2B | -0.0001943 | 5735 | GTEx | DepMap | Descartes | 0.01 | 0.21 |
| TUBB1 | -0.0002054 | 5830 | GTEx | DepMap | Descartes | 0.00 | 0.00 |
| GP1BA | -0.0002239 | 5961 | GTEx | DepMap | Descartes | 0.00 | 0.00 |
| FLI1 | -0.0002983 | 6449 | GTEx | DepMap | Descartes | 0.02 | 0.17 |
| MCTP1 | -0.0003869 | 6968 | GTEx | DepMap | Descartes | 0.06 | 0.63 |
| ACTB | -0.0004145 | 7113 | GTEx | DepMap | Descartes | 57.35 | 1265.28 |
| SPN | -0.0004224 | 7152 | GTEx | DepMap | Descartes | 0.00 | 0.00 |
| DOK6 | -0.0004441 | 7249 | GTEx | DepMap | Descartes | 0.37 | 2.14 |
| RAP1B | -0.0004610 | 7367 | GTEx | DepMap | Descartes | 4.68 | 18.14 |
| TRPC6 | -0.0007285 | 8627 | GTEx | DepMap | Descartes | 0.00 | 0.00 |
| UBASH3B | -0.0007523 | 8732 | GTEx | DepMap | Descartes | 0.05 | 0.33 |
Descartes Lyphoid markers
Top 50 marker genes of Lyphoid cells in the Decartes fetal adrenal single cell map (https://atlas.brotmanbaty.org/bbi/human-gene-expression-during-development/cell/lymphoid/in/adrenal)
Wilcoxon ranksum test P-value for gene set overrepresentation: 5.21e-01
Mean rank of genes in gene set: 6303.81
Median rank of genes in gene set: 6518
Rank on gene expression program of top 30 genes in gene set:
| Genes | Weight | Rank | GTEx | DepMap | Descartes | Mean.Counts | Mean.TPM |
|---|---|---|---|---|---|---|---|
| PTPRC | 0.0166774 | 10 | GTEx | DepMap | Descartes | 4.20 | 43.46 |
| B2M | 0.0108168 | 70 | GTEx | DepMap | Descartes | 44.73 | 970.70 |
| TMSB10 | 0.0104722 | 74 | GTEx | DepMap | Descartes | 201.82 | 21711.40 |
| SP100 | 0.0078802 | 179 | GTEx | DepMap | Descartes | 1.52 | 15.14 |
| ARHGDIB | 0.0073805 | 204 | GTEx | DepMap | Descartes | 1.78 | 73.29 |
| MSN | 0.0050903 | 426 | GTEx | DepMap | Descartes | 3.72 | 51.15 |
| GNG2 | 0.0043246 | 550 | GTEx | DepMap | Descartes | 3.37 | 49.36 |
| CD44 | 0.0040316 | 610 | GTEx | DepMap | Descartes | 2.11 | 20.76 |
| CCND3 | 0.0018353 | 1396 | GTEx | DepMap | Descartes | 1.08 | 23.14 |
| IKZF1 | 0.0012119 | 1878 | GTEx | DepMap | Descartes | 0.06 | 0.59 |
| WIPF1 | 0.0008156 | 2345 | GTEx | DepMap | Descartes | 0.83 | 9.98 |
| ARID5B | 0.0007680 | 2415 | GTEx | DepMap | Descartes | 1.29 | 9.39 |
| PLEKHA2 | 0.0004585 | 2952 | GTEx | DepMap | Descartes | 0.26 | 2.56 |
| NCALD | 0.0004231 | 3032 | GTEx | DepMap | Descartes | 0.42 | 5.60 |
| ITPKB | 0.0001891 | 3650 | GTEx | DepMap | Descartes | 0.21 | 1.98 |
| CCL5 | -0.0000837 | 4825 | GTEx | DepMap | Descartes | 0.00 | 0.03 |
| PRKCH | -0.0001109 | 5030 | GTEx | DepMap | Descartes | 0.04 | 0.60 |
| ARHGAP15 | -0.0001471 | 5358 | GTEx | DepMap | Descartes | 0.00 | 0.00 |
| MCTP2 | -0.0002198 | 5936 | GTEx | DepMap | Descartes | 0.01 | 0.10 |
| SKAP1 | -0.0002469 | 6119 | GTEx | DepMap | Descartes | 0.00 | 0.00 |
| SCML4 | -0.0002816 | 6348 | GTEx | DepMap | Descartes | 0.00 | 0.00 |
| SAMD3 | -0.0003404 | 6688 | GTEx | DepMap | Descartes | 0.00 | 0.00 |
| RCSD1 | -0.0003762 | 6903 | GTEx | DepMap | Descartes | 0.00 | 0.01 |
| ETS1 | -0.0006047 | 8088 | GTEx | DepMap | Descartes | 0.34 | 3.35 |
| LCP1 | -0.0008354 | 9116 | GTEx | DepMap | Descartes | 0.01 | 0.09 |
| PDE3B | -0.0008619 | 9215 | GTEx | DepMap | Descartes | 0.28 | 2.42 |
| PITPNC1 | -0.0009057 | 9373 | GTEx | DepMap | Descartes | 0.42 | 3.23 |
| BACH2 | -0.0009264 | 9458 | GTEx | DepMap | Descartes | 0.03 | 0.15 |
| TOX | -0.0009746 | 9630 | GTEx | DepMap | Descartes | 0.36 | 4.32 |
| SORL1 | -0.0009992 | 9719 | GTEx | DepMap | Descartes | 0.06 | 0.27 |
Below shows the ranks on this GEP for immune marker gene lists curated by CellTypist (https://www.celltypist.org/encyclopedia).
High ranks indicate this gene is a driver of this GEP.
These curated gene list are ranked by P-value (on this GEP) of their constituent genes.
The Mean Count column shows the mean read count in cells scoring highly (H > 50) on this gene expression program.
T cells: Tcm/Naive helper T cells (model markers)
CD4+ helper T lymphocytes mainly localized in secondary lymphoid tissues and sustaining the responses by proliferating and producing new effectors:
Wilcoxon ranksum test P-value for gene set overrepresentation: 8.34e-04
Mean rank of genes in gene set: 581.25
Rank on gene expression program of genes in gene set:
| Genes | Weight | Rank | GTEx | DepMap | Decartes | Mean.Counts | Mean.TPM |
|---|---|---|---|---|---|---|---|
| TMSB10 | 0.0104722 | 74 | GTEx | DepMap | Descartes | 201.82 | 21711.40 |
| CTSL | 0.0057966 | 344 | GTEx | DepMap | Descartes | 3.28 | NA |
| FCGRT | 0.0040914 | 598 | GTEx | DepMap | Descartes | 2.37 | 45.22 |
| LTB | 0.0020056 | 1309 | GTEx | DepMap | Descartes | 0.02 | 0.72 |
Macrophages: Macrophages (model markers)
specialised mononuclear phagocytic cells which recognise:
Wilcoxon ranksum test P-value for gene set overrepresentation: 3.47e-03
Mean rank of genes in gene set: 1385
Rank on gene expression program of genes in gene set:
| Genes | Weight | Rank | GTEx | DepMap | Decartes | Mean.Counts | Mean.TPM |
|---|---|---|---|---|---|---|---|
| FTH1 | 0.0189562 | 3 | GTEx | DepMap | Descartes | 222.31 | 9126.40 |
| APOE | 0.0124783 | 40 | GTEx | DepMap | Descartes | 11.85 | 580.18 |
| CD5L | 0.0010190 | 2088 | GTEx | DepMap | Descartes | 0.00 | 0.06 |
| APOC1 | 0.0002708 | 3409 | GTEx | DepMap | Descartes | 0.33 | 25.28 |
Mono-mac: Mono-mac (model markers)
mononuclear phagocytes including monocytes and macrophages that are involved in the regulation of innate and adaptive immunity:
Wilcoxon ranksum test P-value for gene set overrepresentation: 5.72e-03
Mean rank of genes in gene set: 1694.75
Rank on gene expression program of genes in gene set:
| Genes | Weight | Rank | GTEx | DepMap | Decartes | Mean.Counts | Mean.TPM |
|---|---|---|---|---|---|---|---|
| FTH1 | 0.0189562 | 3 | GTEx | DepMap | Descartes | 222.31 | 9126.40 |
| SAT1 | 0.0035782 | 707 | GTEx | DepMap | Descartes | 1.36 | 59.74 |
| S100A2 | 0.0018433 | 1387 | GTEx | DepMap | Descartes | 1.61 | 77.62 |
| KLRB1 | -0.0000656 | 4682 | GTEx | DepMap | Descartes | 0.00 | 0.00 |