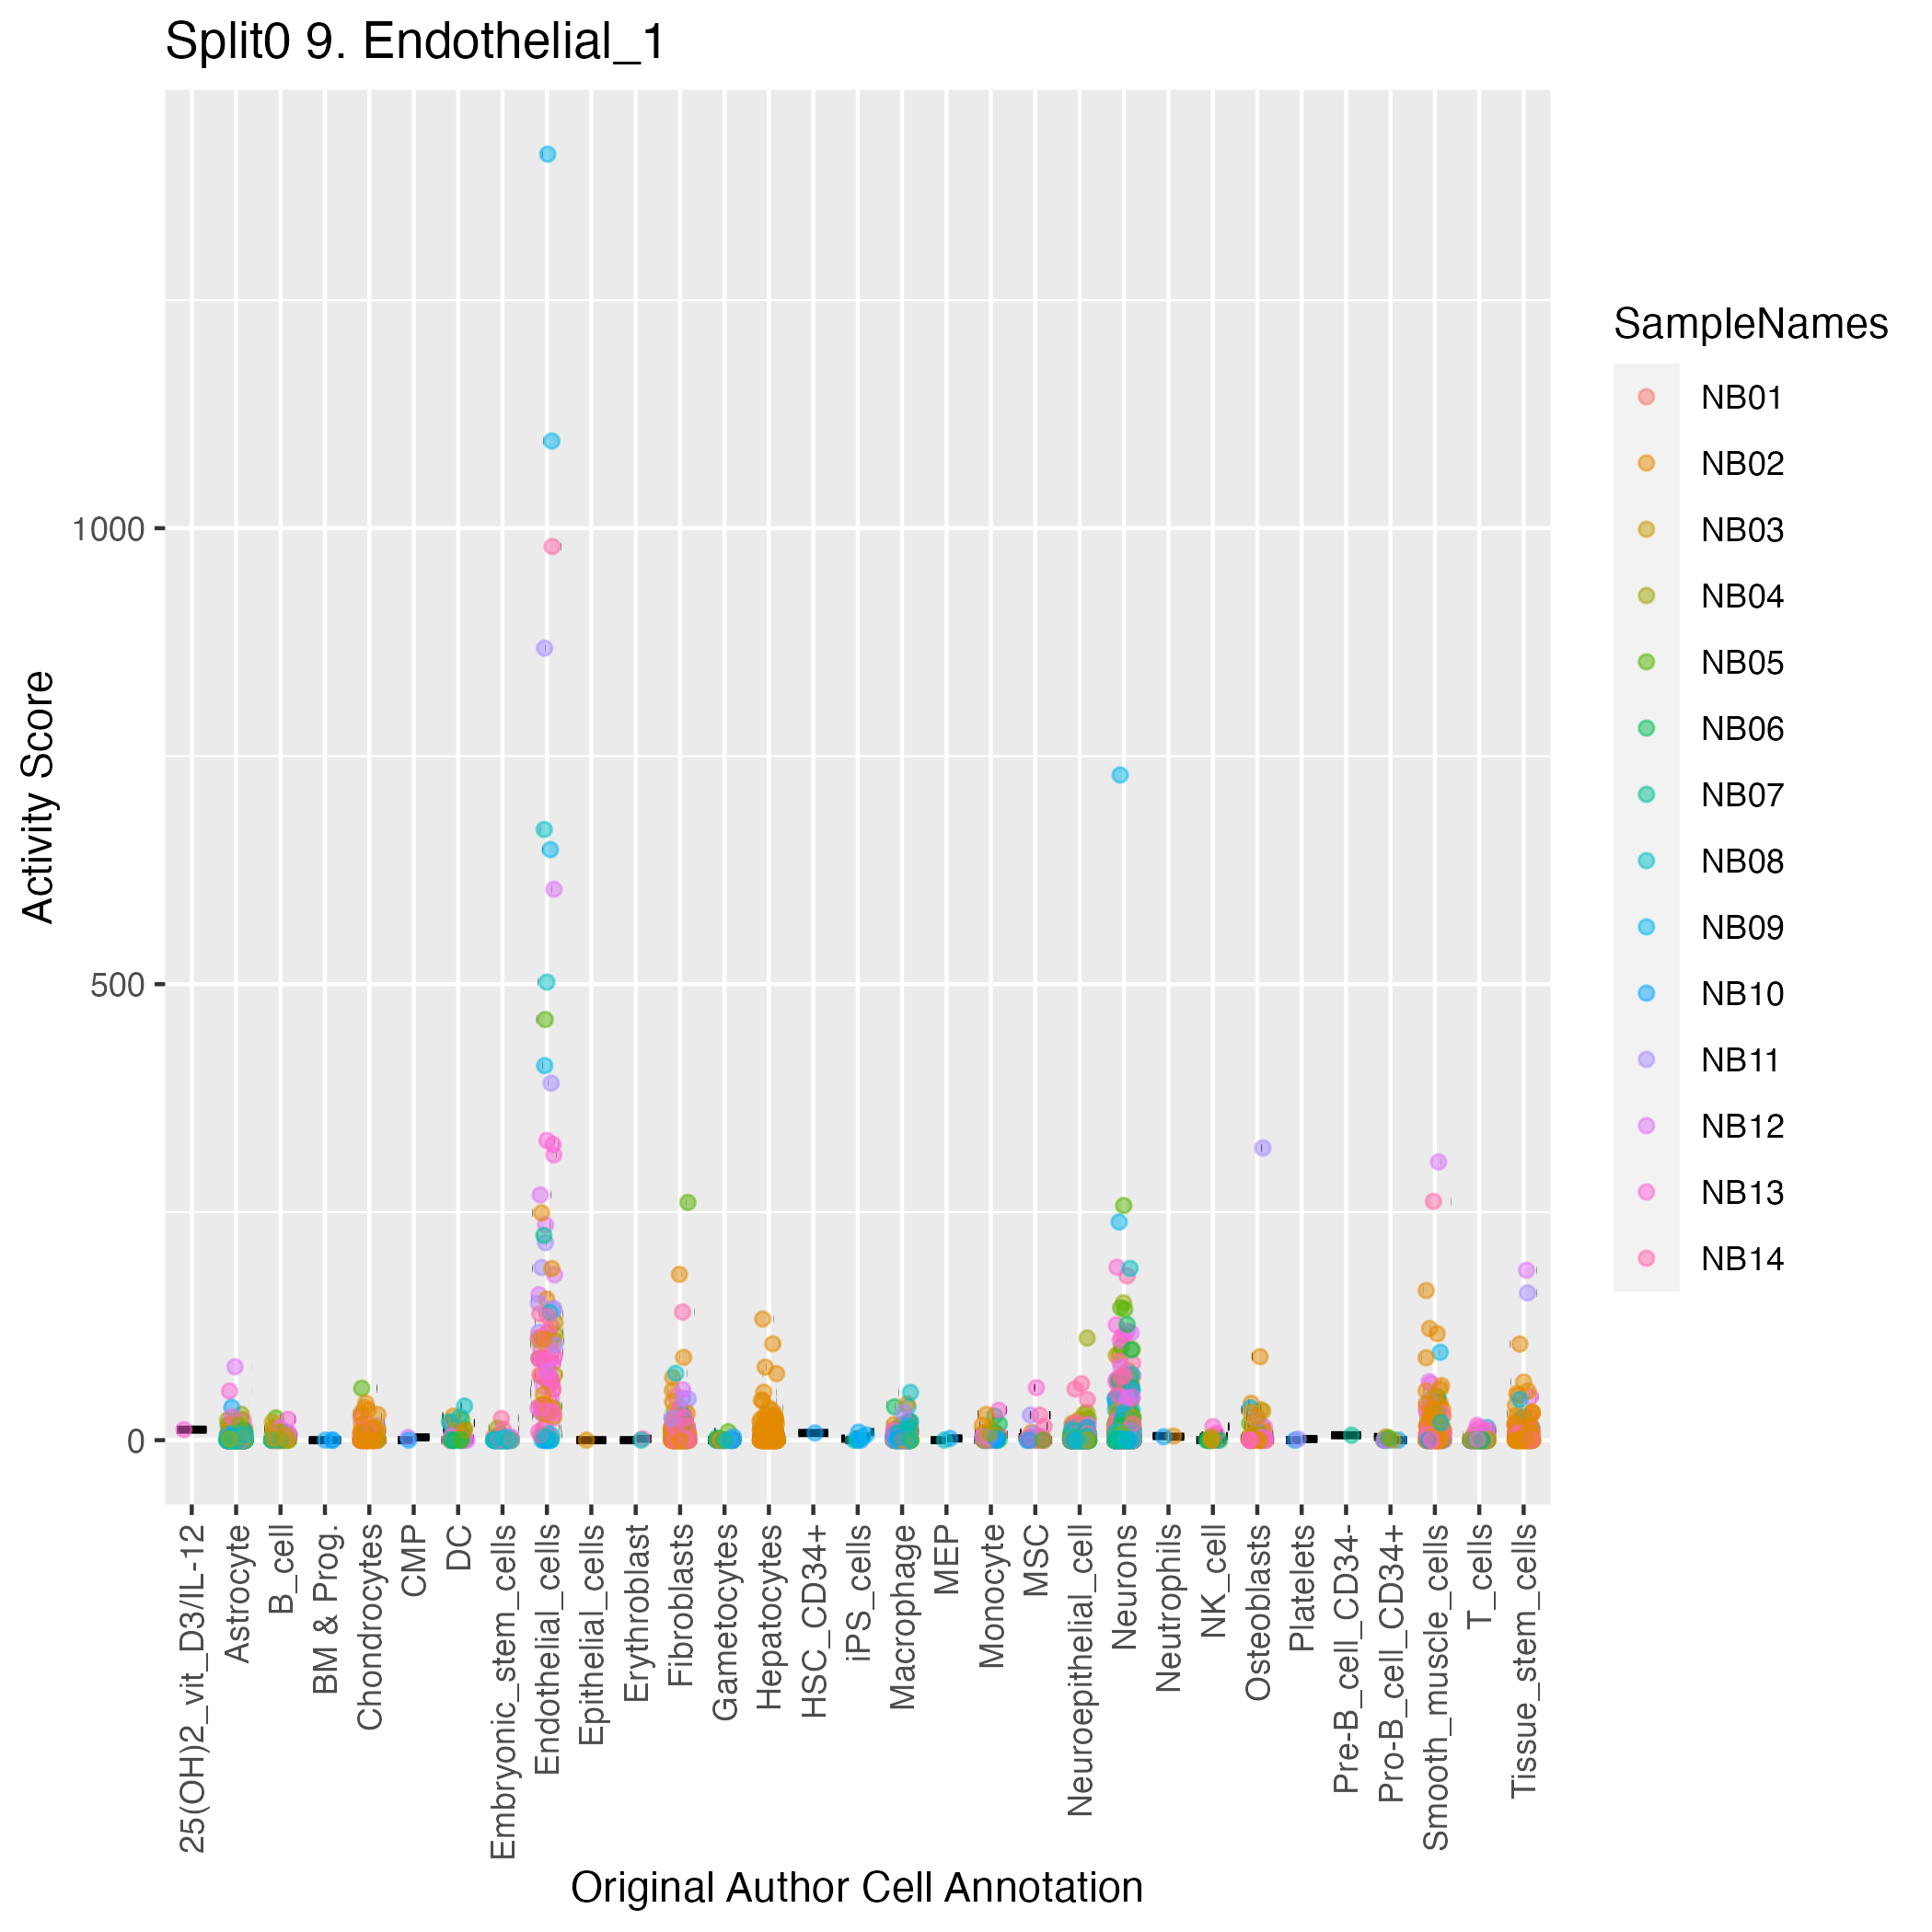
Program: 9. Endothelial.
Program description and justification of annotation: 9.
Submit a comment on this gene expression program’s interpretation: CLICK
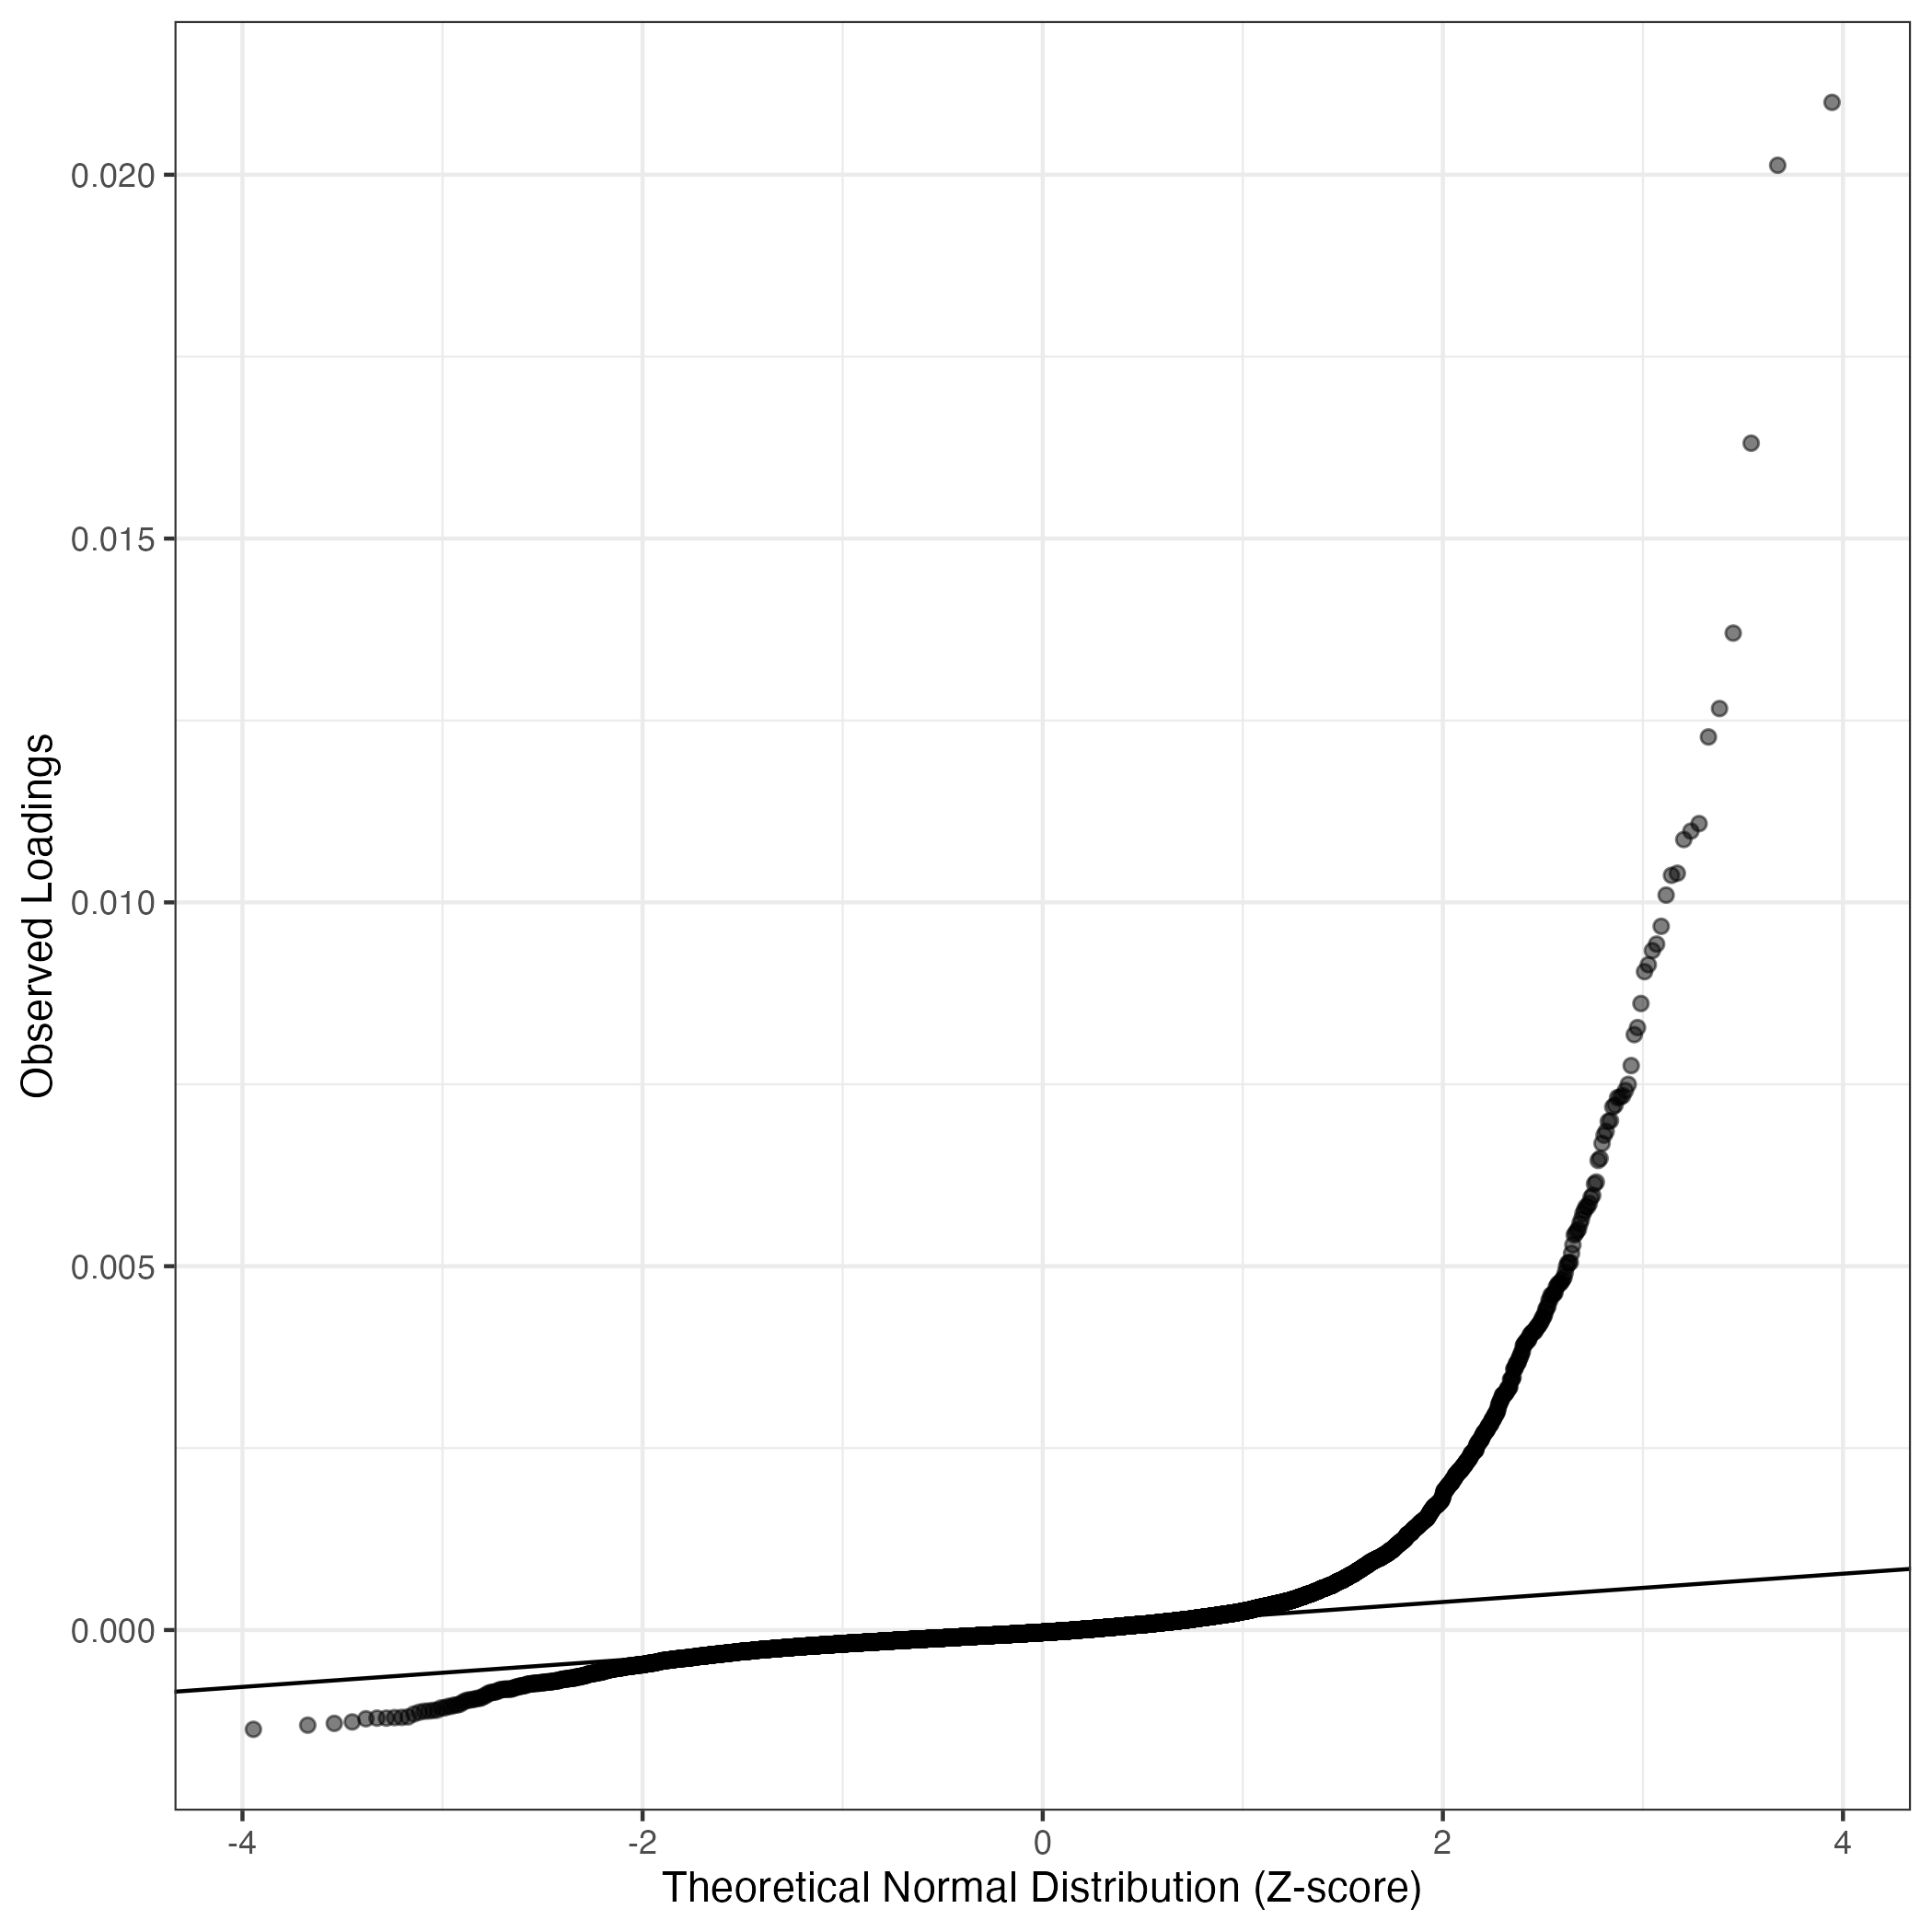
QQ-plot of gene loadings, averaged over both independent splits of the data
This plot highlights the relative contribution of each gene to the GEP
Top genes driving this program.
Note: Decartes website is buggy, try refreshing. Also, Decartes fetal adrenal data have been collected at specific time points (89-122 days), all possible cell types of interest may not be represented, do not overinterpret.
The Mean Count column shows the mean read count in cells scoring highly (H > 50) on this gene expression program.
| Gene | Loading | Gene.Name | GTEx | DepMap | Descartes | Mean.Counts | Mean.Tpm | |
|---|---|---|---|---|---|---|---|---|
| 1 | FLT1 | 0.0209947 | fms related receptor tyrosine kinase 1 | GTEx | DepMap | Descartes | 2.24 | 411.49 |
| 2 | MECOM | 0.0201301 | MDS1 and EVI1 complex locus | GTEx | DepMap | Descartes | 1.55 | 435.78 |
| 3 | DLL4 | 0.0163106 | delta like canonical Notch ligand 4 | GTEx | DepMap | Descartes | 0.44 | 181.61 |
| 4 | LDB2 | 0.0137007 | LIM domain binding 2 | GTEx | DepMap | Descartes | 3.89 | 2591.53 |
| 5 | EGFL7 | 0.0126636 | EGF like domain multiple 7 | GTEx | DepMap | Descartes | 1.82 | 2292.23 |
| 6 | PREX2 | 0.0122734 | phosphatidylinositol-3,4,5-trisphosphate dependent Rac exchange factor 2 | GTEx | DepMap | Descartes | 0.65 | 96.26 |
| 7 | MEF2C | 0.0110825 | myocyte enhancer factor 2C | GTEx | DepMap | Descartes | 1.67 | 369.79 |
| 8 | ANO2 | 0.0109792 | anoctamin 2 | GTEx | DepMap | Descartes | 1.02 | 477.30 |
| 9 | ARL15 | 0.0108636 | ADP ribosylation factor like GTPase 15 | GTEx | DepMap | Descartes | 3.85 | 1790.56 |
| 10 | WWTR1 | 0.0104003 | WW domain containing transcription regulator 1 | GTEx | DepMap | Descartes | 1.91 | 657.44 |
| 11 | CALCRL | 0.0103714 | calcitonin receptor like receptor | GTEx | DepMap | Descartes | 1.17 | 398.05 |
| 12 | EMCN | 0.0101001 | endomucin | GTEx | DepMap | Descartes | 0.80 | 414.91 |
| 13 | ADAMTS9 | 0.0096713 | ADAM metallopeptidase with thrombospondin type 1 motif 9 | GTEx | DepMap | Descartes | 1.99 | 527.02 |
| 14 | HSPG2 | 0.0094267 | heparan sulfate proteoglycan 2 | GTEx | DepMap | Descartes | 1.88 | 247.53 |
| 15 | STC1 | 0.0093369 | stanniocalcin 1 | GTEx | DepMap | Descartes | 0.56 | 176.37 |
| 16 | VWF | 0.0091431 | von Willebrand factor | GTEx | DepMap | Descartes | 1.16 | 223.41 |
| 17 | INSR | 0.0090478 | insulin receptor | GTEx | DepMap | Descartes | 3.91 | 652.27 |
| 18 | ESM1 | 0.0086103 | endothelial cell specific molecule 1 | GTEx | DepMap | Descartes | 0.16 | 65.80 |
| 19 | MCTP1 | 0.0082794 | multiple C2 and transmembrane domain containing 1 | GTEx | DepMap | Descartes | 1.53 | 540.46 |
| 20 | EMP1 | 0.0081823 | epithelial membrane protein 1 | GTEx | DepMap | Descartes | 1.27 | 576.00 |
| 21 | MYCT1 | 0.0077569 | MYC target 1 | GTEx | DepMap | Descartes | 0.09 | 41.00 |
| 22 | VEGFC | 0.0074992 | vascular endothelial growth factor C | GTEx | DepMap | Descartes | 0.32 | 162.75 |
| 23 | HES1 | 0.0074138 | hes family bHLH transcription factor 1 | GTEx | DepMap | Descartes | 0.35 | 572.55 |
| 24 | RHOJ | 0.0073426 | ras homolog family member J | GTEx | DepMap | Descartes | 0.63 | 362.46 |
| 25 | NOTCH4 | 0.0073226 | notch receptor 4 | GTEx | DepMap | Descartes | 0.56 | 132.54 |
| 26 | TM4SF1 | 0.0073164 | transmembrane 4 L six family member 1 | GTEx | DepMap | Descartes | 0.37 | 273.32 |
| 27 | PLVAP | 0.0072142 | plasmalemma vesicle associated protein | GTEx | DepMap | Descartes | 0.55 | 375.10 |
| 28 | PALMD | 0.0071881 | palmdelphin | GTEx | DepMap | Descartes | 0.42 | 180.73 |
| 29 | PLEKHG1 | 0.0070006 | pleckstrin homology and RhoGEF domain containing G1 | GTEx | DepMap | Descartes | 1.15 | 259.77 |
| 30 | MAST4 | 0.0069893 | microtubule associated serine/threonine kinase family member 4 | GTEx | DepMap | Descartes | 1.14 | 194.70 |
| 31 | DYSF | 0.0068530 | dysferlin | GTEx | DepMap | Descartes | 0.52 | 156.35 |
| 32 | CRIM1 | 0.0068001 | cysteine rich transmembrane BMP regulator 1 | GTEx | DepMap | Descartes | 0.78 | 213.00 |
| 33 | COL4A1 | 0.0066876 | collagen type IV alpha 1 chain | GTEx | DepMap | Descartes | 1.75 | 503.70 |
| 34 | ERG | 0.0064813 | ETS transcription factor ERG | GTEx | DepMap | Descartes | 0.94 | NA |
| 35 | IGFBP7 | 0.0064530 | insulin like growth factor binding protein 7 | GTEx | DepMap | Descartes | 3.34 | 4086.05 |
| 36 | GRB10 | 0.0061558 | growth factor receptor bound protein 10 | GTEx | DepMap | Descartes | 1.10 | 401.29 |
| 37 | SAT1 | 0.0061303 | spermidine/spermine N1-acetyltransferase 1 | GTEx | DepMap | Descartes | 2.17 | 2691.48 |
| 38 | ID1 | 0.0059744 | inhibitor of DNA binding 1, HLH protein | GTEx | DepMap | Descartes | 0.46 | 835.54 |
| 39 | TGFBR2 | 0.0059431 | transforming growth factor beta receptor 2 | GTEx | DepMap | Descartes | 0.74 | 205.94 |
| 40 | COL4A2 | 0.0058635 | collagen type IV alpha 2 chain | GTEx | DepMap | Descartes | 1.62 | 447.64 |
| 41 | CDH5 | 0.0058189 | cadherin 5 | GTEx | DepMap | Descartes | 0.28 | 129.83 |
| 42 | KDR | 0.0058169 | kinase insert domain receptor | GTEx | DepMap | Descartes | 0.25 | 75.48 |
| 43 | FLI1 | 0.0057673 | Fli-1 proto-oncogene, ETS transcription factor | GTEx | DepMap | Descartes | 0.80 | 268.87 |
| 44 | PDE4D | 0.0057213 | phosphodiesterase 4D | GTEx | DepMap | Descartes | 2.55 | 541.33 |
| 45 | PTPRE | 0.0056420 | protein tyrosine phosphatase receptor type E | GTEx | DepMap | Descartes | 1.10 | 409.02 |
| 46 | RASGRP3 | 0.0055844 | RAS guanyl releasing protein 3 | GTEx | DepMap | Descartes | 0.52 | 216.52 |
| 47 | PTPRG | 0.0055071 | protein tyrosine phosphatase receptor type G | GTEx | DepMap | Descartes | 2.52 | 458.56 |
| 48 | BTNL9 | 0.0054856 | butyrophilin like 9 | GTEx | DepMap | Descartes | 0.10 | 38.47 |
| 49 | ADCY4 | 0.0054516 | adenylate cyclase 4 | GTEx | DepMap | Descartes | 0.33 | 166.98 |
| 50 | CYYR1 | 0.0054287 | cysteine and tyrosine rich 1 | GTEx | DepMap | Descartes | 0.55 | 290.01 |
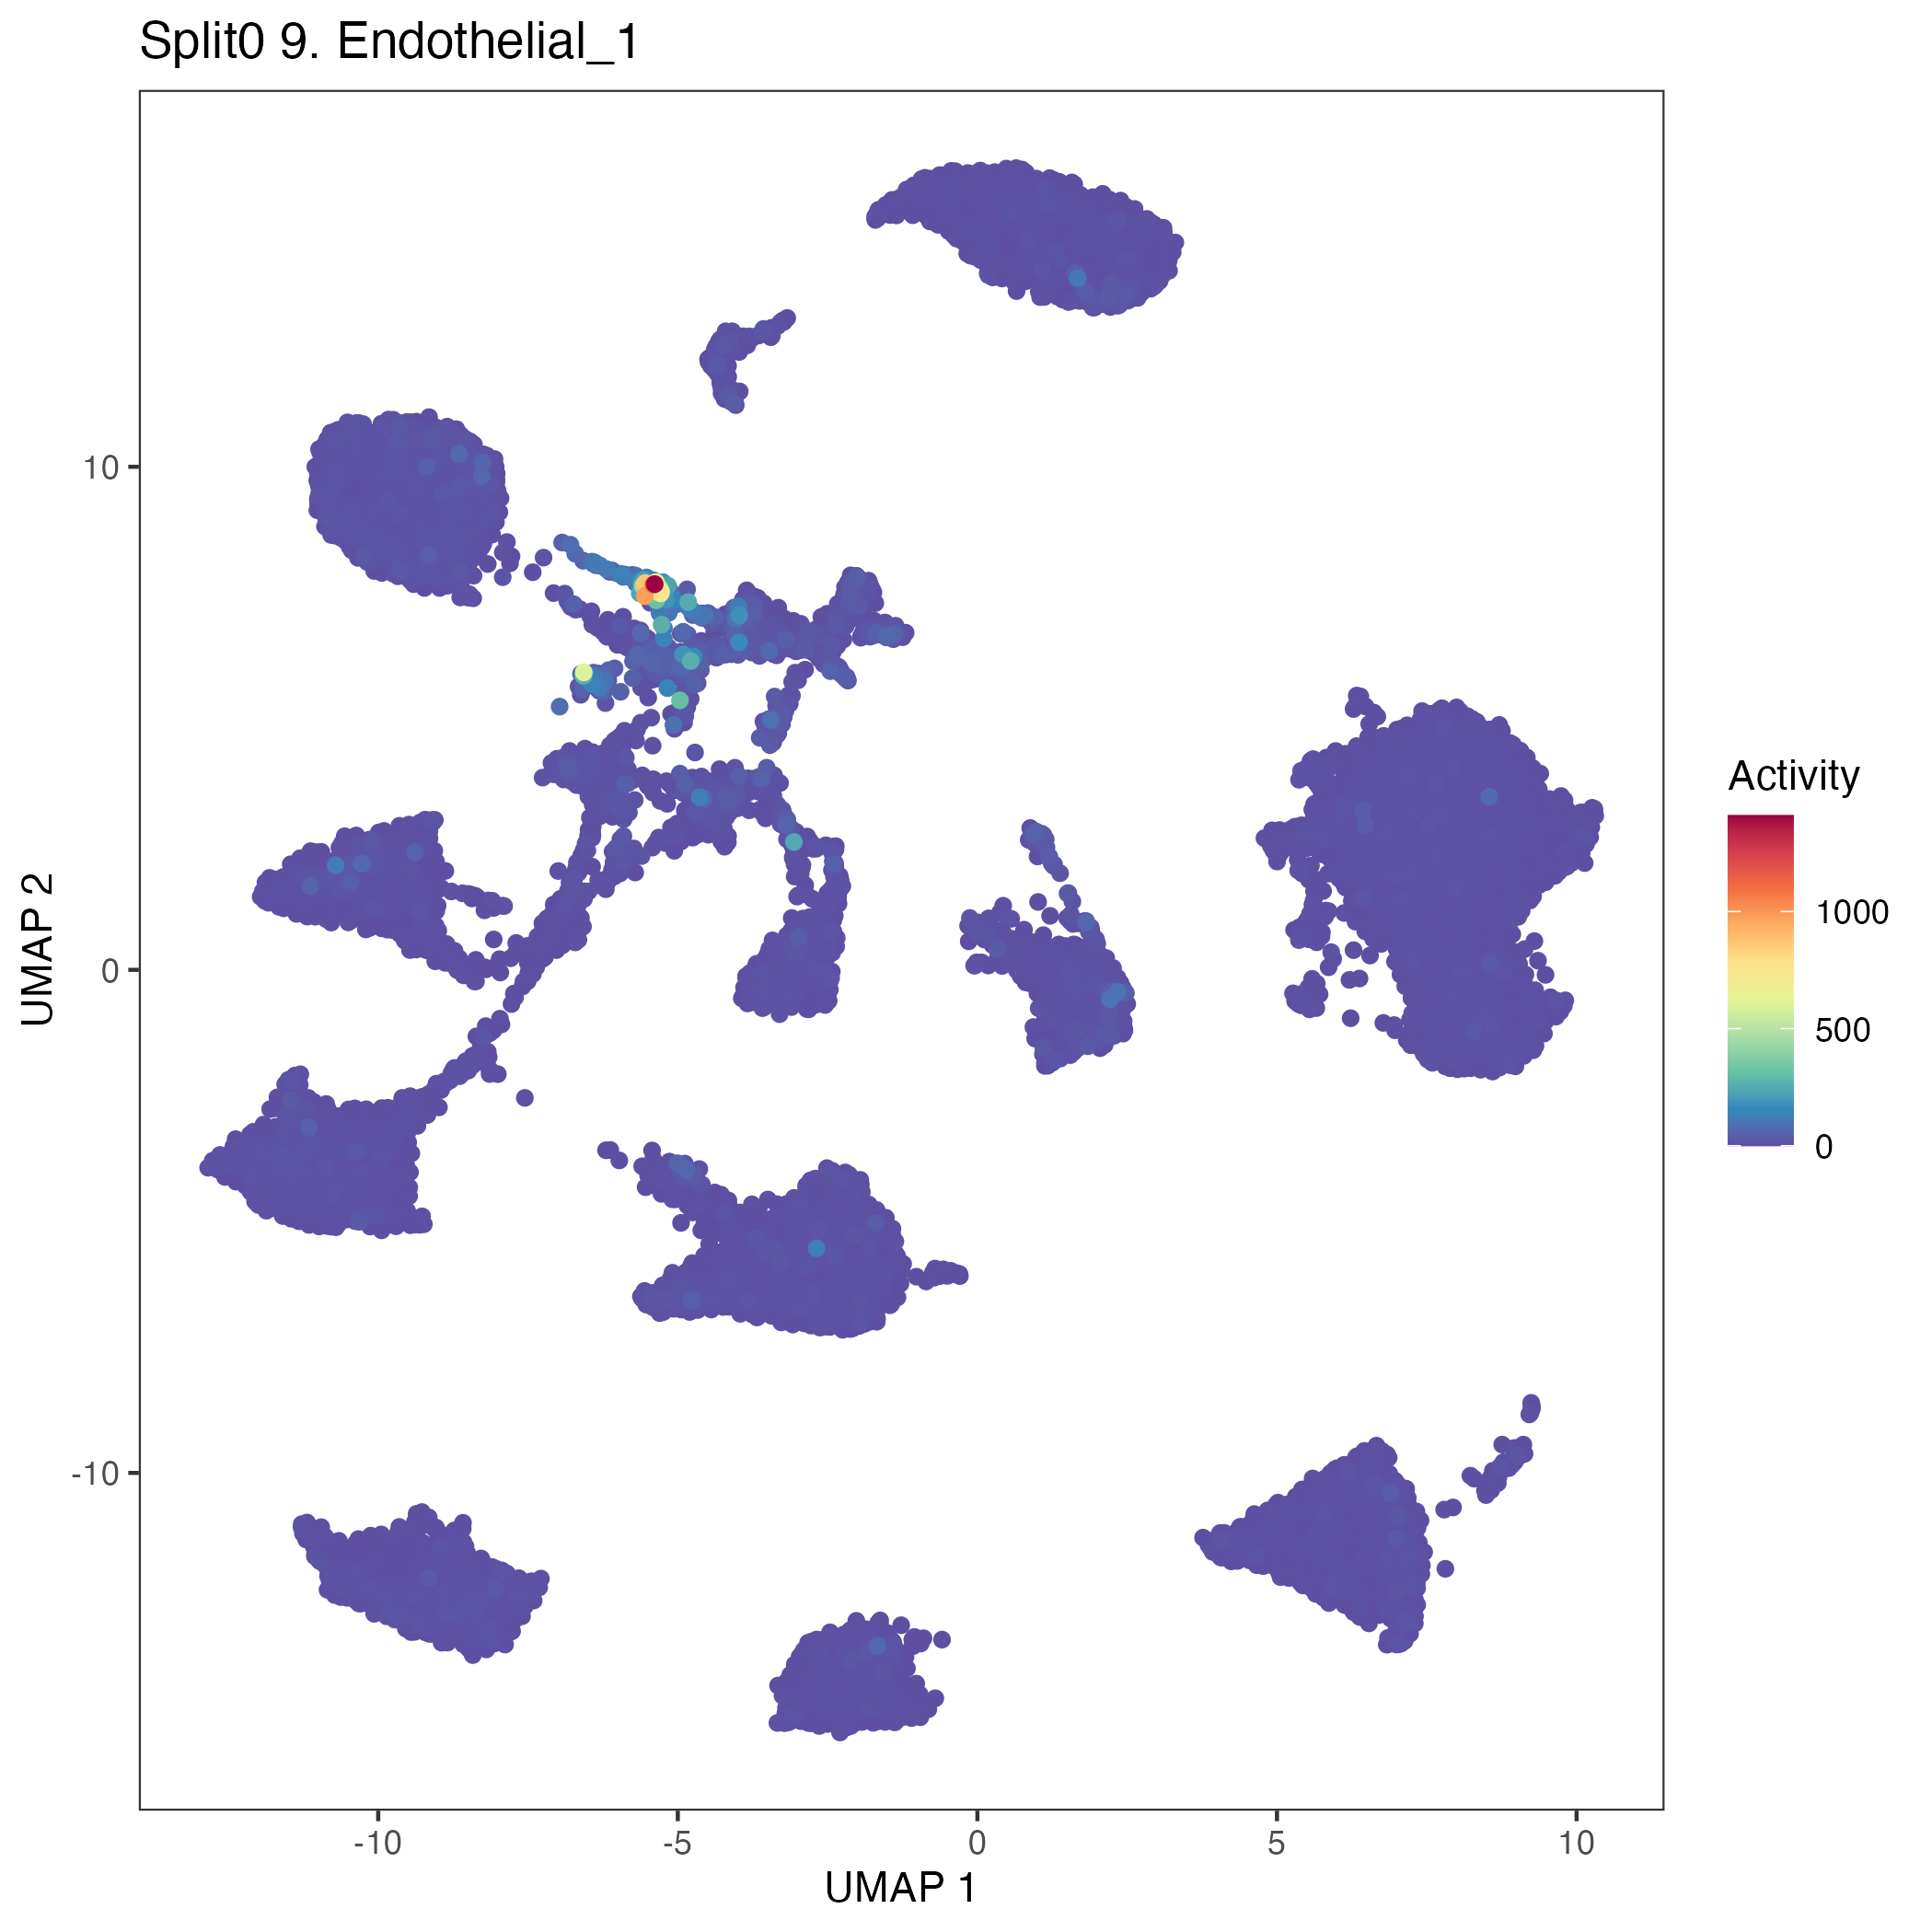
UMAP plots showing activity of gene expression program identified in community:9. Endothelial
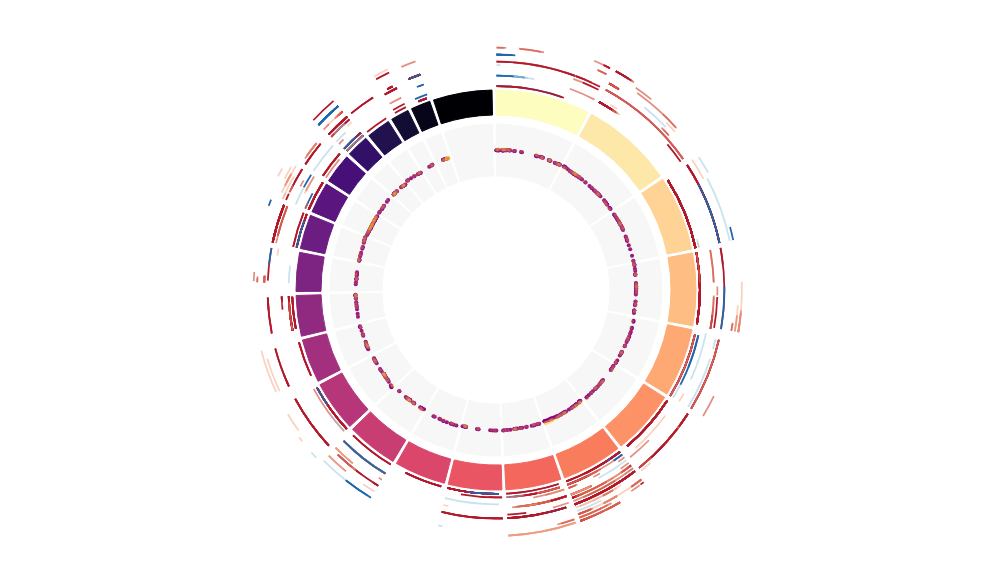
CNV Data procured from inferCNV.
Outer tracks are putative CNV regions (gains = red, losses = blue) for each patient
Inner track is expression data representing:
The top cells expressing this GEP (purple)
Random cells (n =50) from the reference set used in inferCNV (orange)
Gene set Enrichments for this program, caculated from top 50 genes
mSigDB Cell Types Gene Set:
| P-value | OR | Lower 95% CI | FDR | FWER | Genes Found | Gene Set Size | |
|---|---|---|---|---|---|---|---|
| AIZARANI_LIVER_C10_MVECS_1 | 4.10e-44 | 103.07 | 54.73 | 2.75e-41 | 2.75e-41 | 33FLT1, LDB2, EGFL7, ARL15, WWTR1, CALCRL, EMCN, ADAMTS9, VWF, INSR, EMP1, MYCT1, HES1, RHOJ, NOTCH4, TM4SF1, PLVAP, PALMD, MAST4, DYSF, CRIM1, COL4A1, ERG, IGFBP7, GRB10, ID1, TGFBR2, CDH5, KDR, PTPRG, BTNL9, ADCY4, CYYR1 |
269 |
| DESCARTES_FETAL_THYMUS_VASCULAR_ENDOTHELIAL_CELLS | 1.96e-29 | 82.14 | 43.11 | 3.29e-27 | 1.31e-26 | 21FLT1, MECOM, LDB2, EGFL7, PREX2, ANO2, WWTR1, CALCRL, EMCN, ADAMTS9, VWF, MYCT1, RHOJ, PLVAP, PALMD, COL4A1, ERG, ID1, KDR, RASGRP3, ADCY4 |
131 |
| MURARO_PANCREAS_ENDOTHELIAL_CELL | 3.95e-36 | 61.77 | 33.38 | 1.32e-33 | 2.65e-33 | 31FLT1, MECOM, LDB2, MEF2C, WWTR1, CALCRL, EMCN, ADAMTS9, STC1, VWF, INSR, ESM1, EMP1, MYCT1, RHOJ, NOTCH4, TM4SF1, PLVAP, PLEKHG1, COL4A1, ERG, IGFBP7, GRB10, ID1, TGFBR2, COL4A2, CDH5, KDR, PTPRE, RASGRP3, CYYR1 |
362 |
| DESCARTES_FETAL_INTESTINE_VASCULAR_ENDOTHELIAL_CELLS | 5.85e-14 | 80.23 | 31.85 | 1.96e-12 | 3.92e-11 | 9FLT1, DLL4, EMCN, HSPG2, ESM1, NOTCH4, PLVAP, BTNL9, CYYR1 |
43 |
| AIZARANI_LIVER_C29_MVECS_2 | 2.80e-29 | 47.20 | 25.69 | 3.76e-27 | 1.88e-26 | 26FLT1, MECOM, LDB2, PREX2, WWTR1, CALCRL, EMCN, ADAMTS9, STC1, VWF, INSR, EMP1, MYCT1, RHOJ, NOTCH4, TM4SF1, PLVAP, PALMD, MAST4, CRIM1, ERG, IGFBP7, ID1, CDH5, PTPRG, CYYR1 |
313 |
| CUI_DEVELOPING_HEART_C4_ENDOTHELIAL_CELL | 2.96e-21 | 49.84 | 25.37 | 1.98e-19 | 1.98e-18 | 17FLT1, LDB2, EGFL7, WWTR1, CALCRL, EMCN, ADAMTS9, VWF, MYCT1, HES1, TM4SF1, PLVAP, PALMD, ID1, CDH5, KDR, CYYR1 |
146 |
| AIZARANI_LIVER_C9_LSECS_1 | 6.14e-28 | 44.81 | 24.36 | 6.87e-26 | 4.12e-25 | 25FLT1, LDB2, EGFL7, PREX2, MEF2C, WWTR1, ADAMTS9, STC1, INSR, EMP1, MYCT1, HES1, RHOJ, NOTCH4, TM4SF1, PLEKHG1, CRIM1, COL4A1, ERG, IGFBP7, GRB10, COL4A2, CDH5, KDR, BTNL9 |
304 |
| MANNO_MIDBRAIN_NEUROTYPES_HENDO | 3.89e-35 | 46.65 | 23.77 | 8.70e-33 | 2.61e-32 | 38FLT1, MECOM, DLL4, LDB2, EGFL7, MEF2C, WWTR1, CALCRL, EMCN, HSPG2, VWF, INSR, ESM1, EMP1, MYCT1, VEGFC, HES1, RHOJ, TM4SF1, PLVAP, PALMD, PLEKHG1, MAST4, DYSF, CRIM1, ERG, IGFBP7, SAT1, ID1, TGFBR2, CDH5, KDR, FLI1, RASGRP3, PTPRG, BTNL9, ADCY4, CYYR1 |
888 |
| GAO_LARGE_INTESTINE_24W_C2_MKI67POS_PROGENITOR | 6.37e-18 | 49.02 | 23.66 | 3.56e-16 | 4.27e-15 | 14FLT1, LDB2, EGFL7, CALCRL, EMCN, VWF, MYCT1, TM4SF1, PLVAP, PALMD, ERG, CDH5, KDR, CYYR1 |
113 |
| DURANTE_ADULT_OLFACTORY_NEUROEPITHELIUM_PERICYTES | 8.57e-15 | 51.81 | 22.91 | 3.38e-13 | 5.75e-12 | 11FLT1, EGFL7, CALCRL, EMCN, VWF, EMP1, TM4SF1, PLVAP, PALMD, TGFBR2, CYYR1 |
79 |
| AIZARANI_LIVER_C20_LSECS_3 | 5.30e-25 | 39.15 | 21.14 | 4.45e-23 | 3.56e-22 | 23FLT1, LDB2, PREX2, WWTR1, ADAMTS9, STC1, INSR, EMP1, MYCT1, RHOJ, NOTCH4, TM4SF1, PLEKHG1, MAST4, CRIM1, COL4A1, ERG, IGFBP7, GRB10, COL4A2, CDH5, KDR, BTNL9 |
295 |
| DESCARTES_FETAL_MUSCLE_VASCULAR_ENDOTHELIAL_CELLS | 1.89e-13 | 49.55 | 21.14 | 5.51e-12 | 1.27e-10 | 10FLT1, DLL4, ANO2, ESM1, VEGFC, NOTCH4, TM4SF1, PLVAP, BTNL9, CYYR1 |
73 |
| DESCARTES_FETAL_EYE_VASCULAR_ENDOTHELIAL_CELLS | 3.79e-14 | 44.55 | 19.83 | 1.34e-12 | 2.54e-11 | 11FLT1, EGFL7, ARL15, CALCRL, VWF, MYCT1, NOTCH4, PLVAP, ERG, CDH5, ADCY4 |
90 |
| RUBENSTEIN_SKELETAL_MUSCLE_ENDOTHELIAL_CELLS | 1.00e-16 | 39.48 | 19.17 | 4.81e-15 | 6.74e-14 | 14FLT1, EGFL7, MEF2C, EMCN, HSPG2, VWF, MYCT1, TM4SF1, PALMD, COL4A1, ID1, COL4A2, CDH5, BTNL9 |
137 |
| FAN_EMBRYONIC_CTX_BRAIN_ENDOTHELIAL_1 | 1.66e-25 | 32.73 | 17.89 | 1.59e-23 | 1.11e-22 | 26FLT1, MECOM, DLL4, EGFL7, PREX2, WWTR1, CALCRL, EMCN, VWF, INSR, MYCT1, HES1, RHOJ, NOTCH4, TM4SF1, PALMD, PLEKHG1, ERG, IGFBP7, ID1, CDH5, KDR, RASGRP3, PTPRG, ADCY4, CYYR1 |
440 |
| MENON_FETAL_KIDNEY_9_ENDOTHELIAL_CELLS | 1.55e-13 | 38.65 | 17.31 | 4.73e-12 | 1.04e-10 | 11FLT1, EGFL7, MEF2C, EMCN, HSPG2, NOTCH4, TM4SF1, COL4A1, TGFBR2, COL4A2, KDR |
102 |
| LAKE_ADULT_KIDNEY_C24_ENDOTHELIAL_CELLS_AEA_AND_DVR | 4.36e-16 | 35.20 | 17.13 | 1.95e-14 | 2.93e-13 | 14FLT1, LDB2, EGFL7, MEF2C, ARL15, WWTR1, EMCN, ADAMTS9, EMP1, TM4SF1, PALMD, CRIM1, ID1, PTPRG |
152 |
| FAN_EMBRYONIC_CTX_BIG_GROUPS_BRAIN_ENDOTHELIAL | 6.47e-23 | 31.17 | 16.87 | 4.82e-21 | 4.34e-20 | 23FLT1, MECOM, EGFL7, WWTR1, EMCN, VWF, MYCT1, HES1, RHOJ, NOTCH4, TM4SF1, COL4A1, ERG, IGFBP7, ID1, TGFBR2, COL4A2, CDH5, KDR, FLI1, RASGRP3, ADCY4, CYYR1 |
365 |
| AIZARANI_LIVER_C13_LSECS_2 | 9.86e-21 | 31.66 | 16.82 | 6.01e-19 | 6.61e-18 | 20FLT1, LDB2, EGFL7, PREX2, CALCRL, EMCN, INSR, MYCT1, HES1, NOTCH4, TM4SF1, COL4A1, ERG, IGFBP7, ID1, TGFBR2, COL4A2, CDH5, KDR, BTNL9 |
283 |
| DESCARTES_FETAL_STOMACH_VASCULAR_ENDOTHELIAL_CELLS | 1.07e-07 | 55.36 | 15.85 | 2.05e-06 | 7.17e-05 | 5FLT1, EMCN, NOTCH4, PLVAP, CYYR1 |
30 |
Dowload full table
mSigDB Hallmark Gene Sets:
| P-value | OR | Lower 95% CI | FDR | FWER | Genes Found | Gene Set Size | |
|---|---|---|---|---|---|---|---|
| HALLMARK_MYOGENESIS | 7.71e-03 | 5.55 | 1.44 | 1.93e-01 | 3.85e-01 | 4MEF2C, WWTR1, IGFBP7, COL4A2 |
200 |
| HALLMARK_EPITHELIAL_MESENCHYMAL_TRANSITION | 7.71e-03 | 5.55 | 1.44 | 1.93e-01 | 3.85e-01 | 4VEGFC, COL4A1, SAT1, COL4A2 |
200 |
| HALLMARK_TGF_BETA_SIGNALING | 1.94e-02 | 10.01 | 1.15 | 3.23e-01 | 9.68e-01 | 2WWTR1, ID1 |
54 |
| HALLMARK_TNFA_SIGNALING_VIA_NFKB | 4.35e-02 | 4.05 | 0.80 | 4.35e-01 | 1.00e+00 | 3HES1, SAT1, PTPRE |
200 |
| HALLMARK_P53_PATHWAY | 4.35e-02 | 4.05 | 0.80 | 4.35e-01 | 1.00e+00 | 3TM4SF1, SAT1, PTPRE |
200 |
| HALLMARK_UV_RESPONSE_DN | 1.10e-01 | 3.67 | 0.43 | 6.60e-01 | 1.00e+00 | 2ID1, TGFBR2 |
144 |
| HALLMARK_APOPTOSIS | 1.32e-01 | 3.28 | 0.38 | 6.60e-01 | 1.00e+00 | 2EMP1, SAT1 |
161 |
| HALLMARK_ESTROGEN_RESPONSE_EARLY | 1.85e-01 | 2.63 | 0.31 | 6.60e-01 | 1.00e+00 | 2HES1, MAST4 |
200 |
| HALLMARK_COMPLEMENT | 1.85e-01 | 2.63 | 0.31 | 6.60e-01 | 1.00e+00 | 2NOTCH4, COL4A2 |
200 |
| HALLMARK_INFLAMMATORY_RESPONSE | 1.85e-01 | 2.63 | 0.31 | 6.60e-01 | 1.00e+00 | 2CALCRL, PTPRE |
200 |
| HALLMARK_KRAS_SIGNALING_UP | 1.85e-01 | 2.63 | 0.31 | 6.60e-01 | 1.00e+00 | 2EMP1, PLVAP |
200 |
| HALLMARK_NOTCH_SIGNALING | 1.20e-01 | 8.23 | 0.20 | 6.60e-01 | 1.00e+00 | 1HES1 |
32 |
| HALLMARK_ANGIOGENESIS | 1.34e-01 | 7.29 | 0.18 | 6.60e-01 | 1.00e+00 | 1STC1 |
36 |
| HALLMARK_WNT_BETA_CATENIN_SIGNALING | 1.54e-01 | 6.22 | 0.15 | 6.60e-01 | 1.00e+00 | 1NOTCH4 |
42 |
| HALLMARK_ANDROGEN_RESPONSE | 3.28e-01 | 2.58 | 0.06 | 1.00e+00 | 1.00e+00 | 1SAT1 |
100 |
| HALLMARK_COAGULATION | 4.22e-01 | 1.86 | 0.05 | 1.00e+00 | 1.00e+00 | 1VWF |
138 |
| HALLMARK_FATTY_ACID_METABOLISM | 4.66e-01 | 1.62 | 0.04 | 1.00e+00 | 1.00e+00 | 1PTPRG |
158 |
| HALLMARK_IL2_STAT5_SIGNALING | 5.45e-01 | 1.29 | 0.03 | 1.00e+00 | 1.00e+00 | 1EMP1 |
199 |
| HALLMARK_HYPOXIA | 5.47e-01 | 1.28 | 0.03 | 1.00e+00 | 1.00e+00 | 1STC1 |
200 |
| HALLMARK_ADIPOGENESIS | 5.47e-01 | 1.28 | 0.03 | 1.00e+00 | 1.00e+00 | 1COL4A1 |
200 |
Dowload full table
KEGG Pathways:
| P-value | OR | Lower 95% CI | FDR | FWER | Genes Found | Gene Set Size | |
|---|---|---|---|---|---|---|---|
| KEGG_NOTCH_SIGNALING_PATHWAY | 8.44e-04 | 18.11 | 3.48 | 5.23e-02 | 1.57e-01 | 3DLL4, HES1, NOTCH4 |
47 |
| KEGG_ECM_RECEPTOR_INTERACTION | 3.32e-04 | 13.58 | 3.47 | 3.09e-02 | 6.17e-02 | 4HSPG2, VWF, COL4A1, COL4A2 |
84 |
| KEGG_FOCAL_ADHESION | 1.20e-04 | 8.83 | 3.04 | 2.24e-02 | 2.24e-02 | 6FLT1, VWF, VEGFC, COL4A1, COL4A2, KDR |
199 |
| KEGG_PATHWAYS_IN_CANCER | 8.32e-03 | 4.34 | 1.34 | 3.87e-01 | 1.00e+00 | 5MECOM, VEGFC, COL4A1, TGFBR2, COL4A2 |
325 |
| KEGG_CYTOKINE_CYTOKINE_RECEPTOR_INTERACTION | 1.96e-02 | 4.16 | 1.08 | 6.21e-01 | 1.00e+00 | 4FLT1, VEGFC, TGFBR2, KDR |
265 |
| KEGG_MAPK_SIGNALING_PATHWAY | 2.00e-02 | 4.13 | 1.07 | 6.21e-01 | 1.00e+00 | 4MECOM, MEF2C, TGFBR2, RASGRP3 |
267 |
| KEGG_PANCREATIC_CANCER | 3.13e-02 | 7.66 | 0.88 | 6.99e-01 | 1.00e+00 | 2VEGFC, TGFBR2 |
70 |
| KEGG_ADHERENS_JUNCTION | 3.38e-02 | 7.33 | 0.85 | 6.99e-01 | 1.00e+00 | 2INSR, TGFBR2 |
73 |
| KEGG_CHRONIC_MYELOID_LEUKEMIA | 3.38e-02 | 7.33 | 0.85 | 6.99e-01 | 1.00e+00 | 2MECOM, TGFBR2 |
73 |
| KEGG_SMALL_CELL_LUNG_CANCER | 4.36e-02 | 6.35 | 0.74 | 7.68e-01 | 1.00e+00 | 2COL4A1, COL4A2 |
84 |
| KEGG_TGF_BETA_SIGNALING_PATHWAY | 4.54e-02 | 6.20 | 0.72 | 7.68e-01 | 1.00e+00 | 2ID1, TGFBR2 |
86 |
| KEGG_VASCULAR_SMOOTH_MUSCLE_CONTRACTION | 7.56e-02 | 4.61 | 0.54 | 1.00e+00 | 1.00e+00 | 2CALCRL, ADCY4 |
115 |
| KEGG_PURINE_METABOLISM | 1.29e-01 | 3.32 | 0.39 | 1.00e+00 | 1.00e+00 | 2PDE4D, ADCY4 |
159 |
| KEGG_ENDOCYTOSIS | 1.59e-01 | 2.91 | 0.34 | 1.00e+00 | 1.00e+00 | 2FLT1, KDR |
181 |
| KEGG_DORSO_VENTRAL_AXIS_FORMATION | 9.13e-02 | 11.08 | 0.26 | 1.00e+00 | 1.00e+00 | 1NOTCH4 |
24 |
| KEGG_MATURITY_ONSET_DIABETES_OF_THE_YOUNG | 9.49e-02 | 10.62 | 0.25 | 1.00e+00 | 1.00e+00 | 1HES1 |
25 |
| KEGG_ALDOSTERONE_REGULATED_SODIUM_REABSORPTION | 1.54e-01 | 6.22 | 0.15 | 1.00e+00 | 1.00e+00 | 1INSR |
42 |
| KEGG_BLADDER_CANCER | 1.54e-01 | 6.22 | 0.15 | 1.00e+00 | 1.00e+00 | 1VEGFC |
42 |
| KEGG_TYPE_II_DIABETES_MELLITUS | 1.71e-01 | 5.54 | 0.13 | 1.00e+00 | 1.00e+00 | 1INSR |
47 |
| KEGG_TASTE_TRANSDUCTION | 1.87e-01 | 5.00 | 0.12 | 1.00e+00 | 1.00e+00 | 1ADCY4 |
52 |
Dowload full table
CHR Positional Gene Sets:
| P-value | OR | Lower 95% CI | FDR | FWER | Genes Found | Gene Set Size | |
|---|---|---|---|---|---|---|---|
| chr5q12 | 2.50e-02 | 8.68 | 1.00 | 1.00e+00 | 1.00e+00 | 2MAST4, PDE4D |
62 |
| chr4q12 | 3.90e-02 | 6.76 | 0.78 | 1.00e+00 | 1.00e+00 | 2IGFBP7, KDR |
79 |
| chr5q11 | 4.45e-02 | 6.27 | 0.73 | 1.00e+00 | 1.00e+00 | 2ARL15, ESM1 |
85 |
| chr2p22 | 5.73e-02 | 5.42 | 0.63 | 1.00e+00 | 1.00e+00 | 2CRIM1, RASGRP3 |
98 |
| chr3p14 | 8.36e-02 | 4.34 | 0.51 | 1.00e+00 | 1.00e+00 | 2ADAMTS9, PTPRG |
122 |
| chr12p13 | 1.39e-01 | 2.42 | 0.48 | 1.00e+00 | 1.00e+00 | 3ANO2, VWF, EMP1 |
333 |
| chr3q25 | 1.20e-01 | 3.47 | 0.41 | 1.00e+00 | 1.00e+00 | 2WWTR1, TM4SF1 |
152 |
| chr6q25 | 1.23e-01 | 3.43 | 0.40 | 1.00e+00 | 1.00e+00 | 2MYCT1, PLEKHG1 |
154 |
| chr4q24 | 2.00e-01 | 4.64 | 0.11 | 1.00e+00 | 1.00e+00 | 1EMCN |
56 |
| chr7p12 | 2.06e-01 | 4.47 | 0.11 | 1.00e+00 | 1.00e+00 | 1GRB10 |
58 |
| chr5q15 | 2.13e-01 | 4.32 | 0.11 | 1.00e+00 | 1.00e+00 | 1MCTP1 |
60 |
| chr8q13 | 2.46e-01 | 3.64 | 0.09 | 1.00e+00 | 1.00e+00 | 1PREX2 |
71 |
| chr16q21 | 2.55e-01 | 3.49 | 0.09 | 1.00e+00 | 1.00e+00 | 1CDH5 |
74 |
| chr19p13 | 1.00e+00 | 0.68 | 0.08 | 1.00e+00 | 1.00e+00 | 2INSR, PLVAP |
773 |
| chr1p21 | 3.25e-01 | 2.60 | 0.06 | 1.00e+00 | 1.00e+00 | 1PALMD |
99 |
| chr3p24 | 3.25e-01 | 2.60 | 0.06 | 1.00e+00 | 1.00e+00 | 1TGFBR2 |
99 |
| chr14q12 | 3.31e-01 | 2.55 | 0.06 | 1.00e+00 | 1.00e+00 | 1ADCY4 |
101 |
| chr2q32 | 3.49e-01 | 2.38 | 0.06 | 1.00e+00 | 1.00e+00 | 1CALCRL |
108 |
| chr21q21 | 3.77e-01 | 2.16 | 0.05 | 1.00e+00 | 1.00e+00 | 1CYYR1 |
119 |
| chr3q29 | 3.84e-01 | 2.11 | 0.05 | 1.00e+00 | 1.00e+00 | 1HES1 |
122 |
Dowload full table
Transcription Factor Targets:
| P-value | OR | Lower 95% CI | FDR | FWER | Genes Found | Gene Set Size | |
|---|---|---|---|---|---|---|---|
| STAT6_02 | 6.64e-06 | 9.45 | 3.79 | 3.12e-03 | 7.53e-03 | 8FLT1, EGFL7, MEF2C, RHOJ, NOTCH4, ERG, FLI1, PDE4D |
260 |
| STAT4_01 | 8.26e-06 | 9.16 | 3.68 | 3.12e-03 | 9.36e-03 | 8FLT1, MECOM, MEF2C, RHOJ, NOTCH4, ERG, FLI1, PDE4D |
268 |
| GATA1_05 | 1.25e-05 | 8.63 | 3.47 | 3.54e-03 | 1.42e-02 | 8MECOM, EGFL7, STC1, MYCT1, HES1, ERG, FLI1, PTPRG |
284 |
| RYTTCCTG_ETS2_B | 1.99e-07 | 5.89 | 3.06 | 2.26e-04 | 2.26e-04 | 17FLT1, DLL4, LDB2, EGFL7, MEF2C, CALCRL, MYCT1, RHOJ, NOTCH4, ERG, GRB10, TGFBR2, CDH5, PDE4D, RASGRP3, PTPRG, ADCY4 |
1112 |
| FOXJ2_02 | 3.49e-04 | 7.19 | 2.48 | 5.98e-02 | 3.95e-01 | 6MECOM, CRIM1, ERG, IGFBP7, ID1, PDE4D |
243 |
| YRCCAKNNGNCGC_UNKNOWN | 2.25e-03 | 12.65 | 2.46 | 1.50e-01 | 1.00e+00 | 3DLL4, HES1, PTPRE |
66 |
| NFAT_Q6 | 3.96e-04 | 7.01 | 2.42 | 5.98e-02 | 4.49e-01 | 6DLL4, PREX2, HSPG2, EMP1, ERG, PDE4D |
249 |
| IRF7_01 | 4.77e-04 | 6.76 | 2.33 | 5.98e-02 | 5.40e-01 | 6DLL4, LDB2, ERG, SAT1, FLI1, PDE4D |
258 |
| CEBPGAMMA_Q6 | 4.86e-04 | 6.74 | 2.32 | 5.98e-02 | 5.51e-01 | 6LDB2, MEF2C, STC1, FLI1, RASGRP3, PTPRG |
259 |
| OCT1_06 | 5.80e-04 | 6.51 | 2.25 | 5.98e-02 | 6.58e-01 | 6MECOM, LDB2, STC1, PALMD, SAT1, PDE4D |
268 |
| HFH3_01 | 9.88e-04 | 7.27 | 2.23 | 8.84e-02 | 1.00e+00 | 5MEF2C, PALMD, CRIM1, ID1, FLI1 |
196 |
| GNCF_01 | 3.61e-03 | 10.64 | 2.07 | 1.59e-01 | 1.00e+00 | 3FLT1, MEF2C, INSR |
78 |
| HNF3ALPHA_Q6 | 1.36e-03 | 6.74 | 2.07 | 1.03e-01 | 1.00e+00 | 5MEF2C, PALMD, ID1, PDE4D, PTPRG |
211 |
| GATAAGR_GATA_C | 1.01e-03 | 5.82 | 2.01 | 8.84e-02 | 1.00e+00 | 6MECOM, MEF2C, STC1, MYCT1, ERG, FLI1 |
299 |
| ALX4_TARGET_GENES | 7.12e-03 | 17.34 | 1.95 | 2.24e-01 | 1.00e+00 | 2MEF2C, PDE4D |
32 |
| TGANTCA_AP1_C | 1.65e-04 | 3.90 | 1.90 | 3.73e-02 | 1.87e-01 | 13MECOM, MEF2C, HSPG2, STC1, MCTP1, EMP1, NOTCH4, DYSF, SAT1, TGFBR2, CDH5, FLI1, PDE4D |
1139 |
| FREAC4_01 | 3.03e-03 | 7.29 | 1.88 | 1.51e-01 | 1.00e+00 | 4HSPG2, EMP1, MAST4, ERG |
153 |
| BRN2_01 | 2.38e-03 | 5.91 | 1.81 | 1.50e-01 | 1.00e+00 | 5MECOM, RHOJ, ERG, SAT1, PTPRG |
240 |
| GATA1_03 | 2.64e-03 | 5.76 | 1.77 | 1.51e-01 | 1.00e+00 | 5MECOM, MEF2C, HES1, ERG, RASGRP3 |
246 |
| ELF1_Q6 | 2.78e-03 | 5.69 | 1.75 | 1.51e-01 | 1.00e+00 | 5CALCRL, ESM1, SAT1, CDH5, RASGRP3 |
249 |
Dowload full table
GO Biological Processes:
| P-value | OR | Lower 95% CI | FDR | FWER | Genes Found | Gene Set Size | |
|---|---|---|---|---|---|---|---|
| GOBP_BRANCHING_INVOLVED_IN_BLOOD_VESSEL_MORPHOGENESIS | 2.06e-07 | 47.76 | 13.82 | 1.92e-04 | 1.54e-03 | 5DLL4, NOTCH4, COL4A1, TGFBR2, KDR |
34 |
| GOBP_NEGATIVE_REGULATION_OF_ENDOTHELIAL_CELL_DIFFERENTIATION | 8.35e-04 | 57.69 | 5.91 | 1.21e-01 | 1.00e+00 | 2NOTCH4, ID1 |
11 |
| GOBP_RETINA_VASCULATURE_MORPHOGENESIS_IN_CAMERA_TYPE_EYE | 8.35e-04 | 57.69 | 5.91 | 1.21e-01 | 1.00e+00 | 2RHOJ, COL4A1 |
11 |
| GOBP_ENDOTHELIUM_DEVELOPMENT | 9.96e-07 | 15.65 | 5.83 | 6.14e-04 | 7.45e-03 | 7DLL4, STC1, NOTCH4, ID1, CDH5, KDR, PDE4D |
137 |
| GOBP_BLOOD_VESSEL_MORPHOGENESIS | 1.80e-11 | 10.68 | 5.61 | 7.04e-08 | 1.35e-07 | 18FLT1, DLL4, EGFL7, CALCRL, ADAMTS9, HSPG2, ESM1, VEGFC, HES1, RHOJ, NOTCH4, COL4A1, SAT1, ID1, TGFBR2, COL4A2, CDH5, KDR |
677 |
| GOBP_COLLAGEN_ACTIVATED_TYROSINE_KINASE_RECEPTOR_SIGNALING_PATHWAY | 9.99e-04 | 51.89 | 5.39 | 1.30e-01 | 1.00e+00 | 2COL4A1, COL4A2 |
12 |
| GOBP_VASCULATURE_DEVELOPMENT | 1.88e-11 | 10.00 | 5.31 | 7.04e-08 | 1.41e-07 | 19FLT1, DLL4, EGFL7, MEF2C, CALCRL, ADAMTS9, HSPG2, ESM1, VEGFC, HES1, RHOJ, NOTCH4, COL4A1, SAT1, ID1, TGFBR2, COL4A2, CDH5, KDR |
786 |
| GOBP_AORTA_MORPHOGENESIS | 2.96e-04 | 26.56 | 5.01 | 6.16e-02 | 1.00e+00 | 3DLL4, ADAMTS9, HES1 |
33 |
| GOBP_ENDOTHELIAL_CELL_MORPHOGENESIS | 1.18e-03 | 47.19 | 4.96 | 1.42e-01 | 1.00e+00 | 2STC1, NOTCH4 |
13 |
| GOBP_HEART_VALVE_DEVELOPMENT | 9.66e-05 | 19.05 | 4.82 | 2.58e-02 | 7.23e-01 | 4DLL4, MEF2C, ADAMTS9, TGFBR2 |
61 |
| GOBP_TUBE_MORPHOGENESIS | 1.68e-10 | 8.71 | 4.63 | 4.20e-07 | 1.26e-06 | 19FLT1, DLL4, EGFL7, MEF2C, CALCRL, ADAMTS9, HSPG2, ESM1, VEGFC, HES1, RHOJ, NOTCH4, COL4A1, SAT1, ID1, TGFBR2, COL4A2, CDH5, KDR |
900 |
| GOBP_TISSUE_MIGRATION | 1.10e-07 | 9.96 | 4.56 | 1.18e-04 | 8.23e-04 | 11DLL4, MEF2C, ADAMTS9, STC1, VEGFC, RHOJ, ID1, TGFBR2, CDH5, KDR, PTPRG |
365 |
| GOBP_BLOOD_VESSEL_ENDOTHELIAL_CELL_MIGRATION | 5.01e-06 | 12.11 | 4.53 | 2.34e-03 | 3.75e-02 | 7DLL4, MEF2C, VEGFC, RHOJ, ID1, CDH5, KDR |
175 |
| GOBP_ENDOTHELIAL_CELL_DEVELOPMENT | 1.31e-04 | 17.51 | 4.45 | 3.28e-02 | 9.83e-01 | 4STC1, NOTCH4, CDH5, PDE4D |
66 |
| GOBP_ENDOTHELIAL_CELL_MIGRATION | 1.07e-06 | 10.20 | 4.31 | 6.14e-04 | 7.98e-03 | 9DLL4, MEF2C, ADAMTS9, STC1, VEGFC, RHOJ, ID1, CDH5, KDR |
278 |
| GOBP_GROWTH_PLATE_CARTILAGE_DEVELOPMENT | 1.58e-03 | 39.95 | 4.27 | 1.66e-01 | 1.00e+00 | 2STC1, TGFBR2 |
15 |
| GOBP_COLLAGEN_ACTIVATED_SIGNALING_PATHWAY | 1.58e-03 | 39.95 | 4.27 | 1.66e-01 | 1.00e+00 | 2COL4A1, COL4A2 |
15 |
| GOBP_HEMATOPOIETIC_STEM_CELL_HOMEOSTASIS | 1.58e-03 | 39.95 | 4.27 | 1.66e-01 | 1.00e+00 | 2EMCN, MYCT1 |
15 |
| GOBP_NEPHRON_TUBULE_EPITHELIAL_CELL_DIFFERENTIATION | 1.58e-03 | 39.95 | 4.27 | 1.66e-01 | 1.00e+00 | 2MEF2C, WWTR1 |
15 |
| GOBP_TUBE_DEVELOPMENT | 4.09e-10 | 7.83 | 4.20 | 7.66e-07 | 3.06e-06 | 20FLT1, DLL4, EGFL7, MEF2C, WWTR1, CALCRL, ADAMTS9, HSPG2, ESM1, VEGFC, HES1, RHOJ, NOTCH4, COL4A1, SAT1, ID1, TGFBR2, COL4A2, CDH5, KDR |
1085 |
Dowload full table
Immunological Gene Sets:
| P-value | OR | Lower 95% CI | FDR | FWER | Genes Found | Gene Set Size | |
|---|---|---|---|---|---|---|---|
| GSE21379_WT_VS_SAP_KO_TFH_CD4_TCELL_UP | 9.73e-07 | 12.40 | 4.96 | 4.74e-03 | 4.74e-03 | 8LDB2, RHOJ, TM4SF1, COL4A1, COL4A2, CDH5, KDR, ADCY4 |
200 |
| GSE9509_LPS_VS_LPS_AND_IL10_STIM_IL10_KO_MACROPHAGE_30MIN_UP | 1.14e-04 | 8.92 | 3.07 | 1.90e-01 | 5.55e-01 | 6CALCRL, EMP1, MYCT1, NOTCH4, MAST4, CYYR1 |
197 |
| GSE6259_BCELL_VS_CD8_TCELL_DN | 1.17e-04 | 8.88 | 3.05 | 1.90e-01 | 5.71e-01 | 6MYCT1, HES1, ERG, GRB10, COL4A2, PTPRE |
198 |
| GSE6259_33D1_POS_VS_DEC205_POS_SPLENIC_DC_UP | 9.23e-04 | 7.39 | 2.26 | 5.84e-01 | 1.00e+00 | 5MEF2C, MYCT1, HES1, ERG, ADCY4 |
193 |
| GSE9509_LPS_VS_LPS_AND_IL10_STIM_IL10_KO_MACROPHAGE_20MIN_UP | 9.44e-04 | 7.35 | 2.25 | 5.84e-01 | 1.00e+00 | 5MECOM, WWTR1, MYCT1, NOTCH4, ERG |
194 |
| GSE43863_NAIVE_VS_TFH_CD4_EFF_TCELL_D6_LCMV_UP | 9.88e-04 | 7.27 | 2.23 | 5.84e-01 | 1.00e+00 | 5LDB2, EMP1, RHOJ, ID1, PTPRE |
196 |
| GSE22229_UNTREATED_VS_IMMUNOSUPP_THERAPY_RENAL_TRANSPLANT_PATIENT_PBMC_DN | 1.06e-03 | 7.16 | 2.19 | 5.84e-01 | 1.00e+00 | 5MYCT1, COL4A1, GRB10, COL4A2, BTNL9 |
199 |
| GSE3039_CD4_TCELL_VS_B2_BCELL_UP | 1.08e-03 | 7.12 | 2.18 | 5.84e-01 | 1.00e+00 | 5ARL15, MCTP1, ERG, PDE4D, BTNL9 |
200 |
| GSE21774_CD56_BRIGHT_VS_DIM_CD62L_POSITIVE_NK_CELL_UP | 1.08e-03 | 7.12 | 2.18 | 5.84e-01 | 1.00e+00 | 5MECOM, VWF, INSR, MAST4, GRB10 |
200 |
| GSE40274_CTRL_VS_XBP1_TRANSDUCED_ACTIVATED_CD4_TCELL_UP | 4.49e-03 | 6.51 | 1.68 | 9.16e-01 | 1.00e+00 | 4CALCRL, HES1, MAST4, CDH5 |
171 |
| GSE26488_CTRL_VS_PEPTIDE_INJECTION_OT2_THYMOCYTE_DN | 5.68e-03 | 6.07 | 1.57 | 9.16e-01 | 1.00e+00 | 4MEF2C, ID1, FLI1, RASGRP3 |
183 |
| GSE37605_FOXP3_FUSION_GFP_VS_IRES_GFP_TREG_C57BL6_UP | 5.90e-03 | 6.00 | 1.55 | 9.16e-01 | 1.00e+00 | 4TM4SF1, ID1, PDE4D, CYYR1 |
185 |
| GSE4748_CYANOBACTERIUM_LPSLIKE_VS_LPS_AND_CYANOBACTERIUM_LPSLIKE_STIM_DC_3H_DN | 6.95e-03 | 5.72 | 1.48 | 9.16e-01 | 1.00e+00 | 4STC1, DYSF, ERG, ADCY4 |
194 |
| GSE1460_INTRATHYMIC_T_PROGENITOR_VS_DP_THYMOCYTE_DN | 7.32e-03 | 5.63 | 1.46 | 9.16e-01 | 1.00e+00 | 4VEGFC, MAST4, TGFBR2, PDE4D |
197 |
| GSE22886_NAIVE_TCELL_VS_NKCELL_DN | 7.32e-03 | 5.63 | 1.46 | 9.16e-01 | 1.00e+00 | 4LDB2, CRIM1, IGFBP7, PTPRE |
197 |
| GSE36888_UNTREATED_VS_IL2_TREATED_TCELL_2H_UP | 7.32e-03 | 5.63 | 1.46 | 9.16e-01 | 1.00e+00 | 4HES1, NOTCH4, PLVAP, SAT1 |
197 |
| GSE22886_TH1_VS_TH2_48H_ACT_UP | 7.45e-03 | 5.60 | 1.45 | 9.16e-01 | 1.00e+00 | 4PREX2, VWF, EMP1, ERG |
198 |
| GSE21670_UNTREATED_VS_TGFB_TREATED_CD4_TCELL_DN | 7.45e-03 | 5.60 | 1.45 | 9.16e-01 | 1.00e+00 | 4MYCT1, COL4A1, TGFBR2, COL4A2 |
198 |
| GSE3039_B2_VS_B1_BCELL_UP | 7.58e-03 | 5.57 | 1.44 | 9.16e-01 | 1.00e+00 | 4ARL15, HES1, CRIM1, RASGRP3 |
199 |
| GSE5589_WT_VS_IL6_KO_LPS_AND_IL6_STIM_MACROPHAGE_45MIN_DN | 7.58e-03 | 5.57 | 1.44 | 9.16e-01 | 1.00e+00 | 4TM4SF1, COL4A1, GRB10, COL4A2 |
199 |
Top Ranked Transcription Factors for this Gene Expression Program:
| Gene Symbol | TF Rank | DNA Binding Domain | Motif Status | IUPAC PWM | GTEx | DepMap | Decartes |
|---|---|---|---|---|---|---|---|
| MECOM | 2 | Yes | Known motif | Monomer or homomultimer | In vivo/Misc source | Only known motifs are from Transfac or HocoMoco - origin is uncertain | None |
| PREX2 | 6 | No | Unlikely to be sequence specific TF | Not a DNA binding protein | No motif | None | None |
| MEF2C | 7 | Yes | Known motif | Monomer or homomultimer | High-throughput in vitro | None | None |
| WWTR1 | 10 | No | Unlikely to be sequence specific TF | Not a DNA binding protein | No motif | None | Transcriptional co-activator that binds to TEADs (PMID: 19324877) and TBX5 (PMID: 16332960) |
| HES1 | 23 | Yes | Known motif | Monomer or homomultimer | High-throughput in vitro | None | None |
| ERG | 34 | Yes | Known motif | Monomer or homomultimer | High-throughput in vitro | None | None |
| ID1 | 38 | No | Unlikely to be sequence specific TF | Not a DNA binding protein | No motif | None | ID bHLH proteins lack the basic region and should not be able to bind DNA. The HT-SELEX motif for ID4 is likely by a co-precipitated protein or it is a contamination |
| FLI1 | 43 | Yes | Known motif | Monomer or homomultimer | High-throughput in vitro | None | None |
| FOSL1 | 59 | Yes | Known motif | Monomer or homomultimer | High-throughput in vitro | None | None |
| ZFP36 | 61 | No | ssDNA/RNA binding | Not a DNA binding protein | No motif | None | RNA binding protein (PMID: 10330172). |
| ETS1 | 71 | Yes | Known motif | Monomer or homomultimer | High-throughput in vitro | None | None |
| EDN1 | 74 | No | Unlikely to be sequence specific TF | Not a DNA binding protein | No motif | None | Protein that is processed into a secreted signaling peptide |
| PRKCH | 75 | No | Unlikely to be sequence specific TF | Not a DNA binding protein | No motif | None | Protein is a kinase that activates another kinase leading to degradation of NFKB inhibitor NFKBIA (PMID: 21820409) |
| PLXND1 | 76 | No | Unlikely to be sequence specific TF | Not a DNA binding protein | No motif | None | Protein is a semaphorin receptor that operates far upstream on the signaling cascade. |
| FOXO1 | 78 | Yes | Known motif | Monomer or homomultimer | High-throughput in vitro | None | None |
| EPAS1 | 95 | Yes | Known motif | Monomer or homomultimer | In vivo/Misc source | Only known motifs are from Transfac or HocoMoco - origin is uncertain | None |
| RAPGEF5 | 98 | No | Unlikely to be sequence specific TF | Not a DNA binding protein | No motif | None | None |
| NFIA | 111 | Yes | Known motif | Monomer or homomultimer | High-throughput in vitro | None | None |
| ELK3 | 116 | Yes | Known motif | Monomer or homomultimer | High-throughput in vitro | None | None |
| TCF7L1 | 124 | Yes | Known motif | Monomer or homomultimer | High-throughput in vitro | None | None |
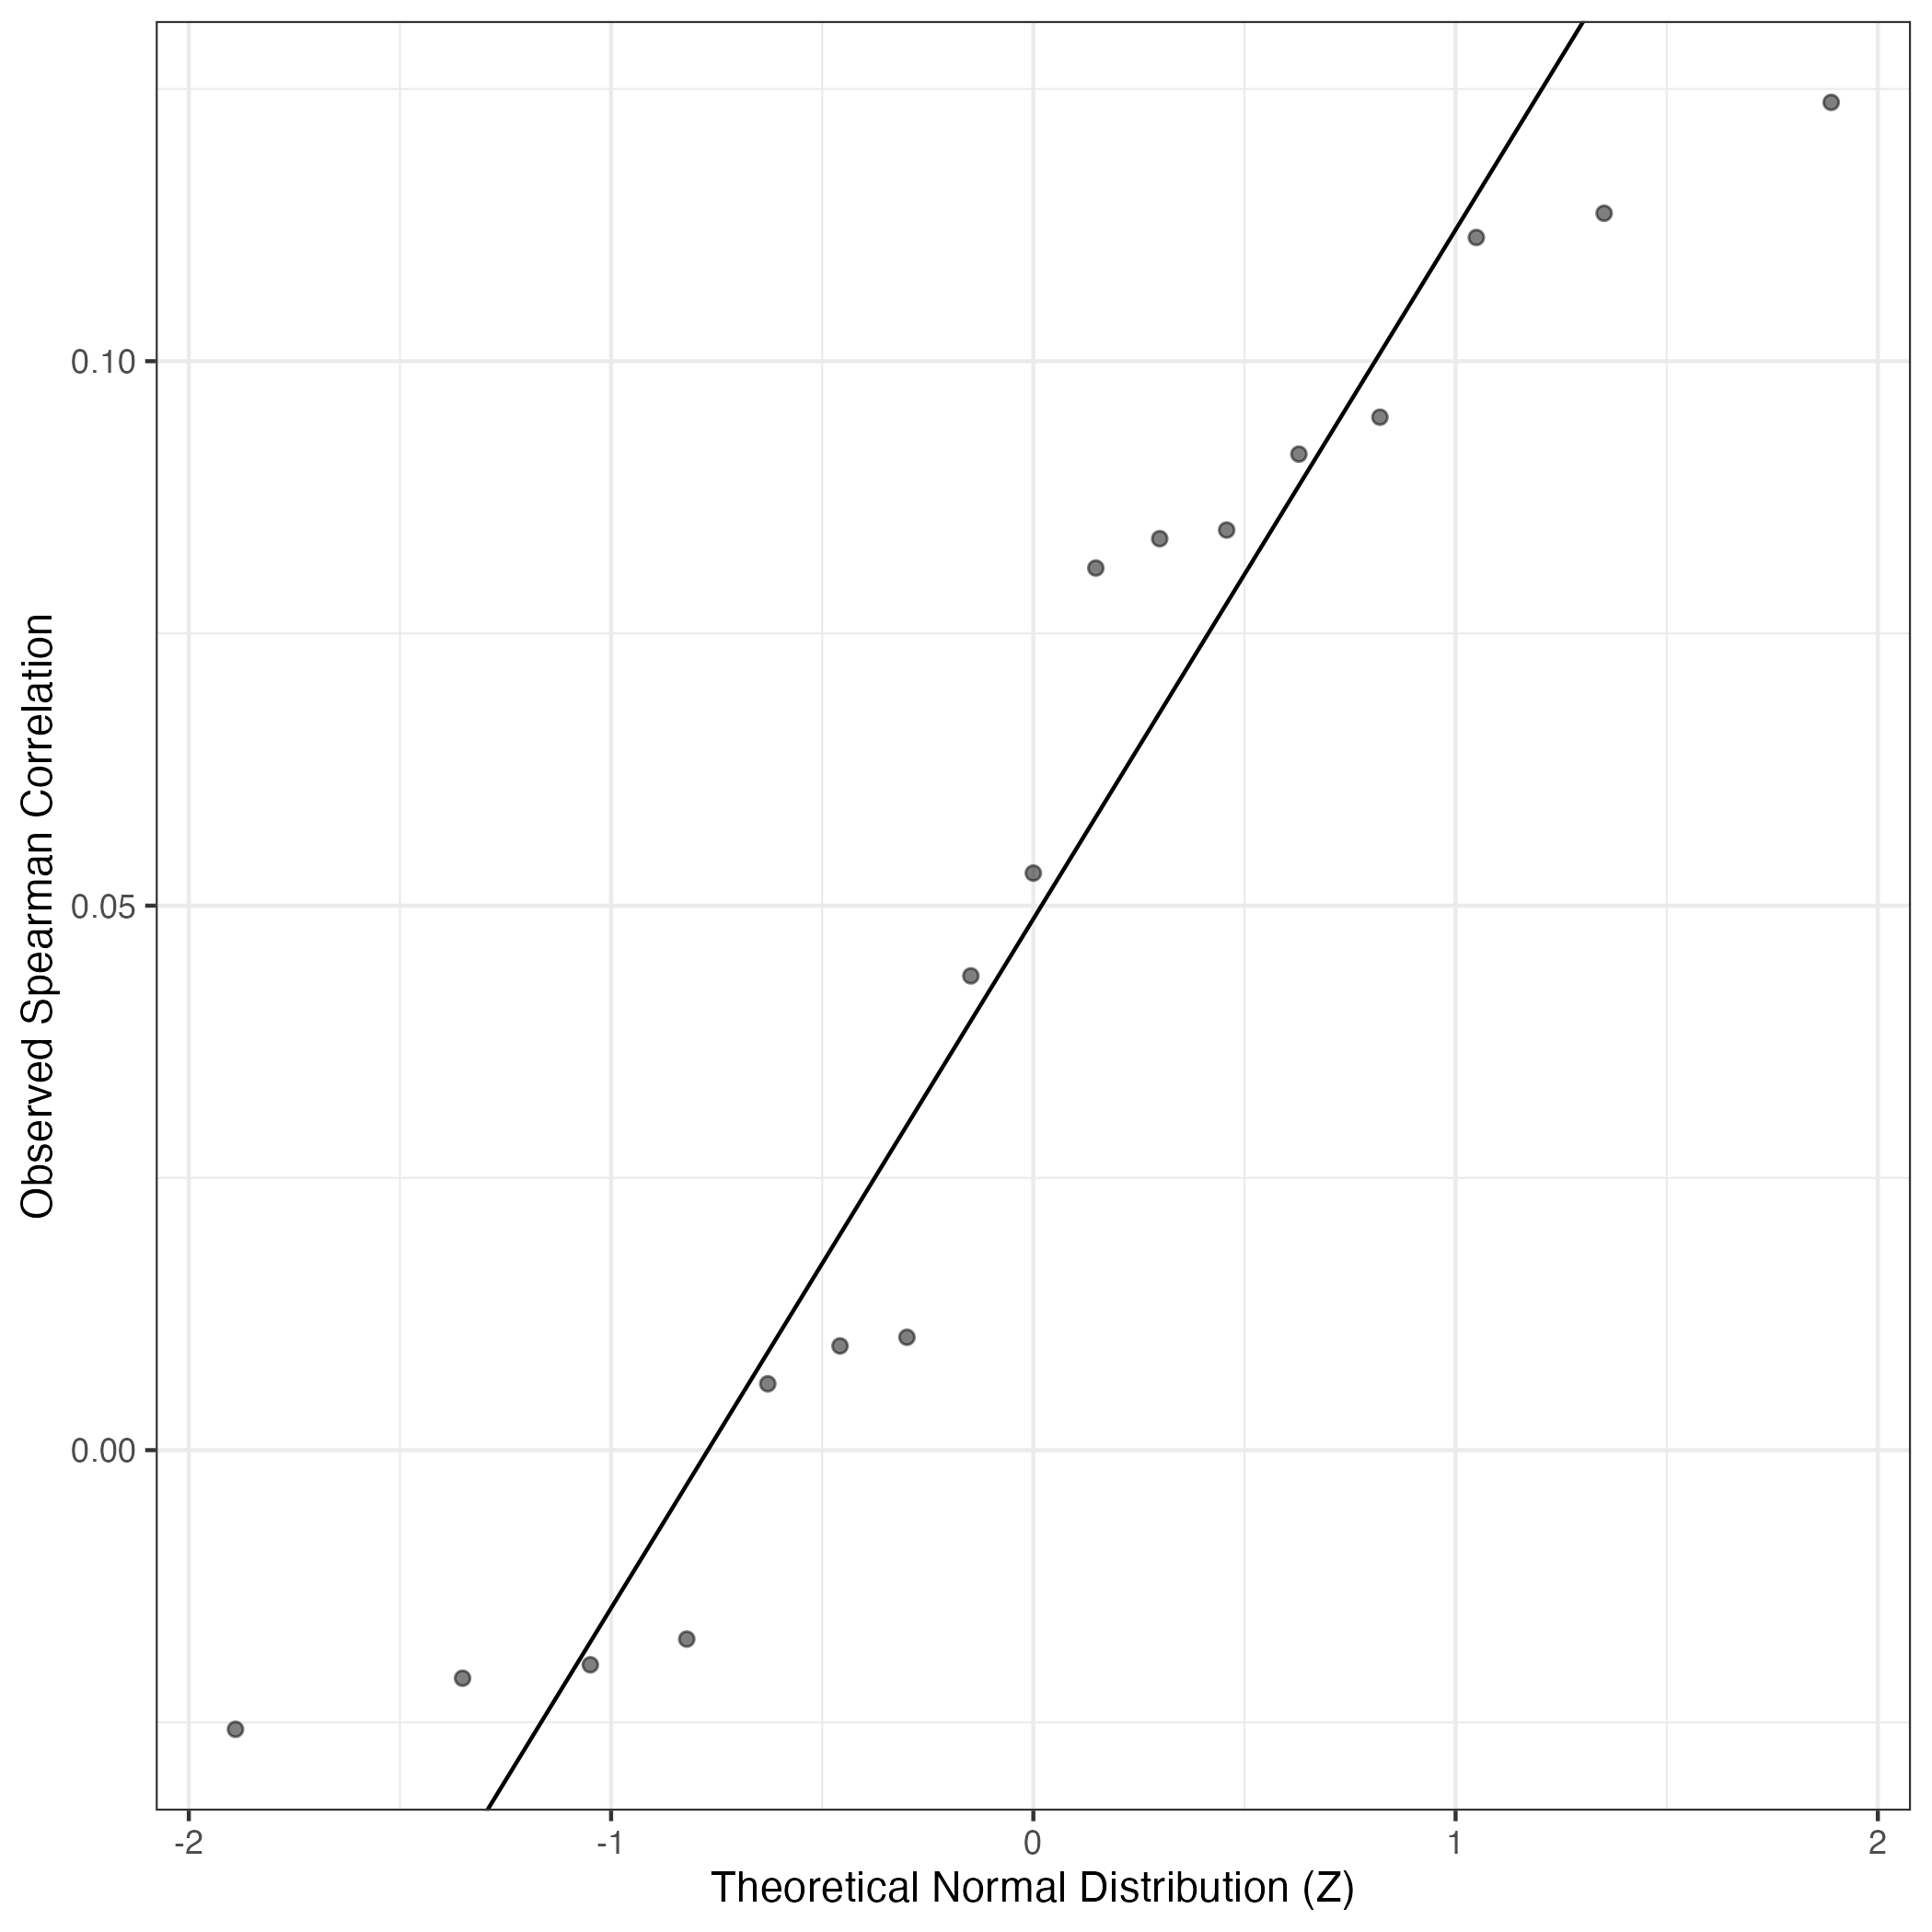
QQ Plot showing correlations with other Gene Expression Programs in this dataset, calculated by Spearman correlation:
Interactive QQ-plot of gene loadings:
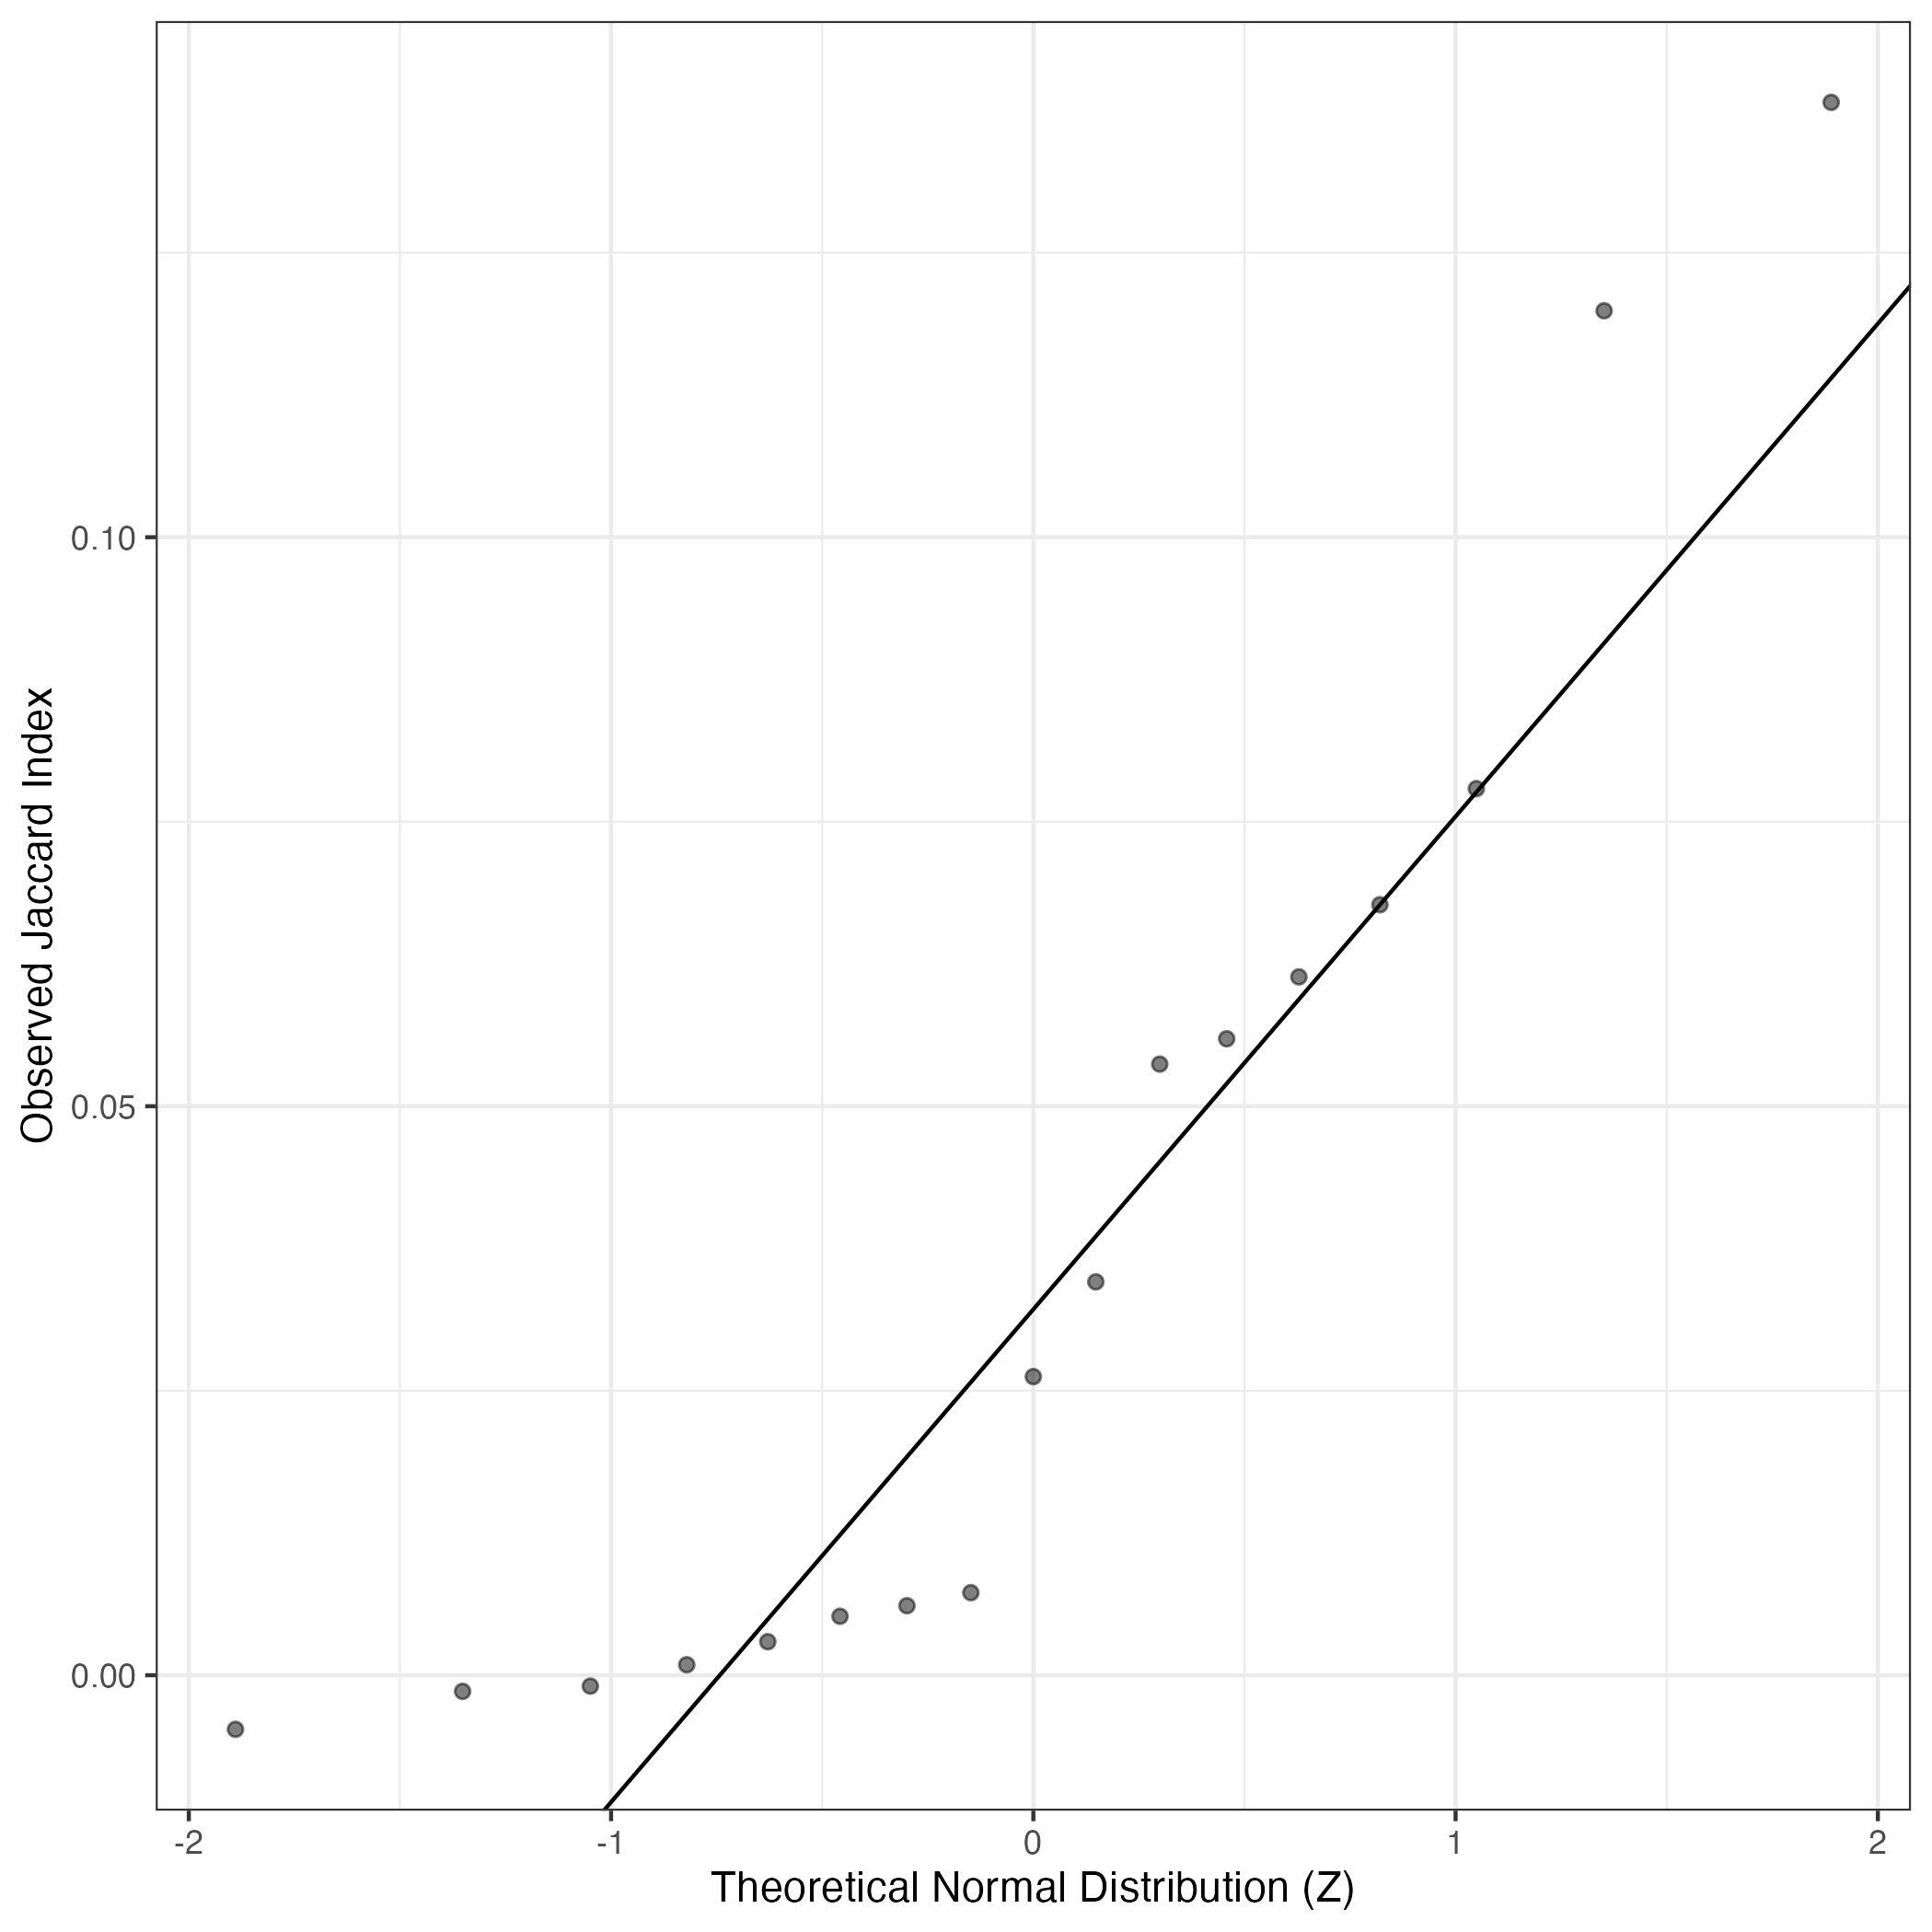
A similar QQ-plot as above, but only for instances where the H value is e.g. > 25, i.e. we are confident that the expression program is active above noise. Agreemenet between these binary vectors is tested using the Jaccard Index, with the P-values calculated by an exact test:
Interactive QQ-plot:
Singler cell type annotations for the top 50 cells on this program.
| Cell ID | Singler label | Singler Delta | Activity Score | Top Singler Raw Scores |
|---|---|---|---|---|
| NB09_GGCGACTGTAAATACG-1 | Neurons:adrenal_medulla_cell_line | 0.10 | 1410.10 | Raw ScoresEndothelial_cells:HUVEC:VEGF: 0.27, Endothelial_cells:lymphatic: 0.27, Endothelial_cells:HUVEC:Serum_Amyloid_A: 0.27, Endothelial_cells:lymphatic:TNFa_48h: 0.26, Endothelial_cells:HUVEC: 0.26, Endothelial_cells:blood_vessel: 0.26, Endothelial_cells:HUVEC:B._anthracis_LT: 0.25, Endothelial_cells:lymphatic:KSHV: 0.25, Endothelial_cells:HUVEC:IL-1b: 0.25, Astrocyte:Embryonic_stem_cell-derived: 0.25 |
| NB09_TTGGCAAGTCAGAAGC-1 | Endothelial_cells:blood_vessel | 0.13 | 1095.57 | Raw ScoresEndothelial_cells:lymphatic: 0.28, Endothelial_cells:HUVEC:Serum_Amyloid_A: 0.27, Endothelial_cells:lymphatic:TNFa_48h: 0.27, Endothelial_cells:HUVEC:VEGF: 0.27, Endothelial_cells:lymphatic:KSHV: 0.26, Endothelial_cells:HUVEC: 0.26, Endothelial_cells:blood_vessel: 0.26, Endothelial_cells:HUVEC:IL-1b: 0.25, Endothelial_cells:HUVEC:B._anthracis_LT: 0.25, Endothelial_cells:HUVEC:H5N1-infected: 0.24 |
| NB14_ATGAGGGTCCCGGATG-1 | Endothelial_cells:lymphatic:KSHV | 0.16 | 979.92 | Raw ScoresEndothelial_cells:lymphatic: 0.3, Endothelial_cells:HUVEC:VEGF: 0.3, Endothelial_cells:HUVEC:Serum_Amyloid_A: 0.29, Endothelial_cells:lymphatic:KSHV: 0.29, Endothelial_cells:lymphatic:TNFa_48h: 0.29, Endothelial_cells:HUVEC: 0.29, Endothelial_cells:blood_vessel: 0.29, Endothelial_cells:HUVEC:IL-1b: 0.27, Endothelial_cells:HUVEC:B._anthracis_LT: 0.27, iPS_cells:CRL2097_foreskin: 0.27 |
| NB11_CGCGGTAGTATCGCAT-1 | Endothelial_cells:blood_vessel | 0.16 | 868.45 | Raw ScoresEndothelial_cells:lymphatic: 0.27, Endothelial_cells:lymphatic:TNFa_48h: 0.26, Endothelial_cells:blood_vessel: 0.26, Endothelial_cells:lymphatic:KSHV: 0.26, Endothelial_cells:HUVEC:Serum_Amyloid_A: 0.25, Endothelial_cells:HUVEC:VEGF: 0.24, Endothelial_cells:HUVEC: 0.23, Endothelial_cells:HUVEC:IL-1b: 0.23, Endothelial_cells:HUVEC:B._anthracis_LT: 0.23, Endothelial_cells:HUVEC:FPV-infected: 0.22 |
| NB09_CTGAAACCAAAGCAAT-1 | Neurons:adrenal_medulla_cell_line | 0.12 | 729.37 | Raw ScoresNeurons:adrenal_medulla_cell_line: 0.27, Neuroepithelial_cell:ESC-derived: 0.26, Astrocyte:Embryonic_stem_cell-derived: 0.26, Endothelial_cells:HUVEC:VEGF: 0.25, Neurons:ES_cell-derived_neural_precursor: 0.25, Endothelial_cells:HUVEC:Serum_Amyloid_A: 0.25, Endothelial_cells:HUVEC: 0.24, Endothelial_cells:lymphatic: 0.24, Endothelial_cells:lymphatic:TNFa_48h: 0.24, Endothelial_cells:blood_vessel: 0.23 |
| NB08_CGTCAGGAGTTAGCGG-1 | Endothelial_cells:HUVEC:VEGF | 0.16 | 669.61 | Raw ScoresEndothelial_cells:HUVEC:VEGF: 0.29, Endothelial_cells:lymphatic:TNFa_48h: 0.29, Endothelial_cells:HUVEC:Serum_Amyloid_A: 0.28, Endothelial_cells:HUVEC: 0.28, Endothelial_cells:lymphatic: 0.28, Endothelial_cells:HUVEC:IFNg: 0.28, Endothelial_cells:HUVEC:H5N1-infected: 0.27, Endothelial_cells:HUVEC:B._anthracis_LT: 0.27, Endothelial_cells:HUVEC:PR8-infected: 0.27, Endothelial_cells:HUVEC:IL-1b: 0.27 |
| NB09_AGGTCATCAGCATGAG-1 | Endothelial_cells:lymphatic:KSHV | 0.13 | 647.58 | Raw ScoresEndothelial_cells:lymphatic: 0.24, Endothelial_cells:lymphatic:KSHV: 0.23, Endothelial_cells:HUVEC:Serum_Amyloid_A: 0.23, Endothelial_cells:blood_vessel: 0.23, Endothelial_cells:lymphatic:TNFa_48h: 0.23, Endothelial_cells:HUVEC:VEGF: 0.22, Endothelial_cells:HUVEC: 0.22, Endothelial_cells:HUVEC:IL-1b: 0.21, Endothelial_cells:HUVEC:B._anthracis_LT: 0.21, Endothelial_cells:HUVEC:FPV-infected: 0.2 |
| NB12_TGTCCCACATGGTCAT-1 | Endothelial_cells:lymphatic:TNFa_48h | 0.19 | 604.04 | Raw ScoresEndothelial_cells:lymphatic:TNFa_48h: 0.3, Endothelial_cells:lymphatic: 0.3, Endothelial_cells:HUVEC:VEGF: 0.29, Endothelial_cells:HUVEC:Serum_Amyloid_A: 0.27, Endothelial_cells:HUVEC: 0.27, Endothelial_cells:HUVEC:B._anthracis_LT: 0.26, Endothelial_cells:HUVEC:H5N1-infected: 0.26, Endothelial_cells:HUVEC:IL-1b: 0.26, Endothelial_cells:HUVEC:FPV-infected: 0.25, Endothelial_cells:HUVEC:PR8-infected: 0.25 |
| NB08_ATCATGGGTGACAAAT-1 | Endothelial_cells:lymphatic:TNFa_48h | 0.13 | 502.27 | Raw ScoresEndothelial_cells:HUVEC:VEGF: 0.28, Endothelial_cells:HUVEC:Serum_Amyloid_A: 0.27, Endothelial_cells:lymphatic:TNFa_48h: 0.27, Endothelial_cells:HUVEC: 0.27, Endothelial_cells:HUVEC:H5N1-infected: 0.27, Endothelial_cells:HUVEC:IL-1b: 0.26, Endothelial_cells:lymphatic: 0.26, Endothelial_cells:HUVEC:PR8-infected: 0.26, Endothelial_cells:HUVEC:IFNg: 0.26, Endothelial_cells:HUVEC:B._anthracis_LT: 0.25 |
| NB05_CCATTCGAGATCTGCT-1 | Endothelial_cells:lymphatic | 0.14 | 461.24 | Raw ScoresEndothelial_cells:lymphatic: 0.23, Endothelial_cells:lymphatic:TNFa_48h: 0.23, Endothelial_cells:HUVEC:VEGF: 0.22, Endothelial_cells:HUVEC:Serum_Amyloid_A: 0.22, Endothelial_cells:blood_vessel: 0.21, Endothelial_cells:lymphatic:KSHV: 0.21, Endothelial_cells:HUVEC: 0.21, Endothelial_cells:HUVEC:IL-1b: 0.2, Endothelial_cells:HUVEC:B._anthracis_LT: 0.2, Endothelial_cells:HUVEC:PR8-infected: 0.19 |
| NB09_TACCTTAGTGTAATGA-1 | Neurons:adrenal_medulla_cell_line | 0.08 | 410.68 | Raw ScoresEndothelial_cells:lymphatic: 0.21, Endothelial_cells:HUVEC:Serum_Amyloid_A: 0.21, Endothelial_cells:lymphatic:TNFa_48h: 0.21, Endothelial_cells:HUVEC:VEGF: 0.2, Endothelial_cells:blood_vessel: 0.2, Endothelial_cells:HUVEC: 0.2, Endothelial_cells:lymphatic:KSHV: 0.2, Endothelial_cells:HUVEC:IL-1b: 0.2, Endothelial_cells:HUVEC:B._anthracis_LT: 0.19, Endothelial_cells:HUVEC:H5N1-infected: 0.18 |
| NB11_TGCTACCCATCCGGGT-1 | Endothelial_cells:lymphatic:TNFa_48h | 0.14 | 391.40 | Raw ScoresEndothelial_cells:lymphatic: 0.24, Endothelial_cells:lymphatic:TNFa_48h: 0.24, Endothelial_cells:blood_vessel: 0.23, Endothelial_cells:lymphatic:KSHV: 0.22, Endothelial_cells:HUVEC:Serum_Amyloid_A: 0.22, Endothelial_cells:HUVEC:VEGF: 0.22, Endothelial_cells:HUVEC: 0.21, Endothelial_cells:HUVEC:IL-1b: 0.21, Endothelial_cells:HUVEC:B._anthracis_LT: 0.21, Endothelial_cells:HUVEC:H5N1-infected: 0.2 |
| NB13_ATTCTACAGGCATTGG-1 | Endothelial_cells:lymphatic | 0.10 | 328.65 | Raw ScoresEndothelial_cells:lymphatic: 0.18, Endothelial_cells:lymphatic:TNFa_48h: 0.18, Endothelial_cells:HUVEC:VEGF: 0.17, Endothelial_cells:HUVEC: 0.17, Endothelial_cells:HUVEC:IFNg: 0.16, Endothelial_cells:HUVEC:Serum_Amyloid_A: 0.16, Endothelial_cells:HUVEC:Borrelia_burgdorferi: 0.16, Endothelial_cells:blood_vessel: 0.16, Endothelial_cells:HUVEC:H5N1-infected: 0.16, Fibroblasts:breast: 0.16 |
| NB13_GTCATTTAGGACGAAA-1 | Endothelial_cells:lymphatic:TNFa_48h | 0.12 | 324.30 | Raw ScoresEndothelial_cells:lymphatic:TNFa_48h: 0.22, Endothelial_cells:lymphatic: 0.22, Endothelial_cells:HUVEC:Serum_Amyloid_A: 0.21, Endothelial_cells:blood_vessel: 0.2, Endothelial_cells:HUVEC: 0.2, Endothelial_cells:HUVEC:VEGF: 0.2, Endothelial_cells:HUVEC:IFNg: 0.2, Endothelial_cells:HUVEC:IL-1b: 0.2, Endothelial_cells:HUVEC:H5N1-infected: 0.19, Endothelial_cells:HUVEC:B._anthracis_LT: 0.19 |
| NB11_ACAGCTAGTCTGCCAG-1 | Tissue_stem_cells:BM_MSC | 0.12 | 320.40 | Raw ScoresEndothelial_cells:lymphatic: 0.23, Endothelial_cells:HUVEC:Serum_Amyloid_A: 0.22, Endothelial_cells:lymphatic:KSHV: 0.22, Endothelial_cells:blood_vessel: 0.22, Endothelial_cells:lymphatic:TNFa_48h: 0.22, Endothelial_cells:HUVEC:VEGF: 0.22, Endothelial_cells:HUVEC: 0.22, Osteoblasts: 0.21, Osteoblasts:BMP2: 0.21, Smooth_muscle_cells:vascular: 0.21 |
| NB13_CTGATCCAGCCGCCTA-1 | Endothelial_cells:lymphatic:TNFa_48h | 0.12 | 312.83 | Raw ScoresEndothelial_cells:lymphatic:TNFa_48h: 0.23, Endothelial_cells:HUVEC:VEGF: 0.22, Endothelial_cells:lymphatic: 0.22, Endothelial_cells:HUVEC:Serum_Amyloid_A: 0.22, Endothelial_cells:HUVEC: 0.22, Endothelial_cells:blood_vessel: 0.21, Endothelial_cells:HUVEC:IFNg: 0.21, Endothelial_cells:HUVEC:IL-1b: 0.21, Endothelial_cells:HUVEC:Borrelia_burgdorferi: 0.21, Endothelial_cells:HUVEC:H5N1-infected: 0.21 |
| NB12_CAGTAACTCCGATATG-1 | Smooth_muscle_cells:vascular | 0.16 | 305.03 | Raw ScoresiPS_cells:CRL2097_foreskin: 0.26, Fibroblasts:breast: 0.25, Smooth_muscle_cells:vascular: 0.25, Smooth_muscle_cells:bronchial: 0.25, Smooth_muscle_cells:vascular:IL-17: 0.25, Smooth_muscle_cells:bronchial:vit_D: 0.25, Osteoblasts: 0.24, Osteoblasts:BMP2: 0.24, iPS_cells:adipose_stem_cells: 0.24, MSC: 0.24 |
| NB12_TGATTTCCAAGTCTGT-1 | Endothelial_cells:lymphatic | 0.17 | 268.88 | Raw ScoresEndothelial_cells:lymphatic: 0.26, Endothelial_cells:lymphatic:TNFa_48h: 0.26, Endothelial_cells:HUVEC:VEGF: 0.25, Endothelial_cells:HUVEC: 0.23, Endothelial_cells:HUVEC:Serum_Amyloid_A: 0.23, Endothelial_cells:HUVEC:IL-1b: 0.22, Endothelial_cells:HUVEC:H5N1-infected: 0.22, Endothelial_cells:HUVEC:B._anthracis_LT: 0.22, Endothelial_cells:HUVEC:FPV-infected: 0.22, Endothelial_cells:HUVEC:PR8-infected: 0.22 |
| NB14_TTCTCAACATCCCACT-1 | iPS_cells:adipose_stem_cells | 0.14 | 261.82 | Raw ScoresiPS_cells:CRL2097_foreskin: 0.24, Smooth_muscle_cells:bronchial: 0.24, Osteoblasts: 0.24, Chondrocytes:MSC-derived: 0.24, MSC: 0.23, Tissue_stem_cells:BM_MSC:TGFb3: 0.23, Fibroblasts:breast: 0.23, Smooth_muscle_cells:bronchial:vit_D: 0.23, Smooth_muscle_cells:vascular: 0.23, Osteoblasts:BMP2: 0.23 |
| NB05_GTATCTTCACGCGAAA-1 | Fibroblasts:breast | 0.15 | 260.66 | Raw ScoresiPS_cells:CRL2097_foreskin: 0.28, Smooth_muscle_cells:bronchial: 0.27, Fibroblasts:breast: 0.27, MSC: 0.27, Smooth_muscle_cells:bronchial:vit_D: 0.27, iPS_cells:adipose_stem_cells: 0.26, Smooth_muscle_cells:vascular: 0.26, Astrocyte:Embryonic_stem_cell-derived: 0.26, iPS_cells:foreskin_fibrobasts: 0.26, Chondrocytes:MSC-derived: 0.26 |
| NB05_TCATTTGGTTCTCATT-1 | Neurons:adrenal_medulla_cell_line | 0.10 | 257.25 | Raw ScoresEndothelial_cells:HUVEC:VEGF: 0.17, Neuroepithelial_cell:ESC-derived: 0.17, Astrocyte:Embryonic_stem_cell-derived: 0.17, Neurons:adrenal_medulla_cell_line: 0.16, Endothelial_cells:lymphatic:TNFa_48h: 0.16, Neurons:ES_cell-derived_neural_precursor: 0.16, Endothelial_cells:HUVEC: 0.16, Endothelial_cells:HUVEC:Serum_Amyloid_A: 0.16, Endothelial_cells:lymphatic: 0.16, Endothelial_cells:HUVEC:H5N1-infected: 0.15 |
| NB02_CTCTGGTCATAGTAAG-1 | Endothelial_cells:lymphatic | 0.11 | 249.27 | Raw ScoresSmooth_muscle_cells:vascular:IL-17: 0.19, Smooth_muscle_cells:vascular: 0.19, Endothelial_cells:lymphatic: 0.19, Fibroblasts:breast: 0.19, Endothelial_cells:lymphatic:TNFa_48h: 0.18, Osteoblasts: 0.18, Endothelial_cells:HUVEC: 0.18, iPS_cells:adipose_stem_cells: 0.18, iPS_cells:CRL2097_foreskin: 0.18, Tissue_stem_cells:BM_MSC: 0.18 |
| NB09_AAGGCAGTCTTCATGT-1 | Neurons:adrenal_medulla_cell_line | 0.08 | 239.25 | Raw ScoresAstrocyte:Embryonic_stem_cell-derived: 0.24, Neurons:adrenal_medulla_cell_line: 0.24, Neuroepithelial_cell:ESC-derived: 0.23, Neurons:ES_cell-derived_neural_precursor: 0.22, Endothelial_cells:HUVEC:VEGF: 0.21, iPS_cells:CRL2097_foreskin: 0.21, Endothelial_cells:lymphatic: 0.21, Endothelial_cells:HUVEC:Serum_Amyloid_A: 0.2, Endothelial_cells:lymphatic:TNFa_48h: 0.2, Endothelial_cells:HUVEC: 0.2 |
| NB12_GAAGCAGAGCTTATCG-1 | Endothelial_cells:lymphatic:TNFa_48h | 0.11 | 236.05 | Raw ScoresEndothelial_cells:HUVEC:VEGF: 0.25, Endothelial_cells:lymphatic: 0.24, Endothelial_cells:lymphatic:TNFa_48h: 0.24, Endothelial_cells:HUVEC:Serum_Amyloid_A: 0.24, Endothelial_cells:HUVEC: 0.24, Endothelial_cells:HUVEC:IL-1b: 0.23, Endothelial_cells:blood_vessel: 0.23, Endothelial_cells:HUVEC:B._anthracis_LT: 0.23, Endothelial_cells:lymphatic:KSHV: 0.23, Endothelial_cells:HUVEC:H5N1-infected: 0.22 |
| NB07_GTGAAGGCACGCTTTC-1 | Endothelial_cells:HUVEC:Borrelia_burgdorferi | 0.04 | 224.51 | Raw ScoresEndothelial_cells:HUVEC:IL-1b: 0.14, Endothelial_cells:lymphatic:TNFa_48h: 0.14, Endothelial_cells:lymphatic: 0.14, Endothelial_cells:HUVEC:Serum_Amyloid_A: 0.14, Endothelial_cells:HUVEC:VEGF: 0.14, Endothelial_cells:HUVEC: 0.13, Endothelial_cells:HUVEC:H5N1-infected: 0.13, Endothelial_cells:HUVEC:B._anthracis_LT: 0.13, Endothelial_cells:blood_vessel: 0.13, Endothelial_cells:lymphatic:KSHV: 0.13 |
| NB11_CTAACTTCAGATCGGA-1 | Endothelial_cells:lymphatic:KSHV | 0.14 | 216.55 | Raw ScoresEndothelial_cells:lymphatic:KSHV: 0.21, Endothelial_cells:lymphatic: 0.21, Endothelial_cells:lymphatic:TNFa_48h: 0.21, Endothelial_cells:blood_vessel: 0.2, Endothelial_cells:HUVEC:Serum_Amyloid_A: 0.2, Endothelial_cells:HUVEC:VEGF: 0.19, Endothelial_cells:HUVEC: 0.19, Endothelial_cells:HUVEC:IL-1b: 0.19, Endothelial_cells:HUVEC:B._anthracis_LT: 0.18, Endothelial_cells:HUVEC:H5N1-infected: 0.18 |
| NB13_CTGTTTAAGTTGTCGT-1 | Neurons:adrenal_medulla_cell_line | 0.10 | 189.60 | Raw ScoresNeurons:adrenal_medulla_cell_line: 0.21, Astrocyte:Embryonic_stem_cell-derived: 0.2, Neurons:ES_cell-derived_neural_precursor: 0.2, Endothelial_cells:HUVEC:VEGF: 0.19, Endothelial_cells:lymphatic:TNFa_48h: 0.19, Endothelial_cells:HUVEC:Serum_Amyloid_A: 0.19, Endothelial_cells:lymphatic: 0.19, Neuroepithelial_cell:ESC-derived: 0.19, Endothelial_cells:HUVEC: 0.19, Endothelial_cells:HUVEC:B._anthracis_LT: 0.18 |
| NB11_AGTTGGTTCGCTTAGA-1 | Endothelial_cells:lymphatic | 0.12 | 189.24 | Raw ScoresEndothelial_cells:lymphatic: 0.2, Endothelial_cells:lymphatic:TNFa_48h: 0.2, Endothelial_cells:HUVEC:VEGF: 0.19, Endothelial_cells:HUVEC:Serum_Amyloid_A: 0.19, Endothelial_cells:HUVEC: 0.19, Endothelial_cells:blood_vessel: 0.18, Endothelial_cells:lymphatic:KSHV: 0.18, Endothelial_cells:HUVEC:IL-1b: 0.18, Endothelial_cells:HUVEC:B._anthracis_LT: 0.18, Endothelial_cells:HUVEC:H5N1-infected: 0.17 |
| NB08_GATGCTATCAGTGCAT-1 | Neurons:adrenal_medulla_cell_line | 0.12 | 188.33 | Raw ScoresNeurons:adrenal_medulla_cell_line: 0.19, Endothelial_cells:HUVEC:VEGF: 0.17, Astrocyte:Embryonic_stem_cell-derived: 0.17, Endothelial_cells:lymphatic:TNFa_48h: 0.16, Endothelial_cells:HUVEC: 0.16, Endothelial_cells:HUVEC:Serum_Amyloid_A: 0.16, Endothelial_cells:lymphatic: 0.16, Neuroepithelial_cell:ESC-derived: 0.16, Neurons:ES_cell-derived_neural_precursor: 0.16, Endothelial_cells:HUVEC:FPV-infected: 0.16 |
| NB02_CAGGTGCAGACACGAC-1 | Endothelial_cells:lymphatic:TNFa_48h | 0.09 | 188.19 | Raw ScoresEndothelial_cells:lymphatic: 0.17, Endothelial_cells:lymphatic:TNFa_48h: 0.16, Endothelial_cells:blood_vessel: 0.16, Endothelial_cells:HUVEC: 0.15, Endothelial_cells:lymphatic:KSHV: 0.15, Endothelial_cells:HUVEC:Serum_Amyloid_A: 0.15, Endothelial_cells:HUVEC:VEGF: 0.15, Endothelial_cells:HUVEC:IL-1b: 0.14, Endothelial_cells:HUVEC:B._anthracis_LT: 0.14, Smooth_muscle_cells:vascular: 0.13 |
| NB12_AGATTGCTCCGCGTTT-1 | Smooth_muscle_cells:vascular | 0.09 | 186.30 | Raw ScoresFibroblasts:breast: 0.19, iPS_cells:adipose_stem_cells: 0.18, Smooth_muscle_cells:bronchial: 0.18, Osteoblasts: 0.18, iPS_cells:CRL2097_foreskin: 0.18, Smooth_muscle_cells:bronchial:vit_D: 0.18, Smooth_muscle_cells:vascular: 0.18, Tissue_stem_cells:BM_MSC:BMP2: 0.18, Tissue_stem_cells:iliac_MSC: 0.18, Osteoblasts:BMP2: 0.18 |
| NB02_TGACTAGAGCGTAATA-1 | Fibroblasts:breast | 0.17 | 181.79 | Raw ScoresFibroblasts:breast: 0.25, Smooth_muscle_cells:vascular: 0.25, Smooth_muscle_cells:vascular:IL-17: 0.25, iPS_cells:adipose_stem_cells: 0.24, Osteoblasts: 0.24, Chondrocytes:MSC-derived: 0.24, Tissue_stem_cells:BM_MSC:TGFb3: 0.23, Tissue_stem_cells:BM_MSC: 0.23, Osteoblasts:BMP2: 0.23, iPS_cells:CRL2097_foreskin: 0.23 |
| NB12_CGATGGCAGGCATGTG-1 | Neurons:adrenal_medulla_cell_line | 0.10 | 181.24 | Raw ScoresEndothelial_cells:lymphatic:TNFa_48h: 0.21, Endothelial_cells:lymphatic:KSHV: 0.2, Endothelial_cells:HUVEC:VEGF: 0.2, Endothelial_cells:lymphatic: 0.2, Endothelial_cells:HUVEC:Serum_Amyloid_A: 0.2, Endothelial_cells:HUVEC: 0.2, Endothelial_cells:blood_vessel: 0.19, Neurons:adrenal_medulla_cell_line: 0.19, Endothelial_cells:HUVEC:IL-1b: 0.19, Endothelial_cells:HUVEC:B._anthracis_LT: 0.19 |
| NB14_CTACACCTCCAGTATG-1 | Endothelial_cells:lymphatic:KSHV | 0.10 | 180.18 | Raw ScoresEndothelial_cells:lymphatic:KSHV: 0.19, Endothelial_cells:HUVEC:Serum_Amyloid_A: 0.18, Endothelial_cells:blood_vessel: 0.18, Endothelial_cells:lymphatic: 0.18, Endothelial_cells:lymphatic:TNFa_48h: 0.17, Endothelial_cells:HUVEC:VEGF: 0.17, Endothelial_cells:HUVEC: 0.17, Endothelial_cells:HUVEC:IL-1b: 0.17, Endothelial_cells:HUVEC:B._anthracis_LT: 0.17, Endothelial_cells:HUVEC:H5N1-infected: 0.16 |
| NB02_CACACCTAGGCTCATT-1 | Tissue_stem_cells:BM_MSC:TGFb3 | 0.10 | 164.15 | Raw ScoresSmooth_muscle_cells:vascular:IL-17: 0.16, Tissue_stem_cells:BM_MSC:TGFb3: 0.16, iPS_cells:CRL2097_foreskin: 0.16, Smooth_muscle_cells:vascular: 0.15, Tissue_stem_cells:iliac_MSC: 0.15, Osteoblasts:BMP2: 0.15, Osteoblasts: 0.15, Tissue_stem_cells:BM_MSC:BMP2: 0.15, Smooth_muscle_cells:bronchial: 0.15, Chondrocytes:MSC-derived: 0.15 |
| NB11_ATTGGTGAGGCACATG-1 | Tissue_stem_cells:BM_MSC | 0.11 | 161.47 | Raw ScoresiPS_cells:CRL2097_foreskin: 0.21, iPS_cells:adipose_stem_cells: 0.21, Osteoblasts: 0.2, Osteoblasts:BMP2: 0.2, Fibroblasts:breast: 0.2, MSC: 0.2, Smooth_muscle_cells:bronchial: 0.19, Tissue_stem_cells:BM_MSC: 0.19, Tissue_stem_cells:BM_MSC:TGFb3: 0.19, Chondrocytes:MSC-derived: 0.19 |
| NB12_GCGCCAATCCACGACG-1 | Endothelial_cells:lymphatic | 0.13 | 159.57 | Raw ScoresEndothelial_cells:lymphatic:TNFa_48h: 0.2, Endothelial_cells:lymphatic: 0.2, Endothelial_cells:HUVEC:VEGF: 0.19, Endothelial_cells:HUVEC:Serum_Amyloid_A: 0.18, Endothelial_cells:HUVEC: 0.17, Endothelial_cells:HUVEC:B._anthracis_LT: 0.17, Endothelial_cells:HUVEC:IL-1b: 0.17, Endothelial_cells:HUVEC:FPV-infected: 0.16, Endothelial_cells:HUVEC:H5N1-infected: 0.16, Endothelial_cells:blood_vessel: 0.16 |
| NB02_ACGGAGAGTTGGGACA-1 | Endothelial_cells:HUVEC:IL-1b | 0.07 | 154.67 | Raw ScoresEndothelial_cells:HUVEC:IL-1b: 0.13, Endothelial_cells:HUVEC: 0.13, Endothelial_cells:HUVEC:VEGF: 0.12, Endothelial_cells:lymphatic: 0.12, Endothelial_cells:HUVEC:Serum_Amyloid_A: 0.12, Endothelial_cells:blood_vessel: 0.12, Endothelial_cells:lymphatic:TNFa_48h: 0.12, Endothelial_cells:lymphatic:KSHV: 0.12, Endothelial_cells:HUVEC:B._anthracis_LT: 0.11, Endothelial_cells:HUVEC:Borrelia_burgdorferi: 0.11 |
| NB04_CGCCAAGGTGGCAAAC-1 | Endothelial_cells:HUVEC:VEGF | 0.11 | 150.56 | Raw ScoresEndothelial_cells:HUVEC:VEGF: 0.17, Endothelial_cells:HUVEC: 0.16, Endothelial_cells:lymphatic: 0.16, Endothelial_cells:lymphatic:TNFa_48h: 0.15, Endothelial_cells:blood_vessel: 0.15, Endothelial_cells:HUVEC:Serum_Amyloid_A: 0.15, Smooth_muscle_cells:vascular:IL-17: 0.15, Neuroepithelial_cell:ESC-derived: 0.15, Endothelial_cells:lymphatic:KSHV: 0.15, Smooth_muscle_cells:vascular: 0.15 |
| NB11_TGAAAGATCCGCAAGC-1 | Endothelial_cells:blood_vessel | 0.10 | 150.15 | Raw ScoresEndothelial_cells:lymphatic:KSHV: 0.18, Endothelial_cells:blood_vessel: 0.18, Endothelial_cells:lymphatic:TNFa_48h: 0.18, Endothelial_cells:lymphatic: 0.17, Endothelial_cells:HUVEC:Serum_Amyloid_A: 0.17, Endothelial_cells:HUVEC: 0.16, Endothelial_cells:HUVEC:VEGF: 0.16, Endothelial_cells:HUVEC:IL-1b: 0.16, Endothelial_cells:HUVEC:B._anthracis_LT: 0.16, Endothelial_cells:HUVEC:FPV-infected: 0.15 |
| NB05_ACGCCAGGTTGGTTTG-1 | Endothelial_cells:lymphatic:TNFa_48h | 0.10 | 145.20 | Raw ScoresEndothelial_cells:lymphatic:TNFa_48h: 0.17, Endothelial_cells:lymphatic: 0.17, Astrocyte:Embryonic_stem_cell-derived: 0.17, Endothelial_cells:HUVEC:VEGF: 0.17, Neuroepithelial_cell:ESC-derived: 0.16, Endothelial_cells:HUVEC:Serum_Amyloid_A: 0.16, Neurons:adrenal_medulla_cell_line: 0.16, Endothelial_cells:HUVEC: 0.16, Endothelial_cells:HUVEC:IL-1b: 0.15, Endothelial_cells:HUVEC:B._anthracis_LT: 0.15 |
| NB11_CGGACACTCCGCGCAA-1 | Endothelial_cells:HUVEC:IFNg | 0.12 | 144.52 | Raw ScoresEndothelial_cells:HUVEC:VEGF: 0.19, Endothelial_cells:HUVEC: 0.19, Endothelial_cells:lymphatic: 0.19, Endothelial_cells:HUVEC:IFNg: 0.19, Endothelial_cells:lymphatic:TNFa_48h: 0.19, Endothelial_cells:HUVEC:H5N1-infected: 0.19, Endothelial_cells:HUVEC:Borrelia_burgdorferi: 0.19, Endothelial_cells:HUVEC:Serum_Amyloid_A: 0.18, Endothelial_cells:blood_vessel: 0.18, Endothelial_cells:HUVEC:B._anthracis_LT: 0.18 |
| NB05_TGCGTGGCAGACAAAT-1 | Neurons:adrenal_medulla_cell_line | 0.15 | 143.50 | Raw ScoresNeurons:adrenal_medulla_cell_line: 0.33, Neuroepithelial_cell:ESC-derived: 0.33, Astrocyte:Embryonic_stem_cell-derived: 0.32, Endothelial_cells:HUVEC:VEGF: 0.3, Endothelial_cells:lymphatic:TNFa_48h: 0.3, Neurons:ES_cell-derived_neural_precursor: 0.3, Endothelial_cells:lymphatic: 0.3, Endothelial_cells:HUVEC: 0.29, MSC: 0.29, iPS_cells:CRL2097_foreskin: 0.29 |
| NB11_TAGGCATTCAGAGCTT-1 | Endothelial_cells:HUVEC:Borrelia_burgdorferi | 0.08 | 142.30 | Raw ScoresEndothelial_cells:HUVEC:VEGF: 0.19, Endothelial_cells:HUVEC: 0.19, Endothelial_cells:HUVEC:Serum_Amyloid_A: 0.19, Endothelial_cells:HUVEC:H5N1-infected: 0.18, Endothelial_cells:HUVEC:FPV-infected: 0.18, Endothelial_cells:HUVEC:IFNg: 0.18, Endothelial_cells:blood_vessel: 0.18, Endothelial_cells:lymphatic:TNFa_48h: 0.18, Endothelial_cells:HUVEC:B._anthracis_LT: 0.18, Endothelial_cells:lymphatic: 0.18 |
| NB14_ACGAGGAGTCACTGGC-1 | Tissue_stem_cells:BM_MSC | 0.09 | 140.54 | Raw ScoresChondrocytes:MSC-derived: 0.21, Osteoblasts: 0.21, Endothelial_cells:lymphatic:KSHV: 0.21, iPS_cells:adipose_stem_cells: 0.21, Fibroblasts:breast: 0.21, iPS_cells:CRL2097_foreskin: 0.21, Tissue_stem_cells:BM_MSC:TGFb3: 0.2, Smooth_muscle_cells:bronchial: 0.2, Tissue_stem_cells:BM_MSC:BMP2: 0.2, Neurons:Schwann_cell: 0.2 |
| NB08_CATCCACCAATAGCGG-1 | Endothelial_cells:HUVEC:VEGF | 0.09 | 139.91 | Raw ScoresEndothelial_cells:HUVEC:VEGF: 0.16, Endothelial_cells:lymphatic: 0.15, Endothelial_cells:lymphatic:TNFa_48h: 0.15, Endothelial_cells:HUVEC:Serum_Amyloid_A: 0.15, Endothelial_cells:HUVEC: 0.14, Endothelial_cells:HUVEC:H5N1-infected: 0.14, Endothelial_cells:HUVEC:IFNg: 0.14, Endothelial_cells:HUVEC:IL-1b: 0.14, Endothelial_cells:HUVEC:PR8-infected: 0.14, Endothelial_cells:HUVEC:Borrelia_burgdorferi: 0.13 |
| NB14_TTTCCTCTCAGTTTGG-1 | Endothelial_cells:lymphatic:KSHV | 0.09 | 138.63 | Raw ScoresEndothelial_cells:HUVEC:Serum_Amyloid_A: 0.14, Endothelial_cells:lymphatic:KSHV: 0.14, Endothelial_cells:lymphatic: 0.14, Endothelial_cells:HUVEC:VEGF: 0.14, Endothelial_cells:lymphatic:TNFa_48h: 0.14, Endothelial_cells:blood_vessel: 0.14, Endothelial_cells:HUVEC: 0.14, Endothelial_cells:HUVEC:IL-1b: 0.14, Endothelial_cells:HUVEC:B._anthracis_LT: 0.13, Endothelial_cells:HUVEC:FPV-infected: 0.13 |
| NB14_AATCCAGCATCGGTTA-1 | Endothelial_cells:blood_vessel | 0.10 | 135.99 | Raw ScoresEndothelial_cells:blood_vessel: 0.14, Endothelial_cells:lymphatic: 0.14, Endothelial_cells:lymphatic:KSHV: 0.14, Endothelial_cells:lymphatic:TNFa_48h: 0.14, Endothelial_cells:HUVEC:Serum_Amyloid_A: 0.13, Endothelial_cells:HUVEC:VEGF: 0.13, Endothelial_cells:HUVEC: 0.12, Endothelial_cells:HUVEC:IL-1b: 0.12, Endothelial_cells:HUVEC:B._anthracis_LT: 0.12, Neurons:adrenal_medulla_cell_line: 0.12 |
| NB02_GGAACTTCACGGTAGA-1 | Endothelial_cells:HUVEC:VEGF | 0.10 | 132.78 | Raw ScoresEndothelial_cells:lymphatic: 0.14, Endothelial_cells:lymphatic:TNFa_48h: 0.13, Endothelial_cells:HUVEC:VEGF: 0.13, Endothelial_cells:HUVEC:Serum_Amyloid_A: 0.12, Endothelial_cells:HUVEC: 0.12, Endothelial_cells:lymphatic:KSHV: 0.12, Endothelial_cells:blood_vessel: 0.12, Endothelial_cells:HUVEC:IL-1b: 0.11, Endothelial_cells:HUVEC:IFNg: 0.11, Endothelial_cells:HUVEC:FPV-infected: 0.11 |
| NB03_ATCGAGTAGATGCGAC-1 | Endothelial_cells:lymphatic | 0.12 | 129.47 | Raw ScoresEndothelial_cells:lymphatic: 0.18, Endothelial_cells:lymphatic:TNFa_48h: 0.18, Endothelial_cells:lymphatic:KSHV: 0.17, Endothelial_cells:HUVEC:VEGF: 0.17, Endothelial_cells:HUVEC:Serum_Amyloid_A: 0.17, Endothelial_cells:blood_vessel: 0.17, Endothelial_cells:HUVEC: 0.16, Endothelial_cells:HUVEC:IL-1b: 0.15, Endothelial_cells:HUVEC:B._anthracis_LT: 0.15, Endothelial_cells:HUVEC:FPV-infected: 0.15 |
Below shows the significant enrichments of this GEP for literature curated gene lists
This data was procured from existing single cell RNA-seq maps of neuroblastoma or related relevant data.
High ranks indicate this gene is a driver of this GEP.
These curated gene list are ranked by the P-value (on this GEP) of their constituent genes.
The Mean Count column shows the mean read count in cells scoring highly (H > 50) on this gene expression program.
Endothelial subclusters 2-6 (Hanemaaijer)
Marker genes obtained from Supplementary Table SD of Hanemaaijer et al (PMID 33500353). The authors generated single-cell RNA-seq data (sort-seq, 2,229 cells total) from mouse adrenal glads at E13.5, E14.5, E17.5, E18.5, P1 and P5. These were marker genes that matched with a similar dataset generated by Furlan et al (PMID 28684471). This particular set of markers are for Various endothelial subclusters of Endothelium clusters:
Wilcoxon ranksum test P-value for gene set overrepresentation: 5.21e-08
Mean rank of genes in gene set: 1969.55
Rank on gene expression program of genes in gene set:
| Genes | Weight | Rank | GTEx | DepMap | Decartes | Mean.Counts | Mean.TPM |
|---|---|---|---|---|---|---|---|
| MECOM | 0.0201301 | 2 | GTEx | DepMap | Descartes | 1.55 | 435.78 |
| HES1 | 0.0074138 | 23 | GTEx | DepMap | Descartes | 0.35 | 572.55 |
| TM4SF1 | 0.0073164 | 26 | GTEx | DepMap | Descartes | 0.37 | 273.32 |
| IGFBP3 | 0.0047601 | 63 | GTEx | DepMap | Descartes | 0.42 | 166.79 |
| SPRY1 | 0.0036791 | 110 | GTEx | DepMap | Descartes | 0.30 | 210.51 |
| JAG1 | 0.0034435 | 121 | GTEx | DepMap | Descartes | 0.41 | 114.73 |
| GJA1 | 0.0032349 | 133 | GTEx | DepMap | Descartes | 0.20 | 86.13 |
| ADAMTS1 | 0.0032341 | 134 | GTEx | DepMap | Descartes | 0.21 | 77.11 |
| THBD | 0.0020309 | 257 | GTEx | DepMap | Descartes | 0.13 | 60.83 |
| DUSP6 | 0.0016678 | 321 | GTEx | DepMap | Descartes | 0.36 | 186.62 |
| CLIC4 | 0.0014635 | 371 | GTEx | DepMap | Descartes | 0.56 | 206.52 |
| RHOB | 0.0009838 | 590 | GTEx | DepMap | Descartes | 0.25 | 159.47 |
| SHROOM2 | 0.0009564 | 611 | GTEx | DepMap | Descartes | 0.11 | 25.55 |
| IVNS1ABP | 0.0007308 | 798 | GTEx | DepMap | Descartes | 0.38 | 169.84 |
| FBLN2 | 0.0006150 | 933 | GTEx | DepMap | Descartes | 0.10 | 43.83 |
| MCF2L | 0.0002489 | 2033 | GTEx | DepMap | Descartes | 0.38 | 118.14 |
| LFNG | 0.0000624 | 4148 | GTEx | DepMap | Descartes | 0.06 | 46.85 |
| FAM102A | -0.0000209 | 5945 | GTEx | DepMap | Descartes | 0.08 | 21.56 |
| CDK1 | -0.0002158 | 10970 | GTEx | DepMap | Descartes | 0.06 | 32.03 |
| MARCKSL1 | -0.0003128 | 11802 | GTEx | DepMap | Descartes | 0.48 | 296.08 |
PMN-MDSC
These marker genes were curated for MDSC subtypes as reviewed in Veglia et. al. (PMID 33526920):
Wilcoxon ranksum test P-value for gene set overrepresentation: 2.75e-04
Mean rank of genes in gene set: 3147.88
Rank on gene expression program of genes in gene set:
| Genes | Weight | Rank | GTEx | DepMap | Decartes | Mean.Counts | Mean.TPM |
|---|---|---|---|---|---|---|---|
| CD36 | 0.0024791 | 191 | GTEx | DepMap | Descartes | 0.56 | 162.25 |
| PTGS2 | 0.0012883 | 433 | GTEx | DepMap | Descartes | 0.09 | 40.76 |
| TGFB1 | 0.0009255 | 640 | GTEx | DepMap | Descartes | 0.37 | 219.99 |
| STAT3 | 0.0007766 | 752 | GTEx | DepMap | Descartes | 0.67 | 198.99 |
| ANXA1 | 0.0007747 | 754 | GTEx | DepMap | Descartes | 0.44 | 569.54 |
| TNFRSF10B | 0.0007447 | 788 | GTEx | DepMap | Descartes | 0.23 | 112.53 |
| CSF1 | 0.0007313 | 797 | GTEx | DepMap | Descartes | 0.04 | 25.23 |
| HIF1A | 0.0007047 | 827 | GTEx | DepMap | Descartes | 0.85 | 367.75 |
| STAT1 | 0.0004968 | 1143 | GTEx | DepMap | Descartes | 0.33 | 108.55 |
| STAT6 | 0.0004486 | 1249 | GTEx | DepMap | Descartes | 0.15 | 65.93 |
| IRF1 | 0.0003793 | 1445 | GTEx | DepMap | Descartes | 0.08 | 35.29 |
| IL1B | 0.0000157 | 5063 | GTEx | DepMap | Descartes | 0.00 | 0.00 |
| ARG2 | -0.0000121 | 5725 | GTEx | DepMap | Descartes | 0.11 | 73.46 |
| SLC27A2 | -0.0000887 | 8073 | GTEx | DepMap | Descartes | 0.02 | 18.79 |
| CD84 | -0.0001948 | 10646 | GTEx | DepMap | Descartes | 0.02 | 1.48 |
| ARG1 | -0.0003217 | 11840 | GTEx | DepMap | Descartes | 0.00 | 0.00 |
Endothelium (Kameneva)
Marker gene were obtained from Fig. 1D of Kameneva et al (PMID 33833454). These genes were used by the authors to annotate each cell type in their human fetal adrenal scRNA-seq data obtained 6, 8, 9, 11, 12 and 14 weeks post conception.:
Wilcoxon ranksum test P-value for gene set overrepresentation: 3.73e-04
Mean rank of genes in gene set: 168.25
Rank on gene expression program of genes in gene set:
| Genes | Weight | Rank | GTEx | DepMap | Decartes | Mean.Counts | Mean.TPM |
|---|---|---|---|---|---|---|---|
| FLT1 | 0.0209947 | 1 | GTEx | DepMap | Descartes | 2.24 | 411.49 |
| EGFL7 | 0.0126636 | 5 | GTEx | DepMap | Descartes | 1.82 | 2292.23 |
| KDR | 0.0058169 | 42 | GTEx | DepMap | Descartes | 0.25 | 75.48 |
| PRCP | 0.0009429 | 625 | GTEx | DepMap | Descartes | 0.28 | 51.02 |
Below shows ranks on this GEP for literature curated gene lists for large gene sets
These include those reported as mesenchymal/adrenergic by Van Groningen et al.
High ranks indicate this gene is a driver of this GEP (note these results are not ordered).
The Mean Count column shows the mean read count in cells scoring highly (H > 50) on this gene expression program.
VanGroningen Adrenergic Genes
Adrenergic marker genes from Supplementary Table 2 of Van Groningen et al. Nature Genetics 2017. These genes were identified by differential expression analysis of mesenchymal-like and adrenergic-like neuroblastoma cell lines.
Wilcoxon ranksum test P-value for gene set overrepresentation: 1.00e+00
Mean rank of genes in gene set: 9819.58
Median rank of genes in gene set: 11104
Rank on gene expression program of top 30 genes in gene set:
| Genes | Weight | Rank | GTEx | DepMap | Descartes | Mean.Counts | Mean.TPM |
|---|---|---|---|---|---|---|---|
| GRB10 | 0.0061558 | 36 | GTEx | DepMap | Descartes | 1.10 | 401.29 |
| ABLIM1 | 0.0015183 | 353 | GTEx | DepMap | Descartes | 0.45 | 93.29 |
| RPS6KA2 | 0.0012092 | 462 | GTEx | DepMap | Descartes | 0.58 | 150.29 |
| LYN | 0.0008816 | 668 | GTEx | DepMap | Descartes | 0.24 | 64.17 |
| CD200 | 0.0005189 | 1099 | GTEx | DepMap | Descartes | 0.38 | 257.99 |
| NFIL3 | 0.0005034 | 1127 | GTEx | DepMap | Descartes | 0.03 | 35.18 |
| CXCR4 | 0.0004615 | 1218 | GTEx | DepMap | Descartes | 0.18 | 99.37 |
| THSD7A | 0.0004411 | 1266 | GTEx | DepMap | Descartes | 1.74 | 249.09 |
| AKAP12 | 0.0003716 | 1468 | GTEx | DepMap | Descartes | 0.50 | 110.07 |
| ST3GAL6 | 0.0003409 | 1600 | GTEx | DepMap | Descartes | 0.39 | 193.97 |
| CDC42EP3 | 0.0002497 | 2029 | GTEx | DepMap | Descartes | 0.16 | 42.19 |
| TACC2 | 0.0002426 | 2069 | GTEx | DepMap | Descartes | 0.30 | 44.23 |
| FAM107B | 0.0002117 | 2301 | GTEx | DepMap | Descartes | 0.20 | 71.40 |
| MYRIP | 0.0002117 | 2302 | GTEx | DepMap | Descartes | 0.26 | 92.98 |
| PIK3R1 | 0.0002101 | 2319 | GTEx | DepMap | Descartes | 0.43 | 84.37 |
| DPYSL3 | 0.0002062 | 2345 | GTEx | DepMap | Descartes | 0.88 | 223.98 |
| GNB1 | 0.0001968 | 2425 | GTEx | DepMap | Descartes | 0.83 | 342.30 |
| MYO5A | 0.0001934 | 2453 | GTEx | DepMap | Descartes | 0.39 | 46.50 |
| LMO3 | 0.0001912 | 2475 | GTEx | DepMap | Descartes | 0.01 | 5.15 |
| HEY1 | 0.0001610 | 2767 | GTEx | DepMap | Descartes | 0.03 | 32.33 |
| POLB | 0.0001352 | 3035 | GTEx | DepMap | Descartes | 0.10 | 102.56 |
| TDG | 0.0001089 | 3381 | GTEx | DepMap | Descartes | 0.21 | 87.68 |
| KIF15 | 0.0000831 | 3749 | GTEx | DepMap | Descartes | 0.09 | 18.08 |
| PDK1 | 0.0000769 | 3865 | GTEx | DepMap | Descartes | 0.07 | 3.81 |
| KLF13 | 0.0000715 | 3982 | GTEx | DepMap | Descartes | 0.20 | 39.23 |
| ANKRD46 | 0.0000685 | 4033 | GTEx | DepMap | Descartes | 0.09 | 35.99 |
| GMNN | 0.0000570 | 4252 | GTEx | DepMap | Descartes | 0.04 | 54.02 |
| ARHGEF7 | 0.0000499 | 4367 | GTEx | DepMap | Descartes | 0.45 | 113.60 |
| MAPK8 | 0.0000486 | 4391 | GTEx | DepMap | Descartes | 0.56 | 120.03 |
| NAPB | 0.0000447 | 4477 | GTEx | DepMap | Descartes | 0.11 | 44.29 |
VanGroningen Mesenchymal Genes
Mesenchymal marker genes from Supplementary Table 2 of Van Groningen et al. Nature Genetics 2017. These genes were identified by differential expression analysis of mesenchymal-like and adrenergic-like neuroblastoma cell lines.
Wilcoxon ranksum test P-value for gene set overrepresentation: 1.75e-46
Mean rank of genes in gene set: 3840.16
Median rank of genes in gene set: 2410
Rank on gene expression program of top 30 genes in gene set:
| Genes | Weight | Rank | GTEx | DepMap | Descartes | Mean.Counts | Mean.TPM |
|---|---|---|---|---|---|---|---|
| WWTR1 | 0.0104003 | 10 | GTEx | DepMap | Descartes | 1.91 | 657.44 |
| EMP1 | 0.0081823 | 20 | GTEx | DepMap | Descartes | 1.27 | 576.00 |
| HES1 | 0.0074138 | 23 | GTEx | DepMap | Descartes | 0.35 | 572.55 |
| RHOJ | 0.0073426 | 24 | GTEx | DepMap | Descartes | 0.63 | 362.46 |
| TM4SF1 | 0.0073164 | 26 | GTEx | DepMap | Descartes | 0.37 | 273.32 |
| COL4A1 | 0.0066876 | 33 | GTEx | DepMap | Descartes | 1.75 | 503.70 |
| ID1 | 0.0059744 | 38 | GTEx | DepMap | Descartes | 0.46 | 835.54 |
| TGFBR2 | 0.0059431 | 39 | GTEx | DepMap | Descartes | 0.74 | 205.94 |
| COL4A2 | 0.0058635 | 40 | GTEx | DepMap | Descartes | 1.62 | 447.64 |
| PTPRG | 0.0055071 | 47 | GTEx | DepMap | Descartes | 2.52 | 458.56 |
| PTPN14 | 0.0051763 | 52 | GTEx | DepMap | Descartes | 0.45 | 58.88 |
| ADAMTS5 | 0.0048485 | 58 | GTEx | DepMap | Descartes | 0.26 | 51.11 |
| ETS1 | 0.0045344 | 71 | GTEx | DepMap | Descartes | 0.64 | 230.70 |
| TFPI | 0.0045312 | 72 | GTEx | DepMap | Descartes | 0.91 | 190.75 |
| SASH1 | 0.0040449 | 94 | GTEx | DepMap | Descartes | 0.75 | 209.84 |
| FNDC3B | 0.0038348 | 104 | GTEx | DepMap | Descartes | 1.68 | 384.59 |
| FLRT2 | 0.0037529 | 107 | GTEx | DepMap | Descartes | 1.13 | 62.68 |
| SPRY1 | 0.0036791 | 110 | GTEx | DepMap | Descartes | 0.30 | 210.51 |
| NFIA | 0.0036717 | 111 | GTEx | DepMap | Descartes | 1.21 | 46.64 |
| RIN2 | 0.0036207 | 114 | GTEx | DepMap | Descartes | 0.55 | 207.49 |
| ELK3 | 0.0035877 | 116 | GTEx | DepMap | Descartes | 0.42 | 195.15 |
| NRP1 | 0.0033220 | 125 | GTEx | DepMap | Descartes | 1.75 | 462.96 |
| A2M | 0.0033209 | 126 | GTEx | DepMap | Descartes | 0.74 | 273.79 |
| PDLIM1 | 0.0032865 | 128 | GTEx | DepMap | Descartes | 0.26 | 268.40 |
| GJA1 | 0.0032349 | 133 | GTEx | DepMap | Descartes | 0.20 | 86.13 |
| PEAK1 | 0.0028837 | 156 | GTEx | DepMap | Descartes | 1.07 | NA |
| PLSCR4 | 0.0028565 | 157 | GTEx | DepMap | Descartes | 0.28 | 138.54 |
| MAML2 | 0.0027883 | 164 | GTEx | DepMap | Descartes | 1.74 | 415.56 |
| PDE7B | 0.0027336 | 168 | GTEx | DepMap | Descartes | 0.61 | 192.28 |
| NID1 | 0.0026962 | 173 | GTEx | DepMap | Descartes | 0.30 | 99.19 |
Descartes adrenocortical markers
Top 50 marker genes of adrenocortical cells in the Decartes fetal adrenal single cell map (https://atlas.brotmanbaty.org/bbi/human-gene-expression-during-development/cell/adrenocortical/in/adrenal)
Wilcoxon ranksum test P-value for gene set overrepresentation: 9.83e-01
Mean rank of genes in gene set: 7547.61
Median rank of genes in gene set: 8769.5
Rank on gene expression program of top 30 genes in gene set:
| Genes | Weight | Rank | GTEx | DepMap | Descartes | Mean.Counts | Mean.TPM |
|---|---|---|---|---|---|---|---|
| SH3PXD2B | 0.0014302 | 382 | GTEx | DepMap | Descartes | 0.39 | 73.03 |
| SH3BP5 | 0.0013620 | 406 | GTEx | DepMap | Descartes | 0.29 | 117.41 |
| LDLR | 0.0004465 | 1253 | GTEx | DepMap | Descartes | 0.17 | 55.33 |
| PAPSS2 | 0.0004292 | 1290 | GTEx | DepMap | Descartes | 0.18 | 67.90 |
| BAIAP2L1 | 0.0003141 | 1719 | GTEx | DepMap | Descartes | 0.07 | 31.97 |
| PDE10A | 0.0002698 | 1915 | GTEx | DepMap | Descartes | 0.80 | 184.36 |
| FDPS | 0.0001626 | 2752 | GTEx | DepMap | Descartes | 0.37 | 240.95 |
| ERN1 | 0.0001041 | 3452 | GTEx | DepMap | Descartes | 0.13 | 21.36 |
| CYB5B | 0.0000999 | 3496 | GTEx | DepMap | Descartes | 0.21 | 76.01 |
| NPC1 | 0.0000931 | 3606 | GTEx | DepMap | Descartes | 0.18 | 49.46 |
| GRAMD1B | 0.0000805 | 3801 | GTEx | DepMap | Descartes | 0.09 | 26.43 |
| FDX1 | 0.0000102 | 5180 | GTEx | DepMap | Descartes | 0.04 | 16.57 |
| DHCR7 | -0.0000311 | 6250 | GTEx | DepMap | Descartes | 0.02 | 6.62 |
| STAR | -0.0000755 | 7655 | GTEx | DepMap | Descartes | 0.00 | 0.00 |
| SCAP | -0.0000855 | 7966 | GTEx | DepMap | Descartes | 0.20 | 65.72 |
| INHA | -0.0001017 | 8457 | GTEx | DepMap | Descartes | 0.01 | 1.39 |
| SCARB1 | -0.0001100 | 8680 | GTEx | DepMap | Descartes | 0.12 | 22.58 |
| IGF1R | -0.0001110 | 8707 | GTEx | DepMap | Descartes | 0.90 | 98.25 |
| FDXR | -0.0001150 | 8832 | GTEx | DepMap | Descartes | 0.04 | 41.22 |
| FREM2 | -0.0001189 | 8943 | GTEx | DepMap | Descartes | 0.01 | 0.30 |
| CLU | -0.0001394 | 9510 | GTEx | DepMap | Descartes | 0.47 | 249.17 |
| GSTA4 | -0.0001480 | 9725 | GTEx | DepMap | Descartes | 0.13 | 116.78 |
| MSMO1 | -0.0001657 | 10102 | GTEx | DepMap | Descartes | 0.03 | 9.19 |
| SGCZ | -0.0001675 | 10138 | GTEx | DepMap | Descartes | 0.18 | 23.86 |
| HMGCR | -0.0001761 | 10317 | GTEx | DepMap | Descartes | 0.10 | 28.93 |
| DHCR24 | -0.0001819 | 10429 | GTEx | DepMap | Descartes | 0.07 | 31.45 |
| POR | -0.0001834 | 10454 | GTEx | DepMap | Descartes | 0.11 | 52.96 |
| TM7SF2 | -0.0002023 | 10774 | GTEx | DepMap | Descartes | 0.06 | 26.85 |
| PEG3 | -0.0002189 | 11013 | GTEx | DepMap | Descartes | 0.12 | NA |
| HMGCS1 | -0.0002406 | 11261 | GTEx | DepMap | Descartes | 0.06 | 22.97 |
Descartes chromaffin markers
Top 50 marker genes of chromaffin cells in the Decartes fetal adrenal single cell map (https://atlas.brotmanbaty.org/bbi/human-gene-expression-during-development/cell/chromaffin/in/adrenal)
Wilcoxon ranksum test P-value for gene set overrepresentation: 1.00e+00
Mean rank of genes in gene set: 11930.49
Median rank of genes in gene set: 12258
Rank on gene expression program of top 30 genes in gene set:
| Genes | Weight | Rank | GTEx | DepMap | Descartes | Mean.Counts | Mean.TPM |
|---|---|---|---|---|---|---|---|
| RPH3A | -0.0000626 | 7238 | GTEx | DepMap | Descartes | 0.03 | 10.25 |
| MAB21L1 | -0.0001123 | 8756 | GTEx | DepMap | Descartes | 0.10 | 61.17 |
| MAB21L2 | -0.0002237 | 11070 | GTEx | DepMap | Descartes | 0.09 | 43.02 |
| REEP1 | -0.0002273 | 11120 | GTEx | DepMap | Descartes | 0.17 | 34.19 |
| CNTFR | -0.0002273 | 11121 | GTEx | DepMap | Descartes | 0.11 | 38.36 |
| GAL | -0.0002614 | 11465 | GTEx | DepMap | Descartes | 0.33 | 844.13 |
| RGMB | -0.0002726 | 11564 | GTEx | DepMap | Descartes | 0.15 | 34.19 |
| NTRK1 | -0.0002812 | 11621 | GTEx | DepMap | Descartes | 0.17 | 47.61 |
| PTCHD1 | -0.0002917 | 11687 | GTEx | DepMap | Descartes | 0.09 | 4.23 |
| GAP43 | -0.0003152 | 11815 | GTEx | DepMap | Descartes | 0.45 | 204.49 |
| TMEFF2 | -0.0003210 | 11835 | GTEx | DepMap | Descartes | 0.17 | 45.76 |
| HS3ST5 | -0.0003467 | 11951 | GTEx | DepMap | Descartes | 0.52 | 118.83 |
| FAT3 | -0.0003471 | 11954 | GTEx | DepMap | Descartes | 0.19 | 11.58 |
| GREM1 | -0.0003539 | 11970 | GTEx | DepMap | Descartes | 0.04 | 6.24 |
| CNKSR2 | -0.0003621 | 12013 | GTEx | DepMap | Descartes | 0.32 | 33.94 |
| PLXNA4 | -0.0003798 | 12058 | GTEx | DepMap | Descartes | 0.41 | 24.45 |
| TUBB2A | -0.0003870 | 12084 | GTEx | DepMap | Descartes | 0.31 | 204.12 |
| ANKFN1 | -0.0003881 | 12092 | GTEx | DepMap | Descartes | 0.23 | 29.93 |
| SYNPO2 | -0.0004503 | 12223 | GTEx | DepMap | Descartes | 0.40 | 22.80 |
| SLC44A5 | -0.0004517 | 12225 | GTEx | DepMap | Descartes | 0.48 | 68.28 |
| EPHA6 | -0.0004730 | 12258 | GTEx | DepMap | Descartes | 0.32 | 58.10 |
| SLC6A2 | -0.0004785 | 12271 | GTEx | DepMap | Descartes | 0.12 | 43.80 |
| MLLT11 | -0.0005030 | 12314 | GTEx | DepMap | Descartes | 0.34 | 163.39 |
| EYA1 | -0.0005397 | 12356 | GTEx | DepMap | Descartes | 0.28 | 69.98 |
| CCND1 | -0.0005797 | 12382 | GTEx | DepMap | Descartes | 0.96 | 248.18 |
| ISL1 | -0.0006045 | 12401 | GTEx | DepMap | Descartes | 0.33 | 133.29 |
| ELAVL2 | -0.0006568 | 12429 | GTEx | DepMap | Descartes | 0.28 | 50.99 |
| IL7 | -0.0006597 | 12431 | GTEx | DepMap | Descartes | 0.96 | 414.27 |
| EYA4 | -0.0007031 | 12458 | GTEx | DepMap | Descartes | 0.42 | 86.08 |
| TMEM132C | -0.0007137 | 12464 | GTEx | DepMap | Descartes | 1.17 | 197.99 |
Descartes Vascular_endothelial markers
Top 50 marker genes of Vascular_endothelial cells in the Decartes fetal adrenal single cell map (https://atlas.brotmanbaty.org/bbi/human-gene-expression-during-development/cell/vascular_endothelial/in/adrenal)
Wilcoxon ranksum test P-value for gene set overrepresentation: 6.45e-19
Mean rank of genes in gene set: 1107.29
Median rank of genes in gene set: 136
Rank on gene expression program of top 30 genes in gene set:
| Genes | Weight | Rank | GTEx | DepMap | Descartes | Mean.Counts | Mean.TPM |
|---|---|---|---|---|---|---|---|
| CALCRL | 0.0103714 | 11 | GTEx | DepMap | Descartes | 1.17 | 398.05 |
| ESM1 | 0.0086103 | 18 | GTEx | DepMap | Descartes | 0.16 | 65.80 |
| NOTCH4 | 0.0073226 | 25 | GTEx | DepMap | Descartes | 0.56 | 132.54 |
| PLVAP | 0.0072142 | 27 | GTEx | DepMap | Descartes | 0.55 | 375.10 |
| ID1 | 0.0059744 | 38 | GTEx | DepMap | Descartes | 0.46 | 835.54 |
| CDH5 | 0.0058189 | 41 | GTEx | DepMap | Descartes | 0.28 | 129.83 |
| KDR | 0.0058169 | 42 | GTEx | DepMap | Descartes | 0.25 | 75.48 |
| BTNL9 | 0.0054856 | 48 | GTEx | DepMap | Descartes | 0.10 | 38.47 |
| CDH13 | 0.0050476 | 54 | GTEx | DepMap | Descartes | 1.37 | 299.98 |
| SLCO2A1 | 0.0049131 | 57 | GTEx | DepMap | Descartes | 0.45 | 185.90 |
| FLT4 | 0.0047986 | 60 | GTEx | DepMap | Descartes | 0.20 | 94.84 |
| PTPRB | 0.0047065 | 65 | GTEx | DepMap | Descartes | 0.96 | 137.73 |
| TIE1 | 0.0046093 | 68 | GTEx | DepMap | Descartes | 0.33 | 150.27 |
| ROBO4 | 0.0039215 | 102 | GTEx | DepMap | Descartes | 0.17 | 58.30 |
| SHANK3 | 0.0037920 | 106 | GTEx | DepMap | Descartes | 0.45 | 126.71 |
| ARHGAP29 | 0.0037192 | 109 | GTEx | DepMap | Descartes | 0.87 | 195.12 |
| RASIP1 | 0.0036707 | 112 | GTEx | DepMap | Descartes | 0.15 | 96.00 |
| KANK3 | 0.0035841 | 117 | GTEx | DepMap | Descartes | 0.26 | 246.01 |
| CLDN5 | 0.0034482 | 120 | GTEx | DepMap | Descartes | 0.29 | 143.19 |
| PODXL | 0.0029192 | 152 | GTEx | DepMap | Descartes | 0.47 | 140.80 |
| TEK | 0.0028196 | 160 | GTEx | DepMap | Descartes | 0.21 | 91.19 |
| SHE | 0.0027145 | 172 | GTEx | DepMap | Descartes | 0.15 | 45.77 |
| NR5A2 | 0.0026708 | 175 | GTEx | DepMap | Descartes | 0.25 | 109.20 |
| MMRN2 | 0.0026142 | 179 | GTEx | DepMap | Descartes | 0.16 | 62.51 |
| EFNB2 | 0.0020892 | 249 | GTEx | DepMap | Descartes | 0.50 | 127.06 |
| NPR1 | 0.0017071 | 312 | GTEx | DepMap | Descartes | 0.05 | 22.81 |
| HYAL2 | 0.0011449 | 489 | GTEx | DepMap | Descartes | 0.15 | 78.29 |
| CEACAM1 | 0.0006118 | 941 | GTEx | DepMap | Descartes | 0.16 | 91.83 |
| RAMP2 | 0.0005715 | 1016 | GTEx | DepMap | Descartes | 0.17 | 370.40 |
| F8 | 0.0005712 | 1017 | GTEx | DepMap | Descartes | 0.04 | 3.52 |
Descartes stromal markers
Top 50 marker genes of stromal cells in the Decartes fetal adrenal single cell map (https://atlas.brotmanbaty.org/bbi/human-gene-expression-during-development/cell/stromal/in/adrenal)
Wilcoxon ranksum test P-value for gene set overrepresentation: 1.00e+00
Mean rank of genes in gene set: 8155.75
Median rank of genes in gene set: 10032
Rank on gene expression program of top 30 genes in gene set:
| Genes | Weight | Rank | GTEx | DepMap | Descartes | Mean.Counts | Mean.TPM |
|---|---|---|---|---|---|---|---|
| IGFBP3 | 0.0047601 | 63 | GTEx | DepMap | Descartes | 0.42 | 166.79 |
| DKK2 | 0.0016990 | 314 | GTEx | DepMap | Descartes | 0.07 | 23.63 |
| MGP | 0.0014700 | 369 | GTEx | DepMap | Descartes | 0.74 | 597.18 |
| EDNRA | 0.0009869 | 586 | GTEx | DepMap | Descartes | 0.13 | 29.36 |
| ELN | 0.0008618 | 685 | GTEx | DepMap | Descartes | 0.40 | 182.06 |
| RSPO3 | 0.0008002 | 734 | GTEx | DepMap | Descartes | 0.01 | NA |
| COL27A1 | 0.0006879 | 845 | GTEx | DepMap | Descartes | 0.13 | 28.84 |
| ADAMTSL3 | 0.0005712 | 1018 | GTEx | DepMap | Descartes | 0.07 | 19.65 |
| ABCC9 | 0.0003703 | 1472 | GTEx | DepMap | Descartes | 0.13 | 13.65 |
| CD248 | 0.0001530 | 2841 | GTEx | DepMap | Descartes | 0.08 | 46.86 |
| ACTA2 | 0.0000710 | 3991 | GTEx | DepMap | Descartes | 0.23 | 203.28 |
| CLDN11 | 0.0000566 | 4258 | GTEx | DepMap | Descartes | 0.08 | 43.10 |
| ABCA6 | 0.0000362 | 4648 | GTEx | DepMap | Descartes | 0.07 | 10.28 |
| SFRP2 | -0.0000503 | 6825 | GTEx | DepMap | Descartes | 0.02 | 26.04 |
| PAMR1 | -0.0000606 | 7161 | GTEx | DepMap | Descartes | 0.06 | 23.87 |
| OGN | -0.0000857 | 7971 | GTEx | DepMap | Descartes | 0.04 | 13.55 |
| ITGA11 | -0.0000923 | 8179 | GTEx | DepMap | Descartes | 0.09 | 12.05 |
| PCDH18 | -0.0001021 | 8469 | GTEx | DepMap | Descartes | 0.02 | 1.83 |
| SCARA5 | -0.0001134 | 8786 | GTEx | DepMap | Descartes | 0.00 | 0.00 |
| LRRC17 | -0.0001288 | 9230 | GTEx | DepMap | Descartes | 0.01 | 5.40 |
| COL6A3 | -0.0001428 | 9598 | GTEx | DepMap | Descartes | 0.39 | 43.67 |
| LAMC3 | -0.0001430 | 9603 | GTEx | DepMap | Descartes | 0.01 | 3.79 |
| GLI2 | -0.0001836 | 10461 | GTEx | DepMap | Descartes | 0.06 | 20.62 |
| LOX | -0.0001938 | 10630 | GTEx | DepMap | Descartes | 0.02 | 3.29 |
| GAS2 | -0.0002175 | 10997 | GTEx | DepMap | Descartes | 0.07 | 51.92 |
| PRICKLE1 | -0.0002289 | 11143 | GTEx | DepMap | Descartes | 0.31 | 70.70 |
| PRRX1 | -0.0002365 | 11218 | GTEx | DepMap | Descartes | 0.15 | 50.33 |
| CCDC80 | -0.0002388 | 11244 | GTEx | DepMap | Descartes | 0.14 | 24.73 |
| ADAMTS2 | -0.0003389 | 11920 | GTEx | DepMap | Descartes | 0.20 | 35.98 |
| HHIP | -0.0003446 | 11946 | GTEx | DepMap | Descartes | 0.08 | 5.79 |
Descartes sympathoblasts markers
Top 50 marker genes of sympathoblasts cells in the Decartes fetal adrenal single cell map (https://atlas.brotmanbaty.org/bbi/human-gene-expression-during-development/cell/sympathoblasts/in/adrenal)
Wilcoxon ranksum test P-value for gene set overrepresentation: 1.00e+00
Mean rank of genes in gene set: 10790.21
Median rank of genes in gene set: 11864
Rank on gene expression program of top 30 genes in gene set:
| Genes | Weight | Rank | GTEx | DepMap | Descartes | Mean.Counts | Mean.TPM |
|---|---|---|---|---|---|---|---|
| PENK | 0.0001217 | 3205 | GTEx | DepMap | Descartes | 0.01 | 5.89 |
| ARC | 0.0000614 | 4169 | GTEx | DepMap | Descartes | 0.05 | 25.00 |
| GCH1 | 0.0000056 | 5299 | GTEx | DepMap | Descartes | 0.19 | 95.66 |
| SLC24A2 | -0.0000255 | 6077 | GTEx | DepMap | Descartes | 0.06 | 7.59 |
| LAMA3 | -0.0000483 | 6768 | GTEx | DepMap | Descartes | 0.07 | 5.68 |
| DGKK | -0.0000831 | 7898 | GTEx | DepMap | Descartes | 0.02 | 3.35 |
| SORCS3 | -0.0000914 | 8149 | GTEx | DepMap | Descartes | 0.04 | 8.10 |
| SLC35F3 | -0.0001808 | 10409 | GTEx | DepMap | Descartes | 0.22 | 92.92 |
| C1QL1 | -0.0001966 | 10678 | GTEx | DepMap | Descartes | 0.07 | 78.45 |
| CNTN3 | -0.0002075 | 10851 | GTEx | DepMap | Descartes | 0.09 | 16.14 |
| CDH12 | -0.0002168 | 10986 | GTEx | DepMap | Descartes | 0.06 | 7.98 |
| SLC18A1 | -0.0002297 | 11149 | GTEx | DepMap | Descartes | 0.17 | 67.31 |
| GRID2 | -0.0002339 | 11201 | GTEx | DepMap | Descartes | 0.26 | 23.21 |
| HTATSF1 | -0.0002441 | 11301 | GTEx | DepMap | Descartes | 0.08 | 33.41 |
| SPOCK3 | -0.0002811 | 11619 | GTEx | DepMap | Descartes | 0.09 | 47.69 |
| TENM1 | -0.0002993 | 11738 | GTEx | DepMap | Descartes | 0.42 | NA |
| KSR2 | -0.0002997 | 11743 | GTEx | DepMap | Descartes | 0.18 | 7.83 |
| TBX20 | -0.0003097 | 11783 | GTEx | DepMap | Descartes | 0.09 | 42.63 |
| PACRG | -0.0003272 | 11863 | GTEx | DepMap | Descartes | 0.34 | 185.60 |
| PCSK2 | -0.0003273 | 11865 | GTEx | DepMap | Descartes | 0.17 | 31.25 |
| AGBL4 | -0.0003576 | 11990 | GTEx | DepMap | Descartes | 1.04 | 319.90 |
| EML6 | -0.0003638 | 12017 | GTEx | DepMap | Descartes | 0.21 | 39.97 |
| ST18 | -0.0003819 | 12067 | GTEx | DepMap | Descartes | 0.09 | 24.59 |
| GRM7 | -0.0003993 | 12129 | GTEx | DepMap | Descartes | 0.14 | 22.60 |
| CDH18 | -0.0004008 | 12133 | GTEx | DepMap | Descartes | 0.11 | 35.41 |
| MGAT4C | -0.0004023 | 12136 | GTEx | DepMap | Descartes | 0.37 | 11.88 |
| NTNG1 | -0.0004169 | 12175 | GTEx | DepMap | Descartes | 0.37 | 65.18 |
| KCTD16 | -0.0004972 | 12305 | GTEx | DepMap | Descartes | 0.61 | 40.16 |
| GALNTL6 | -0.0005141 | 12327 | GTEx | DepMap | Descartes | 0.18 | 32.25 |
| FAM155A | -0.0005277 | 12343 | GTEx | DepMap | Descartes | 5.12 | 742.73 |
Descartes erythroblasts markers
Top 50 marker genes of erythroblasts cells in the Decartes fetal adrenal single cell map (https://atlas.brotmanbaty.org/bbi/human-gene-expression-during-development/cell/erythroblasts/in/adrenal)
Wilcoxon ranksum test P-value for gene set overrepresentation: 1.59e-01
Mean rank of genes in gene set: 5604.62
Median rank of genes in gene set: 4843
Rank on gene expression program of top 30 genes in gene set:
| Genes | Weight | Rank | GTEx | DepMap | Descartes | Mean.Counts | Mean.TPM |
|---|---|---|---|---|---|---|---|
| MARCH3 | 0.0014632 | 372 | GTEx | DepMap | Descartes | 0.55 | NA |
| SLC25A37 | 0.0010449 | 543 | GTEx | DepMap | Descartes | 0.30 | 106.20 |
| GYPC | 0.0009551 | 615 | GTEx | DepMap | Descartes | 0.10 | 72.28 |
| RAPGEF2 | 0.0008988 | 652 | GTEx | DepMap | Descartes | 0.85 | 150.38 |
| SPECC1 | 0.0006167 | 930 | GTEx | DepMap | Descartes | 0.08 | 14.46 |
| MICAL2 | 0.0006074 | 950 | GTEx | DepMap | Descartes | 0.31 | 97.03 |
| TSPAN5 | 0.0003374 | 1615 | GTEx | DepMap | Descartes | 0.85 | 302.19 |
| CPOX | 0.0001705 | 2672 | GTEx | DepMap | Descartes | 0.07 | 37.99 |
| RGS6 | 0.0000980 | 3524 | GTEx | DepMap | Descartes | 0.02 | 3.05 |
| TMCC2 | 0.0000655 | 4085 | GTEx | DepMap | Descartes | 0.02 | 5.75 |
| SNCA | 0.0000511 | 4348 | GTEx | DepMap | Descartes | 0.19 | 59.79 |
| DENND4A | 0.0000488 | 4385 | GTEx | DepMap | Descartes | 0.61 | 95.49 |
| CAT | 0.0000468 | 4423 | GTEx | DepMap | Descartes | 0.10 | 59.93 |
| ALAS2 | 0.0000277 | 4819 | GTEx | DepMap | Descartes | 0.00 | 0.00 |
| RHD | 0.0000265 | 4843 | GTEx | DepMap | Descartes | 0.06 | 26.16 |
| SLC25A21 | 0.0000252 | 4867 | GTEx | DepMap | Descartes | 0.03 | 11.19 |
| TRAK2 | 0.0000099 | 5192 | GTEx | DepMap | Descartes | 0.12 | 20.57 |
| SELENBP1 | -0.0000499 | 6818 | GTEx | DepMap | Descartes | 0.01 | 3.02 |
| XPO7 | -0.0000759 | 7664 | GTEx | DepMap | Descartes | 0.24 | 65.12 |
| ABCB10 | -0.0000767 | 7692 | GTEx | DepMap | Descartes | 0.11 | 29.16 |
| SLC4A1 | -0.0000827 | 7886 | GTEx | DepMap | Descartes | 0.00 | 0.00 |
| SOX6 | -0.0001160 | 8859 | GTEx | DepMap | Descartes | 0.34 | 31.65 |
| FECH | -0.0001174 | 8904 | GTEx | DepMap | Descartes | 0.07 | 7.94 |
| SPTB | -0.0001226 | 9057 | GTEx | DepMap | Descartes | 0.04 | 9.03 |
| BLVRB | -0.0001993 | 10716 | GTEx | DepMap | Descartes | 0.04 | 18.29 |
| EPB41 | -0.0002275 | 11124 | GTEx | DepMap | Descartes | 0.35 | 71.66 |
| GCLC | -0.0002689 | 11534 | GTEx | DepMap | Descartes | 0.10 | 52.73 |
| ANK1 | -0.0002920 | 11689 | GTEx | DepMap | Descartes | 0.13 | 17.05 |
| TFR2 | -0.0003021 | 11756 | GTEx | DepMap | Descartes | 0.13 | 31.02 |
| NA | NA | NA | NA | NA | NA | NA | NA |
Descartes myeloid markers
Top 50 marker genes of myeloid cells in the Decartes fetal adrenal single cell map (https://atlas.brotmanbaty.org/bbi/human-gene-expression-during-development/cell/myeloid/in/adrenal)
Wilcoxon ranksum test P-value for gene set overrepresentation: 7.48e-01
Mean rank of genes in gene set: 6666.71
Median rank of genes in gene set: 6410.5
Rank on gene expression program of top 30 genes in gene set:
| Genes | Weight | Rank | GTEx | DepMap | Descartes | Mean.Counts | Mean.TPM |
|---|---|---|---|---|---|---|---|
| PTPRE | 0.0056420 | 45 | GTEx | DepMap | Descartes | 1.10 | 409.02 |
| SFMBT2 | 0.0022734 | 220 | GTEx | DepMap | Descartes | 0.80 | 163.84 |
| ITPR2 | 0.0016423 | 327 | GTEx | DepMap | Descartes | 0.71 | 93.49 |
| HRH1 | 0.0010938 | 512 | GTEx | DepMap | Descartes | 0.23 | 55.28 |
| SLC9A9 | 0.0007982 | 735 | GTEx | DepMap | Descartes | 0.48 | 218.16 |
| FGL2 | 0.0003456 | 1579 | GTEx | DepMap | Descartes | 0.02 | 3.71 |
| MSR1 | 0.0001954 | 2437 | GTEx | DepMap | Descartes | 0.10 | 44.12 |
| SLC1A3 | 0.0001858 | 2530 | GTEx | DepMap | Descartes | 0.05 | 26.68 |
| WWP1 | 0.0001398 | 2975 | GTEx | DepMap | Descartes | 0.29 | 96.42 |
| CTSC | 0.0001298 | 3100 | GTEx | DepMap | Descartes | 0.08 | 27.20 |
| ABCA1 | 0.0000708 | 3994 | GTEx | DepMap | Descartes | 0.23 | 30.73 |
| MS4A4A | 0.0000581 | 4240 | GTEx | DepMap | Descartes | 0.01 | 11.03 |
| MERTK | 0.0000334 | 4704 | GTEx | DepMap | Descartes | 0.12 | 34.62 |
| LGMN | -0.0000028 | 5481 | GTEx | DepMap | Descartes | 0.20 | 118.86 |
| CD163 | -0.0000107 | 5686 | GTEx | DepMap | Descartes | 0.02 | 4.26 |
| HCK | -0.0000115 | 5711 | GTEx | DepMap | Descartes | 0.05 | 35.65 |
| RGL1 | -0.0000117 | 5717 | GTEx | DepMap | Descartes | 0.25 | 58.45 |
| CTSS | -0.0000248 | 6052 | GTEx | DepMap | Descartes | 0.08 | 29.31 |
| AXL | -0.0000344 | 6330 | GTEx | DepMap | Descartes | 0.12 | 39.53 |
| TGFBI | -0.0000391 | 6491 | GTEx | DepMap | Descartes | 0.12 | 32.10 |
| ADAP2 | -0.0000508 | 6840 | GTEx | DepMap | Descartes | 0.10 | 39.21 |
| CD74 | -0.0000638 | 7275 | GTEx | DepMap | Descartes | 0.45 | 248.71 |
| IFNGR1 | -0.0000641 | 7287 | GTEx | DepMap | Descartes | 0.15 | 67.96 |
| ATP8B4 | -0.0000931 | 8197 | GTEx | DepMap | Descartes | 0.02 | 5.98 |
| CPVL | -0.0000978 | 8334 | GTEx | DepMap | Descartes | 0.09 | 62.79 |
| FGD2 | -0.0001272 | 9186 | GTEx | DepMap | Descartes | 0.03 | 6.31 |
| RBPJ | -0.0001521 | 9819 | GTEx | DepMap | Descartes | 0.35 | 85.10 |
| CST3 | -0.0001601 | 9988 | GTEx | DepMap | Descartes | 0.29 | 120.72 |
| MARCH1 | -0.0001680 | 10150 | GTEx | DepMap | Descartes | 0.18 | NA |
| SLCO2B1 | -0.0001924 | 10605 | GTEx | DepMap | Descartes | 0.09 | 33.18 |
Descartes Schwann markers
Top 50 marker genes of Schwann cells in the Decartes fetal adrenal single cell map (https://atlas.brotmanbaty.org/bbi/human-gene-expression-during-development/cell/schwann/in/adrenal)
Wilcoxon ranksum test P-value for gene set overrepresentation: 1.57e-01
Mean rank of genes in gene set: 5726.02
Median rank of genes in gene set: 3896
Rank on gene expression program of top 30 genes in gene set:
| Genes | Weight | Rank | GTEx | DepMap | Descartes | Mean.Counts | Mean.TPM |
|---|---|---|---|---|---|---|---|
| ADAMTS5 | 0.0048485 | 58 | GTEx | DepMap | Descartes | 0.26 | 51.11 |
| STARD13 | 0.0025288 | 189 | GTEx | DepMap | Descartes | 0.58 | 151.50 |
| LAMA4 | 0.0024704 | 192 | GTEx | DepMap | Descartes | 0.28 | 78.04 |
| COL18A1 | 0.0024269 | 201 | GTEx | DepMap | Descartes | 1.01 | 278.75 |
| EDNRB | 0.0014604 | 374 | GTEx | DepMap | Descartes | 0.06 | 15.33 |
| LAMC1 | 0.0014165 | 387 | GTEx | DepMap | Descartes | 0.57 | 131.14 |
| NRXN3 | 0.0013205 | 422 | GTEx | DepMap | Descartes | 0.85 | 161.47 |
| LAMB1 | 0.0012700 | 437 | GTEx | DepMap | Descartes | 0.78 | 244.45 |
| VIM | 0.0011772 | 474 | GTEx | DepMap | Descartes | 1.17 | 865.55 |
| OLFML2A | 0.0009323 | 632 | GTEx | DepMap | Descartes | 0.07 | 17.00 |
| EGFLAM | 0.0006692 | 869 | GTEx | DepMap | Descartes | 0.16 | 37.31 |
| KCTD12 | 0.0005863 | 982 | GTEx | DepMap | Descartes | 0.10 | 21.91 |
| PLCE1 | 0.0005330 | 1072 | GTEx | DepMap | Descartes | 0.12 | 8.65 |
| HMGA2 | 0.0004458 | 1256 | GTEx | DepMap | Descartes | 0.02 | 2.82 |
| PTPRZ1 | 0.0004214 | 1309 | GTEx | DepMap | Descartes | 0.00 | 0.00 |
| GAS7 | 0.0004207 | 1310 | GTEx | DepMap | Descartes | 0.23 | 64.72 |
| PLP1 | 0.0003552 | 1541 | GTEx | DepMap | Descartes | 0.00 | 0.00 |
| IL1RAPL2 | 0.0003107 | 1734 | GTEx | DepMap | Descartes | 0.06 | 8.28 |
| ERBB3 | 0.0001759 | 2617 | GTEx | DepMap | Descartes | 0.01 | 3.37 |
| SLC35F1 | 0.0001758 | 2621 | GTEx | DepMap | Descartes | 0.09 | 18.93 |
| TRPM3 | 0.0001069 | 3407 | GTEx | DepMap | Descartes | 0.26 | 16.26 |
| MPZ | 0.0000936 | 3597 | GTEx | DepMap | Descartes | 0.02 | 6.71 |
| IL1RAPL1 | 0.0000604 | 4195 | GTEx | DepMap | Descartes | 0.17 | 73.44 |
| XKR4 | -0.0000326 | 6280 | GTEx | DepMap | Descartes | 0.31 | 13.46 |
| COL5A2 | -0.0000460 | 6694 | GTEx | DepMap | Descartes | 0.48 | 127.32 |
| MDGA2 | -0.0000826 | 7883 | GTEx | DepMap | Descartes | 0.00 | 0.00 |
| GRIK3 | -0.0000965 | 8305 | GTEx | DepMap | Descartes | 0.04 | 4.13 |
| SOX5 | -0.0001052 | 8550 | GTEx | DepMap | Descartes | 0.46 | 80.15 |
| COL25A1 | -0.0001417 | 9566 | GTEx | DepMap | Descartes | 0.01 | 2.50 |
| SFRP1 | -0.0001459 | 9666 | GTEx | DepMap | Descartes | 0.07 | 17.78 |
Descartes Megakaryocytes markers
Top 50 marker genes of Megakaryocytes cells in the Decartes fetal adrenal single cell map (https://atlas.brotmanbaty.org/bbi/human-gene-expression-during-development/cell/megakaryocytes/in/adrenal)
Wilcoxon ranksum test P-value for gene set overrepresentation: 3.02e-05
Mean rank of genes in gene set: 4112.58
Median rank of genes in gene set: 1597
Rank on gene expression program of top 30 genes in gene set:
| Genes | Weight | Rank | GTEx | DepMap | Descartes | Mean.Counts | Mean.TPM |
|---|---|---|---|---|---|---|---|
| MCTP1 | 0.0082794 | 19 | GTEx | DepMap | Descartes | 1.53 | 540.46 |
| FLI1 | 0.0057673 | 43 | GTEx | DepMap | Descartes | 0.80 | 268.87 |
| STOM | 0.0031356 | 140 | GTEx | DepMap | Descartes | 0.39 | 189.38 |
| MMRN1 | 0.0031061 | 142 | GTEx | DepMap | Descartes | 0.27 | 93.38 |
| ARHGAP6 | 0.0026290 | 178 | GTEx | DepMap | Descartes | 0.24 | 90.69 |
| SLC2A3 | 0.0025902 | 184 | GTEx | DepMap | Descartes | 0.60 | 308.57 |
| LTBP1 | 0.0020979 | 248 | GTEx | DepMap | Descartes | 0.28 | 79.69 |
| MYH9 | 0.0019614 | 272 | GTEx | DepMap | Descartes | 0.61 | 116.91 |
| GSN | 0.0014975 | 358 | GTEx | DepMap | Descartes | 0.53 | 166.80 |
| LIMS1 | 0.0009330 | 631 | GTEx | DepMap | Descartes | 0.54 | 177.90 |
| TGFB1 | 0.0009255 | 640 | GTEx | DepMap | Descartes | 0.37 | 219.99 |
| TRPC6 | 0.0008505 | 694 | GTEx | DepMap | Descartes | 0.10 | 39.37 |
| FLNA | 0.0007639 | 767 | GTEx | DepMap | Descartes | 0.53 | 117.50 |
| CD9 | 0.0007526 | 777 | GTEx | DepMap | Descartes | 0.39 | 303.24 |
| RAP1B | 0.0007395 | 793 | GTEx | DepMap | Descartes | 0.38 | 49.44 |
| VCL | 0.0006374 | 906 | GTEx | DepMap | Descartes | 0.36 | 76.23 |
| UBASH3B | 0.0006081 | 948 | GTEx | DepMap | Descartes | 0.10 | 30.81 |
| TPM4 | 0.0005759 | 1004 | GTEx | DepMap | Descartes | 0.46 | 158.48 |
| ACTN1 | 0.0004884 | 1165 | GTEx | DepMap | Descartes | 0.53 | 164.22 |
| PSTPIP2 | 0.0004645 | 1206 | GTEx | DepMap | Descartes | 0.02 | 11.07 |
| THBS1 | 0.0003666 | 1491 | GTEx | DepMap | Descartes | 0.57 | 208.05 |
| STON2 | 0.0003594 | 1522 | GTEx | DepMap | Descartes | 0.16 | 56.32 |
| MYLK | 0.0003418 | 1597 | GTEx | DepMap | Descartes | 0.13 | 17.74 |
| PDE3A | 0.0003220 | 1686 | GTEx | DepMap | Descartes | 0.81 | 132.46 |
| SLC24A3 | 0.0001723 | 2650 | GTEx | DepMap | Descartes | 0.15 | 59.43 |
| TLN1 | 0.0001511 | 2860 | GTEx | DepMap | Descartes | 0.15 | 40.32 |
| ANGPT1 | 0.0001038 | 3456 | GTEx | DepMap | Descartes | 0.06 | 16.60 |
| ZYX | 0.0000701 | 4008 | GTEx | DepMap | Descartes | 0.12 | 116.46 |
| P2RX1 | 0.0000595 | 4210 | GTEx | DepMap | Descartes | 0.00 | 0.00 |
| ITGB3 | -0.0000167 | 5848 | GTEx | DepMap | Descartes | 0.00 | 0.00 |
Descartes Lyphoid markers
Top 50 marker genes of Lyphoid cells in the Decartes fetal adrenal single cell map (https://atlas.brotmanbaty.org/bbi/human-gene-expression-during-development/cell/lymphoid/in/adrenal)
Wilcoxon ranksum test P-value for gene set overrepresentation: 3.24e-01
Mean rank of genes in gene set: 6019.93
Median rank of genes in gene set: 5108.5
Rank on gene expression program of top 30 genes in gene set:
| Genes | Weight | Rank | GTEx | DepMap | Descartes | Mean.Counts | Mean.TPM |
|---|---|---|---|---|---|---|---|
| ETS1 | 0.0045344 | 71 | GTEx | DepMap | Descartes | 0.64 | 230.70 |
| PRKCH | 0.0044142 | 75 | GTEx | DepMap | Descartes | 0.93 | 551.28 |
| MSN | 0.0039449 | 100 | GTEx | DepMap | Descartes | 0.48 | 248.67 |
| PITPNC1 | 0.0023172 | 214 | GTEx | DepMap | Descartes | 1.42 | 388.67 |
| SP100 | 0.0019542 | 273 | GTEx | DepMap | Descartes | 0.47 | 136.45 |
| B2M | 0.0017222 | 305 | GTEx | DepMap | Descartes | 3.20 | 1767.73 |
| ITPKB | 0.0017115 | 311 | GTEx | DepMap | Descartes | 0.22 | 64.53 |
| ABLIM1 | 0.0015183 | 353 | GTEx | DepMap | Descartes | 0.45 | 93.29 |
| FOXP1 | 0.0011308 | 494 | GTEx | DepMap | Descartes | 2.58 | 441.97 |
| LEF1 | 0.0010843 | 522 | GTEx | DepMap | Descartes | 0.15 | 48.43 |
| ARID5B | 0.0010234 | 557 | GTEx | DepMap | Descartes | 0.57 | 144.39 |
| MBNL1 | 0.0009243 | 642 | GTEx | DepMap | Descartes | 1.12 | 295.68 |
| FYN | 0.0006827 | 854 | GTEx | DepMap | Descartes | 1.10 | 399.59 |
| RCSD1 | 0.0006047 | 959 | GTEx | DepMap | Descartes | 0.17 | 55.72 |
| MCTP2 | 0.0005797 | 994 | GTEx | DepMap | Descartes | 0.14 | 21.53 |
| ARHGDIB | 0.0005259 | 1091 | GTEx | DepMap | Descartes | 0.10 | 124.23 |
| WIPF1 | 0.0003903 | 1405 | GTEx | DepMap | Descartes | 0.35 | 142.68 |
| NCALD | 0.0003502 | 1562 | GTEx | DepMap | Descartes | 0.34 | 113.26 |
| CCND3 | 0.0001495 | 2873 | GTEx | DepMap | Descartes | 0.25 | 174.07 |
| PLEKHA2 | 0.0001278 | 3126 | GTEx | DepMap | Descartes | 0.10 | 29.45 |
| ANKRD44 | 0.0000784 | 3842 | GTEx | DepMap | Descartes | 0.34 | 58.83 |
| CCL5 | -0.0000358 | 6375 | GTEx | DepMap | Descartes | 0.02 | 12.89 |
| PTPRC | -0.0000641 | 7290 | GTEx | DepMap | Descartes | 0.09 | 12.62 |
| CELF2 | -0.0001299 | 9265 | GTEx | DepMap | Descartes | 0.50 | 77.67 |
| BACH2 | -0.0001353 | 9415 | GTEx | DepMap | Descartes | 0.45 | 60.81 |
| LCP1 | -0.0001532 | 9837 | GTEx | DepMap | Descartes | 0.04 | 12.08 |
| IKZF1 | -0.0002200 | 11031 | GTEx | DepMap | Descartes | 0.06 | 8.21 |
| SAMD3 | -0.0002231 | 11069 | GTEx | DepMap | Descartes | 0.04 | 5.16 |
| SKAP1 | -0.0002305 | 11162 | GTEx | DepMap | Descartes | 0.10 | 59.38 |
| CD44 | -0.0002322 | 11181 | GTEx | DepMap | Descartes | 0.72 | 155.96 |
Below shows the ranks on this GEP for immune marker gene lists curated by CellTypist (https://www.celltypist.org/encyclopedia).
High ranks indicate this gene is a driver of this GEP.
These curated gene list are ranked by P-value (on this GEP) of their constituent genes.
The Mean Count column shows the mean read count in cells scoring highly (H > 50) on this gene expression program.
Endothelial cells: Endothelial cells (model markers)
single-layered lining cells that constitute the interior vasculature:
Wilcoxon ranksum test P-value for gene set overrepresentation: 6.91e-04
Mean rank of genes in gene set: 482
Rank on gene expression program of genes in gene set:
| Genes | Weight | Rank | GTEx | DepMap | Decartes | Mean.Counts | Mean.TPM |
|---|---|---|---|---|---|---|---|
| VWF | 0.0091431 | 16 | GTEx | DepMap | Descartes | 1.16 | 223.41 |
| MMRN2 | 0.0026142 | 179 | GTEx | DepMap | Descartes | 0.16 | 62.51 |
| JAM2 | 0.0009170 | 645 | GTEx | DepMap | Descartes | 0.15 | 61.67 |
| RAMP3 | 0.0005266 | 1088 | GTEx | DepMap | Descartes | 0.23 | 276.31 |
Endothelial cells: Endothelial cells (curated markers)
single-layered lining cells that constitute the interior vasculature:
Wilcoxon ranksum test P-value for gene set overrepresentation: 1.60e-03
Mean rank of genes in gene set: 108
Rank on gene expression program of genes in gene set:
| Genes | Weight | Rank | GTEx | DepMap | Decartes | Mean.Counts | Mean.TPM |
|---|---|---|---|---|---|---|---|
| PLVAP | 0.0072142 | 27 | GTEx | DepMap | Descartes | 0.55 | 375.10 |
| CLDN5 | 0.0034482 | 120 | GTEx | DepMap | Descartes | 0.29 | 143.19 |
| SPARCL1 | 0.0026590 | 177 | GTEx | DepMap | Descartes | 0.35 | 166.05 |
T cells: CD8a/a (model markers)
unconventional T lymphocytes with CD8 alpha/alpha homodimers binding MHC molecules:
Wilcoxon ranksum test P-value for gene set overrepresentation: 1.80e-02
Mean rank of genes in gene set: 3404.57
Rank on gene expression program of genes in gene set:
| Genes | Weight | Rank | GTEx | DepMap | Decartes | Mean.Counts | Mean.TPM |
|---|---|---|---|---|---|---|---|
| PRKCH | 0.0044142 | 75 | GTEx | DepMap | Descartes | 0.93 | 551.28 |
| LEF1 | 0.0010843 | 522 | GTEx | DepMap | Descartes | 0.15 | 48.43 |
| MALAT1 | 0.0008669 | 681 | GTEx | DepMap | Descartes | 189.28 | 30769.84 |
| NUCB2 | 0.0001903 | 2480 | GTEx | DepMap | Descartes | 0.13 | 45.06 |
| CD27 | 0.0000397 | 4575 | GTEx | DepMap | Descartes | 0.01 | 5.38 |
| CD8A | -0.0000282 | 6163 | GTEx | DepMap | Descartes | 0.04 | 10.46 |
| CTSW | -0.0001328 | 9336 | GTEx | DepMap | Descartes | 0.00 | 0.00 |