Program: 18. Cancer Associated Fibroblast: Inflammatory.
Submit a comment on this gene expression program’s interpretation: CLICK
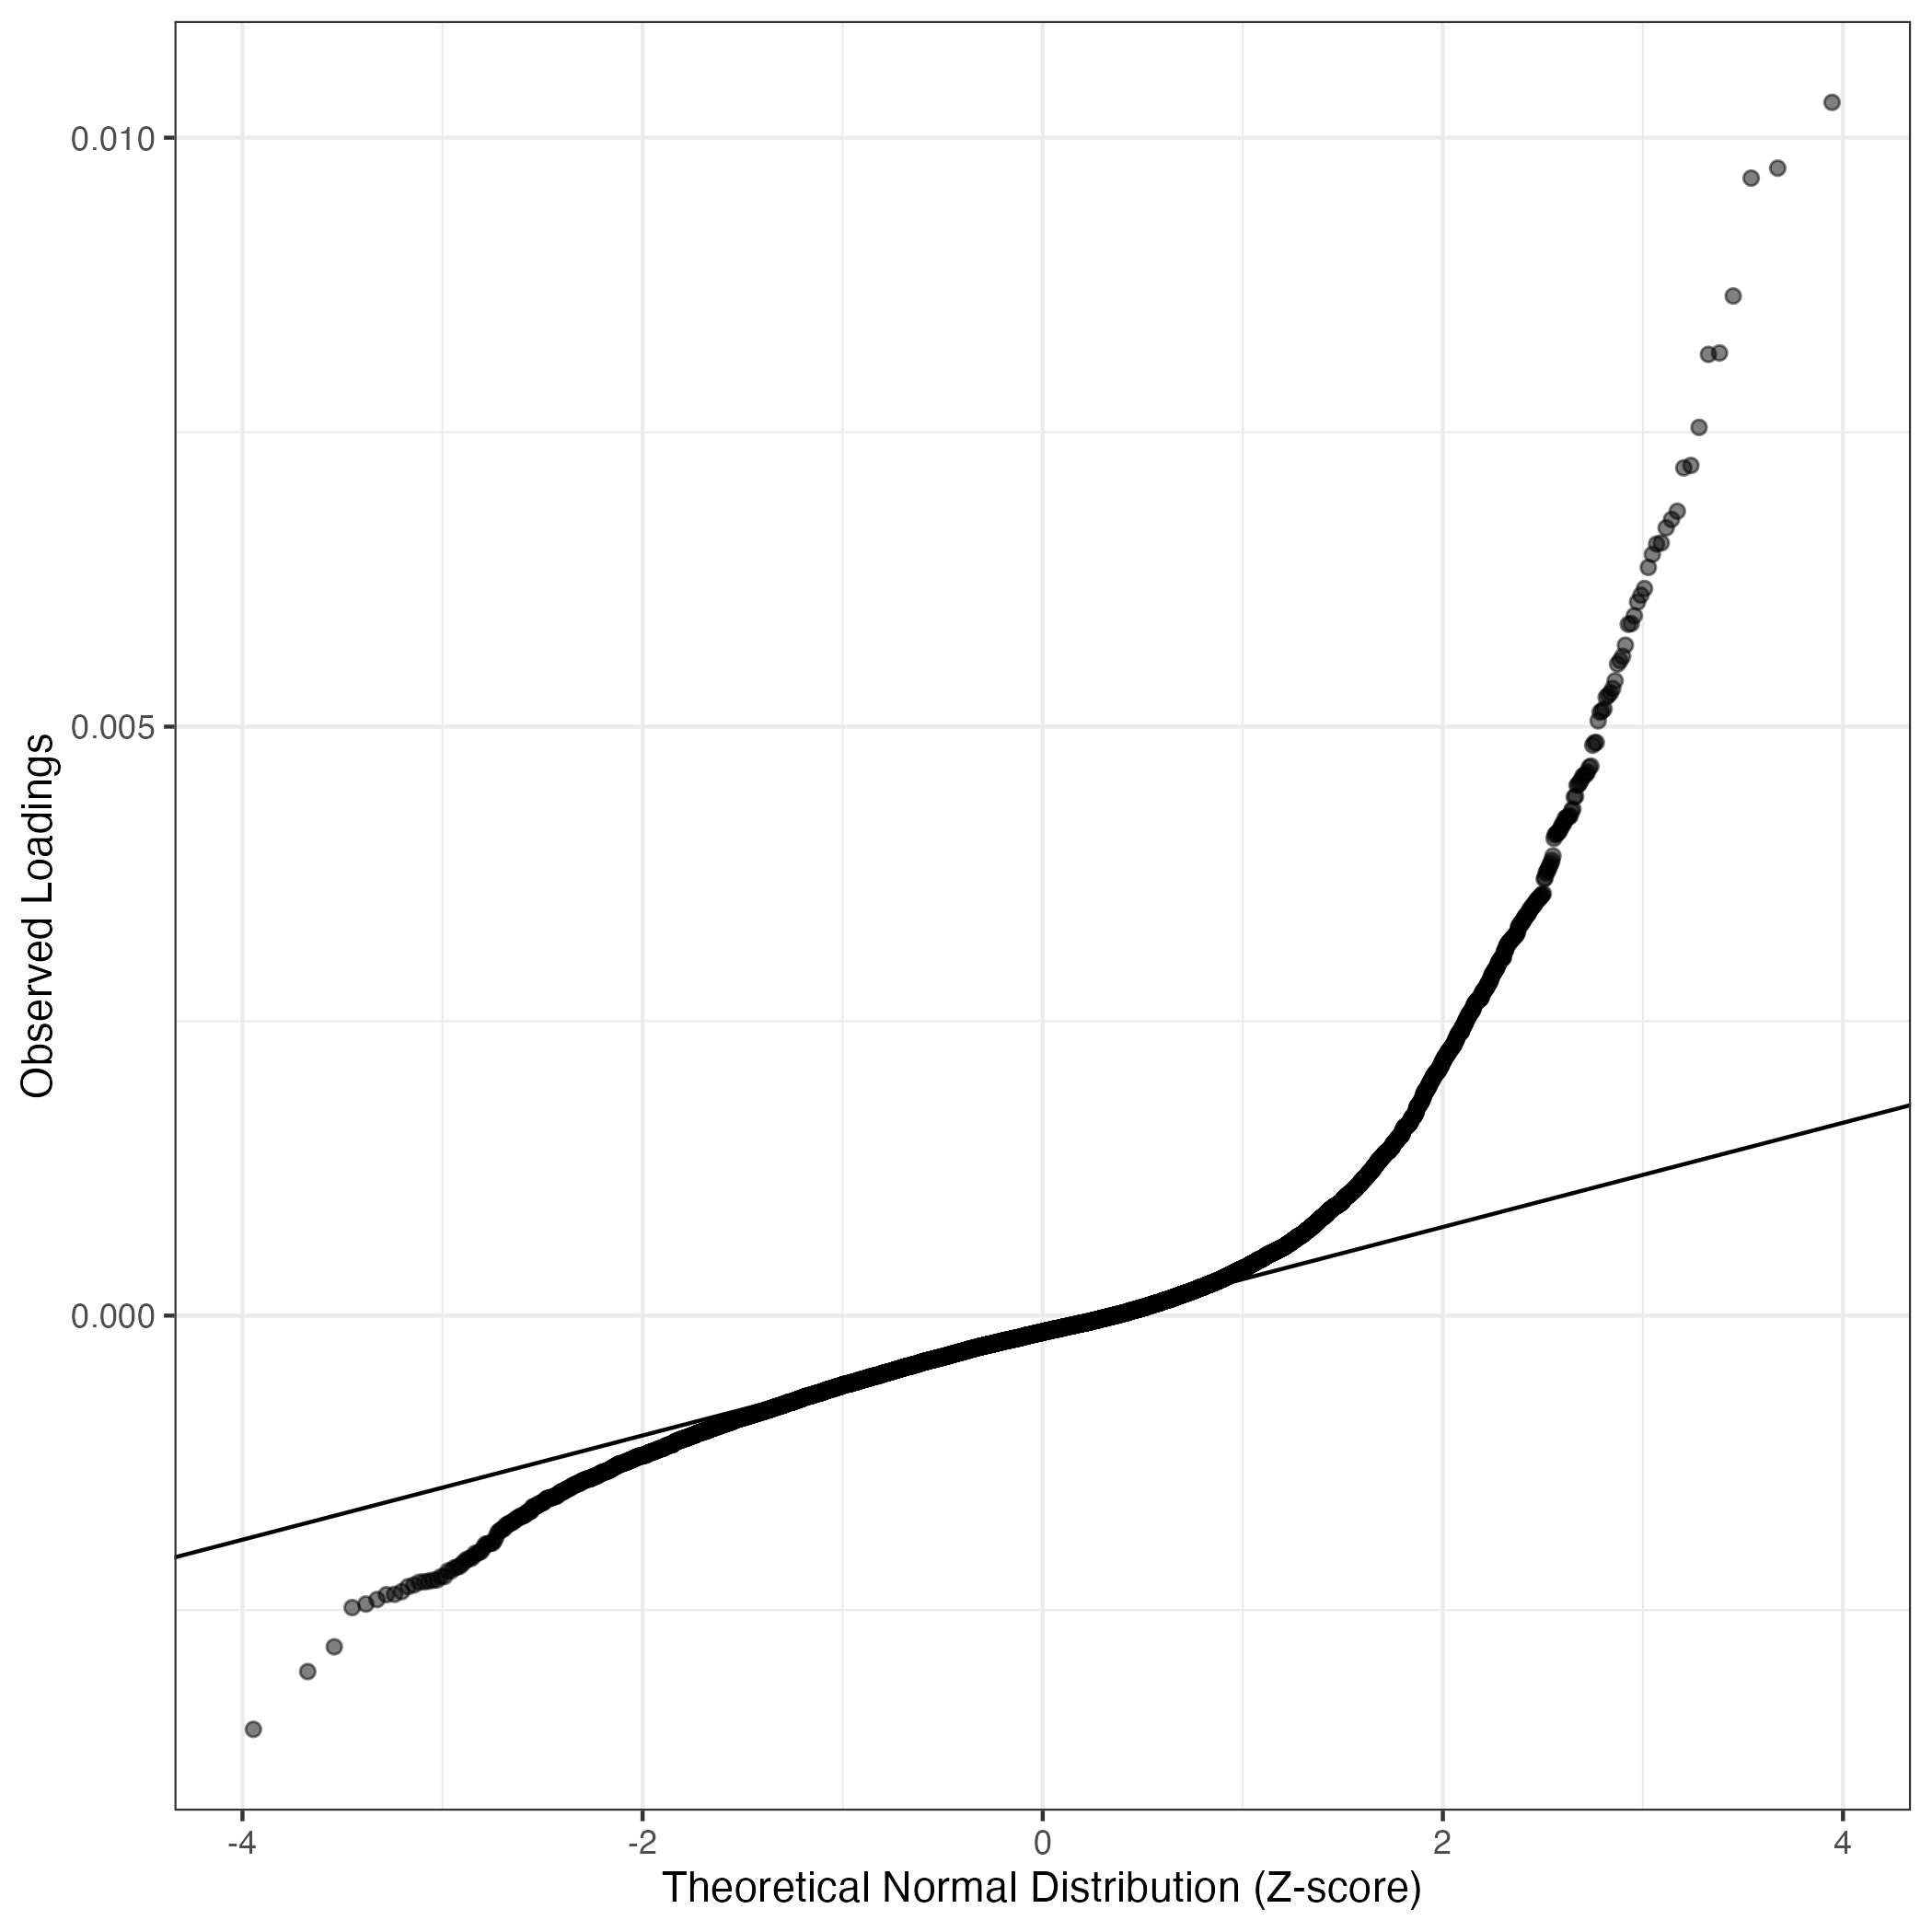
QQ-plot of gene loadings, averaged over both independent splits of the data
This plot highlights the relative contribution of each gene to the GEP
Top genes driving this program. Note: Decartes website is buggy, try refreshing. Also, Decartes fetal adrenal data have been collected at specific time points (89-122 days), all possible cell types of interest may not be represented, do not overinterpret. The Mean Count column shows the mean read count in cells scoring highly (H > 50) on this gene expression program (currently only calculated for the cells in the first 50/50 split of the data).
Note: Decartes website is buggy, try refreshing. Also, Decartes fetal adrenal data have been collected at specific time points (89-122 days), all possible cell types of interest may not be represented, do not overinterpret.
The Mean Count column shows the mean read count in cells scoring highly (H > 50) on this gene expression program.
| Gene | Loading | Gene.Name | GTEx | DepMap | Descartes | Mean.Counts | Mean.Tpm | |
|---|---|---|---|---|---|---|---|---|
| 1 | EGR1 | 0.0102998 | early growth response 1 | GTEx | DepMap | Descartes | 29.86 | 2764.73 |
| 2 | FOS | 0.0097413 | Fos proto-oncogene, AP-1 transcription factor subunit | GTEx | DepMap | Descartes | 30.49 | 4432.09 |
| 3 | ZFP36 | 0.0096566 | ZFP36 ring finger protein | GTEx | DepMap | Descartes | 18.68 | 2923.40 |
| 4 | FOSB | 0.0086561 | FosB proto-oncogene, AP-1 transcription factor subunit | GTEx | DepMap | Descartes | 50.81 | 3547.40 |
| 5 | NR2F2 | 0.0081723 | nuclear receptor subfamily 2 group F member 2 | GTEx | DepMap | Descartes | 11.33 | 602.71 |
| 6 | JUNB | 0.0081603 | JunB proto-oncogene, AP-1 transcription factor subunit | GTEx | DepMap | Descartes | 21.62 | 3073.54 |
| 7 | NR4A1 | 0.0075405 | nuclear receptor subfamily 4 group A member 1 | GTEx | DepMap | Descartes | 14.03 | 786.97 |
| 8 | ATF3 | 0.0072174 | activating transcription factor 3 | GTEx | DepMap | Descartes | 10.07 | 1274.29 |
| 9 | CXCL12 | 0.0071967 | C-X-C motif chemokine ligand 12 | GTEx | DepMap | Descartes | 7.22 | 512.89 |
| 10 | DCN | 0.0068289 | decorin | GTEx | DepMap | Descartes | 63.72 | 2280.75 |
| 11 | CXCL14 | 0.0067588 | C-X-C motif chemokine ligand 14 | GTEx | DepMap | Descartes | 6.35 | 768.41 |
| 12 | IGFBP7 | 0.0066877 | insulin like growth factor binding protein 7 | GTEx | DepMap | Descartes | 80.07 | 13467.57 |
| 13 | RGS16 | 0.0065591 | regulator of G protein signaling 16 | GTEx | DepMap | Descartes | 4.50 | 516.99 |
| 14 | JUN | 0.0065504 | Jun proto-oncogene, AP-1 transcription factor subunit | GTEx | DepMap | Descartes | 14.28 | 1218.91 |
| 15 | C3 | 0.0064624 | complement C3 | GTEx | DepMap | Descartes | 11.62 | 538.36 |
| 16 | KLF4 | 0.0063517 | Kruppel like factor 4 | GTEx | DepMap | Descartes | 6.55 | 587.08 |
| 17 | SOCS3 | 0.0061727 | suppressor of cytokine signaling 3 | GTEx | DepMap | Descartes | 9.59 | 1020.49 |
| 18 | SRPX | 0.0061159 | sushi repeat containing protein X-linked | GTEx | DepMap | Descartes | 6.30 | 827.74 |
| 19 | IER2 | 0.0060579 | immediate early response 2 | GTEx | DepMap | Descartes | 6.09 | 560.75 |
| 20 | KLF10 | 0.0059414 | Kruppel like factor 10 | GTEx | DepMap | Descartes | 3.30 | 245.51 |
| 21 | ID3 | 0.0058742 | inhibitor of DNA binding 3, HLH protein | GTEx | DepMap | Descartes | 4.97 | 1434.62 |
| 22 | IER5L | 0.0058690 | immediate early response 5 like | GTEx | DepMap | Descartes | 2.33 | 259.78 |
| 23 | SERPING1 | 0.0056916 | serpin family G member 1 | GTEx | DepMap | Descartes | 9.59 | 1039.91 |
| 24 | HES1 | 0.0055971 | hes family bHLH transcription factor 1 | GTEx | DepMap | Descartes | 5.71 | 899.34 |
| 25 | FSTL1 | 0.0055601 | follistatin like 1 | GTEx | DepMap | Descartes | 10.30 | 404.32 |
| 26 | EFEMP1 | 0.0055310 | EGF containing fibulin extracellular matrix protein 1 | GTEx | DepMap | Descartes | 3.90 | 284.32 |
| 27 | SERPINF1 | 0.0053895 | serpin family F member 1 | GTEx | DepMap | Descartes | 22.14 | 3478.14 |
| 28 | GADD45B | 0.0053239 | growth arrest and DNA damage inducible beta | GTEx | DepMap | Descartes | 6.00 | 757.62 |
| 29 | PTCH1 | 0.0052869 | patched 1 | GTEx | DepMap | Descartes | 1.41 | 40.12 |
| 30 | CFH | 0.0052661 | complement factor H | GTEx | DepMap | Descartes | 9.17 | 346.84 |
| 31 | SFRP4 | 0.0052485 | secreted frizzled related protein 4 | GTEx | DepMap | Descartes | 10.07 | 922.90 |
| 32 | AMOTL2 | 0.0051505 | angiomotin like 2 | GTEx | DepMap | Descartes | 3.11 | 186.38 |
| 33 | DUSP1 | 0.0051321 | dual specificity phosphatase 1 | GTEx | DepMap | Descartes | 8.82 | 1247.00 |
| 34 | LUM | 0.0051221 | lumican | GTEx | DepMap | Descartes | 43.64 | 3921.44 |
| 35 | IGFBP4 | 0.0050492 | insulin like growth factor binding protein 4 | GTEx | DepMap | Descartes | 14.07 | 1380.69 |
| 36 | NFIA | 0.0048658 | nuclear factor I A | GTEx | DepMap | Descartes | 4.64 | 25.17 |
| 37 | OSR2 | 0.0048632 | odd-skipped related transciption factor 2 | GTEx | DepMap | Descartes | 0.95 | 149.56 |
| 38 | FGF7 | 0.0048421 | fibroblast growth factor 7 | GTEx | DepMap | Descartes | 2.00 | 98.73 |
| 39 | CYBRD1 | 0.0046649 | cytochrome b reductase 1 | GTEx | DepMap | Descartes | 3.91 | 228.90 |
| 40 | MEOX2 | 0.0046548 | mesenchyme homeobox 2 | GTEx | DepMap | Descartes | 0.43 | 52.00 |
| 41 | FLRT2 | 0.0046155 | fibronectin leucine rich transmembrane protein 2 | GTEx | DepMap | Descartes | 1.85 | 15.21 |
| 42 | RARRES1 | 0.0045968 | retinoic acid receptor responder 1 | GTEx | DepMap | Descartes | 0.77 | 89.04 |
| 43 | BRD2 | 0.0045870 | bromodomain containing 2 | GTEx | DepMap | Descartes | 6.70 | 380.99 |
| 44 | ADM | 0.0045811 | adrenomedullin | GTEx | DepMap | Descartes | 5.13 | 688.16 |
| 45 | NFIB | 0.0045514 | nuclear factor I B | GTEx | DepMap | Descartes | 4.49 | 128.58 |
| 46 | PKDCC | 0.0045277 | protein kinase domain containing, cytoplasmic | GTEx | DepMap | Descartes | 2.06 | 220.32 |
| 47 | SSPN | 0.0045058 | sarcospan | GTEx | DepMap | Descartes | 3.44 | 199.92 |
| 48 | EGR3 | 0.0045033 | early growth response 3 | GTEx | DepMap | Descartes | 5.78 | 367.41 |
| 49 | LAMA2 | 0.0044083 | laminin subunit alpha 2 | GTEx | DepMap | Descartes | 5.19 | NA |
| 50 | ZFP36L1 | 0.0044020 | ZFP36 ring finger protein like 1 | GTEx | DepMap | Descartes | 24.52 | 1984.40 |
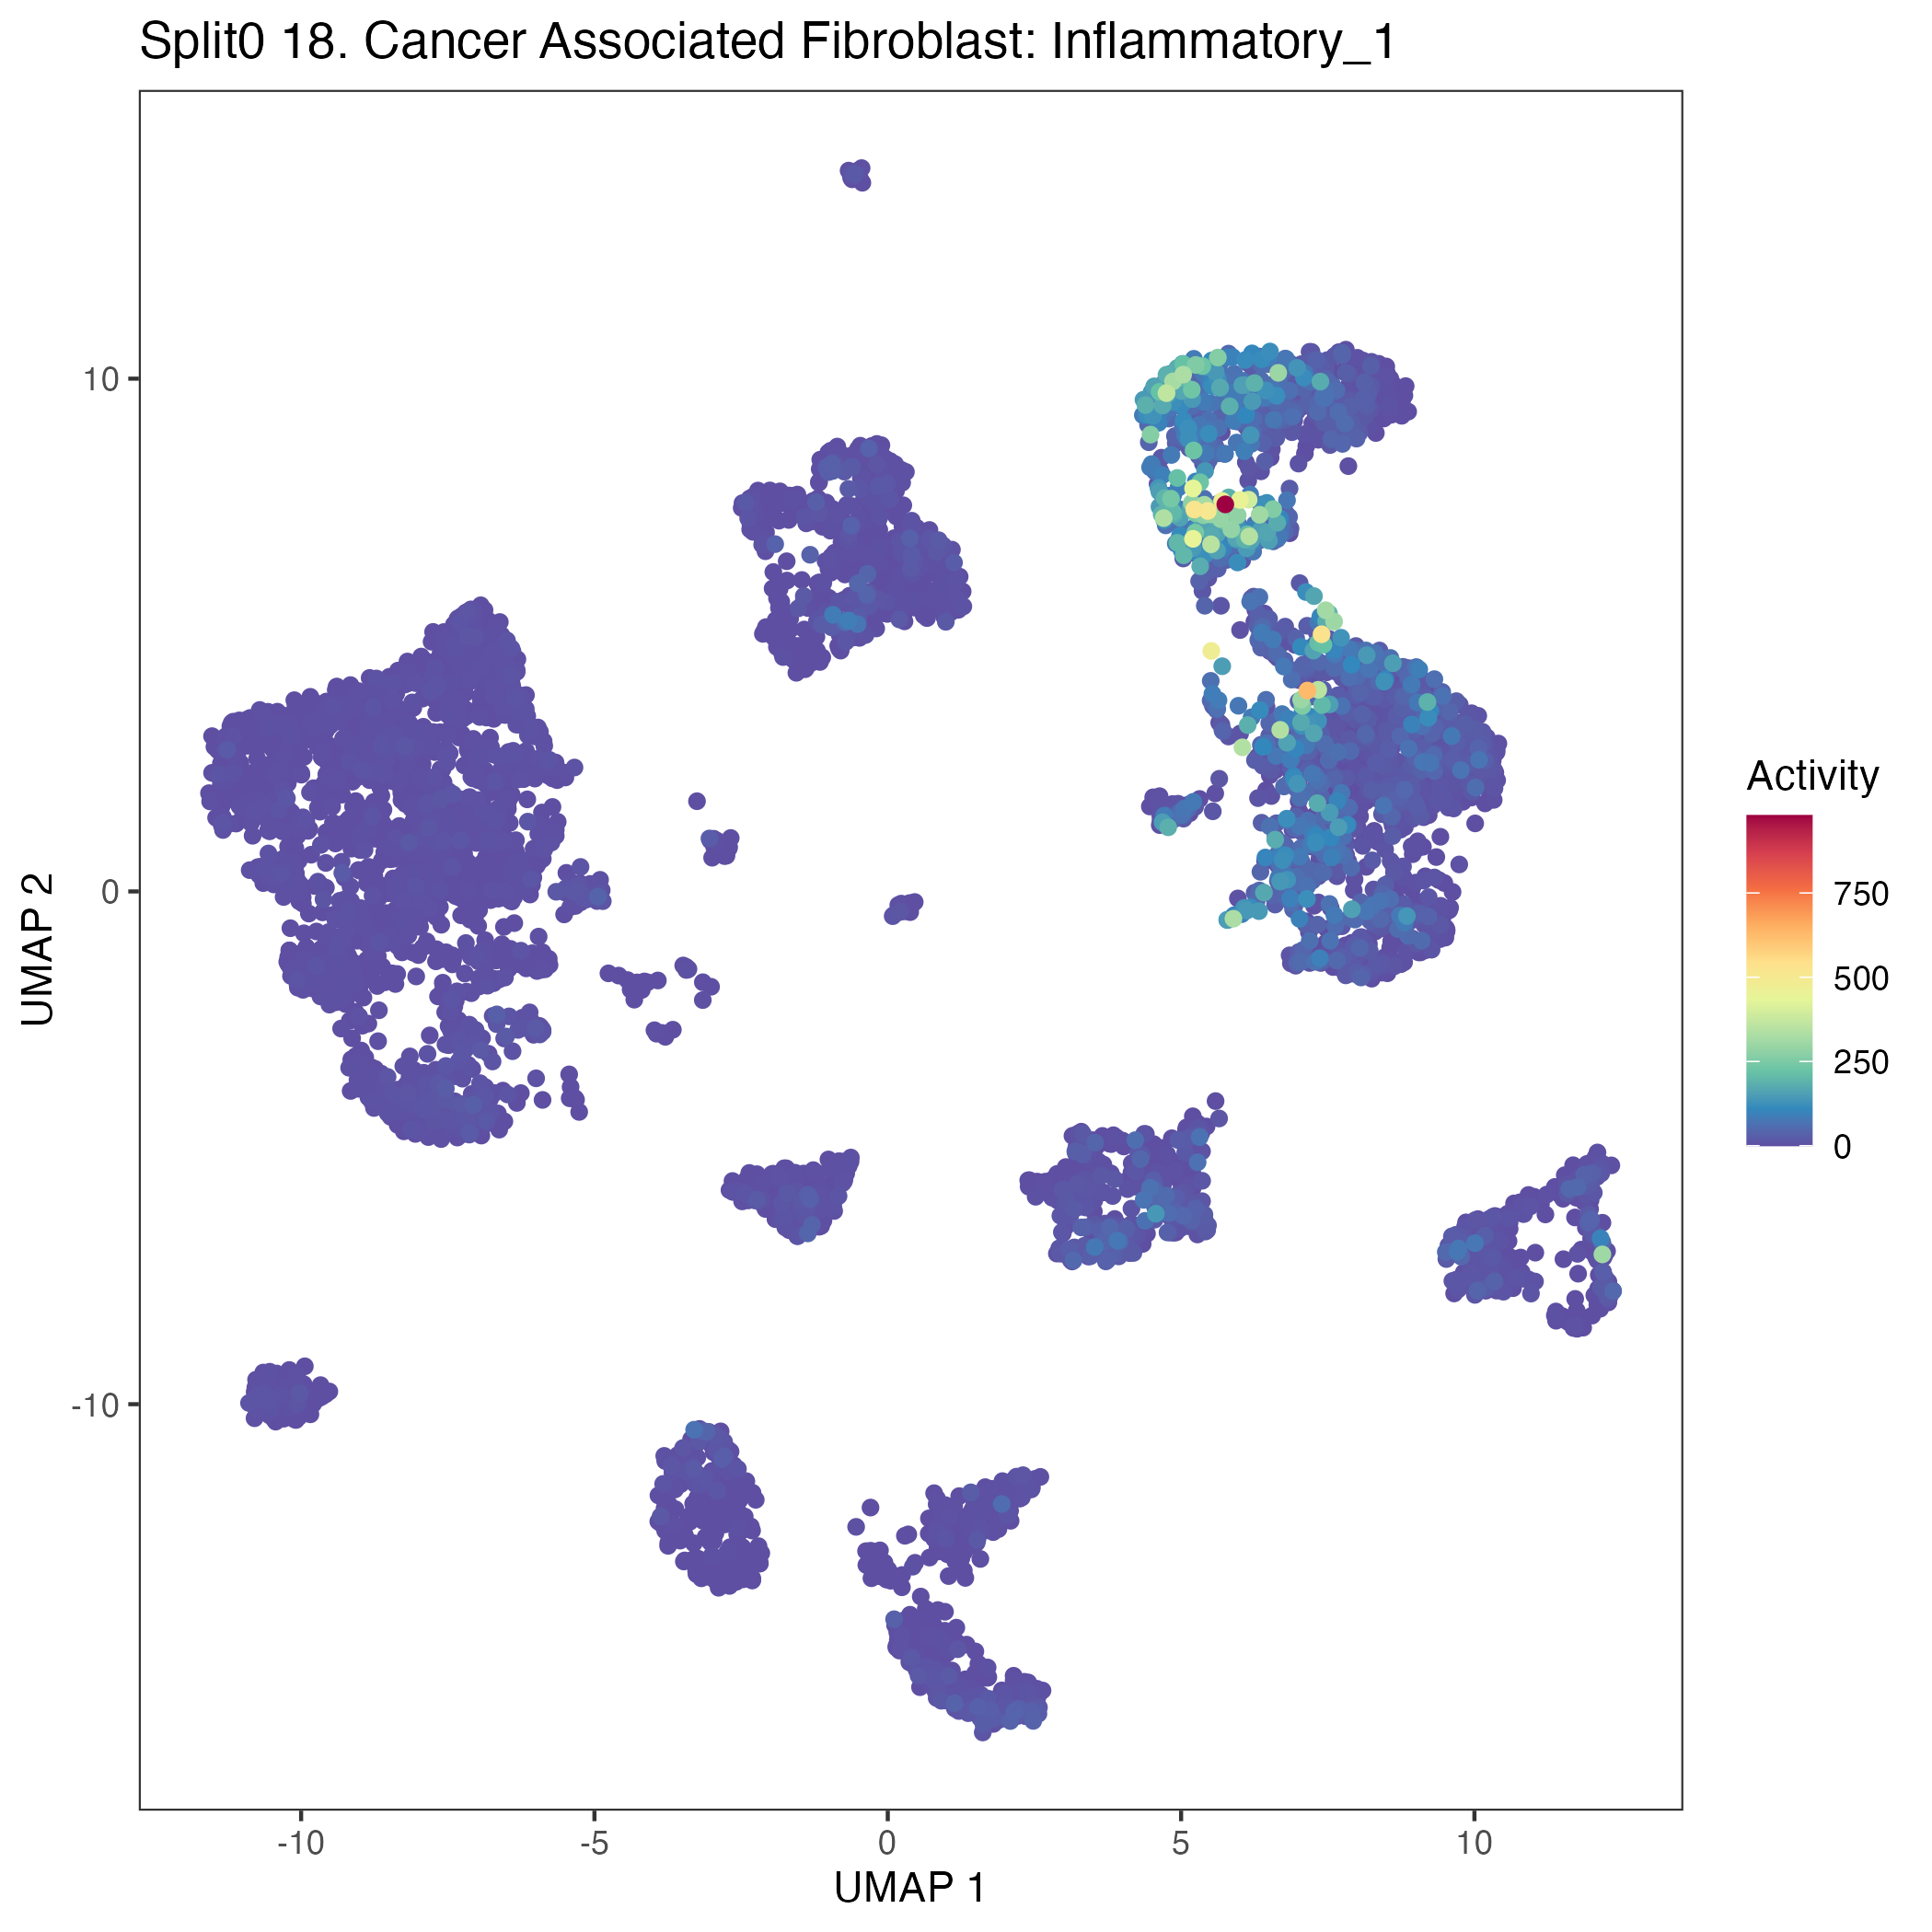
UMAP plots showing activity of gene expression program identified in community:18. Cancer Associated Fibroblast: Inflammatory
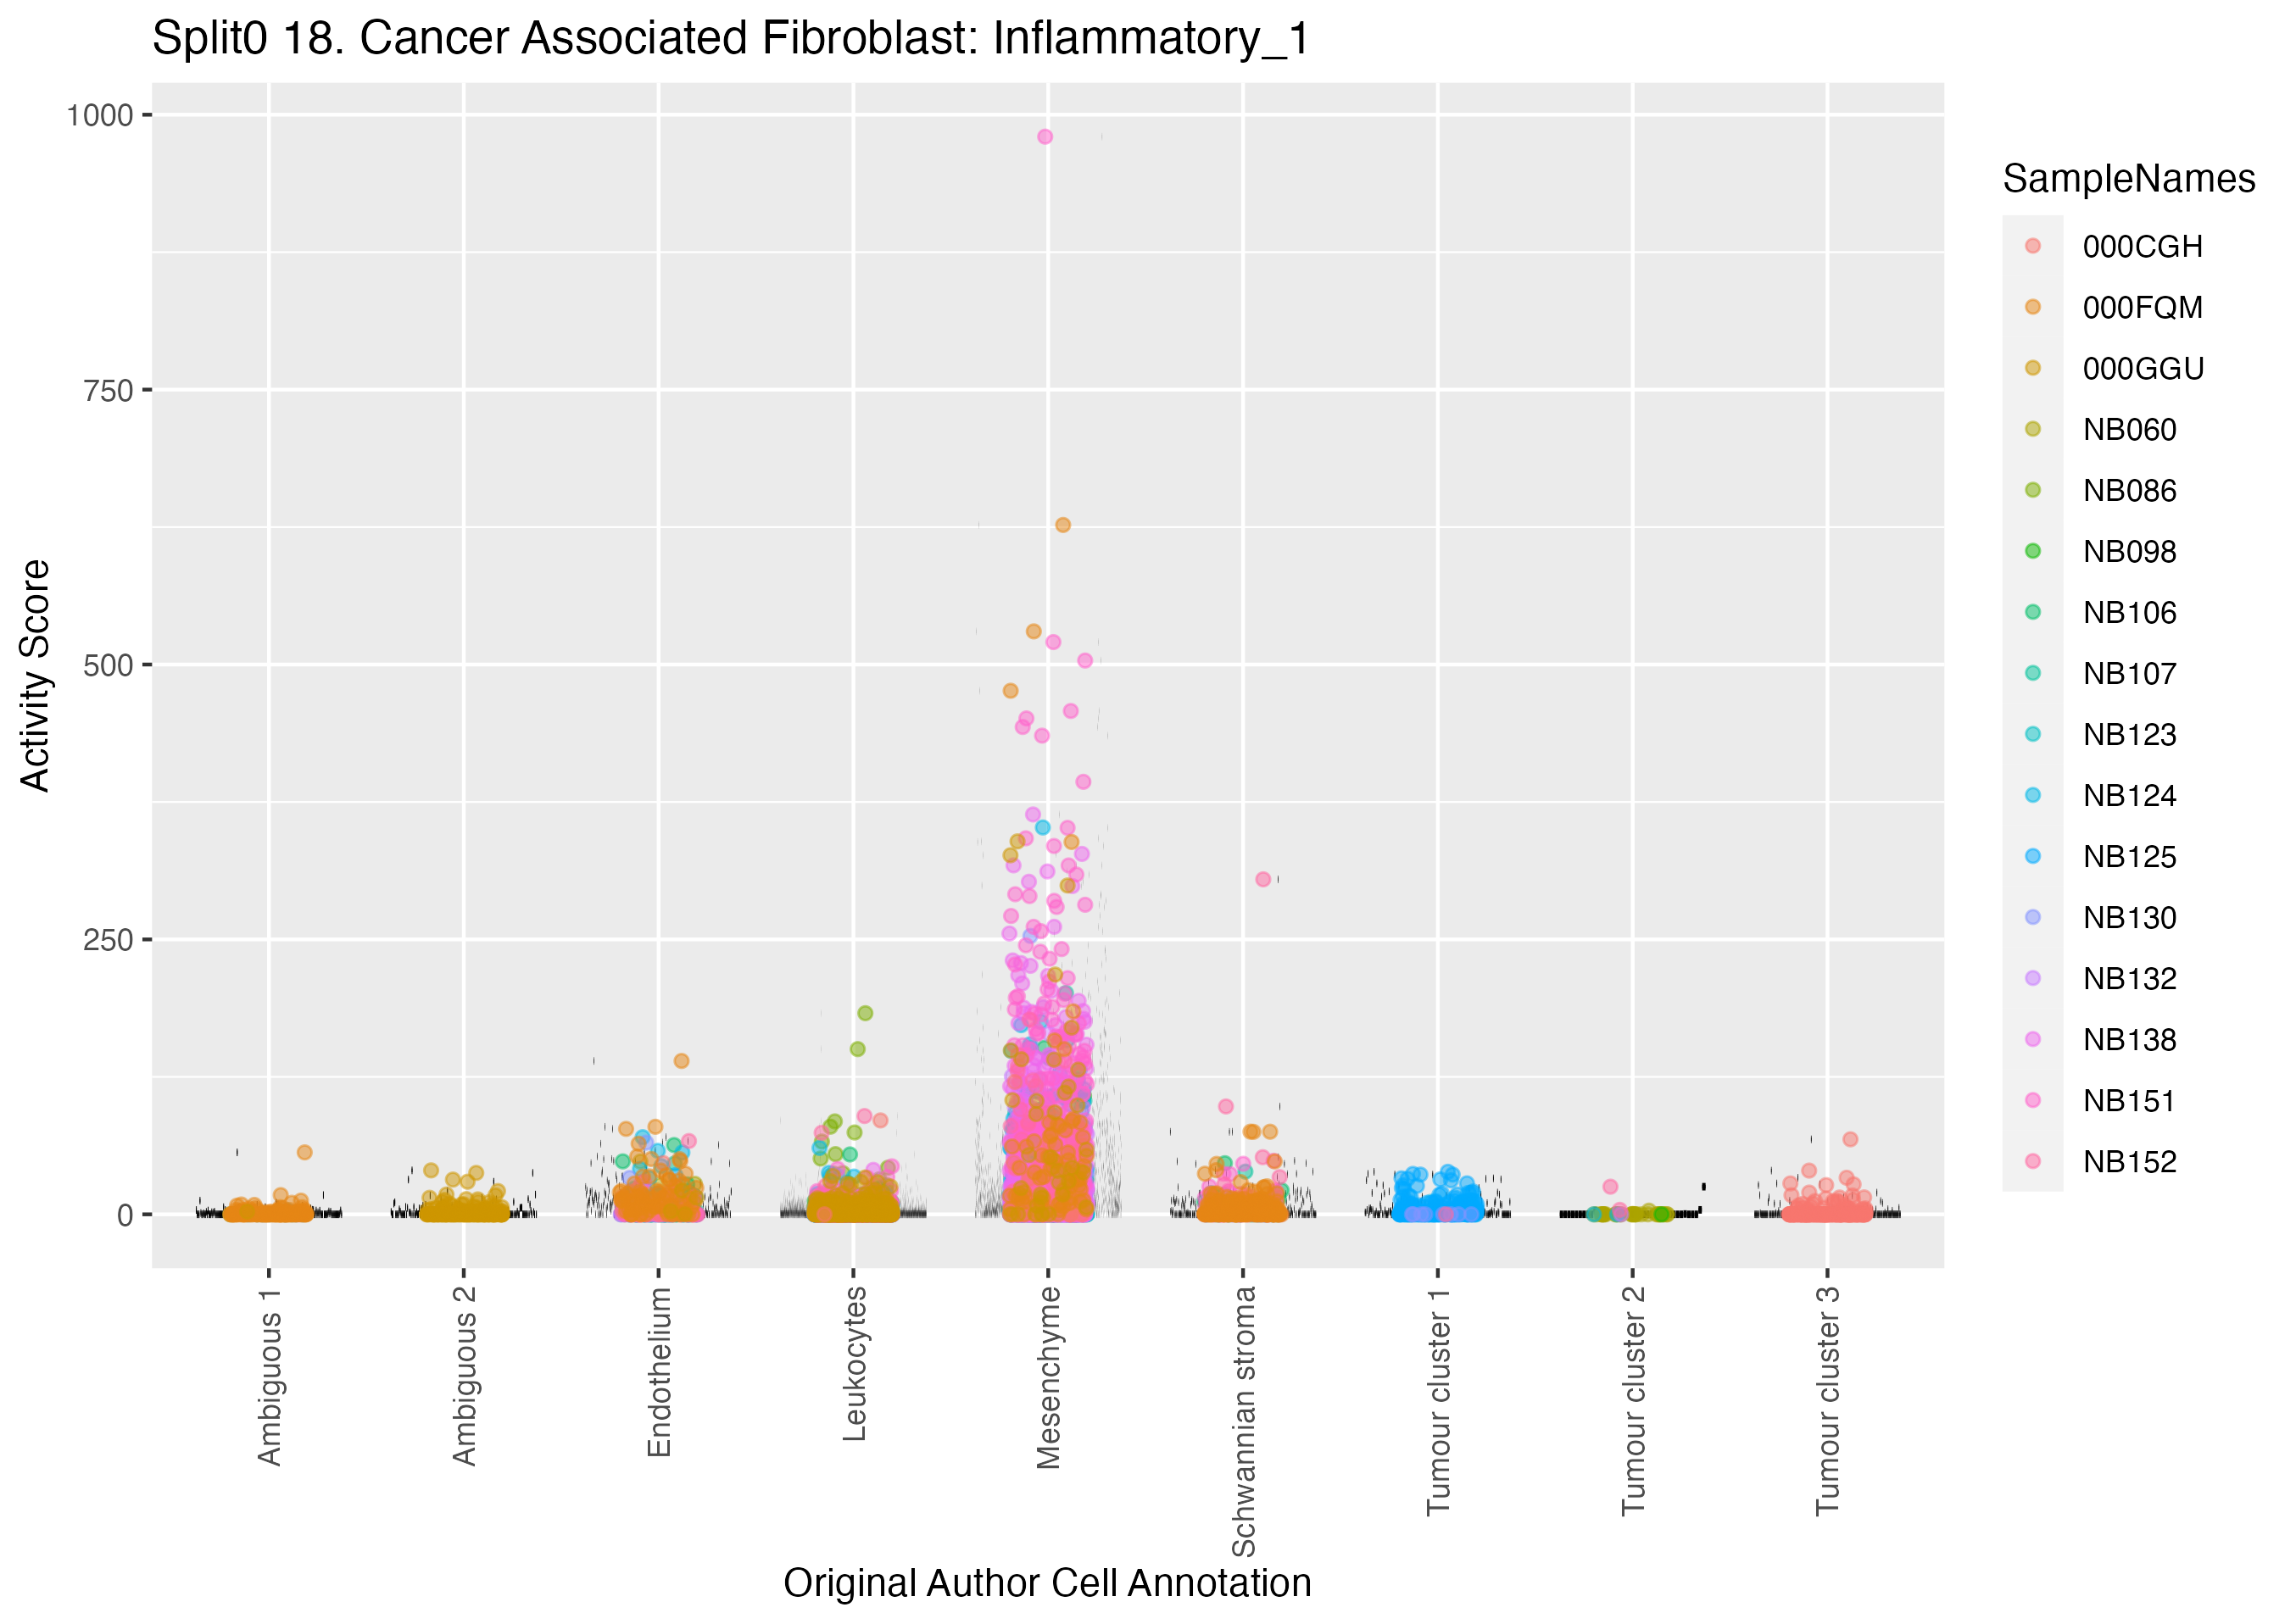
Boxlot showing activity of gene expression program identified in GEP 18. Cancer Associated Fibroblast: Inflammatory:
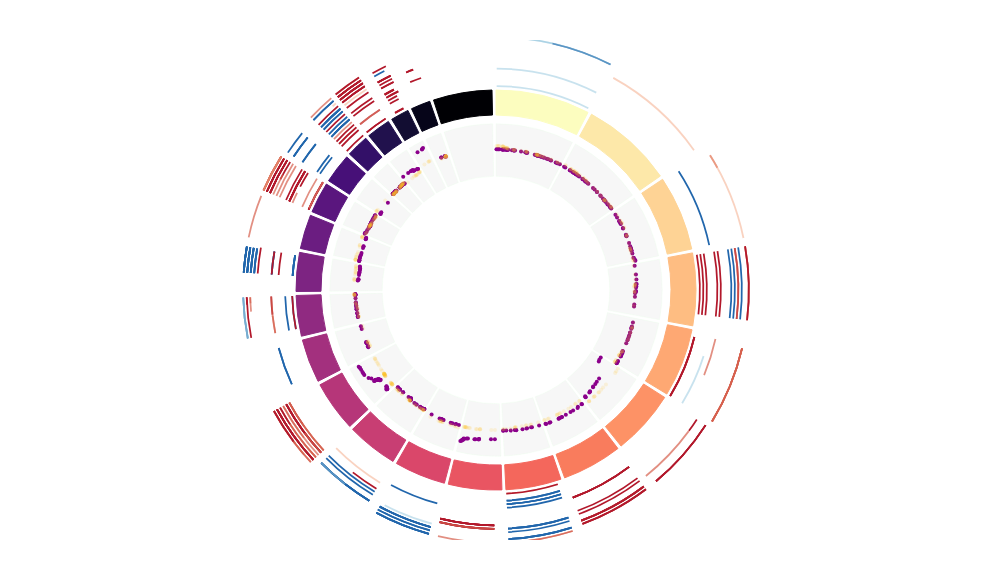
CNV Data procured from inferCNV.
Outer tracks are putative CNV regions (gains = red, losses = blue) for each patient
Inner track is expression data representing:
The top cells expressing this GEP (purple)
Random cells (n =50) from the reference set used in inferCNV (orange)
Gene set Enrichments for this program, caculated from top 50 genes
mSigDB Cell Types Gene Set:
| P-value | OR | Lower 95% CI | FDR | FWER | Genes Found | Gene Set Size | |
|---|---|---|---|---|---|---|---|
| FAN_OVARY_CL6_PUTATIVE_EARLY_ATRETIC_FOLLICLE_THECAL_CELL_2 | 1.42e-40 | 83.04 | 44.49 | 9.54e-38 | 9.54e-38 | 32EGR1, FOS, ZFP36, FOSB, NR2F2, JUNB, NR4A1, ATF3, CXCL12, DCN, JUN, KLF4, SOCS3, IER2, KLF10, ID3, SERPING1, HES1, FSTL1, SERPINF1, GADD45B, CFH, SFRP4, DUSP1, LUM, IGFBP4, NFIA, OSR2, CYBRD1, ADM, SSPN, ZFP36L1 |
300 |
| AIZARANI_LIVER_C21_STELLATE_CELLS_1 | 3.15e-29 | 62.18 | 33.38 | 7.05e-27 | 2.12e-26 | 23EGR1, FOS, ZFP36, FOSB, NR2F2, JUNB, CXCL12, DCN, IGFBP7, RGS16, KLF4, SOCS3, SRPX, FSTL1, EFEMP1, SERPINF1, CFH, LUM, IGFBP4, NFIA, CYBRD1, SSPN, ZFP36L1 |
194 |
| TRAVAGLINI_LUNG_ADVENTITIAL_FIBROBLAST_CELL | 2.21e-33 | 59.37 | 32.28 | 7.42e-31 | 1.48e-30 | 28EGR1, FOS, ZFP36, FOSB, JUNB, NR4A1, CXCL12, DCN, CXCL14, JUN, C3, KLF4, SOCS3, SRPX, IER2, FSTL1, EFEMP1, SERPINF1, CFH, SFRP4, DUSP1, LUM, IGFBP4, OSR2, FGF7, CYBRD1, RARRES1, ADM |
296 |
| FAN_OVARY_CL2_PUTATIVE_EARLY_ATRETIC_FOLLICLE_THECAL_CELL_1 | 4.47e-17 | 51.64 | 24.27 | 2.73e-15 | 3.00e-14 | 13EGR1, FOS, ZFP36, FOSB, JUNB, DCN, JUN, SERPING1, HES1, SERPINF1, DUSP1, LUM, ZFP36L1 |
98 |
| DURANTE_ADULT_OLFACTORY_NEUROEPITHELIUM_VASCULAR_SMOOTH_MUSCLE_CELLS | 5.49e-14 | 42.98 | 19.15 | 2.83e-12 | 3.68e-11 | 11EGR1, FOS, ZFP36, NR2F2, JUNB, ATF3, IGFBP7, RGS16, JUN, SOCS3, GADD45B |
93 |
| RUBENSTEIN_SKELETAL_MUSCLE_FAP_CELLS | 3.86e-18 | 36.07 | 18.22 | 3.24e-16 | 2.59e-15 | 16CXCL12, DCN, CXCL14, IGFBP7, C3, SERPING1, FSTL1, EFEMP1, SERPINF1, CFH, SFRP4, LUM, NFIA, CYBRD1, SSPN, LAMA2 |
179 |
| BUSSLINGER_GASTRIC_PREZYMOGENIC_CELLS | 7.44e-11 | 45.72 | 17.66 | 2.50e-09 | 5.00e-08 | 8EGR1, FOS, FOSB, NR2F2, JUN, IER2, GADD45B, NFIB |
60 |
| FAN_OVARY_CL14_MATURE_SMOOTH_MUSCLE_CELL | 4.55e-20 | 29.14 | 15.49 | 5.08e-18 | 3.05e-17 | 20EGR1, FOS, ZFP36, FOSB, NR2F2, JUNB, ATF3, IGFBP7, RGS16, JUN, SOCS3, IER2, KLF10, ID3, SERPING1, HES1, GADD45B, DUSP1, BRD2, ZFP36L1 |
306 |
| DURANTE_ADULT_OLFACTORY_NEUROEPITHELIUM_FIBROBLASTS_STROMAL_CELLS | 2.64e-11 | 37.51 | 15.47 | 9.31e-10 | 1.77e-08 | 9NR2F2, DCN, IGFBP7, SERPING1, SERPINF1, LUM, IGFBP4, FGF7, SSPN |
82 |
| FAN_OVARY_CL16_LYMPHATIC_ENDOTHELIAL_CELL | 8.11e-18 | 29.95 | 15.39 | 6.04e-16 | 5.44e-15 | 17FOS, FOSB, NR2F2, JUNB, IGFBP7, JUN, KLF4, IER2, KLF10, SERPING1, EFEMP1, GADD45B, DUSP1, IGFBP4, NFIA, ADM, NFIB |
232 |
| HAY_BONE_MARROW_STROMAL | 2.07e-26 | 27.83 | 15.15 | 3.48e-24 | 1.39e-23 | 31EGR1, ZFP36, FOSB, NR2F2, ATF3, CXCL12, DCN, CXCL14, IGFBP7, RGS16, JUN, SOCS3, SRPX, ID3, SERPING1, HES1, FSTL1, EFEMP1, GADD45B, CFH, AMOTL2, LUM, IGFBP4, OSR2, FGF7, CYBRD1, FLRT2, RARRES1, ADM, NFIB, SSPN |
765 |
| CUI_DEVELOPING_HEART_C3_FIBROBLAST_LIKE_CELL | 7.15e-13 | 33.23 | 14.93 | 3.43e-11 | 4.80e-10 | 11CXCL12, DCN, IGFBP7, SRPX, SERPING1, FSTL1, SERPINF1, LUM, NFIA, CYBRD1, FLRT2 |
117 |
| HU_FETAL_RETINA_FIBROBLAST | 6.04e-21 | 27.07 | 14.60 | 8.10e-19 | 4.05e-18 | 22EGR1, FOS, ZFP36, FOSB, NR2F2, JUNB, CXCL12, DCN, IGFBP7, JUN, KLF4, SOCS3, IER2, ID3, HES1, FSTL1, GADD45B, PTCH1, LUM, IGFBP4, NFIA, ZFP36L1 |
385 |
| FAN_OVARY_CL7_ANGEIOGENIC_ENDOTHELIAL_CELL | 3.01e-17 | 27.50 | 14.16 | 2.02e-15 | 2.02e-14 | 17EGR1, FOS, ZFP36, FOSB, JUNB, IGFBP7, JUN, KLF4, SOCS3, IER2, ID3, HES1, GADD45B, DUSP1, IGFBP4, NFIB, ZFP36L1 |
251 |
| ZHENG_CORD_BLOOD_C5_SIMILAR_TO_HSC_C6_PUTATIVE_ALTERED_METABOLIC_STATE | 1.22e-10 | 31.15 | 12.91 | 3.89e-09 | 8.17e-08 | 9FOS, ZFP36, JUNB, NR4A1, ATF3, JUN, IER2, GADD45B, DUSP1 |
97 |
| CUI_DEVELOPING_HEART_C5_VALVAR_CELL | 3.39e-14 | 25.03 | 12.27 | 1.89e-12 | 2.27e-11 | 14EGR1, FOS, JUNB, NR4A1, ATF3, SOCS3, SRPX, IER2, ID3, HES1, SERPINF1, GADD45B, SFRP4, EGR3 |
208 |
| ZHONG_PFC_HES1_POS_C1_NPC | 2.31e-04 | 129.66 | 11.45 | 2.35e-03 | 1.55e-01 | 2HES1, ZFP36L1 |
6 |
| BUSSLINGER_ESOPHAGEAL_QUIESCENT_BASAL_CELLS | 1.92e-08 | 29.04 | 10.65 | 4.30e-07 | 1.29e-05 | 7FOS, FOSB, JUNB, DCN, CXCL14, SOCS3, NFIB |
77 |
| GAO_LARGE_INTESTINE_24W_C1_DCLK1POS_PROGENITOR | 4.33e-09 | 26.12 | 10.30 | 1.04e-07 | 2.91e-06 | 8DCN, C3, SRPX, SERPING1, SERPINF1, LUM, CYBRD1, LAMA2 |
99 |
| CUI_DEVELOPING_HEART_VASCULAR_ENDOTHELIAL_CELL | 7.60e-12 | 21.80 | 10.20 | 3.19e-10 | 5.10e-09 | 12ZFP36, FOSB, JUNB, IGFBP7, JUN, KLF4, IER2, IER5L, EFEMP1, GADD45B, CFH, SFRP4 |
193 |
Dowload full table
mSigDB Hallmark Gene Sets:
| P-value | OR | Lower 95% CI | FDR | FWER | Genes Found | Gene Set Size | |
|---|---|---|---|---|---|---|---|
| HALLMARK_TNFA_SIGNALING_VIA_NFKB | 2.27e-17 | 31.95 | 16.17 | 1.13e-15 | 1.13e-15 | 16EGR1, FOS, ZFP36, FOSB, JUNB, NR4A1, ATF3, JUN, KLF4, SOCS3, IER2, KLF10, HES1, GADD45B, DUSP1, EGR3 |
200 |
| HALLMARK_EPITHELIAL_MESENCHYMAL_TRANSITION | 6.91e-08 | 14.37 | 6.05 | 1.73e-06 | 3.45e-06 | 9CXCL12, DCN, JUN, FSTL1, GADD45B, SFRP4, LUM, IGFBP4, LAMA2 |
200 |
| HALLMARK_HYPOXIA | 9.73e-07 | 12.40 | 4.96 | 1.62e-05 | 4.87e-05 | 8FOS, ZFP36, ATF3, DCN, JUN, SRPX, DUSP1, ADM |
200 |
| HALLMARK_ESTROGEN_RESPONSE_EARLY | 1.19e-05 | 10.54 | 3.95 | 1.19e-04 | 5.94e-04 | 7FOS, CXCL12, KLF4, KLF10, HES1, IGFBP4, EGR3 |
200 |
| HALLMARK_ESTROGEN_RESPONSE_LATE | 1.19e-05 | 10.54 | 3.95 | 1.19e-04 | 5.94e-04 | 7FOS, ZFP36, CXCL12, CXCL14, KLF4, IGFBP4, EGR3 |
200 |
| HALLMARK_APOPTOSIS | 3.77e-05 | 10.99 | 3.77 | 3.14e-04 | 1.89e-03 | 6ATF3, DCN, JUN, GADD45B, LUM, EGR3 |
161 |
| HALLMARK_P53_PATHWAY | 1.24e-04 | 8.78 | 3.02 | 8.83e-04 | 6.18e-03 | 6FOS, ATF3, RGS16, JUN, KLF4, ZFP36L1 |
200 |
| HALLMARK_TGF_BETA_SIGNALING | 1.26e-03 | 15.63 | 3.02 | 7.02e-03 | 6.32e-02 | 3JUNB, KLF10, ID3 |
54 |
| HALLMARK_UV_RESPONSE_UP | 3.76e-04 | 9.08 | 2.77 | 2.35e-03 | 1.88e-02 | 5FOS, FOSB, JUNB, NR4A1, ATF3 |
158 |
| HALLMARK_ANGIOGENESIS | 8.94e-03 | 15.30 | 1.73 | 3.73e-02 | 4.47e-01 | 2FSTL1, LUM |
36 |
| HALLMARK_MYOGENESIS | 7.71e-03 | 5.55 | 1.44 | 3.50e-02 | 3.85e-01 | 4IGFBP7, GADD45B, SSPN, LAMA2 |
200 |
| HALLMARK_INTERFERON_GAMMA_RESPONSE | 7.71e-03 | 5.55 | 1.44 | 3.50e-02 | 3.85e-01 | 4SOCS3, SERPING1, CFH, SSPN |
200 |
| HALLMARK_COAGULATION | 1.70e-02 | 5.91 | 1.16 | 6.54e-02 | 8.50e-01 | 3C3, SERPING1, CFH |
138 |
| HALLMARK_UV_RESPONSE_DN | 1.90e-02 | 5.66 | 1.11 | 6.79e-02 | 9.50e-01 | 3EFEMP1, DUSP1, NFIB |
144 |
| HALLMARK_IL2_STAT5_SIGNALING | 4.30e-02 | 4.07 | 0.80 | 1.28e-01 | 1.00e+00 | 3RGS16, GADD45B, PTCH1 |
199 |
| HALLMARK_COMPLEMENT | 4.35e-02 | 4.05 | 0.80 | 1.28e-01 | 1.00e+00 | 3C3, SERPING1, CFH |
200 |
| HALLMARK_KRAS_SIGNALING_UP | 4.35e-02 | 4.05 | 0.80 | 1.28e-01 | 1.00e+00 | 3RGS16, KLF4, CFH |
200 |
| HALLMARK_IL6_JAK_STAT3_SIGNALING | 4.64e-02 | 6.13 | 0.71 | 1.29e-01 | 1.00e+00 | 2JUN, SOCS3 |
87 |
| HALLMARK_ADIPOGENESIS | 1.85e-01 | 2.63 | 0.31 | 3.70e-01 | 1.00e+00 | 2C3, SSPN |
200 |
| HALLMARK_INFLAMMATORY_RESPONSE | 1.85e-01 | 2.63 | 0.31 | 3.70e-01 | 1.00e+00 | 2RGS16, ADM |
200 |
Dowload full table
KEGG Pathways:
| P-value | OR | Lower 95% CI | FDR | FWER | Genes Found | Gene Set Size | |
|---|---|---|---|---|---|---|---|
| KEGG_COMPLEMENT_AND_COAGULATION_CASCADES | 2.55e-03 | 12.08 | 2.35 | 1.79e-01 | 4.75e-01 | 3C3, SERPING1, CFH |
69 |
| KEGG_MAPK_SIGNALING_PATHWAY | 5.69e-04 | 6.53 | 2.25 | 1.06e-01 | 1.06e-01 | 6FOS, NR4A1, JUN, GADD45B, DUSP1, FGF7 |
267 |
| KEGG_LEISHMANIA_INFECTION | 2.88e-03 | 11.56 | 2.25 | 1.79e-01 | 5.36e-01 | 3FOS, JUN, C3 |
72 |
| KEGG_PATHWAYS_IN_CANCER | 8.32e-03 | 4.34 | 1.34 | 3.87e-01 | 1.00e+00 | 5FOS, JUN, PTCH1, FGF7, LAMA2 |
325 |
| KEGG_COLORECTAL_CANCER | 2.50e-02 | 8.68 | 1.00 | 9.32e-01 | 1.00e+00 | 2FOS, JUN |
62 |
| KEGG_B_CELL_RECEPTOR_SIGNALING_PATHWAY | 3.55e-02 | 7.13 | 0.82 | 1.00e+00 | 1.00e+00 | 2FOS, JUN |
75 |
| KEGG_TGF_BETA_SIGNALING_PATHWAY | 4.54e-02 | 6.20 | 0.72 | 1.00e+00 | 1.00e+00 | 2DCN, ID3 |
86 |
| KEGG_TOLL_LIKE_RECEPTOR_SIGNALING_PATHWAY | 6.14e-02 | 5.21 | 0.60 | 1.00e+00 | 1.00e+00 | 2FOS, JUN |
102 |
| KEGG_T_CELL_RECEPTOR_SIGNALING_PATHWAY | 6.78e-02 | 4.91 | 0.57 | 1.00e+00 | 1.00e+00 | 2FOS, JUN |
108 |
| KEGG_WNT_SIGNALING_PATHWAY | 1.19e-01 | 3.50 | 0.41 | 1.00e+00 | 1.00e+00 | 2JUN, SFRP4 |
151 |
| KEGG_CHEMOKINE_SIGNALING_PATHWAY | 1.70e-01 | 2.79 | 0.33 | 1.00e+00 | 1.00e+00 | 2CXCL12, CXCL14 |
189 |
| KEGG_FOCAL_ADHESION | 1.83e-01 | 2.64 | 0.31 | 1.00e+00 | 1.00e+00 | 2JUN, LAMA2 |
199 |
| KEGG_MATURITY_ONSET_DIABETES_OF_THE_YOUNG | 9.49e-02 | 10.62 | 0.25 | 1.00e+00 | 1.00e+00 | 1HES1 |
25 |
| KEGG_CYTOKINE_CYTOKINE_RECEPTOR_INTERACTION | 2.77e-01 | 1.98 | 0.23 | 1.00e+00 | 1.00e+00 | 2CXCL12, CXCL14 |
265 |
| KEGG_PRION_DISEASES | 1.30e-01 | 7.50 | 0.18 | 1.00e+00 | 1.00e+00 | 1EGR1 |
35 |
| KEGG_NOTCH_SIGNALING_PATHWAY | 1.71e-01 | 5.54 | 0.13 | 1.00e+00 | 1.00e+00 | 1HES1 |
47 |
| KEGG_TYPE_II_DIABETES_MELLITUS | 1.71e-01 | 5.54 | 0.13 | 1.00e+00 | 1.00e+00 | 1SOCS3 |
47 |
| KEGG_INTESTINAL_IMMUNE_NETWORK_FOR_IGA_PRODUCTION | 1.74e-01 | 5.43 | 0.13 | 1.00e+00 | 1.00e+00 | 1CXCL12 |
48 |
| KEGG_BASAL_CELL_CARCINOMA | 1.97e-01 | 4.72 | 0.12 | 1.00e+00 | 1.00e+00 | 1PTCH1 |
55 |
| KEGG_HEDGEHOG_SIGNALING_PATHWAY | 2.00e-01 | 4.64 | 0.11 | 1.00e+00 | 1.00e+00 | 1PTCH1 |
56 |
Dowload full table
CHR Positional Gene Sets:
| P-value | OR | Lower 95% CI | FDR | FWER | Genes Found | Gene Set Size | |
|---|---|---|---|---|---|---|---|
| chr12q21 | 9.06e-02 | 4.13 | 0.48 | 1.00e+00 | 1.00e+00 | 2DCN, LUM |
128 |
| chr8q22 | 1.22e-01 | 3.45 | 0.40 | 1.00e+00 | 1.00e+00 | 2KLF10, OSR2 |
153 |
| chr19p13 | 5.35e-01 | 1.41 | 0.37 | 1.00e+00 | 1.00e+00 | 4JUNB, C3, IER2, GADD45B |
773 |
| chr14q24 | 1.72e-01 | 2.76 | 0.32 | 1.00e+00 | 1.00e+00 | 2FOS, ZFP36L1 |
191 |
| chr5q31 | 3.08e-01 | 1.83 | 0.21 | 1.00e+00 | 1.00e+00 | 2EGR1, CXCL14 |
287 |
| chr14q31 | 2.00e-01 | 4.64 | 0.11 | 1.00e+00 | 1.00e+00 | 1FLRT2 |
56 |
| chr1q31 | 2.46e-01 | 3.64 | 0.09 | 1.00e+00 | 1.00e+00 | 1CFH |
71 |
| chr4q12 | 2.70e-01 | 3.27 | 0.08 | 1.00e+00 | 1.00e+00 | 1IGFBP7 |
79 |
| chr2p21 | 2.73e-01 | 3.23 | 0.08 | 1.00e+00 | 1.00e+00 | 1PKDCC |
80 |
| chr7p21 | 2.81e-01 | 3.11 | 0.08 | 1.00e+00 | 1.00e+00 | 1MEOX2 |
83 |
| chr12p12 | 3.46e-01 | 2.41 | 0.06 | 1.00e+00 | 1.00e+00 | 1SSPN |
107 |
| chr2p16 | 3.64e-01 | 2.26 | 0.06 | 1.00e+00 | 1.00e+00 | 1EFEMP1 |
114 |
| chr3q22 | 3.72e-01 | 2.20 | 0.05 | 1.00e+00 | 1.00e+00 | 1AMOTL2 |
117 |
| chr6q22 | 3.77e-01 | 2.16 | 0.05 | 1.00e+00 | 1.00e+00 | 1LAMA2 |
119 |
| chr19q13 | 4.39e-01 | 0.45 | 0.05 | 1.00e+00 | 1.00e+00 | 2ZFP36, FOSB |
1165 |
| chr3q29 | 3.84e-01 | 2.11 | 0.05 | 1.00e+00 | 1.00e+00 | 1HES1 |
122 |
| chr8p21 | 3.99e-01 | 2.01 | 0.05 | 1.00e+00 | 1.00e+00 | 1EGR3 |
128 |
| chr9q31 | 3.99e-01 | 2.01 | 0.05 | 1.00e+00 | 1.00e+00 | 1KLF4 |
128 |
| chr1p32 | 4.53e-01 | 1.69 | 0.04 | 1.00e+00 | 1.00e+00 | 1JUN |
152 |
| chr3q25 | 4.53e-01 | 1.69 | 0.04 | 1.00e+00 | 1.00e+00 | 1RARRES1 |
152 |
Dowload full table
Transcription Factor Targets:
| P-value | OR | Lower 95% CI | FDR | FWER | Genes Found | Gene Set Size | |
|---|---|---|---|---|---|---|---|
| SRF_01 | 4.50e-08 | 37.85 | 12.54 | 2.55e-05 | 5.10e-05 | 6EGR1, FOS, FOSB, JUNB, IER2, EGR3 |
51 |
| SRF_Q5_01 | 1.31e-08 | 14.54 | 6.40 | 1.48e-05 | 1.48e-05 | 10EGR1, FOS, FOSB, NR2F2, JUNB, ATF3, IER2, PTCH1, FGF7, EGR3 |
225 |
| SRF_C | 1.27e-07 | 13.32 | 5.62 | 4.80e-05 | 1.44e-04 | 9EGR1, FOS, FOSB, NR2F2, JUNB, NR4A1, IER2, PTCH1, EGR3 |
215 |
| SRF_Q4 | 2.24e-07 | 12.41 | 5.24 | 6.33e-05 | 2.53e-04 | 9EGR1, FOS, FOSB, NR2F2, JUNB, NR4A1, IER2, PTCH1, EGR3 |
230 |
| MDM2_TARGET_GENES | 1.18e-03 | 47.19 | 4.96 | 5.56e-02 | 1.00e+00 | 2BRD2, ADM |
13 |
| AHRARNT_02 | 1.58e-03 | 39.95 | 4.27 | 6.16e-02 | 1.00e+00 | 2EGR1, HES1 |
15 |
| MEF2_03 | 3.72e-06 | 10.26 | 4.11 | 5.94e-04 | 4.22e-03 | 8FOS, NR4A1, ATF3, JUN, PTCH1, MEOX2, NFIB, SSPN |
240 |
| CEBPDELTA_Q6 | 4.59e-06 | 9.96 | 4.00 | 5.94e-04 | 5.20e-03 | 8FOS, FOSB, NR4A1, ATF3, JUN, EFEMP1, SERPINF1, PTCH1 |
247 |
| SRF_Q6 | 4.72e-06 | 9.92 | 3.98 | 5.94e-04 | 5.35e-03 | 8EGR1, FOS, FOSB, NR2F2, JUNB, NR4A1, PTCH1, EGR3 |
248 |
| CCAWWNAAGG_SRF_Q4 | 3.96e-04 | 12.93 | 3.31 | 2.55e-02 | 4.49e-01 | 4EGR1, FOSB, NR4A1, PTCH1 |
88 |
| GTF2A2_TARGET_GENES | 3.36e-06 | 6.90 | 3.17 | 5.94e-04 | 3.81e-03 | 11EGR1, FOS, ZFP36, FOSB, JUNB, ATF3, SOCS3, HES1, GADD45B, DUSP1, BRD2 |
522 |
| YTATTTTNR_MEF2_02 | 1.62e-06 | 6.26 | 3.04 | 3.67e-04 | 1.83e-03 | 13FOS, FOSB, JUNB, NR4A1, JUN, IER5L, HES1, GADD45B, NFIA, MEOX2, NFIB, SSPN, LAMA2 |
715 |
| CREB_Q2 | 7.66e-05 | 7.77 | 2.92 | 7.89e-03 | 8.67e-02 | 7EGR1, FOS, FOSB, ATF3, GADD45B, DUSP1, EGR3 |
269 |
| CDPCR3_01 | 1.48e-03 | 14.76 | 2.85 | 6.16e-02 | 1.00e+00 | 3HES1, NFIA, FGF7 |
57 |
| EGR_Q6 | 9.79e-05 | 7.46 | 2.80 | 8.72e-03 | 1.11e-01 | 7EGR1, ZFP36, NR2F2, KLF10, PTCH1, BRD2, ZFP36L1 |
280 |
| ATXN7L3_TARGET_GENES | 1.00e-04 | 7.43 | 2.79 | 8.72e-03 | 1.13e-01 | 7ATF3, KLF4, IER5L, HES1, GADD45B, OSR2, BRD2 |
281 |
| PSMB5_TARGET_GENES | 1.71e-04 | 6.78 | 2.55 | 1.38e-02 | 1.94e-01 | 7ZFP36, JUNB, ATF3, IER5L, DUSP1, BRD2, ADM |
307 |
| FOXJ2_02 | 3.49e-04 | 7.19 | 2.48 | 2.55e-02 | 3.95e-01 | 6ATF3, IGFBP7, EFEMP1, NFIA, FGF7, NFIB |
243 |
| E2F1_Q3_01 | 4.05e-04 | 6.99 | 2.41 | 2.55e-02 | 4.58e-01 | 6NR2F2, JUNB, KLF4, KLF10, ID3, EGR3 |
250 |
| TFIIA_Q6 | 4.58e-04 | 6.82 | 2.35 | 2.68e-02 | 5.19e-01 | 6EGR1, FOSB, NR4A1, IER2, ID3, NFIB |
256 |
Dowload full table
GO Biological Processes:
| P-value | OR | Lower 95% CI | FDR | FWER | Genes Found | Gene Set Size | |
|---|---|---|---|---|---|---|---|
| GOBP_KERATINOCYTE_APOPTOTIC_PROCESS | 1.18e-06 | 261.33 | 34.39 | 3.53e-04 | 8.82e-03 | 3ZFP36, SFRP4, ZFP36L1 |
6 |
| GOBP_PROGESTERONE_BIOSYNTHETIC_PROCESS | 2.31e-04 | 129.66 | 11.45 | 2.37e-02 | 1.00e+00 | 2EGR1, ADM |
6 |
| GOBP_LABYRINTHINE_LAYER_DEVELOPMENT | 7.77e-07 | 35.54 | 10.46 | 2.64e-04 | 5.81e-03 | 5JUNB, SOCS3, HES1, ADM, ZFP36L1 |
44 |
| GOBP_PLACENTA_BLOOD_VESSEL_DEVELOPMENT | 5.61e-06 | 41.71 | 10.17 | 1.31e-03 | 4.20e-02 | 4NR2F2, JUNB, SOCS3, HES1 |
30 |
| GOBP_NUCLEAR_TRANSCRIBED_MRNA_CATABOLIC_PROCESS_DEADENYLATION_INDEPENDENT_DECAY | 3.22e-04 | 103.49 | 9.64 | 3.05e-02 | 1.00e+00 | 2ZFP36, ZFP36L1 |
7 |
| GOBP_POSITIVE_REGULATION_OF_HORMONE_BIOSYNTHETIC_PROCESS | 3.22e-04 | 103.49 | 9.64 | 3.05e-02 | 1.00e+00 | 2EGR1, ADM |
7 |
| GOBP_REGULATION_OF_EPITHELIAL_CELL_PROLIFERATION_INVOLVED_IN_LUNG_MORPHOGENESIS | 3.22e-04 | 103.49 | 9.64 | 3.05e-02 | 1.00e+00 | 2FGF7, NFIB |
7 |
| GOBP_PRI_MIRNA_TRANSCRIPTION_BY_RNA_POLYMERASE_II | 1.81e-06 | 29.51 | 8.75 | 4.83e-04 | 1.35e-02 | 5EGR1, FOS, JUN, KLF4, NFIB |
52 |
| GOBP_LABYRINTHINE_LAYER_MORPHOGENESIS | 6.44e-05 | 46.77 | 8.51 | 8.16e-03 | 4.82e-01 | 3SOCS3, ADM, ZFP36L1 |
20 |
| GOBP_EMBRYONIC_PLACENTA_DEVELOPMENT | 6.31e-07 | 23.32 | 7.88 | 2.25e-04 | 4.72e-03 | 6NR2F2, JUNB, SOCS3, HES1, ADM, ZFP36L1 |
79 |
| GOBP_POSITIVE_REGULATION_OF_PRI_MIRNA_TRANSCRIPTION_BY_RNA_POLYMERASE_II | 1.81e-05 | 30.14 | 7.49 | 2.88e-03 | 1.35e-01 | 4EGR1, FOS, JUN, KLF4 |
40 |
| GOBP_EPITHELIAL_CELL_PROLIFERATION_INVOLVED_IN_LUNG_MORPHOGENESIS | 5.49e-04 | 74.10 | 7.33 | 4.28e-02 | 1.00e+00 | 2FGF7, NFIB |
9 |
| GOBP_EMBRYONIC_PLACENTA_MORPHOGENESIS | 1.13e-04 | 37.87 | 7.01 | 1.32e-02 | 8.45e-01 | 3SOCS3, ADM, ZFP36L1 |
24 |
| GOBP_RESPONSE_TO_CORTICOSTEROID | 1.23e-07 | 16.53 | 6.58 | 6.39e-05 | 9.18e-04 | 8FOS, ZFP36, FOSB, IGFBP7, SERPINF1, DUSP1, ADM, ZFP36L1 |
152 |
| GOBP_NEGATIVE_REGULATION_OF_ERYTHROCYTE_DIFFERENTIATION | 6.85e-04 | 64.86 | 6.55 | 4.82e-02 | 1.00e+00 | 2ZFP36, ZFP36L1 |
10 |
| GOBP_CELL_PROLIFERATION_INVOLVED_IN_METANEPHROS_DEVELOPMENT | 6.85e-04 | 64.86 | 6.55 | 4.82e-02 | 1.00e+00 | 2EGR1, PTCH1 |
10 |
| GOBP_VASCULAR_ASSOCIATED_SMOOTH_MUSCLE_CELL_DEVELOPMENT | 6.85e-04 | 64.86 | 6.55 | 4.82e-02 | 1.00e+00 | 2HES1, ADM |
10 |
| GOBP_COMPLEMENT_DEPENDENT_CYTOTOXICITY | 6.85e-04 | 64.86 | 6.55 | 4.82e-02 | 1.00e+00 | 2C3, CFH |
10 |
| GOBP_REGULATION_OF_EPIDERMIS_DEVELOPMENT | 7.39e-06 | 21.68 | 6.50 | 1.58e-03 | 5.53e-02 | 5ZFP36, HES1, PTCH1, SFRP4, ZFP36L1 |
69 |
| GOBP_KERATINOCYTE_PROLIFERATION | 3.76e-05 | 24.69 | 6.19 | 5.30e-03 | 2.81e-01 | 4ZFP36, PTCH1, FGF7, ZFP36L1 |
48 |
Dowload full table
Immunological Gene Sets:
| P-value | OR | Lower 95% CI | FDR | FWER | Genes Found | Gene Set Size | |
|---|---|---|---|---|---|---|---|
| GSE37605_TREG_VS_TCONV_NOD_FOXP3_FUSION_GFP_UP | 1.25e-14 | 32.04 | 15.27 | 6.11e-11 | 6.11e-11 | 13EGR1, FOS, ZFP36, FOSB, JUNB, NR4A1, ATF3, JUN, IER2, ID3, DUSP1, ADM, EGR3 |
150 |
| GSE36891_POLYIC_TLR3_VS_PAM_TLR2_STIM_PERITONEAL_MACROPHAGE_UP | 1.35e-11 | 24.83 | 11.23 | 9.36e-09 | 6.55e-08 | 11EGR1, FOS, ZFP36, FOSB, JUNB, NR4A1, ATF3, JUN, KLF4, IER2, DUSP1 |
153 |
| GSE37605_FOXP3_FUSION_GFP_VS_IRES_GFP_TREG_C57BL6_UP | 4.64e-12 | 22.80 | 10.66 | 9.34e-09 | 2.26e-08 | 12EGR1, FOS, ZFP36, FOSB, JUNB, NR4A1, ATF3, JUN, ID3, DUSP1, NFIA, ADM |
185 |
| GSE37605_C57BL6_VS_NOD_FOXP3_FUSION_GFP_TREG_DN | 6.73e-12 | 22.04 | 10.31 | 9.34e-09 | 3.28e-08 | 12FOS, ZFP36, FOSB, JUNB, NR4A1, ATF3, JUN, KLF4, IER2, ID3, DUSP1, ZFP36L1 |
191 |
| GSE23925_LIGHT_ZONE_VS_NAIVE_BCELL_UP | 1.08e-11 | 21.10 | 9.88 | 9.34e-09 | 5.29e-08 | 12EGR1, FOS, ZFP36, FOSB, JUNB, NR4A1, ATF3, IER2, ID3, DUSP1, EGR3, ZFP36L1 |
199 |
| GSE14769_UNSTIM_VS_40MIN_LPS_BMDM_DN | 1.15e-11 | 20.99 | 9.83 | 9.34e-09 | 5.60e-08 | 12EGR1, FOS, ZFP36, JUNB, ATF3, JUN, SOCS3, IER2, ID3, GADD45B, DUSP1, ZFP36L1 |
200 |
| GSE23925_DARK_ZONE_VS_NAIVE_BCELL_DN | 1.15e-11 | 20.99 | 9.83 | 9.34e-09 | 5.60e-08 | 12EGR1, FOS, ZFP36, FOSB, JUNB, NR4A1, IER2, ID3, EFEMP1, DUSP1, EGR3, ZFP36L1 |
200 |
| GSE37301_PRO_BCELL_VS_GRANULOCYTE_MONOCYTE_PROGENITOR_UP | 4.61e-09 | 20.03 | 8.39 | 1.73e-06 | 2.25e-05 | 9FOS, ZFP36, FOSB, JUN, ID3, GADD45B, DUSP1, CYBRD1, FLRT2 |
146 |
| GSE45365_NK_CELL_VS_BCELL_UP | 3.90e-09 | 16.62 | 7.30 | 1.73e-06 | 1.90e-05 | 10EGR1, FOS, ZFP36, FOSB, JUNB, ATF3, IER2, ID3, DUSP1, EGR3 |
198 |
| KAECH_DAY8_EFF_VS_MEMORY_CD8_TCELL_DN | 4.09e-09 | 16.53 | 7.26 | 1.73e-06 | 1.99e-05 | 10EGR1, FOS, ZFP36, FOSB, JUN, KLF4, SOCS3, IER2, DUSP1, ZFP36L1 |
199 |
| GSE19923_WT_VS_HEB_AND_E2A_KO_DP_THYMOCYTE_DN | 4.29e-09 | 16.45 | 7.22 | 1.73e-06 | 2.09e-05 | 10EGR1, FOS, ZFP36, JUNB, NR4A1, ATF3, SOCS3, IER2, DUSP1, ZFP36L1 |
200 |
| GSE16385_ROSIGLITAZONE_IFNG_TNF_VS_IL4_STIM_MACROPHAGE_UP | 4.29e-09 | 16.45 | 7.22 | 1.73e-06 | 2.09e-05 | 10EGR1, FOS, ZFP36, FOSB, JUNB, NR4A1, IER2, DUSP1, LUM, ZFP36L1 |
200 |
| GSE27434_WT_VS_DNMT1_KO_TREG_DN | 4.29e-09 | 16.45 | 7.22 | 1.73e-06 | 2.09e-05 | 10EGR1, FOS, ZFP36, JUNB, NR4A1, SOCS3, IER2, GADD45B, DUSP1, ZFP36L1 |
200 |
| GSE24671_CTRL_VS_BAKIMULC_INFECTED_MOUSE_SPLENOCYTES_DN | 1.72e-08 | 17.04 | 7.16 | 6.00e-06 | 8.40e-05 | 9JUNB, NR4A1, DCN, FSTL1, GADD45B, DUSP1, FLRT2, LAMA2, ZFP36L1 |
170 |
| GSE36891_UNSTIM_VS_POLYIC_TLR3_STIM_PERITONEAL_MACROPHAGE_UP | 1.05e-07 | 16.88 | 6.72 | 1.83e-05 | 5.13e-04 | 8EGR1, FOS, ZFP36, FOSB, NR4A1, ATF3, IER2, EGR3 |
149 |
| GSE7219_WT_VS_NIK_NFKB2_KO_DC_UP | 3.56e-08 | 15.59 | 6.56 | 1.16e-05 | 1.73e-04 | 9EGR1, ZFP36, ATF3, JUN, SOCS3, KLF10, GADD45B, BRD2, ZFP36L1 |
185 |
| GSE9988_ANTI_TREM1_AND_LPS_VS_CTRL_TREATED_MONOCYTES_UP | 5.33e-08 | 14.83 | 6.24 | 1.25e-05 | 2.60e-04 | 9EGR1, NR4A1, JUN, SOCS3, KLF10, HES1, GADD45B, DUSP1, ADM |
194 |
| GSE29617_CTRL_VS_DAY7_TIV_FLU_VACCINE_PBMC_2008_UP | 5.82e-08 | 14.67 | 6.18 | 1.25e-05 | 2.84e-04 | 9FOS, FOSB, JUNB, NR4A1, ATF3, SOCS3, SERPING1, DUSP1, EGR3 |
196 |
| GSE9988_LOW_LPS_VS_CTRL_TREATED_MONOCYTE_UP | 5.82e-08 | 14.67 | 6.18 | 1.25e-05 | 2.84e-04 | 9EGR1, NR4A1, JUN, SOCS3, HES1, GADD45B, DUSP1, ADM, EGR3 |
196 |
| GSE9988_ANTI_TREM1_VS_CTRL_TREATED_MONOCYTES_UP | 6.34e-08 | 14.52 | 6.11 | 1.25e-05 | 3.09e-04 | 9EGR1, NR4A1, ATF3, JUN, KLF10, GADD45B, DUSP1, ADM, EGR3 |
198 |
Top Ranked Transcription Factors for this Gene Expression Program:
| Gene Symbol | TF Rank | DNA Binding Domain | Motif Status | IUPAC PWM | GTEx | DepMap | Decartes |
|---|---|---|---|---|---|---|---|
| EGR1 | 1 | Yes | Known motif | Monomer or homomultimer | High-throughput in vitro | None | None |
| FOS | 2 | Yes | Known motif | Monomer or homomultimer | High-throughput in vitro | None | None |
| ZFP36 | 3 | No | ssDNA/RNA binding | Not a DNA binding protein | No motif | None | RNA binding protein (PMID: 10330172). |
| FOSB | 4 | Yes | Known motif | Monomer or homomultimer | High-throughput in vitro | None | None |
| NR2F2 | 5 | Yes | Known motif | Monomer or homomultimer | 100 perc ID - in vitro | None | None |
| JUNB | 6 | Yes | Known motif | Monomer or homomultimer | High-throughput in vitro | None | Prefers forming heterodimers with FOS; FOSB; FOSL1 and FOSL2 over homodimers (PMID:12805554); but, clearly can bind DNA specifically in vitro. |
| NR4A1 | 7 | Yes | Known motif | Monomer or homomultimer | High-throughput in vitro | None | None |
| ATF3 | 8 | Yes | Known motif | Monomer or homomultimer | High-throughput in vitro | None | None |
| JUN | 14 | Yes | Known motif | Monomer or homomultimer | High-throughput in vitro | None | None |
| KLF4 | 16 | Yes | Known motif | Monomer or homomultimer | High-throughput in vitro | None | None |
| KLF10 | 20 | Yes | Known motif | Monomer or homomultimer | High-throughput in vitro | None | None |
| ID3 | 21 | No | Unlikely to be sequence specific TF | Not a DNA binding protein | No motif | None | ID bHLH proteins lack the basic region and should not be able to bind DNA. The HT-SELEX motif for ID4 is likely by a co-precipitated protein or it is a contamination |
| HES1 | 24 | Yes | Known motif | Monomer or homomultimer | High-throughput in vitro | None | None |
| PTCH1 | 29 | No | Unlikely to be sequence specific TF | Not a DNA binding protein | No motif | None | None |
| SFRP4 | 31 | No | Unlikely to be sequence specific TF | Not a DNA binding protein | No motif | None | None |
| NFIA | 36 | Yes | Known motif | Monomer or homomultimer | High-throughput in vitro | None | None |
| OSR2 | 37 | Yes | Known motif | Monomer or homomultimer | High-throughput in vitro | None | None |
| MEOX2 | 40 | Yes | Known motif | Monomer or homomultimer | High-throughput in vitro | None | None |
| NFIB | 45 | Yes | Known motif | Monomer or homomultimer | High-throughput in vitro | None | None |
| EGR3 | 48 | Yes | Known motif | Monomer or homomultimer | High-throughput in vitro | None | None |
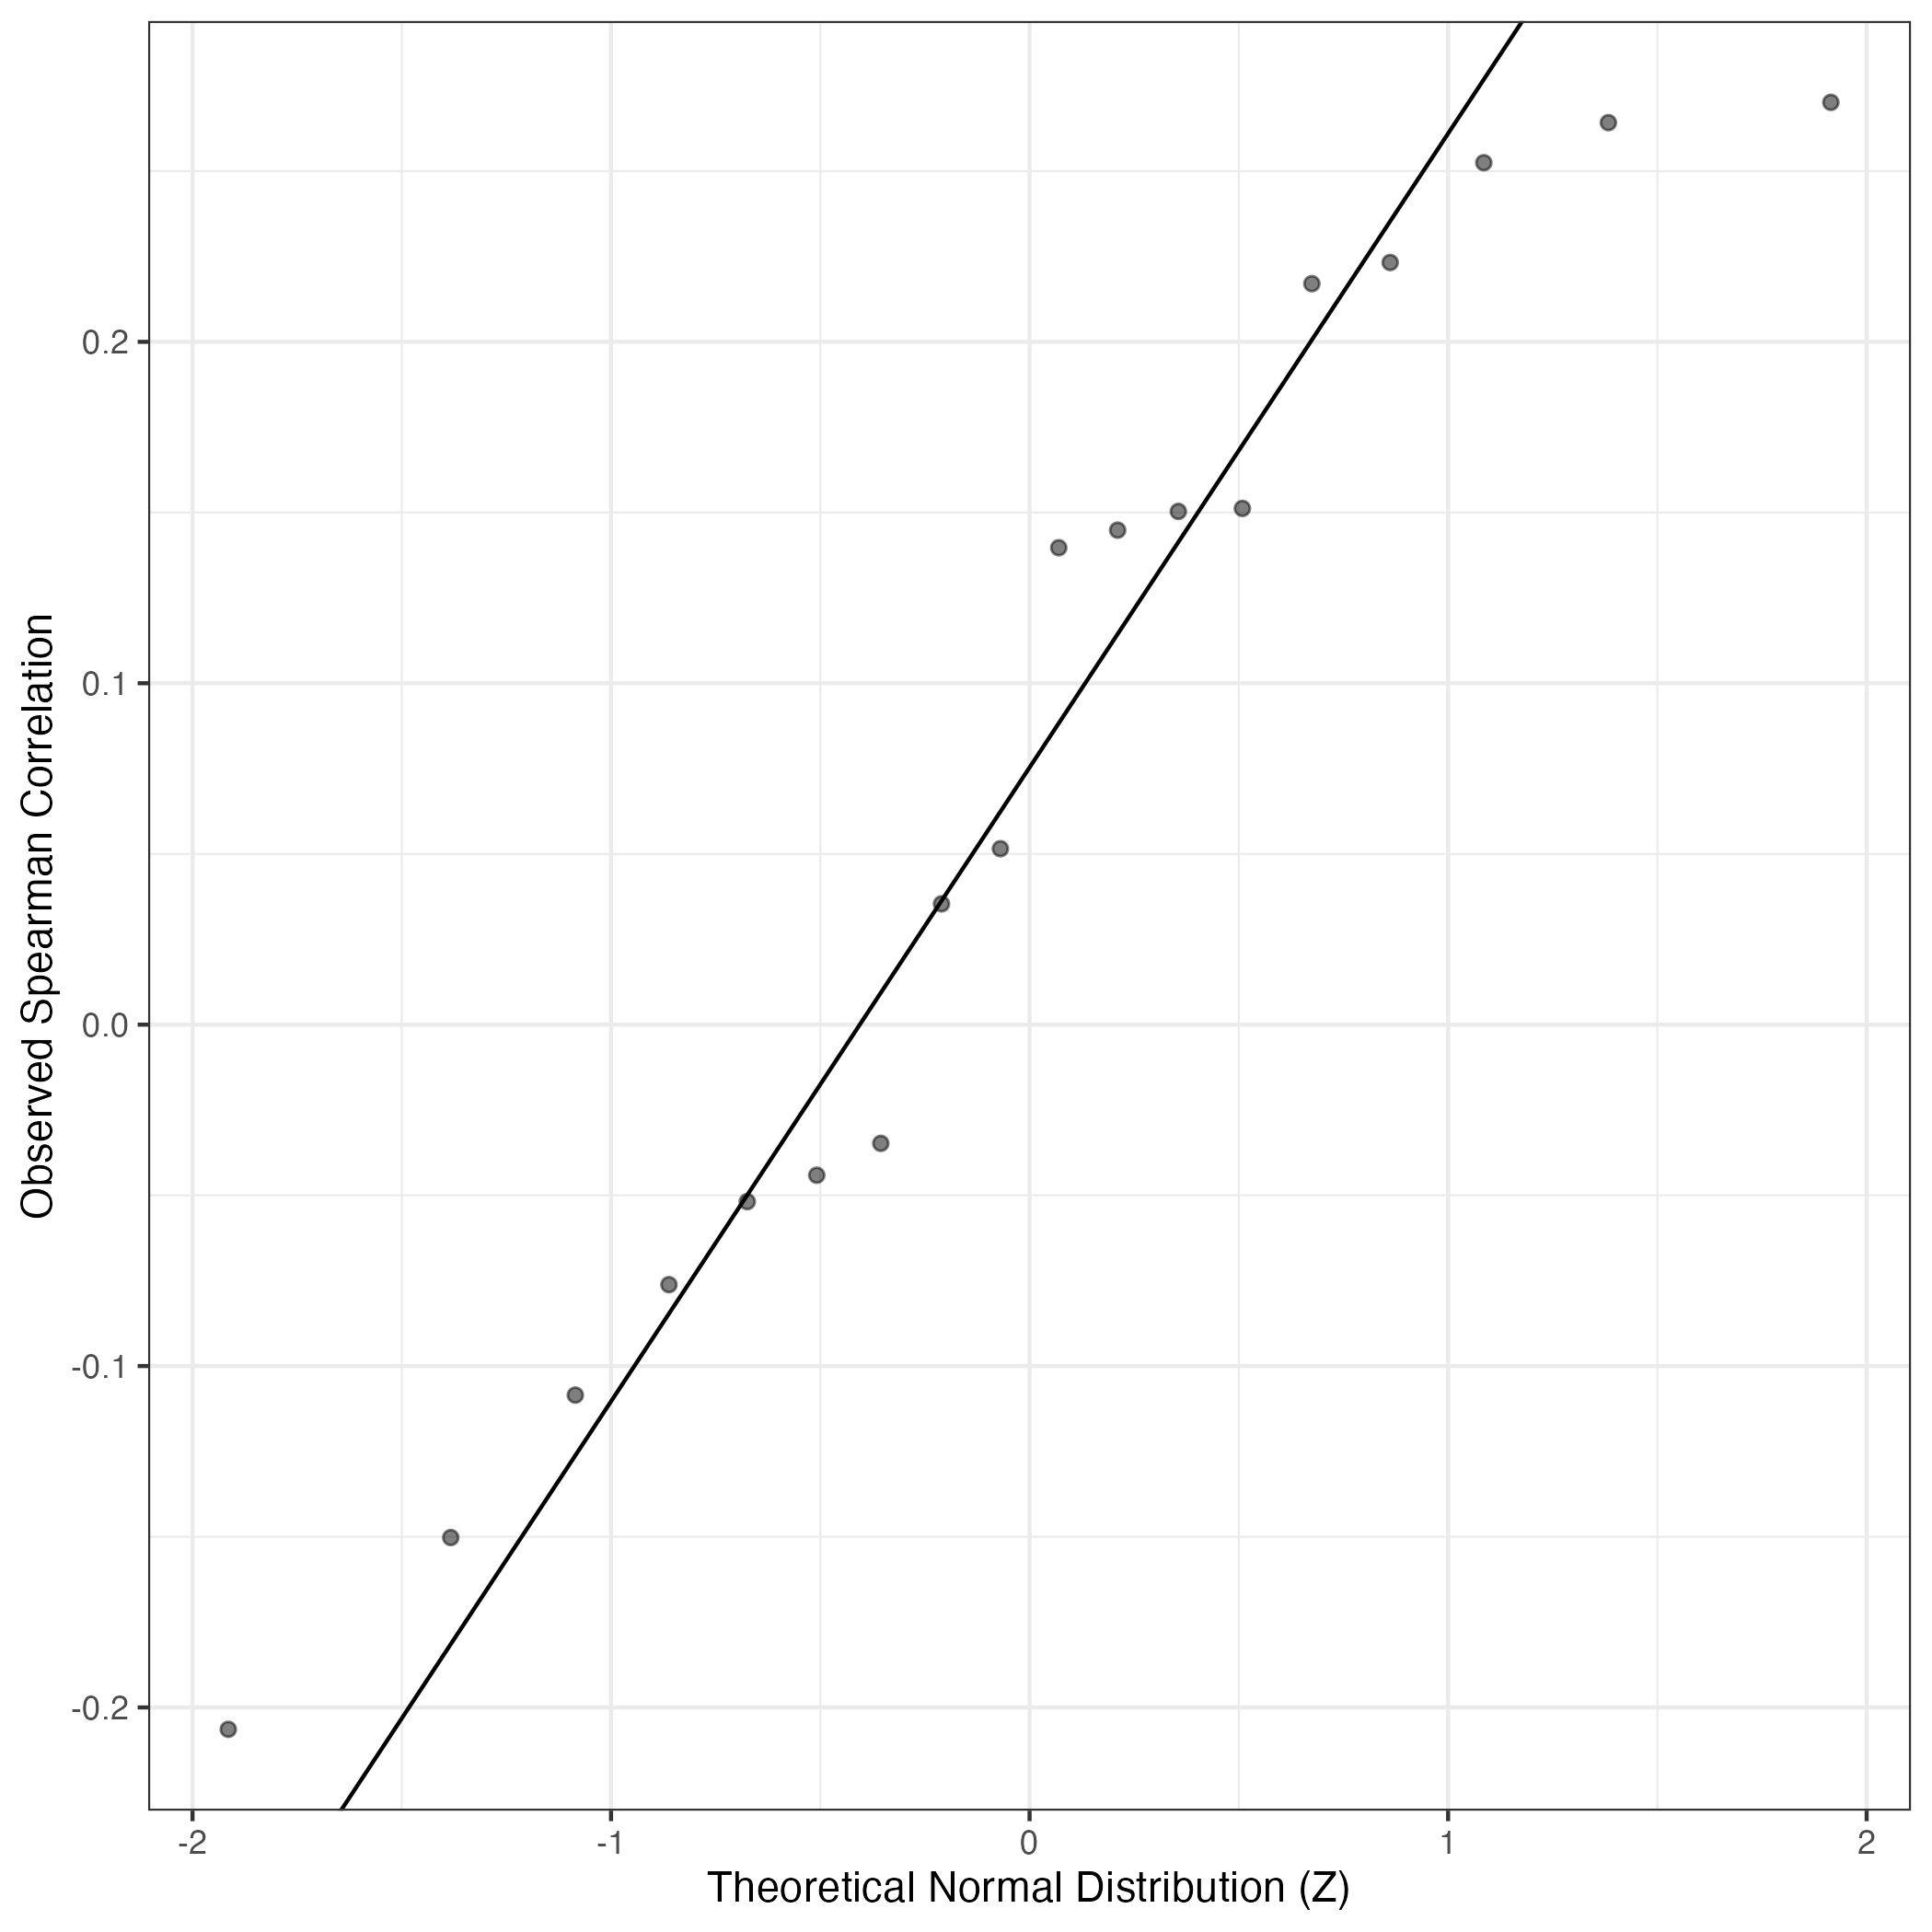
QQ Plot showing correlations with other GEPs in this dataset, calculated by Spearman correlation:
Interactive QQ-plot of gene loadings:
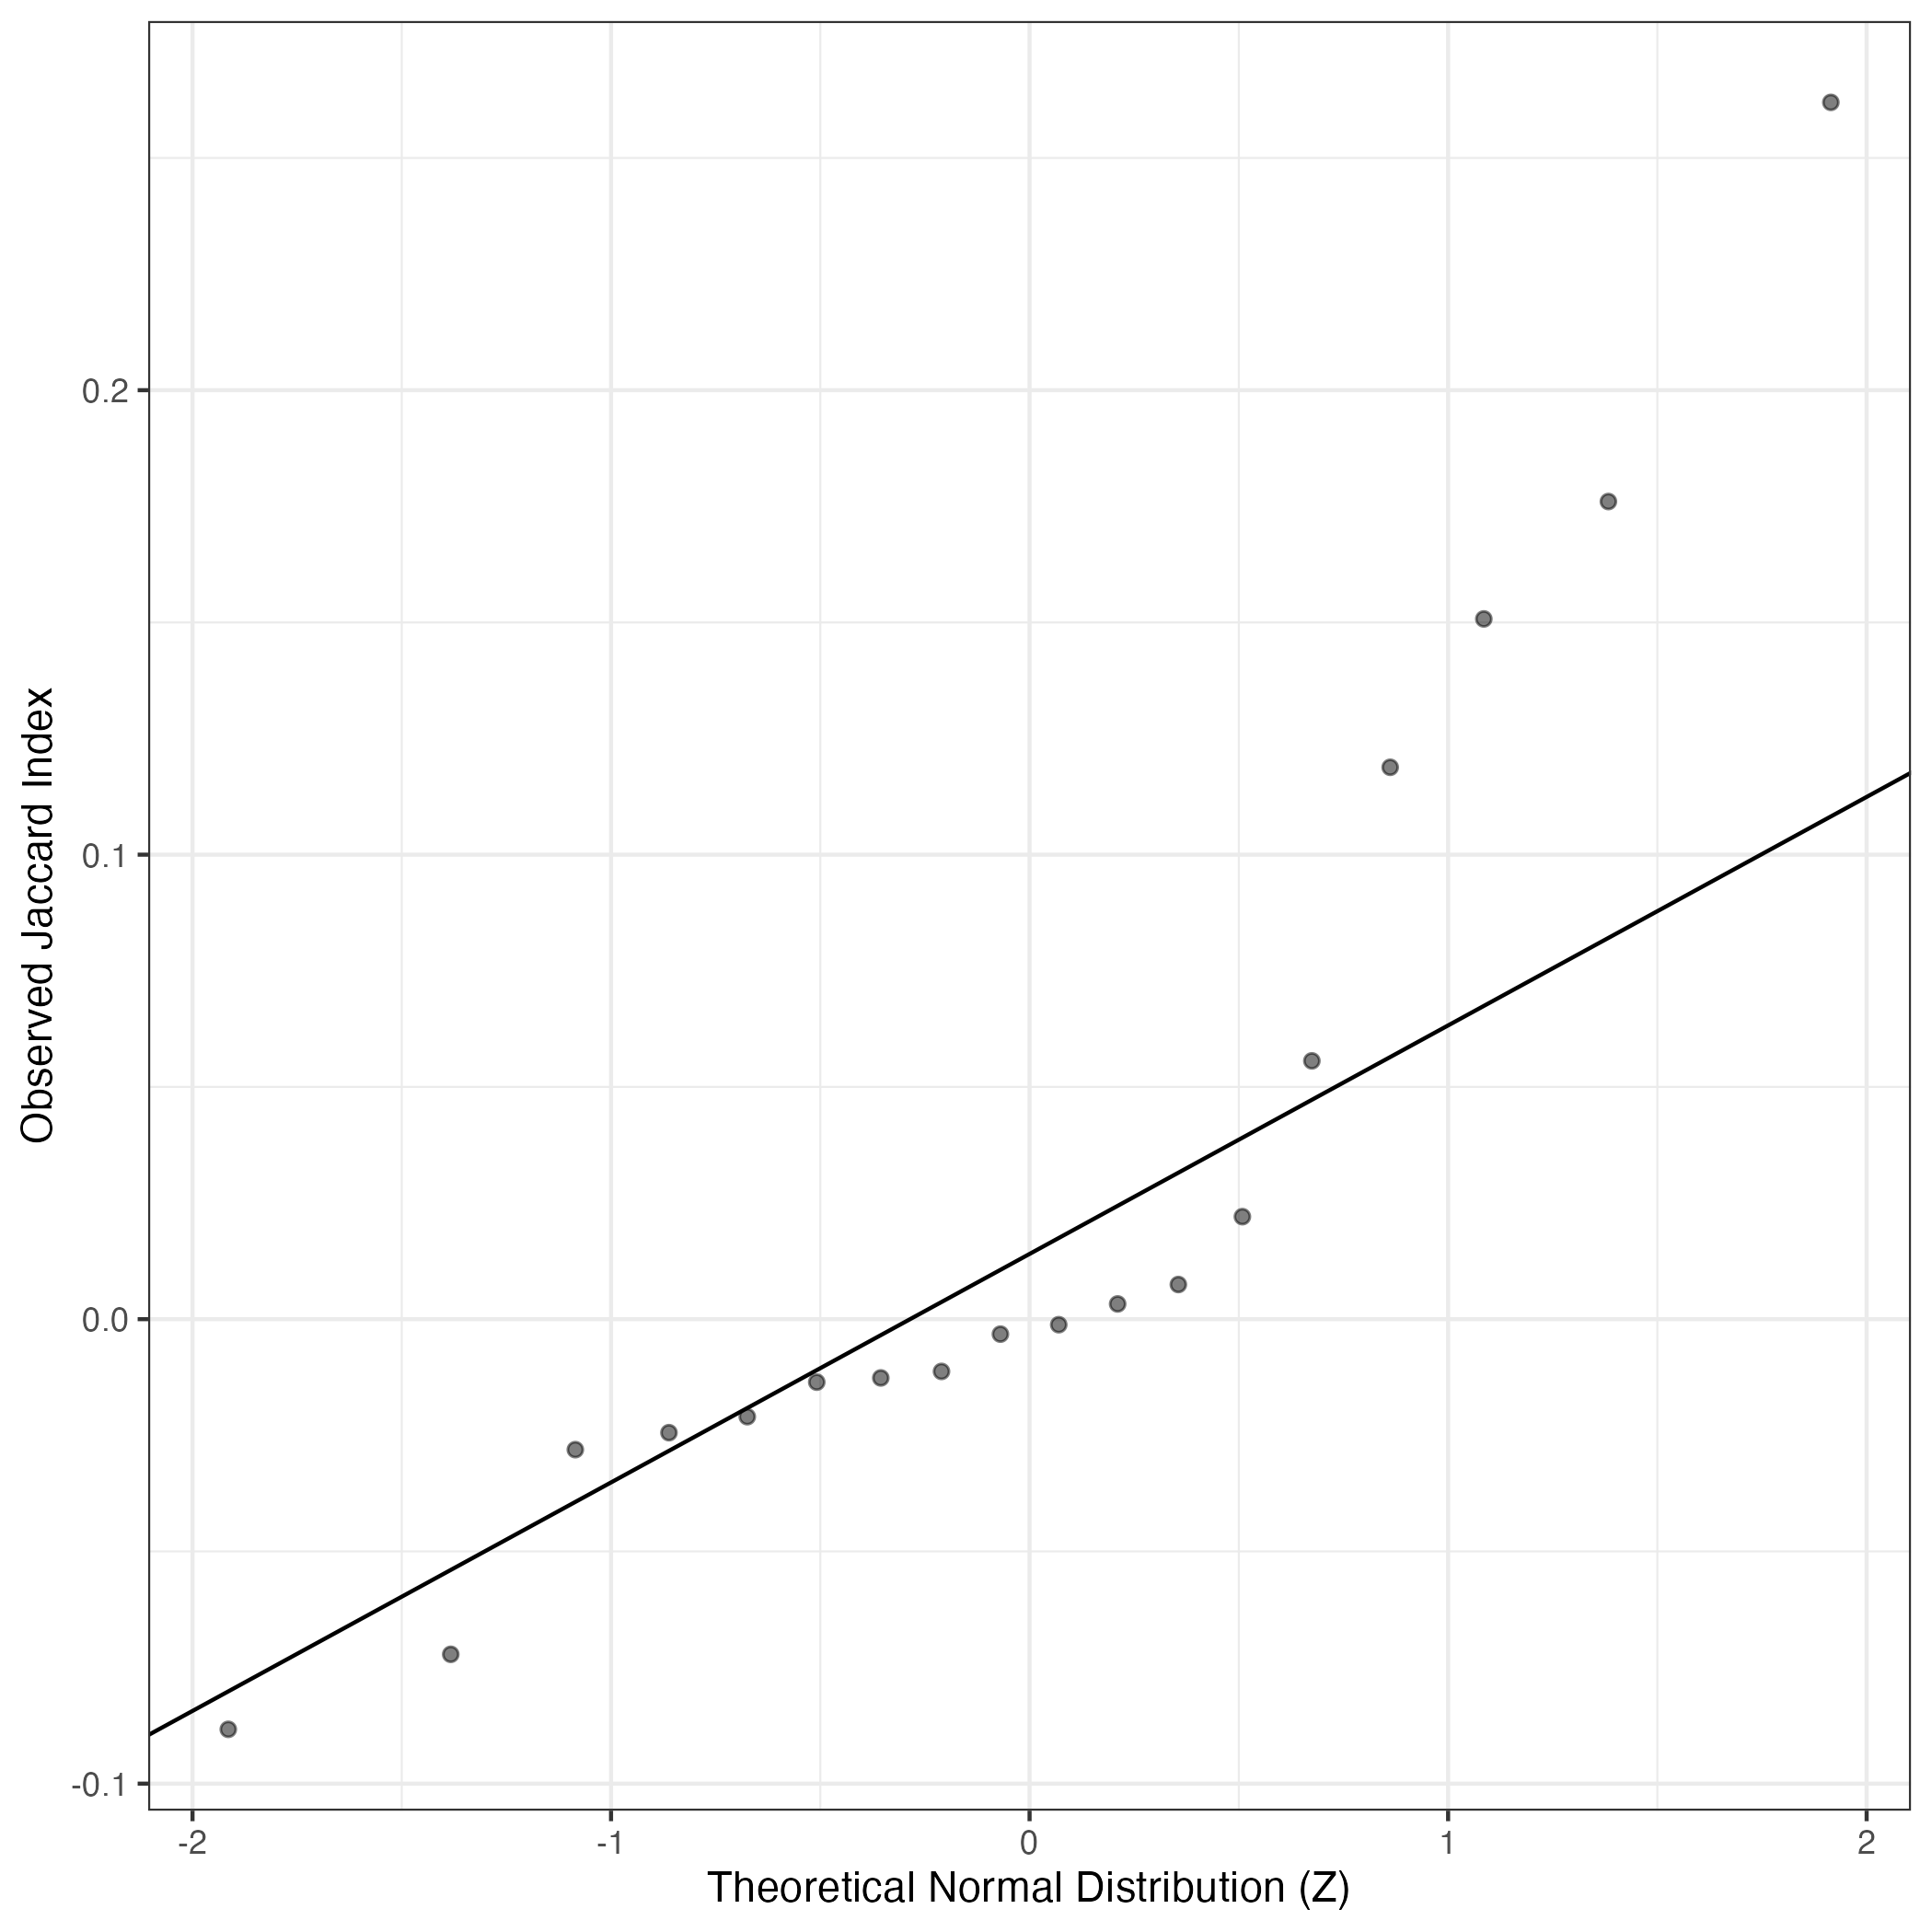
A similar QQ-plot as above, but only for instances where the H value is e.g. > 25, i.e. we are confident that the expression program is active above noise. Agreemenet between these binary vectors is tested using the Jaccard Index, with the P-values calculated by an exact test:
Interactive QQ-plot:
Singler cell type annotations for the top 50 cells on this program.
| Cell ID | Singler label | Singler Delta | Activity Score | Top Singler Raw Scores |
|---|---|---|---|---|
| WK098-H17 | Tissue_stem_cells:BM_MSC:BMP2 | 0.21 | 980.04 | Raw ScoresFibroblasts:breast: 0.49, Osteoblasts: 0.48, Smooth_muscle_cells:bronchial: 0.48, Tissue_stem_cells:BM_MSC:TGFb3: 0.47, Smooth_muscle_cells:bronchial:vit_D: 0.47, iPS_cells:adipose_stem_cells: 0.47, Tissue_stem_cells:BM_MSC:BMP2: 0.47, iPS_cells:CRL2097_foreskin: 0.47, Tissue_stem_cells:iliac_MSC: 0.46, Smooth_muscle_cells:vascular: 0.46 |
| KK052-N19 | Chondrocytes:MSC-derived | 0.23 | 626.92 | Raw ScoresFibroblasts:breast: 0.49, iPS_cells:adipose_stem_cells: 0.48, Smooth_muscle_cells:bronchial: 0.47, Smooth_muscle_cells:vascular: 0.46, Smooth_muscle_cells:bronchial:vit_D: 0.46, Chondrocytes:MSC-derived: 0.46, Osteoblasts: 0.46, Tissue_stem_cells:BM_MSC:TGFb3: 0.46, iPS_cells:CRL2097_foreskin: 0.46, Smooth_muscle_cells:vascular:IL-17: 0.46 |
| KK051-A2 | Fibroblasts:breast | 0.21 | 530.14 | Raw ScoresFibroblasts:breast: 0.45, iPS_cells:adipose_stem_cells: 0.44, Tissue_stem_cells:BM_MSC:TGFb3: 0.43, Osteoblasts: 0.43, Smooth_muscle_cells:bronchial: 0.43, iPS_cells:CRL2097_foreskin: 0.43, Smooth_muscle_cells:vascular: 0.43, Smooth_muscle_cells:vascular:IL-17: 0.43, Smooth_muscle_cells:bronchial:vit_D: 0.43, Chondrocytes:MSC-derived: 0.43 |
| WK097-N22 | Fibroblasts:breast | 0.19 | 520.42 | Raw ScoresFibroblasts:breast: 0.46, Smooth_muscle_cells:bronchial: 0.45, iPS_cells:adipose_stem_cells: 0.45, Osteoblasts: 0.45, Smooth_muscle_cells:bronchial:vit_D: 0.45, Smooth_muscle_cells:vascular: 0.45, Tissue_stem_cells:BM_MSC:BMP2: 0.45, iPS_cells:CRL2097_foreskin: 0.45, Smooth_muscle_cells:vascular:IL-17: 0.44, Tissue_stem_cells:BM_MSC:TGFb3: 0.44 |
| WK098-E8 | Smooth_muscle_cells:bronchial | 0.21 | 503.62 | Raw ScoresSmooth_muscle_cells:bronchial: 0.45, Fibroblasts:breast: 0.45, Osteoblasts: 0.45, Smooth_muscle_cells:bronchial:vit_D: 0.44, iPS_cells:adipose_stem_cells: 0.44, iPS_cells:CRL2097_foreskin: 0.43, Chondrocytes:MSC-derived: 0.43, Tissue_stem_cells:BM_MSC:BMP2: 0.43, Smooth_muscle_cells:vascular: 0.43, Tissue_stem_cells:iliac_MSC: 0.42 |
| KK053-J21 | Fibroblasts:breast | 0.26 | 476.13 | Raw ScoresFibroblasts:breast: 0.52, iPS_cells:adipose_stem_cells: 0.5, Osteoblasts: 0.5, iPS_cells:CRL2097_foreskin: 0.5, Osteoblasts:BMP2: 0.5, Smooth_muscle_cells:bronchial: 0.5, Chondrocytes:MSC-derived: 0.5, Tissue_stem_cells:BM_MSC:TGFb3: 0.49, Smooth_muscle_cells:bronchial:vit_D: 0.49, Smooth_muscle_cells:vascular: 0.49 |
| WK098-B4 | Fibroblasts:breast | 0.22 | 457.75 | Raw ScoresFibroblasts:breast: 0.47, iPS_cells:adipose_stem_cells: 0.46, Tissue_stem_cells:BM_MSC:TGFb3: 0.46, Smooth_muscle_cells:bronchial: 0.45, Osteoblasts: 0.45, Smooth_muscle_cells:bronchial:vit_D: 0.45, Smooth_muscle_cells:vascular:IL-17: 0.45, Smooth_muscle_cells:vascular: 0.45, Tissue_stem_cells:BM_MSC:BMP2: 0.45, Tissue_stem_cells:iliac_MSC: 0.45 |
| WK097-O15 | Chondrocytes:MSC-derived | 0.18 | 451.00 | Raw ScoresFibroblasts:breast: 0.44, Smooth_muscle_cells:bronchial: 0.43, Smooth_muscle_cells:bronchial:vit_D: 0.43, iPS_cells:adipose_stem_cells: 0.43, Smooth_muscle_cells:vascular: 0.43, Smooth_muscle_cells:vascular:IL-17: 0.43, iPS_cells:CRL2097_foreskin: 0.42, Osteoblasts: 0.42, Tissue_stem_cells:BM_MSC:TGFb3: 0.42, Tissue_stem_cells:BM_MSC:BMP2: 0.42 |
| WK097-B15 | Neurons:Schwann_cell | 0.14 | 443.21 | Raw ScoresFibroblasts:breast: 0.46, Chondrocytes:MSC-derived: 0.45, iPS_cells:adipose_stem_cells: 0.45, Smooth_muscle_cells:bronchial: 0.45, Tissue_stem_cells:BM_MSC:BMP2: 0.45, iPS_cells:CRL2097_foreskin: 0.45, Osteoblasts: 0.45, Smooth_muscle_cells:vascular: 0.45, Smooth_muscle_cells:vascular:IL-17: 0.45, Smooth_muscle_cells:bronchial:vit_D: 0.45 |
| WK101-D21 | Tissue_stem_cells:BM_MSC:BMP2 | 0.18 | 435.32 | Raw ScoresSmooth_muscle_cells:bronchial: 0.41, Smooth_muscle_cells:bronchial:vit_D: 0.41, Tissue_stem_cells:BM_MSC:TGFb3: 0.4, Osteoblasts: 0.4, Fibroblasts:breast: 0.4, Tissue_stem_cells:BM_MSC:BMP2: 0.4, Tissue_stem_cells:iliac_MSC: 0.4, Chondrocytes:MSC-derived: 0.39, Smooth_muscle_cells:vascular: 0.39, Smooth_muscle_cells:vascular:IL-17: 0.39 |
| WK059-M17 | Fibroblasts:breast | 0.21 | 393.33 | Raw ScoresFibroblasts:breast: 0.47, Osteoblasts: 0.46, Smooth_muscle_cells:vascular:IL-17: 0.46, Smooth_muscle_cells:vascular: 0.46, Smooth_muscle_cells:bronchial: 0.45, iPS_cells:adipose_stem_cells: 0.45, Smooth_muscle_cells:bronchial:vit_D: 0.45, Tissue_stem_cells:BM_MSC:TGFb3: 0.45, Tissue_stem_cells:iliac_MSC: 0.45, Tissue_stem_cells:BM_MSC:BMP2: 0.44 |
| WK051-F21 | Smooth_muscle_cells:bronchial | 0.18 | 363.65 | Raw ScoresFibroblasts:breast: 0.42, iPS_cells:CRL2097_foreskin: 0.42, Smooth_muscle_cells:bronchial: 0.41, iPS_cells:adipose_stem_cells: 0.41, Osteoblasts: 0.41, Chondrocytes:MSC-derived: 0.41, Smooth_muscle_cells:bronchial:vit_D: 0.41, Smooth_muscle_cells:vascular: 0.41, Tissue_stem_cells:BM_MSC:BMP2: 0.41, Smooth_muscle_cells:vascular:IL-17: 0.41 |
| WK036-M19 | Fibroblasts:breast | 0.24 | 351.80 | Raw ScoresFibroblasts:breast: 0.5, Smooth_muscle_cells:bronchial: 0.49, iPS_cells:adipose_stem_cells: 0.49, Smooth_muscle_cells:bronchial:vit_D: 0.48, Osteoblasts: 0.48, Tissue_stem_cells:BM_MSC:TGFb3: 0.47, Chondrocytes:MSC-derived: 0.47, Tissue_stem_cells:BM_MSC:BMP2: 0.47, iPS_cells:CRL2097_foreskin: 0.47, Tissue_stem_cells:iliac_MSC: 0.47 |
| WK101-B3 | Tissue_stem_cells:BM_MSC:BMP2 | 0.18 | 351.46 | Raw ScoresFibroblasts:breast: 0.48, Osteoblasts: 0.47, iPS_cells:adipose_stem_cells: 0.47, Tissue_stem_cells:BM_MSC:BMP2: 0.47, Tissue_stem_cells:BM_MSC:TGFb3: 0.47, iPS_cells:CRL2097_foreskin: 0.47, Chondrocytes:MSC-derived: 0.46, Smooth_muscle_cells:bronchial: 0.46, Osteoblasts:BMP2: 0.46, Smooth_muscle_cells:vascular: 0.46 |
| WK097-K14 | Tissue_stem_cells:BM_MSC:BMP2 | 0.19 | 341.97 | Raw ScoresFibroblasts:breast: 0.48, Smooth_muscle_cells:bronchial: 0.48, Smooth_muscle_cells:bronchial:vit_D: 0.48, Smooth_muscle_cells:vascular: 0.47, Smooth_muscle_cells:vascular:IL-17: 0.47, iPS_cells:adipose_stem_cells: 0.47, Chondrocytes:MSC-derived: 0.47, Osteoblasts: 0.47, Tissue_stem_cells:BM_MSC:TGFb3: 0.47, Tissue_stem_cells:BM_MSC:BMP2: 0.46 |
| KK057-A15 | Fibroblasts:breast | 0.21 | 339.17 | Raw ScoresFibroblasts:breast: 0.53, iPS_cells:adipose_stem_cells: 0.52, Smooth_muscle_cells:bronchial: 0.52, Smooth_muscle_cells:bronchial:vit_D: 0.51, iPS_cells:CRL2097_foreskin: 0.51, Osteoblasts: 0.5, Smooth_muscle_cells:vascular: 0.5, Tissue_stem_cells:BM_MSC:TGFb3: 0.5, Osteoblasts:BMP2: 0.49, Smooth_muscle_cells:vascular:IL-17: 0.49 |
| KK052-A6 | Fibroblasts:breast | 0.26 | 338.63 | Raw ScoresFibroblasts:breast: 0.53, iPS_cells:adipose_stem_cells: 0.52, iPS_cells:CRL2097_foreskin: 0.51, Osteoblasts: 0.51, Smooth_muscle_cells:vascular: 0.51, Smooth_muscle_cells:vascular:IL-17: 0.5, Tissue_stem_cells:BM_MSC:TGFb3: 0.5, Smooth_muscle_cells:bronchial: 0.5, Smooth_muscle_cells:bronchial:vit_D: 0.5, Osteoblasts:BMP2: 0.49 |
| WK098-K7 | Chondrocytes:MSC-derived | 0.19 | 334.97 | Raw ScoresFibroblasts:breast: 0.44, Chondrocytes:MSC-derived: 0.44, Osteoblasts: 0.44, Smooth_muscle_cells:bronchial: 0.44, iPS_cells:CRL2097_foreskin: 0.44, iPS_cells:adipose_stem_cells: 0.44, Tissue_stem_cells:BM_MSC:TGFb3: 0.44, Smooth_muscle_cells:bronchial:vit_D: 0.43, Tissue_stem_cells:BM_MSC:BMP2: 0.43, Neurons:Schwann_cell: 0.43 |
| WK050-M16 | Chondrocytes:MSC-derived | 0.17 | 327.78 | Raw ScoresSmooth_muscle_cells:bronchial: 0.41, Tissue_stem_cells:BM_MSC:BMP2: 0.41, Fibroblasts:breast: 0.41, Osteoblasts: 0.41, Tissue_stem_cells:BM_MSC:TGFb3: 0.41, Smooth_muscle_cells:bronchial:vit_D: 0.41, iPS_cells:CRL2097_foreskin: 0.4, iPS_cells:adipose_stem_cells: 0.4, Chondrocytes:MSC-derived: 0.4, Tissue_stem_cells:iliac_MSC: 0.4 |
| KK059-M6 | Tissue_stem_cells:BM_MSC:TGFb3 | 0.16 | 326.55 | Raw ScoresiPS_cells:CRL2097_foreskin: 0.46, iPS_cells:adipose_stem_cells: 0.45, Fibroblasts:breast: 0.45, Smooth_muscle_cells:bronchial: 0.45, Osteoblasts: 0.44, Smooth_muscle_cells:bronchial:vit_D: 0.44, Smooth_muscle_cells:vascular: 0.44, Tissue_stem_cells:BM_MSC:TGFb3: 0.44, iPS_cells:fibroblasts: 0.43, Tissue_stem_cells:iliac_MSC: 0.43 |
| WK056-P14 | Chondrocytes:MSC-derived | 0.19 | 317.36 | Raw ScoresFibroblasts:breast: 0.43, Smooth_muscle_cells:bronchial: 0.42, Osteoblasts: 0.42, iPS_cells:CRL2097_foreskin: 0.42, Chondrocytes:MSC-derived: 0.42, iPS_cells:adipose_stem_cells: 0.42, Tissue_stem_cells:BM_MSC:TGFb3: 0.42, Smooth_muscle_cells:bronchial:vit_D: 0.42, Tissue_stem_cells:BM_MSC:BMP2: 0.41, Smooth_muscle_cells:vascular: 0.41 |
| WK098-G18 | Neurons:Schwann_cell | 0.18 | 317.28 | Raw ScoresFibroblasts:breast: 0.44, Osteoblasts: 0.44, iPS_cells:CRL2097_foreskin: 0.43, iPS_cells:adipose_stem_cells: 0.43, Tissue_stem_cells:BM_MSC:TGFb3: 0.43, Tissue_stem_cells:BM_MSC:BMP2: 0.43, Chondrocytes:MSC-derived: 0.43, Smooth_muscle_cells:bronchial: 0.43, Tissue_stem_cells:iliac_MSC: 0.43, Smooth_muscle_cells:vascular: 0.42 |
| WK055-E1 | Fibroblasts:breast | 0.22 | 311.82 | Raw ScoresFibroblasts:breast: 0.43, Smooth_muscle_cells:bronchial: 0.42, iPS_cells:adipose_stem_cells: 0.41, iPS_cells:CRL2097_foreskin: 0.41, Smooth_muscle_cells:bronchial:vit_D: 0.41, Osteoblasts: 0.41, Tissue_stem_cells:BM_MSC:TGFb3: 0.4, Smooth_muscle_cells:vascular: 0.4, Tissue_stem_cells:iliac_MSC: 0.4, Smooth_muscle_cells:vascular:IL-17: 0.4 |
| WK059-I19 | Tissue_stem_cells:BM_MSC:BMP2 | 0.20 | 309.04 | Raw ScoresFibroblasts:breast: 0.48, Smooth_muscle_cells:vascular: 0.47, Osteoblasts: 0.47, Smooth_muscle_cells:vascular:IL-17: 0.47, iPS_cells:CRL2097_foreskin: 0.47, Tissue_stem_cells:BM_MSC:TGFb3: 0.47, iPS_cells:adipose_stem_cells: 0.47, Chondrocytes:MSC-derived: 0.47, Smooth_muscle_cells:bronchial: 0.46, Tissue_stem_cells:BM_MSC:BMP2: 0.46 |
| WK067-N21 | Neurons:Schwann_cell | 0.23 | 304.65 | Raw ScoresNeurons:Schwann_cell: 0.54, Fibroblasts:breast: 0.52, Smooth_muscle_cells:bronchial: 0.52, iPS_cells:CRL2097_foreskin: 0.52, Tissue_stem_cells:BM_MSC:BMP2: 0.52, iPS_cells:adipose_stem_cells: 0.52, Osteoblasts: 0.52, Tissue_stem_cells:BM_MSC:TGFb3: 0.51, Smooth_muscle_cells:bronchial:vit_D: 0.51, Osteoblasts:BMP2: 0.51 |
| WK057-J13 | Fibroblasts:breast | 0.22 | 302.44 | Raw ScoresFibroblasts:breast: 0.43, iPS_cells:adipose_stem_cells: 0.42, Smooth_muscle_cells:bronchial: 0.42, Tissue_stem_cells:BM_MSC:TGFb3: 0.41, iPS_cells:CRL2097_foreskin: 0.41, Smooth_muscle_cells:bronchial:vit_D: 0.41, Osteoblasts: 0.41, Smooth_muscle_cells:vascular: 0.41, Smooth_muscle_cells:vascular:IL-17: 0.41, Tissue_stem_cells:BM_MSC:BMP2: 0.4 |
| KK057-I7 | Fibroblasts:breast | 0.21 | 299.04 | Raw ScoresFibroblasts:breast: 0.48, iPS_cells:adipose_stem_cells: 0.47, Smooth_muscle_cells:bronchial: 0.47, iPS_cells:CRL2097_foreskin: 0.46, Osteoblasts: 0.46, Smooth_muscle_cells:bronchial:vit_D: 0.46, Tissue_stem_cells:BM_MSC:BMP2: 0.46, Tissue_stem_cells:BM_MSC:TGFb3: 0.46, Chondrocytes:MSC-derived: 0.45, iPS_cells:fibroblasts: 0.45 |
| WK057-I1 | Osteoblasts | 0.19 | 298.55 | Raw ScoresFibroblasts:breast: 0.45, Osteoblasts: 0.44, Tissue_stem_cells:BM_MSC:TGFb3: 0.44, iPS_cells:CRL2097_foreskin: 0.44, Smooth_muscle_cells:bronchial: 0.44, iPS_cells:adipose_stem_cells: 0.44, Chondrocytes:MSC-derived: 0.44, Tissue_stem_cells:BM_MSC:BMP2: 0.44, Smooth_muscle_cells:bronchial:vit_D: 0.43, Osteoblasts:BMP2: 0.43 |
| WK098-D9 | Tissue_stem_cells:BM_MSC:BMP2 | 0.19 | 291.09 | Raw ScoresSmooth_muscle_cells:bronchial: 0.44, Fibroblasts:breast: 0.43, Tissue_stem_cells:BM_MSC:TGFb3: 0.43, Tissue_stem_cells:BM_MSC:BMP2: 0.43, Smooth_muscle_cells:bronchial:vit_D: 0.43, Osteoblasts: 0.43, iPS_cells:CRL2097_foreskin: 0.43, Smooth_muscle_cells:vascular:IL-17: 0.43, iPS_cells:adipose_stem_cells: 0.43, Chondrocytes:MSC-derived: 0.43 |
| WK098-F18 | Smooth_muscle_cells:bronchial | 0.20 | 289.41 | Raw ScoresFibroblasts:breast: 0.45, Smooth_muscle_cells:bronchial: 0.44, Smooth_muscle_cells:bronchial:vit_D: 0.44, iPS_cells:adipose_stem_cells: 0.44, Smooth_muscle_cells:vascular: 0.43, Osteoblasts: 0.43, Smooth_muscle_cells:vascular:IL-17: 0.43, iPS_cells:CRL2097_foreskin: 0.43, Tissue_stem_cells:BM_MSC:TGFb3: 0.43, Chondrocytes:MSC-derived: 0.43 |
| WK098-P9 | Tissue_stem_cells:BM_MSC:BMP2 | 0.20 | 285.09 | Raw ScoresFibroblasts:breast: 0.48, iPS_cells:adipose_stem_cells: 0.48, iPS_cells:CRL2097_foreskin: 0.47, Tissue_stem_cells:BM_MSC:TGFb3: 0.47, Chondrocytes:MSC-derived: 0.47, Smooth_muscle_cells:vascular:IL-17: 0.47, Tissue_stem_cells:BM_MSC:BMP2: 0.47, Smooth_muscle_cells:bronchial: 0.47, Osteoblasts: 0.47, Smooth_muscle_cells:vascular: 0.46 |
| WK098-B7 | Smooth_muscle_cells:bronchial | 0.20 | 281.53 | Raw ScoresFibroblasts:breast: 0.48, Osteoblasts: 0.47, Chondrocytes:MSC-derived: 0.47, Smooth_muscle_cells:bronchial: 0.47, Tissue_stem_cells:BM_MSC:TGFb3: 0.47, iPS_cells:adipose_stem_cells: 0.47, Smooth_muscle_cells:bronchial:vit_D: 0.47, iPS_cells:CRL2097_foreskin: 0.47, Tissue_stem_cells:BM_MSC:BMP2: 0.46, Tissue_stem_cells:iliac_MSC: 0.46 |
| WK098-L20 | Smooth_muscle_cells:bronchial | 0.18 | 279.52 | Raw ScoresFibroblasts:breast: 0.42, Smooth_muscle_cells:bronchial: 0.42, iPS_cells:CRL2097_foreskin: 0.42, iPS_cells:adipose_stem_cells: 0.42, Smooth_muscle_cells:bronchial:vit_D: 0.42, Osteoblasts: 0.42, Tissue_stem_cells:BM_MSC:TGFb3: 0.41, Smooth_muscle_cells:vascular:IL-17: 0.41, Chondrocytes:MSC-derived: 0.41, Tissue_stem_cells:BM_MSC:BMP2: 0.41 |
| WK098-D20 | Smooth_muscle_cells:bronchial | 0.21 | 271.33 | Raw ScoresFibroblasts:breast: 0.43, Smooth_muscle_cells:bronchial: 0.42, Smooth_muscle_cells:bronchial:vit_D: 0.42, Osteoblasts: 0.42, Smooth_muscle_cells:vascular: 0.41, Tissue_stem_cells:BM_MSC:BMP2: 0.41, iPS_cells:adipose_stem_cells: 0.41, iPS_cells:CRL2097_foreskin: 0.41, Tissue_stem_cells:BM_MSC:TGFb3: 0.41, Smooth_muscle_cells:vascular:IL-17: 0.41 |
| WK051-F13 | Smooth_muscle_cells:bronchial | 0.18 | 261.47 | Raw ScoresFibroblasts:breast: 0.42, iPS_cells:CRL2097_foreskin: 0.41, iPS_cells:adipose_stem_cells: 0.41, Chondrocytes:MSC-derived: 0.41, Smooth_muscle_cells:bronchial: 0.41, Osteoblasts: 0.41, Tissue_stem_cells:BM_MSC:TGFb3: 0.41, Smooth_muscle_cells:vascular:IL-17: 0.41, Smooth_muscle_cells:bronchial:vit_D: 0.41, Tissue_stem_cells:BM_MSC:BMP2: 0.4 |
| WK098-A12 | Tissue_stem_cells:BM_MSC:BMP2 | 0.17 | 261.46 | Raw ScoresFibroblasts:breast: 0.4, iPS_cells:adipose_stem_cells: 0.39, Chondrocytes:MSC-derived: 0.38, Tissue_stem_cells:BM_MSC:BMP2: 0.38, Smooth_muscle_cells:bronchial: 0.38, iPS_cells:CRL2097_foreskin: 0.38, Tissue_stem_cells:BM_MSC:TGFb3: 0.38, Osteoblasts: 0.38, Smooth_muscle_cells:vascular:IL-17: 0.38, Smooth_muscle_cells:bronchial:vit_D: 0.38 |
| WK098-H8 | Tissue_stem_cells:BM_MSC:BMP2 | 0.21 | 257.53 | Raw ScoresFibroblasts:breast: 0.5, iPS_cells:adipose_stem_cells: 0.48, Smooth_muscle_cells:vascular:IL-17: 0.48, Smooth_muscle_cells:vascular: 0.48, Smooth_muscle_cells:bronchial: 0.48, Osteoblasts: 0.48, iPS_cells:CRL2097_foreskin: 0.47, Tissue_stem_cells:BM_MSC:BMP2: 0.47, Smooth_muscle_cells:bronchial:vit_D: 0.47, Tissue_stem_cells:BM_MSC:TGFb3: 0.47 |
| WK050-I23 | iPS_cells:CRL2097_foreskin | 0.20 | 255.38 | Raw ScoresFibroblasts:breast: 0.42, iPS_cells:CRL2097_foreskin: 0.42, iPS_cells:adipose_stem_cells: 0.41, Tissue_stem_cells:BM_MSC:TGFb3: 0.41, Chondrocytes:MSC-derived: 0.41, Smooth_muscle_cells:bronchial: 0.41, Osteoblasts: 0.41, Smooth_muscle_cells:bronchial:vit_D: 0.4, Tissue_stem_cells:BM_MSC:BMP2: 0.4, Smooth_muscle_cells:vascular: 0.4 |
| WK024-H17 | Smooth_muscle_cells:bronchial | 0.21 | 253.18 | Raw ScoresFibroblasts:breast: 0.39, Smooth_muscle_cells:bronchial: 0.38, Smooth_muscle_cells:bronchial:vit_D: 0.38, iPS_cells:adipose_stem_cells: 0.37, Osteoblasts: 0.37, iPS_cells:CRL2097_foreskin: 0.37, Tissue_stem_cells:iliac_MSC: 0.36, Chondrocytes:MSC-derived: 0.36, Smooth_muscle_cells:vascular: 0.36, Tissue_stem_cells:BM_MSC:BMP2: 0.36 |
| WK059-C4 | Tissue_stem_cells:BM_MSC:BMP2 | 0.18 | 244.70 | Raw ScoresFibroblasts:breast: 0.43, iPS_cells:CRL2097_foreskin: 0.42, iPS_cells:adipose_stem_cells: 0.41, Smooth_muscle_cells:bronchial: 0.41, Tissue_stem_cells:BM_MSC:TGFb3: 0.41, Smooth_muscle_cells:bronchial:vit_D: 0.41, Smooth_muscle_cells:vascular:IL-17: 0.41, Smooth_muscle_cells:vascular: 0.41, Tissue_stem_cells:BM_MSC:BMP2: 0.41, Osteoblasts: 0.41 |
| WK098-O20 | iPS_cells:adipose_stem_cells | 0.20 | 241.22 | Raw ScoresFibroblasts:breast: 0.46, iPS_cells:adipose_stem_cells: 0.45, Osteoblasts: 0.45, iPS_cells:CRL2097_foreskin: 0.45, Smooth_muscle_cells:bronchial: 0.45, Chondrocytes:MSC-derived: 0.44, Tissue_stem_cells:BM_MSC:TGFb3: 0.44, Tissue_stem_cells:BM_MSC:BMP2: 0.44, Smooth_muscle_cells:vascular: 0.44, Smooth_muscle_cells:bronchial:vit_D: 0.44 |
| WK098-O9 | Tissue_stem_cells:BM_MSC:BMP2 | 0.17 | 238.80 | Raw ScoresSmooth_muscle_cells:bronchial: 0.39, Fibroblasts:breast: 0.39, Smooth_muscle_cells:bronchial:vit_D: 0.39, Tissue_stem_cells:BM_MSC:TGFb3: 0.39, Tissue_stem_cells:BM_MSC:BMP2: 0.38, Chondrocytes:MSC-derived: 0.38, iPS_cells:adipose_stem_cells: 0.38, Smooth_muscle_cells:vascular: 0.38, Smooth_muscle_cells:vascular:IL-17: 0.38, Osteoblasts: 0.38 |
| WK099-I5 | Tissue_stem_cells:BM_MSC:TGFb3 | 0.19 | 232.43 | Raw ScoresFibroblasts:breast: 0.41, Tissue_stem_cells:BM_MSC:TGFb3: 0.41, Smooth_muscle_cells:vascular:IL-17: 0.41, Smooth_muscle_cells:bronchial: 0.41, iPS_cells:adipose_stem_cells: 0.4, Osteoblasts: 0.4, Smooth_muscle_cells:bronchial:vit_D: 0.4, Tissue_stem_cells:BM_MSC:BMP2: 0.4, Smooth_muscle_cells:vascular: 0.4, Chondrocytes:MSC-derived: 0.4 |
| WK057-P14 | Chondrocytes:MSC-derived | 0.14 | 230.90 | Raw ScoresFibroblasts:breast: 0.41, Smooth_muscle_cells:bronchial: 0.41, iPS_cells:adipose_stem_cells: 0.41, Chondrocytes:MSC-derived: 0.4, Tissue_stem_cells:BM_MSC:TGFb3: 0.4, Osteoblasts: 0.4, Smooth_muscle_cells:bronchial:vit_D: 0.4, Tissue_stem_cells:BM_MSC:BMP2: 0.4, Smooth_muscle_cells:vascular:IL-17: 0.4, iPS_cells:CRL2097_foreskin: 0.4 |
| WK055-L21 | Smooth_muscle_cells:bronchial | 0.22 | 228.51 | Raw ScoresSmooth_muscle_cells:bronchial: 0.48, Fibroblasts:breast: 0.47, Smooth_muscle_cells:bronchial:vit_D: 0.47, iPS_cells:CRL2097_foreskin: 0.46, Tissue_stem_cells:BM_MSC:TGFb3: 0.46, iPS_cells:adipose_stem_cells: 0.46, Osteoblasts: 0.46, Chondrocytes:MSC-derived: 0.46, Tissue_stem_cells:BM_MSC:BMP2: 0.45, Smooth_muscle_cells:vascular: 0.45 |
| WK098-F3 | Smooth_muscle_cells:bronchial | 0.17 | 227.21 | Raw ScoresFibroblasts:breast: 0.43, iPS_cells:CRL2097_foreskin: 0.42, iPS_cells:adipose_stem_cells: 0.42, Smooth_muscle_cells:bronchial: 0.42, Chondrocytes:MSC-derived: 0.42, Osteoblasts: 0.42, Tissue_stem_cells:BM_MSC:TGFb3: 0.42, Tissue_stem_cells:BM_MSC:BMP2: 0.42, Smooth_muscle_cells:bronchial:vit_D: 0.41, Smooth_muscle_cells:vascular:IL-17: 0.41 |
| WK051-L13 | Smooth_muscle_cells:bronchial | 0.23 | 225.99 | Raw ScoresSmooth_muscle_cells:bronchial: 0.43, Fibroblasts:breast: 0.43, Smooth_muscle_cells:bronchial:vit_D: 0.43, Osteoblasts: 0.42, iPS_cells:adipose_stem_cells: 0.42, iPS_cells:CRL2097_foreskin: 0.42, Tissue_stem_cells:BM_MSC:BMP2: 0.41, Chondrocytes:MSC-derived: 0.41, Tissue_stem_cells:iliac_MSC: 0.41, Tissue_stem_cells:BM_MSC:TGFb3: 0.41 |
| KK059-G12 | Fibroblasts:breast | 0.21 | 218.04 | Raw ScoresFibroblasts:breast: 0.42, Smooth_muscle_cells:bronchial: 0.41, Smooth_muscle_cells:bronchial:vit_D: 0.41, iPS_cells:adipose_stem_cells: 0.4, Osteoblasts: 0.4, iPS_cells:CRL2097_foreskin: 0.4, Tissue_stem_cells:BM_MSC:TGFb3: 0.39, Chondrocytes:MSC-derived: 0.39, Tissue_stem_cells:BM_MSC:BMP2: 0.39, Smooth_muscle_cells:vascular: 0.39 |
| WK057-N16 | Chondrocytes:MSC-derived | 0.18 | 217.40 | Raw ScoresFibroblasts:breast: 0.39, Tissue_stem_cells:BM_MSC:TGFb3: 0.38, iPS_cells:adipose_stem_cells: 0.38, Smooth_muscle_cells:bronchial: 0.37, Chondrocytes:MSC-derived: 0.37, Osteoblasts: 0.37, Smooth_muscle_cells:bronchial:vit_D: 0.37, Tissue_stem_cells:BM_MSC:BMP2: 0.37, Smooth_muscle_cells:vascular: 0.37, iPS_cells:CRL2097_foreskin: 0.37 |
| WK049-K11 | Tissue_stem_cells:BM_MSC:TGFb3 | 0.19 | 217.03 | Raw ScoresFibroblasts:breast: 0.41, Osteoblasts: 0.41, iPS_cells:adipose_stem_cells: 0.4, Tissue_stem_cells:BM_MSC:TGFb3: 0.4, Tissue_stem_cells:BM_MSC:BMP2: 0.4, Smooth_muscle_cells:bronchial: 0.4, Chondrocytes:MSC-derived: 0.4, Smooth_muscle_cells:bronchial:vit_D: 0.4, iPS_cells:CRL2097_foreskin: 0.4, Smooth_muscle_cells:vascular: 0.39 |
Below shows the significant enrichments of this GEP for literature curated gene lists
This data was procured from existing single cell RNA-seq maps of neuroblastoma or related relevant data.
High ranks indicate this gene is a driver of this GEP.
These curated gene list are ranked by the P-value (on this GEP) of their constituent genes.
The Mean Count column shows the mean read count in cells scoring highly (H > 50) on this gene expression program.
Inflammatory CAF
These marker genes were curated across cancer subtypes in multiple organ systems as reviewed in Lavie et. al. (PMID 35883004) and contain inflammatory specific CAF genes:
Wilcoxon ranksum test P-value for gene set overrepresentation: 2.53e-08
Mean rank of genes in gene set: 2330.96
Rank on gene expression program of genes in gene set:
| Genes | Weight | Rank | GTEx | DepMap | Decartes | Mean.Counts | Mean.TPM |
|---|---|---|---|---|---|---|---|
| CXCL12 | 0.0071967 | 9 | GTEx | DepMap | Descartes | 7.22 | 512.89 |
| CXCL14 | 0.0067588 | 11 | GTEx | DepMap | Descartes | 6.35 | 768.41 |
| C3 | 0.0064624 | 15 | GTEx | DepMap | Descartes | 11.62 | 538.36 |
| SERPING1 | 0.0056916 | 23 | GTEx | DepMap | Descartes | 9.59 | 1039.91 |
| C7 | 0.0040511 | 67 | GTEx | DepMap | Descartes | 16.73 | 715.41 |
| CFD | 0.0032353 | 113 | GTEx | DepMap | Descartes | 2.41 | 452.51 |
| PDGFRA | 0.0031669 | 125 | GTEx | DepMap | Descartes | 1.96 | 68.71 |
| IGFBP6 | 0.0030966 | 131 | GTEx | DepMap | Descartes | 1.46 | 307.28 |
| IGF1 | 0.0028328 | 160 | GTEx | DepMap | Descartes | 5.35 | 159.16 |
| SCARA5 | 0.0025372 | 210 | GTEx | DepMap | Descartes | 1.31 | 73.35 |
| PDGFRB | 0.0023172 | 248 | GTEx | DepMap | Descartes | 3.57 | 156.94 |
| GPX3 | 0.0019957 | 326 | GTEx | DepMap | Descartes | 1.31 | 149.37 |
| SCARA3 | 0.0019719 | 332 | GTEx | DepMap | Descartes | 1.10 | 82.59 |
| IL33 | 0.0018552 | 360 | GTEx | DepMap | Descartes | 0.86 | 74.20 |
| PDGFD | 0.0018315 | 365 | GTEx | DepMap | Descartes | 0.78 | 41.69 |
| CFB | 0.0013778 | 546 | GTEx | DepMap | Descartes | 0.13 | 11.18 |
| RGMA | 0.0009366 | 889 | GTEx | DepMap | Descartes | 0.18 | 4.35 |
| PDPN | 0.0005350 | 1574 | GTEx | DepMap | Descartes | 0.90 | 61.07 |
| HGF | 0.0002968 | 2385 | GTEx | DepMap | Descartes | 0.90 | 37.74 |
| CCL2 | 0.0002213 | 2785 | GTEx | DepMap | Descartes | 38.68 | 10116.56 |
| IL1R1 | -0.0001910 | 6903 | GTEx | DepMap | Descartes | 2.30 | 93.94 |
| IL10 | -0.0002410 | 7527 | GTEx | DepMap | Descartes | 0.11 | 7.07 |
| CXCL2 | -0.0004715 | 9713 | GTEx | DepMap | Descartes | 16.83 | 2991.34 |
| SOD2 | -0.0006587 | 10909 | GTEx | DepMap | Descartes | 11.72 | 188.22 |
| LIF | -0.0030221 | 12548 | GTEx | DepMap | Descartes | 5.77 | 316.96 |
Mesenchymal Fig 1D (Olsen)
Selected mesenchymal marker genes shown in Fig. 1D of Olsen et al. https://www.biorxiv.org/content/10.1101/2020.05.04.077057v1 - these are highly expressed in their mesenchymal cluster on their UMAP.:
Wilcoxon ranksum test P-value for gene set overrepresentation: 2.95e-08
Mean rank of genes in gene set: 830.08
Rank on gene expression program of genes in gene set:
| Genes | Weight | Rank | GTEx | DepMap | Decartes | Mean.Counts | Mean.TPM |
|---|---|---|---|---|---|---|---|
| DCN | 0.0068289 | 10 | GTEx | DepMap | Descartes | 63.72 | 2280.75 |
| LUM | 0.0051221 | 34 | GTEx | DepMap | Descartes | 43.64 | 3921.44 |
| CALD1 | 0.0038248 | 71 | GTEx | DepMap | Descartes | 9.20 | 431.92 |
| PDGFRA | 0.0031669 | 125 | GTEx | DepMap | Descartes | 1.96 | 68.71 |
| LEPR | 0.0030396 | 134 | GTEx | DepMap | Descartes | 0.47 | 15.37 |
| COL6A2 | 0.0026571 | 192 | GTEx | DepMap | Descartes | 12.45 | 826.58 |
| PRRX1 | 0.0023775 | 239 | GTEx | DepMap | Descartes | 2.87 | 172.11 |
| MGP | 0.0022006 | 276 | GTEx | DepMap | Descartes | 35.89 | 4459.42 |
| BGN | 0.0014794 | 489 | GTEx | DepMap | Descartes | 13.85 | 1162.67 |
| COL1A2 | 0.0014207 | 513 | GTEx | DepMap | Descartes | 63.62 | 1912.19 |
| COL3A1 | 0.0011364 | 699 | GTEx | DepMap | Descartes | 67.48 | 2181.32 |
| COL1A1 | 0.0007252 | 1167 | GTEx | DepMap | Descartes | 144.60 | 4094.47 |
| SPARC | -0.0001859 | 6842 | GTEx | DepMap | Descartes | 48.46 | 2406.20 |
Bridge region mesencchymal (Olsen)
Marker genes shown in Fig. 3A of Olsen et al. https://www.biorxiv.org/content/10.1101/2020.05.04.077057v1 - Cells were ordered by pseudotime in the bridge region, this first group of cells were from the mesenchymal part of the trajectory.:
Wilcoxon ranksum test P-value for gene set overrepresentation: 1.82e-07
Mean rank of genes in gene set: 1166.77
Rank on gene expression program of genes in gene set:
| Genes | Weight | Rank | GTEx | DepMap | Decartes | Mean.Counts | Mean.TPM |
|---|---|---|---|---|---|---|---|
| KLF4 | 0.0063517 | 16 | GTEx | DepMap | Descartes | 6.55 | 587.08 |
| LUM | 0.0051221 | 34 | GTEx | DepMap | Descartes | 43.64 | 3921.44 |
| CALD1 | 0.0038248 | 71 | GTEx | DepMap | Descartes | 9.20 | 431.92 |
| PDGFRA | 0.0031669 | 125 | GTEx | DepMap | Descartes | 1.96 | 68.71 |
| MYC | 0.0027472 | 175 | GTEx | DepMap | Descartes | 3.02 | 198.70 |
| PRRX1 | 0.0023775 | 239 | GTEx | DepMap | Descartes | 2.87 | 172.11 |
| MAFF | 0.0018385 | 363 | GTEx | DepMap | Descartes | 5.57 | 434.54 |
| BGN | 0.0014794 | 489 | GTEx | DepMap | Descartes | 13.85 | 1162.67 |
| COL1A2 | 0.0014207 | 513 | GTEx | DepMap | Descartes | 63.62 | 1912.19 |
| FGF1 | 0.0003768 | 2072 | GTEx | DepMap | Descartes | 0.14 | 7.66 |
| PODXL | 0.0001105 | 3510 | GTEx | DepMap | Descartes | 0.16 | 5.36 |
| TNNT2 | 0.0001074 | 3541 | GTEx | DepMap | Descartes | 0.02 | 2.14 |
| NPNT | 0.0000507 | 4020 | GTEx | DepMap | Descartes | 0.14 | 6.22 |
Below shows ranks on this GEP for literature curated gene lists for large gene sets
These include those reported as mesenchymal/adrenergic by Van Groningen et al.
High ranks indicate this gene is a driver of this GEP (note these results are not ordered).
The Mean Count column shows the mean read count in cells scoring highly (H > 50) on this gene expression program.
VanGroningen Adrenergic Genes
Adrenergic marker genes from Supplementary Table 2 of Van Groningen et al. Nature Genetics 2017. These genes were identified by differential expression analysis of mesenchymal-like and adrenergic-like neuroblastoma cell lines.
Wilcoxon ranksum test P-value for gene set overrepresentation: 1.00e+00
Mean rank of genes in gene set: 9276.15
Median rank of genes in gene set: 10592
Rank on gene expression program of top 30 genes in gene set:
| Genes | Weight | Rank | GTEx | DepMap | Descartes | Mean.Counts | Mean.TPM |
|---|---|---|---|---|---|---|---|
| SLIT3 | 0.0040892 | 65 | GTEx | DepMap | Descartes | 4.61 | 110.80 |
| RBMS3 | 0.0035437 | 82 | GTEx | DepMap | Descartes | 2.96 | 92.05 |
| SYNPO2 | 0.0022831 | 256 | GTEx | DepMap | Descartes | 1.62 | 28.82 |
| CYGB | 0.0021995 | 277 | GTEx | DepMap | Descartes | 1.98 | 237.06 |
| ANK2 | 0.0017972 | 374 | GTEx | DepMap | Descartes | 1.17 | 20.12 |
| TUBB4B | 0.0014684 | 492 | GTEx | DepMap | Descartes | 3.46 | 425.44 |
| NFIL3 | 0.0012655 | 611 | GTEx | DepMap | Descartes | 2.53 | 289.62 |
| FOXO3 | 0.0011507 | 688 | GTEx | DepMap | Descartes | 4.00 | 135.43 |
| HEY1 | 0.0010927 | 732 | GTEx | DepMap | Descartes | 0.38 | 20.36 |
| H1FX | 0.0009695 | 844 | GTEx | DepMap | Descartes | 2.08 | NA |
| SETD7 | 0.0009384 | 885 | GTEx | DepMap | Descartes | 0.95 | 28.74 |
| RNF144A | 0.0008649 | 979 | GTEx | DepMap | Descartes | 0.45 | 16.30 |
| DPYSL2 | 0.0007871 | 1077 | GTEx | DepMap | Descartes | 2.00 | 96.49 |
| RNF150 | 0.0007014 | 1202 | GTEx | DepMap | Descartes | 0.44 | 9.46 |
| BMP7 | 0.0006880 | 1223 | GTEx | DepMap | Descartes | 0.38 | 24.80 |
| CETN3 | 0.0006709 | 1260 | GTEx | DepMap | Descartes | 0.15 | 14.54 |
| NANOS1 | 0.0006708 | 1261 | GTEx | DepMap | Descartes | 0.13 | 10.29 |
| ATL1 | 0.0006371 | 1326 | GTEx | DepMap | Descartes | 0.18 | 9.24 |
| OLFM1 | 0.0006013 | 1394 | GTEx | DepMap | Descartes | 0.29 | 32.46 |
| SHC3 | 0.0004884 | 1698 | GTEx | DepMap | Descartes | 0.05 | 0.88 |
| NET1 | 0.0004582 | 1796 | GTEx | DepMap | Descartes | 0.62 | 40.74 |
| RBP1 | 0.0003943 | 2005 | GTEx | DepMap | Descartes | 0.55 | 65.09 |
| TIAM1 | 0.0003930 | 2009 | GTEx | DepMap | Descartes | 1.29 | 43.53 |
| PHPT1 | 0.0003638 | 2115 | GTEx | DepMap | Descartes | 0.51 | 89.78 |
| IRS2 | 0.0003300 | 2247 | GTEx | DepMap | Descartes | 2.08 | 57.16 |
| MAGI3 | 0.0002905 | 2417 | GTEx | DepMap | Descartes | 0.31 | 11.08 |
| CCSAP | 0.0002773 | 2484 | GTEx | DepMap | Descartes | 0.16 | NA |
| STRA6 | 0.0002686 | 2530 | GTEx | DepMap | Descartes | 0.06 | 5.51 |
| TBPL1 | 0.0002649 | 2544 | GTEx | DepMap | Descartes | 0.36 | 20.46 |
| CDKN2C | 0.0002625 | 2563 | GTEx | DepMap | Descartes | 0.33 | 27.02 |
VanGroningen Mesenchymal Genes
Mesenchymal marker genes from Supplementary Table 2 of Van Groningen et al. Nature Genetics 2017. These genes were identified by differential expression analysis of mesenchymal-like and adrenergic-like neuroblastoma cell lines.
Wilcoxon ranksum test P-value for gene set overrepresentation: 4.53e-69
Mean rank of genes in gene set: 3284.01
Median rank of genes in gene set: 1421
Rank on gene expression program of top 30 genes in gene set:
| Genes | Weight | Rank | GTEx | DepMap | Descartes | Mean.Counts | Mean.TPM |
|---|---|---|---|---|---|---|---|
| EGR1 | 0.0102998 | 1 | GTEx | DepMap | Descartes | 29.86 | 2764.73 |
| CXCL12 | 0.0071967 | 9 | GTEx | DepMap | Descartes | 7.22 | 512.89 |
| KLF4 | 0.0063517 | 16 | GTEx | DepMap | Descartes | 6.55 | 587.08 |
| SRPX | 0.0061159 | 18 | GTEx | DepMap | Descartes | 6.30 | 827.74 |
| KLF10 | 0.0059414 | 20 | GTEx | DepMap | Descartes | 3.30 | 245.51 |
| ID3 | 0.0058742 | 21 | GTEx | DepMap | Descartes | 4.97 | 1434.62 |
| HES1 | 0.0055971 | 24 | GTEx | DepMap | Descartes | 5.71 | 899.34 |
| FSTL1 | 0.0055601 | 25 | GTEx | DepMap | Descartes | 10.30 | 404.32 |
| CFH | 0.0052661 | 30 | GTEx | DepMap | Descartes | 9.17 | 346.84 |
| NFIA | 0.0048658 | 36 | GTEx | DepMap | Descartes | 4.64 | 25.17 |
| CYBRD1 | 0.0046649 | 39 | GTEx | DepMap | Descartes | 3.91 | 228.90 |
| MEOX2 | 0.0046548 | 40 | GTEx | DepMap | Descartes | 0.43 | 52.00 |
| FLRT2 | 0.0046155 | 41 | GTEx | DepMap | Descartes | 1.85 | 15.21 |
| EGR3 | 0.0045033 | 48 | GTEx | DepMap | Descartes | 5.78 | 367.41 |
| ZFP36L1 | 0.0044020 | 50 | GTEx | DepMap | Descartes | 24.52 | 1984.40 |
| EGFR | 0.0042225 | 57 | GTEx | DepMap | Descartes | 4.67 | 136.49 |
| OLFML2B | 0.0041776 | 59 | GTEx | DepMap | Descartes | 6.53 | 492.94 |
| GSN | 0.0041573 | 60 | GTEx | DepMap | Descartes | 17.87 | 767.87 |
| NID1 | 0.0040997 | 63 | GTEx | DepMap | Descartes | 4.82 | 192.66 |
| SOX9 | 0.0040791 | 66 | GTEx | DepMap | Descartes | 1.62 | 134.52 |
| ID1 | 0.0038417 | 70 | GTEx | DepMap | Descartes | 2.00 | 488.72 |
| CALD1 | 0.0038248 | 71 | GTEx | DepMap | Descartes | 9.20 | 431.92 |
| SPRY4 | 0.0037780 | 73 | GTEx | DepMap | Descartes | 2.94 | 135.95 |
| MEST | 0.0035659 | 80 | GTEx | DepMap | Descartes | 2.99 | 262.64 |
| FMOD | 0.0034812 | 90 | GTEx | DepMap | Descartes | 1.42 | 100.12 |
| LAMB1 | 0.0034596 | 92 | GTEx | DepMap | Descartes | 5.07 | 203.37 |
| VIM | 0.0034136 | 96 | GTEx | DepMap | Descartes | 50.84 | 4858.02 |
| CFI | 0.0033299 | 105 | GTEx | DepMap | Descartes | 1.61 | 151.65 |
| CAPN6 | 0.0033275 | 107 | GTEx | DepMap | Descartes | 2.03 | 140.41 |
| ITM2B | 0.0033086 | 108 | GTEx | DepMap | Descartes | 18.57 | 426.24 |
Descartes adrenocortical markers
Top 50 marker genes of adrenocortical cells in the Decartes fetal adrenal single cell map (https://atlas.brotmanbaty.org/bbi/human-gene-expression-during-development/cell/adrenocortical/in/adrenal)
Wilcoxon ranksum test P-value for gene set overrepresentation: 5.32e-01
Mean rank of genes in gene set: 6323.47
Median rank of genes in gene set: 7119.5
Rank on gene expression program of top 30 genes in gene set:
| Genes | Weight | Rank | GTEx | DepMap | Descartes | Mean.Counts | Mean.TPM |
|---|---|---|---|---|---|---|---|
| CLU | 0.0020717 | 304 | GTEx | DepMap | Descartes | 4.31 | 401.05 |
| LDLR | 0.0011375 | 697 | GTEx | DepMap | Descartes | 2.61 | 116.77 |
| SH3BP5 | 0.0008965 | 944 | GTEx | DepMap | Descartes | 1.88 | 128.34 |
| SH3PXD2B | 0.0007502 | 1127 | GTEx | DepMap | Descartes | 0.46 | 13.52 |
| PDE10A | 0.0007230 | 1174 | GTEx | DepMap | Descartes | 0.23 | 6.70 |
| SLC16A9 | 0.0006132 | 1367 | GTEx | DepMap | Descartes | 0.10 | 8.31 |
| HMGCS1 | 0.0005705 | 1465 | GTEx | DepMap | Descartes | 1.35 | 66.21 |
| PAPSS2 | 0.0005030 | 1665 | GTEx | DepMap | Descartes | 0.68 | 38.35 |
| FDXR | 0.0003358 | 2225 | GTEx | DepMap | Descartes | 0.07 | 7.66 |
| GSTA4 | 0.0001981 | 2918 | GTEx | DepMap | Descartes | 0.32 | 42.03 |
| DHCR24 | 0.0000644 | 3898 | GTEx | DepMap | Descartes | 0.26 | 10.04 |
| POR | 0.0000522 | 4013 | GTEx | DepMap | Descartes | 0.77 | 68.59 |
| SGCZ | 0.0000326 | 4190 | GTEx | DepMap | Descartes | 0.00 | 0.00 |
| SCARB1 | -0.0000683 | 5336 | GTEx | DepMap | Descartes | 0.16 | 6.52 |
| FDPS | -0.0000729 | 5397 | GTEx | DepMap | Descartes | 0.59 | 62.40 |
| IGF1R | -0.0001003 | 5762 | GTEx | DepMap | Descartes | 0.55 | 9.88 |
| SCAP | -0.0001520 | 6439 | GTEx | DepMap | Descartes | 0.25 | 13.98 |
| STAR | -0.0002028 | 7067 | GTEx | DepMap | Descartes | 0.01 | 0.58 |
| INHA | -0.0002110 | 7172 | GTEx | DepMap | Descartes | 0.00 | 0.00 |
| BAIAP2L1 | -0.0002250 | 7343 | GTEx | DepMap | Descartes | 0.00 | 0.00 |
| FDX1 | -0.0002425 | 7544 | GTEx | DepMap | Descartes | 0.27 | 19.54 |
| APOC1 | -0.0002984 | 8160 | GTEx | DepMap | Descartes | 0.69 | 171.83 |
| TM7SF2 | -0.0003071 | 8244 | GTEx | DepMap | Descartes | 0.03 | 2.42 |
| ERN1 | -0.0003177 | 8353 | GTEx | DepMap | Descartes | 0.52 | 14.12 |
| CYB5B | -0.0003251 | 8426 | GTEx | DepMap | Descartes | 0.46 | 24.36 |
| HMGCR | -0.0004154 | 9261 | GTEx | DepMap | Descartes | 1.04 | 55.79 |
| SLC1A2 | -0.0004294 | 9387 | GTEx | DepMap | Descartes | 0.10 | 1.90 |
| MSMO1 | -0.0004324 | 9418 | GTEx | DepMap | Descartes | 0.50 | 50.53 |
| FREM2 | -0.0004620 | 9648 | GTEx | DepMap | Descartes | 0.00 | 0.01 |
| DNER | -0.0006792 | 11013 | GTEx | DepMap | Descartes | 0.07 | 4.54 |
Descartes chromaffin markers
Top 50 marker genes of chromaffin cells in the Decartes fetal adrenal single cell map (https://atlas.brotmanbaty.org/bbi/human-gene-expression-during-development/cell/chromaffin/in/adrenal)
Wilcoxon ranksum test P-value for gene set overrepresentation: 1.00e+00
Mean rank of genes in gene set: 9380.61
Median rank of genes in gene set: 10333
Rank on gene expression program of top 30 genes in gene set:
| Genes | Weight | Rank | GTEx | DepMap | Descartes | Mean.Counts | Mean.TPM |
|---|---|---|---|---|---|---|---|
| SYNPO2 | 0.0022831 | 256 | GTEx | DepMap | Descartes | 1.62 | 28.82 |
| PLXNA4 | 0.0003082 | 2339 | GTEx | DepMap | Descartes | 0.06 | 1.01 |
| TUBB2A | 0.0001059 | 3558 | GTEx | DepMap | Descartes | 1.97 | 278.20 |
| ANKFN1 | 0.0000353 | 4175 | GTEx | DepMap | Descartes | 0.00 | 0.00 |
| EPHA6 | -0.0001199 | 6026 | GTEx | DepMap | Descartes | 0.00 | 0.05 |
| TUBA1A | -0.0001326 | 6187 | GTEx | DepMap | Descartes | 7.86 | 975.83 |
| TMEFF2 | -0.0001456 | 6348 | GTEx | DepMap | Descartes | 0.01 | 0.71 |
| TMEM132C | -0.0001666 | 6619 | GTEx | DepMap | Descartes | 0.07 | 4.27 |
| CNTFR | -0.0001836 | 6812 | GTEx | DepMap | Descartes | 0.06 | 5.02 |
| RGMB | -0.0002012 | 7048 | GTEx | DepMap | Descartes | 0.70 | 31.99 |
| GAL | -0.0002607 | 7773 | GTEx | DepMap | Descartes | 0.10 | 18.31 |
| KCNB2 | -0.0003190 | 8368 | GTEx | DepMap | Descartes | 0.01 | 0.20 |
| EYA4 | -0.0003357 | 8528 | GTEx | DepMap | Descartes | 0.01 | 0.51 |
| IL7 | -0.0003443 | 8609 | GTEx | DepMap | Descartes | 0.02 | 1.91 |
| CNKSR2 | -0.0003661 | 8824 | GTEx | DepMap | Descartes | 0.09 | 2.95 |
| FAT3 | -0.0003734 | 8898 | GTEx | DepMap | Descartes | 0.03 | 0.20 |
| ALK | -0.0004183 | 9292 | GTEx | DepMap | Descartes | 0.02 | 0.86 |
| SLC44A5 | -0.0004917 | 9875 | GTEx | DepMap | Descartes | 0.01 | 0.52 |
| HS3ST5 | -0.0005140 | 10024 | GTEx | DepMap | Descartes | 0.01 | 0.90 |
| RPH3A | -0.0005421 | 10232 | GTEx | DepMap | Descartes | 0.01 | 0.27 |
| EYA1 | -0.0005591 | 10333 | GTEx | DepMap | Descartes | 0.01 | 0.22 |
| NTRK1 | -0.0005622 | 10356 | GTEx | DepMap | Descartes | 0.01 | 0.53 |
| RBFOX1 | -0.0006216 | 10723 | GTEx | DepMap | Descartes | 0.01 | 0.27 |
| PTCHD1 | -0.0006549 | 10887 | GTEx | DepMap | Descartes | 0.01 | 0.20 |
| RYR2 | -0.0006644 | 10936 | GTEx | DepMap | Descartes | 0.04 | 0.36 |
| MAB21L2 | -0.0006755 | 10987 | GTEx | DepMap | Descartes | 0.14 | 5.79 |
| REEP1 | -0.0007464 | 11295 | GTEx | DepMap | Descartes | 0.04 | 1.34 |
| MAB21L1 | -0.0008710 | 11727 | GTEx | DepMap | Descartes | 0.08 | 9.05 |
| ELAVL2 | -0.0008952 | 11789 | GTEx | DepMap | Descartes | 0.04 | 0.61 |
| GREM1 | -0.0009131 | 11832 | GTEx | DepMap | Descartes | 0.99 | 10.42 |
Descartes Vascular_endothelial markers
Top 50 marker genes of Vascular_endothelial cells in the Decartes fetal adrenal single cell map (https://atlas.brotmanbaty.org/bbi/human-gene-expression-during-development/cell/vascular_endothelial/in/adrenal)
Wilcoxon ranksum test P-value for gene set overrepresentation: 3.05e-03
Mean rank of genes in gene set: 4665.76
Median rank of genes in gene set: 3857
Rank on gene expression program of top 30 genes in gene set:
| Genes | Weight | Rank | GTEx | DepMap | Descartes | Mean.Counts | Mean.TPM |
|---|---|---|---|---|---|---|---|
| ID1 | 0.0038417 | 70 | GTEx | DepMap | Descartes | 2.00 | 488.72 |
| CYP26B1 | 0.0025247 | 213 | GTEx | DepMap | Descartes | 0.80 | 54.21 |
| RAMP2 | 0.0005727 | 1457 | GTEx | DepMap | Descartes | 0.29 | 66.49 |
| HYAL2 | 0.0005620 | 1492 | GTEx | DepMap | Descartes | 0.21 | 11.38 |
| ARHGAP29 | 0.0004731 | 1754 | GTEx | DepMap | Descartes | 0.55 | 14.41 |
| SHE | 0.0004230 | 1902 | GTEx | DepMap | Descartes | 0.14 | 5.19 |
| F8 | 0.0003782 | 2067 | GTEx | DepMap | Descartes | 0.09 | 2.28 |
| KANK3 | 0.0003418 | 2202 | GTEx | DepMap | Descartes | 0.08 | 5.71 |
| MMRN2 | 0.0003325 | 2234 | GTEx | DepMap | Descartes | 0.20 | 8.88 |
| TEK | 0.0003262 | 2261 | GTEx | DepMap | Descartes | 0.07 | 2.76 |
| CLDN5 | 0.0003103 | 2324 | GTEx | DepMap | Descartes | 0.14 | 13.47 |
| FLT4 | 0.0002420 | 2671 | GTEx | DepMap | Descartes | 0.05 | 1.59 |
| IRX3 | 0.0002381 | 2698 | GTEx | DepMap | Descartes | 0.13 | 8.91 |
| TMEM88 | 0.0002085 | 2856 | GTEx | DepMap | Descartes | 0.42 | 100.61 |
| CDH5 | 0.0001823 | 3027 | GTEx | DepMap | Descartes | 0.16 | 7.55 |
| NPR1 | 0.0001808 | 3037 | GTEx | DepMap | Descartes | 0.05 | 2.29 |
| GALNT15 | 0.0001451 | 3262 | GTEx | DepMap | Descartes | 0.07 | NA |
| PODXL | 0.0001105 | 3510 | GTEx | DepMap | Descartes | 0.16 | 5.36 |
| EFNB2 | 0.0000824 | 3745 | GTEx | DepMap | Descartes | 1.32 | 61.06 |
| NR5A2 | 0.0000561 | 3969 | GTEx | DepMap | Descartes | 0.01 | 0.26 |
| NOTCH4 | 0.0000357 | 4172 | GTEx | DepMap | Descartes | 0.11 | 3.71 |
| SLCO2A1 | 0.0000286 | 4222 | GTEx | DepMap | Descartes | 0.22 | 9.35 |
| RASIP1 | 0.0000197 | 4309 | GTEx | DepMap | Descartes | 0.08 | 5.90 |
| TIE1 | 0.0000002 | 4517 | GTEx | DepMap | Descartes | 0.23 | 9.53 |
| CHRM3 | -0.0000410 | 4985 | GTEx | DepMap | Descartes | 0.02 | 0.67 |
| EHD3 | -0.0000542 | 5142 | GTEx | DepMap | Descartes | 0.13 | 6.11 |
| CRHBP | -0.0001264 | 6108 | GTEx | DepMap | Descartes | 0.00 | 0.09 |
| BTNL9 | -0.0001349 | 6217 | GTEx | DepMap | Descartes | 0.04 | 1.69 |
| CEACAM1 | -0.0001387 | 6269 | GTEx | DepMap | Descartes | 0.04 | 2.63 |
| MYRIP | -0.0002480 | 7622 | GTEx | DepMap | Descartes | 0.02 | 0.67 |
Descartes stromal markers
Top 50 marker genes of stromal cells in the Decartes fetal adrenal single cell map (https://atlas.brotmanbaty.org/bbi/human-gene-expression-during-development/cell/stromal/in/adrenal)
Wilcoxon ranksum test P-value for gene set overrepresentation: 1.07e-20
Mean rank of genes in gene set: 1229.3
Median rank of genes in gene set: 508.5
Rank on gene expression program of top 30 genes in gene set:
| Genes | Weight | Rank | GTEx | DepMap | Descartes | Mean.Counts | Mean.TPM |
|---|---|---|---|---|---|---|---|
| DCN | 0.0068289 | 10 | GTEx | DepMap | Descartes | 63.72 | 2280.75 |
| LUM | 0.0051221 | 34 | GTEx | DepMap | Descartes | 43.64 | 3921.44 |
| OGN | 0.0042847 | 52 | GTEx | DepMap | Descartes | 6.21 | 492.34 |
| ABCA6 | 0.0042319 | 55 | GTEx | DepMap | Descartes | 1.32 | 42.51 |
| C7 | 0.0040511 | 67 | GTEx | DepMap | Descartes | 16.73 | 715.41 |
| PCOLCE | 0.0037558 | 75 | GTEx | DepMap | Descartes | 6.65 | 988.53 |
| ISLR | 0.0035724 | 79 | GTEx | DepMap | Descartes | 4.59 | 452.24 |
| BICC1 | 0.0035299 | 85 | GTEx | DepMap | Descartes | 1.39 | 56.36 |
| CDH11 | 0.0032008 | 119 | GTEx | DepMap | Descartes | 2.26 | 68.88 |
| PDGFRA | 0.0031669 | 125 | GTEx | DepMap | Descartes | 1.96 | 68.71 |
| PAMR1 | 0.0031516 | 127 | GTEx | DepMap | Descartes | 2.07 | 137.02 |
| CCDC80 | 0.0026585 | 191 | GTEx | DepMap | Descartes | 13.97 | 233.58 |
| SCARA5 | 0.0025372 | 210 | GTEx | DepMap | Descartes | 1.31 | 73.35 |
| PRRX1 | 0.0023775 | 239 | GTEx | DepMap | Descartes | 2.87 | 172.11 |
| CD248 | 0.0022977 | 251 | GTEx | DepMap | Descartes | 0.99 | 86.16 |
| MGP | 0.0022006 | 276 | GTEx | DepMap | Descartes | 35.89 | 4459.42 |
| PCDH18 | 0.0021449 | 289 | GTEx | DepMap | Descartes | 0.61 | 24.52 |
| PRICKLE1 | 0.0020687 | 306 | GTEx | DepMap | Descartes | 0.63 | 25.64 |
| COL6A3 | 0.0018416 | 362 | GTEx | DepMap | Descartes | 10.06 | 206.04 |
| ADAMTSL3 | 0.0017915 | 377 | GTEx | DepMap | Descartes | 0.43 | 13.94 |
| HHIP | 0.0015997 | 443 | GTEx | DepMap | Descartes | 0.16 | 3.38 |
| ABCC9 | 0.0014291 | 508 | GTEx | DepMap | Descartes | 0.59 | 16.35 |
| LOX | 0.0014283 | 509 | GTEx | DepMap | Descartes | 1.14 | 45.27 |
| COL1A2 | 0.0014207 | 513 | GTEx | DepMap | Descartes | 63.62 | 1912.19 |
| FREM1 | 0.0013960 | 527 | GTEx | DepMap | Descartes | 0.30 | 7.36 |
| CLDN11 | 0.0012847 | 599 | GTEx | DepMap | Descartes | 0.39 | 24.62 |
| COL3A1 | 0.0011364 | 699 | GTEx | DepMap | Descartes | 67.48 | 2181.32 |
| LRRC17 | 0.0011050 | 722 | GTEx | DepMap | Descartes | 0.34 | 39.26 |
| ELN | 0.0010132 | 806 | GTEx | DepMap | Descartes | 2.77 | 112.05 |
| IGFBP3 | 0.0009672 | 846 | GTEx | DepMap | Descartes | 1.51 | 135.79 |
Descartes sympathoblasts markers
Top 50 marker genes of sympathoblasts cells in the Decartes fetal adrenal single cell map (https://atlas.brotmanbaty.org/bbi/human-gene-expression-during-development/cell/sympathoblasts/in/adrenal)
Wilcoxon ranksum test P-value for gene set overrepresentation: 9.70e-01
Mean rank of genes in gene set: 7377.18
Median rank of genes in gene set: 7341
Rank on gene expression program of top 30 genes in gene set:
| Genes | Weight | Rank | GTEx | DepMap | Descartes | Mean.Counts | Mean.TPM |
|---|---|---|---|---|---|---|---|
| CNTN3 | 0.0008228 | 1036 | GTEx | DepMap | Descartes | 0.15 | 9.67 |
| LAMA3 | 0.0006007 | 1396 | GTEx | DepMap | Descartes | 0.17 | 3.09 |
| TIAM1 | 0.0003930 | 2009 | GTEx | DepMap | Descartes | 1.29 | 43.53 |
| ROBO1 | 0.0002971 | 2383 | GTEx | DepMap | Descartes | 0.37 | 11.80 |
| GRM7 | 0.0000599 | 3933 | GTEx | DepMap | Descartes | 0.02 | 1.53 |
| ARC | 0.0000318 | 4195 | GTEx | DepMap | Descartes | 1.76 | 123.44 |
| SLC24A2 | 0.0000105 | 4406 | GTEx | DepMap | Descartes | 0.01 | 0.12 |
| GRID2 | -0.0000367 | 4930 | GTEx | DepMap | Descartes | 0.01 | 0.09 |
| FGF14 | -0.0000545 | 5145 | GTEx | DepMap | Descartes | 0.04 | 0.59 |
| GALNTL6 | -0.0000612 | 5232 | GTEx | DepMap | Descartes | 0.00 | 0.00 |
| PENK | -0.0000817 | 5507 | GTEx | DepMap | Descartes | 0.18 | 37.56 |
| SPOCK3 | -0.0001031 | 5794 | GTEx | DepMap | Descartes | 0.00 | 0.00 |
| PACRG | -0.0001209 | 6038 | GTEx | DepMap | Descartes | 0.01 | 1.59 |
| HTATSF1 | -0.0001620 | 6557 | GTEx | DepMap | Descartes | 0.53 | 43.11 |
| CDH12 | -0.0001655 | 6602 | GTEx | DepMap | Descartes | 0.00 | 0.00 |
| CDH18 | -0.0001675 | 6628 | GTEx | DepMap | Descartes | 0.01 | 0.49 |
| TENM1 | -0.0001679 | 6637 | GTEx | DepMap | Descartes | 0.04 | NA |
| SORCS3 | -0.0002067 | 7117 | GTEx | DepMap | Descartes | 0.00 | 0.05 |
| ST18 | -0.0002169 | 7251 | GTEx | DepMap | Descartes | 0.00 | 0.08 |
| SLC35F3 | -0.0002327 | 7431 | GTEx | DepMap | Descartes | 0.00 | 0.14 |
| TBX20 | -0.0002358 | 7476 | GTEx | DepMap | Descartes | 0.00 | 0.00 |
| NTNG1 | -0.0002467 | 7605 | GTEx | DepMap | Descartes | 0.03 | 0.92 |
| AGBL4 | -0.0002546 | 7706 | GTEx | DepMap | Descartes | 0.00 | 0.12 |
| KSR2 | -0.0002751 | 7928 | GTEx | DepMap | Descartes | 0.01 | 0.08 |
| CCSER1 | -0.0002881 | 8066 | GTEx | DepMap | Descartes | 0.01 | NA |
| MGAT4C | -0.0003096 | 8282 | GTEx | DepMap | Descartes | 0.02 | 0.16 |
| PCSK2 | -0.0004277 | 9367 | GTEx | DepMap | Descartes | 0.03 | 1.29 |
| FAM155A | -0.0004645 | 9663 | GTEx | DepMap | Descartes | 0.12 | 2.11 |
| EML6 | -0.0004809 | 9788 | GTEx | DepMap | Descartes | 0.03 | 0.55 |
| KCTD16 | -0.0004815 | 9793 | GTEx | DepMap | Descartes | 0.02 | 0.22 |
Descartes erythroblasts markers
Top 50 marker genes of erythroblasts cells in the Decartes fetal adrenal single cell map (https://atlas.brotmanbaty.org/bbi/human-gene-expression-during-development/cell/erythroblasts/in/adrenal)
Wilcoxon ranksum test P-value for gene set overrepresentation: 6.23e-01
Mean rank of genes in gene set: 6485
Median rank of genes in gene set: 6272
Rank on gene expression program of top 30 genes in gene set:
| Genes | Weight | Rank | GTEx | DepMap | Descartes | Mean.Counts | Mean.TPM |
|---|---|---|---|---|---|---|---|
| SELENBP1 | 0.0019444 | 338 | GTEx | DepMap | Descartes | 0.43 | 39.02 |
| RGS6 | 0.0013375 | 570 | GTEx | DepMap | Descartes | 0.15 | 6.85 |
| SOX6 | 0.0009429 | 878 | GTEx | DepMap | Descartes | 0.33 | 11.23 |
| SPECC1 | 0.0003345 | 2232 | GTEx | DepMap | Descartes | 0.22 | 6.65 |
| CAT | 0.0003222 | 2278 | GTEx | DepMap | Descartes | 0.47 | 49.56 |
| BLVRB | 0.0002901 | 2420 | GTEx | DepMap | Descartes | 0.31 | 46.67 |
| MARCH3 | 0.0001137 | 3491 | GTEx | DepMap | Descartes | 0.33 | NA |
| SLC25A21 | 0.0000732 | 3813 | GTEx | DepMap | Descartes | 0.01 | 0.39 |
| RHD | -0.0000520 | 5110 | GTEx | DepMap | Descartes | 0.00 | 0.00 |
| DENND4A | -0.0001012 | 5772 | GTEx | DepMap | Descartes | 0.92 | 26.70 |
| SLC4A1 | -0.0001230 | 6065 | GTEx | DepMap | Descartes | 0.00 | 0.12 |
| ALAS2 | -0.0001330 | 6190 | GTEx | DepMap | Descartes | 0.00 | 0.00 |
| TRAK2 | -0.0001342 | 6208 | GTEx | DepMap | Descartes | 0.34 | 12.12 |
| SLC25A37 | -0.0001365 | 6241 | GTEx | DepMap | Descartes | 0.70 | 37.20 |
| ANK1 | -0.0001388 | 6272 | GTEx | DepMap | Descartes | 0.15 | 3.84 |
| XPO7 | -0.0001593 | 6529 | GTEx | DepMap | Descartes | 0.31 | 14.41 |
| TMCC2 | -0.0001721 | 6693 | GTEx | DepMap | Descartes | 0.02 | 1.10 |
| GCLC | -0.0001842 | 6821 | GTEx | DepMap | Descartes | 0.45 | 30.20 |
| FECH | -0.0001858 | 6839 | GTEx | DepMap | Descartes | 0.09 | 2.69 |
| ABCB10 | -0.0002057 | 7104 | GTEx | DepMap | Descartes | 0.10 | 6.32 |
| CPOX | -0.0002798 | 7983 | GTEx | DepMap | Descartes | 0.10 | 8.72 |
| TFR2 | -0.0003687 | 8849 | GTEx | DepMap | Descartes | 0.00 | 0.23 |
| SPTB | -0.0005249 | 10116 | GTEx | DepMap | Descartes | 0.01 | 0.11 |
| RAPGEF2 | -0.0005628 | 10362 | GTEx | DepMap | Descartes | 0.85 | 23.91 |
| GYPC | -0.0006813 | 11028 | GTEx | DepMap | Descartes | 0.47 | 56.99 |
| SNCA | -0.0007785 | 11413 | GTEx | DepMap | Descartes | 0.05 | 2.28 |
| MICAL2 | -0.0008839 | 11766 | GTEx | DepMap | Descartes | 1.20 | 34.31 |
| EPB41 | -0.0011854 | 12260 | GTEx | DepMap | Descartes | 0.03 | 1.09 |
| TSPAN5 | -0.0014267 | 12424 | GTEx | DepMap | Descartes | 0.84 | 50.95 |
| NA | NA | NA | NA | NA | NA | NA | NA |
Descartes myeloid markers
Top 50 marker genes of myeloid cells in the Decartes fetal adrenal single cell map (https://atlas.brotmanbaty.org/bbi/human-gene-expression-during-development/cell/myeloid/in/adrenal)
Wilcoxon ranksum test P-value for gene set overrepresentation: 9.06e-01
Mean rank of genes in gene set: 7047.37
Median rank of genes in gene set: 8660
Rank on gene expression program of top 30 genes in gene set:
| Genes | Weight | Rank | GTEx | DepMap | Descartes | Mean.Counts | Mean.TPM |
|---|---|---|---|---|---|---|---|
| CST3 | 0.0029075 | 153 | GTEx | DepMap | Descartes | 15.75 | 1098.19 |
| RGL1 | 0.0027632 | 171 | GTEx | DepMap | Descartes | 0.96 | 46.36 |
| TGFBI | 0.0025553 | 208 | GTEx | DepMap | Descartes | 7.33 | 366.10 |
| SLCO2B1 | 0.0007327 | 1151 | GTEx | DepMap | Descartes | 0.44 | 15.25 |
| SLC9A9 | 0.0007309 | 1155 | GTEx | DepMap | Descartes | 0.19 | 13.94 |
| ABCA1 | 0.0006423 | 1312 | GTEx | DepMap | Descartes | 1.94 | 41.85 |
| AXL | 0.0004680 | 1770 | GTEx | DepMap | Descartes | 1.87 | 83.96 |
| CTSC | 0.0004486 | 1825 | GTEx | DepMap | Descartes | 1.71 | 66.74 |
| IFNGR1 | 0.0002667 | 2538 | GTEx | DepMap | Descartes | 0.73 | 69.17 |
| SLC1A3 | 0.0001902 | 2972 | GTEx | DepMap | Descartes | 0.27 | 15.31 |
| HRH1 | 0.0001213 | 3451 | GTEx | DepMap | Descartes | 0.36 | 17.50 |
| MERTK | 0.0000915 | 3674 | GTEx | DepMap | Descartes | 0.11 | 5.69 |
| FGL2 | 0.0000598 | 3935 | GTEx | DepMap | Descartes | 1.04 | 50.75 |
| LGMN | -0.0001351 | 6221 | GTEx | DepMap | Descartes | 1.41 | 137.79 |
| ATP8B4 | -0.0001540 | 6455 | GTEx | DepMap | Descartes | 0.04 | 1.82 |
| ITPR2 | -0.0002459 | 7593 | GTEx | DepMap | Descartes | 0.39 | 7.61 |
| SPP1 | -0.0002485 | 7628 | GTEx | DepMap | Descartes | 0.21 | 14.77 |
| CD14 | -0.0003133 | 8314 | GTEx | DepMap | Descartes | 0.48 | 62.31 |
| CD163L1 | -0.0003455 | 8623 | GTEx | DepMap | Descartes | 0.01 | 0.20 |
| FGD2 | -0.0003535 | 8697 | GTEx | DepMap | Descartes | 0.02 | 0.86 |
| MARCH1 | -0.0003583 | 8743 | GTEx | DepMap | Descartes | 0.02 | NA |
| WWP1 | -0.0003855 | 9015 | GTEx | DepMap | Descartes | 0.24 | 10.46 |
| ADAP2 | -0.0004132 | 9240 | GTEx | DepMap | Descartes | 0.05 | 2.70 |
| CSF1R | -0.0004248 | 9336 | GTEx | DepMap | Descartes | 0.11 | 3.95 |
| HCK | -0.0004402 | 9482 | GTEx | DepMap | Descartes | 0.11 | 9.83 |
| MSR1 | -0.0004837 | 9809 | GTEx | DepMap | Descartes | 0.11 | 3.85 |
| MS4A4A | -0.0005092 | 9988 | GTEx | DepMap | Descartes | 0.13 | 8.67 |
| CYBB | -0.0005928 | 10566 | GTEx | DepMap | Descartes | 0.11 | 2.79 |
| SFMBT2 | -0.0006034 | 10618 | GTEx | DepMap | Descartes | 0.14 | 3.94 |
| CD163 | -0.0006414 | 10823 | GTEx | DepMap | Descartes | 0.21 | 4.06 |
Descartes Schwann markers
Top 50 marker genes of Schwann cells in the Decartes fetal adrenal single cell map (https://atlas.brotmanbaty.org/bbi/human-gene-expression-during-development/cell/schwann/in/adrenal)
Wilcoxon ranksum test P-value for gene set overrepresentation: 1.06e-01
Mean rank of genes in gene set: 5595.86
Median rank of genes in gene set: 5455.5
Rank on gene expression program of top 30 genes in gene set:
| Genes | Weight | Rank | GTEx | DepMap | Descartes | Mean.Counts | Mean.TPM |
|---|---|---|---|---|---|---|---|
| LAMB1 | 0.0034596 | 92 | GTEx | DepMap | Descartes | 5.07 | 203.37 |
| VIM | 0.0034136 | 96 | GTEx | DepMap | Descartes | 50.84 | 4858.02 |
| SFRP1 | 0.0034072 | 97 | GTEx | DepMap | Descartes | 2.61 | 127.65 |
| KCTD12 | 0.0031764 | 123 | GTEx | DepMap | Descartes | 3.53 | 146.20 |
| LAMA4 | 0.0022918 | 253 | GTEx | DepMap | Descartes | 2.83 | 88.65 |
| LAMC1 | 0.0018376 | 364 | GTEx | DepMap | Descartes | 5.47 | 152.35 |
| GAS7 | 0.0012934 | 595 | GTEx | DepMap | Descartes | 2.34 | 67.45 |
| VCAN | 0.0010698 | 750 | GTEx | DepMap | Descartes | 8.58 | 169.69 |
| SCN7A | 0.0009535 | 862 | GTEx | DepMap | Descartes | 1.16 | 44.23 |
| ADAMTS5 | 0.0008913 | 950 | GTEx | DepMap | Descartes | 0.19 | 4.65 |
| EGFLAM | 0.0008354 | 1019 | GTEx | DepMap | Descartes | 0.50 | 24.87 |
| PMP22 | 0.0006521 | 1290 | GTEx | DepMap | Descartes | 1.93 | 231.40 |
| PLCE1 | 0.0005378 | 1565 | GTEx | DepMap | Descartes | 0.23 | 4.85 |
| COL5A2 | 0.0005212 | 1618 | GTEx | DepMap | Descartes | 4.11 | 108.36 |
| MARCKS | 0.0002911 | 2413 | GTEx | DepMap | Descartes | 7.00 | 372.98 |
| GRIK3 | 0.0002870 | 2434 | GTEx | DepMap | Descartes | 0.14 | 3.72 |
| DST | 0.0002388 | 2694 | GTEx | DepMap | Descartes | 3.95 | 44.18 |
| COL18A1 | 0.0002265 | 2756 | GTEx | DepMap | Descartes | 3.61 | 117.59 |
| OLFML2A | 0.0002010 | 2894 | GTEx | DepMap | Descartes | 0.73 | 28.41 |
| ERBB4 | 0.0000461 | 4066 | GTEx | DepMap | Descartes | 0.03 | 0.61 |
| STARD13 | -0.0000173 | 4717 | GTEx | DepMap | Descartes | 0.85 | 32.11 |
| PTN | -0.0000199 | 4744 | GTEx | DepMap | Descartes | 1.00 | 85.96 |
| MDGA2 | -0.0001308 | 6167 | GTEx | DepMap | Descartes | 0.01 | 0.37 |
| SOX5 | -0.0001362 | 6236 | GTEx | DepMap | Descartes | 0.16 | 6.08 |
| LRRTM4 | -0.0001869 | 6857 | GTEx | DepMap | Descartes | 0.01 | 0.40 |
| IL1RAPL2 | -0.0002097 | 7154 | GTEx | DepMap | Descartes | 0.00 | 0.00 |
| COL25A1 | -0.0002128 | 7201 | GTEx | DepMap | Descartes | 0.02 | 0.55 |
| TRPM3 | -0.0002133 | 7209 | GTEx | DepMap | Descartes | 0.03 | 0.80 |
| FIGN | -0.0002355 | 7469 | GTEx | DepMap | Descartes | 0.16 | 3.83 |
| NRXN3 | -0.0003177 | 8354 | GTEx | DepMap | Descartes | 0.14 | 2.80 |
Descartes Megakaryocytes markers
Top 50 marker genes of Megakaryocytes cells in the Decartes fetal adrenal single cell map (https://atlas.brotmanbaty.org/bbi/human-gene-expression-during-development/cell/megakaryocytes/in/adrenal)
Wilcoxon ranksum test P-value for gene set overrepresentation: 6.47e-01
Mean rank of genes in gene set: 6478.2
Median rank of genes in gene set: 6858
Rank on gene expression program of top 30 genes in gene set:
| Genes | Weight | Rank | GTEx | DepMap | Descartes | Mean.Counts | Mean.TPM |
|---|---|---|---|---|---|---|---|
| GSN | 0.0041573 | 60 | GTEx | DepMap | Descartes | 17.87 | 767.87 |
| SLC2A3 | 0.0021712 | 283 | GTEx | DepMap | Descartes | 5.41 | 324.91 |
| LTBP1 | 0.0016281 | 422 | GTEx | DepMap | Descartes | 1.54 | 62.43 |
| VCL | 0.0012544 | 617 | GTEx | DepMap | Descartes | 2.91 | 77.72 |
| PDE3A | 0.0011382 | 695 | GTEx | DepMap | Descartes | 0.79 | 25.97 |
| GP1BA | 0.0011094 | 716 | GTEx | DepMap | Descartes | 0.04 | 3.95 |
| ANGPT1 | 0.0010975 | 727 | GTEx | DepMap | Descartes | 0.29 | 17.95 |
| STOM | 0.0009259 | 908 | GTEx | DepMap | Descartes | 3.73 | 291.37 |
| ARHGAP6 | 0.0008923 | 947 | GTEx | DepMap | Descartes | 0.14 | 6.50 |
| ACTN1 | 0.0005865 | 1423 | GTEx | DepMap | Descartes | 3.72 | 180.34 |
| MMRN1 | 0.0005383 | 1561 | GTEx | DepMap | Descartes | 0.02 | 0.98 |
| MYLK | 0.0005281 | 1596 | GTEx | DepMap | Descartes | 1.85 | 40.39 |
| STON2 | 0.0002839 | 2443 | GTEx | DepMap | Descartes | 0.10 | 5.81 |
| TLN1 | 0.0002490 | 2628 | GTEx | DepMap | Descartes | 2.87 | 72.61 |
| ZYX | 0.0002079 | 2861 | GTEx | DepMap | Descartes | 3.43 | 354.64 |
| MED12L | 0.0001866 | 2996 | GTEx | DepMap | Descartes | 0.07 | 1.24 |
| SLC24A3 | 0.0001142 | 3485 | GTEx | DepMap | Descartes | 0.10 | 5.79 |
| TRPC6 | -0.0000304 | 4864 | GTEx | DepMap | Descartes | 0.03 | 1.86 |
| PRKAR2B | -0.0001576 | 6505 | GTEx | DepMap | Descartes | 0.19 | 11.97 |
| ITGA2B | -0.0001690 | 6659 | GTEx | DepMap | Descartes | 0.01 | 1.34 |
| UBASH3B | -0.0001853 | 6835 | GTEx | DepMap | Descartes | 0.62 | 21.13 |
| PSTPIP2 | -0.0001864 | 6850 | GTEx | DepMap | Descartes | 0.05 | 4.21 |
| P2RX1 | -0.0001870 | 6858 | GTEx | DepMap | Descartes | 0.02 | 1.69 |
| TUBB1 | -0.0001921 | 6924 | GTEx | DepMap | Descartes | 0.01 | 0.60 |
| MCTP1 | -0.0002102 | 7160 | GTEx | DepMap | Descartes | 0.30 | 15.50 |
| CD9 | -0.0002248 | 7340 | GTEx | DepMap | Descartes | 1.01 | 93.81 |
| DOK6 | -0.0002644 | 7819 | GTEx | DepMap | Descartes | 0.08 | 1.61 |
| RAB27B | -0.0003058 | 8235 | GTEx | DepMap | Descartes | 0.01 | 0.13 |
| ITGB3 | -0.0004018 | 9154 | GTEx | DepMap | Descartes | 0.05 | 1.61 |
| TPM4 | -0.0004112 | 9224 | GTEx | DepMap | Descartes | 4.79 | 212.43 |
Descartes Lyphoid markers
Top 50 marker genes of Lyphoid cells in the Decartes fetal adrenal single cell map (https://atlas.brotmanbaty.org/bbi/human-gene-expression-during-development/cell/lymphoid/in/adrenal)
Wilcoxon ranksum test P-value for gene set overrepresentation: 1.00e+00
Mean rank of genes in gene set: 10564.71
Median rank of genes in gene set: 11803
Rank on gene expression program of top 30 genes in gene set:
| Genes | Weight | Rank | GTEx | DepMap | Descartes | Mean.Counts | Mean.TPM |
|---|---|---|---|---|---|---|---|
| NCALD | 0.0011538 | 686 | GTEx | DepMap | Descartes | 0.41 | 26.52 |
| ARID5B | 0.0009536 | 861 | GTEx | DepMap | Descartes | 6.84 | 212.44 |
| CELF2 | 0.0001000 | 3610 | GTEx | DepMap | Descartes | 1.97 | 62.45 |
| ABLIM1 | -0.0001591 | 6527 | GTEx | DepMap | Descartes | 1.01 | 31.78 |
| ARHGAP15 | -0.0001996 | 7023 | GTEx | DepMap | Descartes | 0.16 | 12.90 |
| MBNL1 | -0.0002632 | 7804 | GTEx | DepMap | Descartes | 2.38 | 95.68 |
| CCND3 | -0.0003369 | 8538 | GTEx | DepMap | Descartes | 0.29 | 29.40 |
| MCTP2 | -0.0004180 | 9289 | GTEx | DepMap | Descartes | 0.02 | 0.50 |
| LEF1 | -0.0004210 | 9316 | GTEx | DepMap | Descartes | 0.38 | 23.08 |
| PLEKHA2 | -0.0005413 | 10226 | GTEx | DepMap | Descartes | 0.72 | 33.21 |
| SKAP1 | -0.0006020 | 10613 | GTEx | DepMap | Descartes | 0.01 | 1.09 |
| SP100 | -0.0006089 | 10659 | GTEx | DepMap | Descartes | 1.08 | 46.13 |
| SCML4 | -0.0006157 | 10690 | GTEx | DepMap | Descartes | 0.01 | 0.43 |
| RCSD1 | -0.0006331 | 10787 | GTEx | DepMap | Descartes | 0.08 | 2.27 |
| STK39 | -0.0006565 | 10898 | GTEx | DepMap | Descartes | 0.20 | 13.85 |
| SAMD3 | -0.0006842 | 11041 | GTEx | DepMap | Descartes | 0.01 | 0.47 |
| FOXP1 | -0.0007266 | 11211 | GTEx | DepMap | Descartes | 2.23 | 58.26 |
| TOX | -0.0007362 | 11256 | GTEx | DepMap | Descartes | 0.04 | 1.72 |
| BACH2 | -0.0008193 | 11556 | GTEx | DepMap | Descartes | 0.26 | 6.04 |
| ITPKB | -0.0008273 | 11583 | GTEx | DepMap | Descartes | 0.55 | 21.55 |
| BCL2 | -0.0008902 | 11778 | GTEx | DepMap | Descartes | 0.39 | 10.85 |
| RAP1GAP2 | -0.0009106 | 11828 | GTEx | DepMap | Descartes | 0.05 | 1.03 |
| ANKRD44 | -0.0009183 | 11847 | GTEx | DepMap | Descartes | 0.12 | 3.54 |
| TMSB10 | -0.0009191 | 11849 | GTEx | DepMap | Descartes | 10.23 | 4799.29 |
| DOCK10 | -0.0009196 | 11851 | GTEx | DepMap | Descartes | 0.36 | 10.30 |
| SORL1 | -0.0009701 | 11954 | GTEx | DepMap | Descartes | 0.38 | 8.14 |
| PITPNC1 | -0.0010740 | 12134 | GTEx | DepMap | Descartes | 0.47 | 15.49 |
| GNG2 | -0.0011037 | 12168 | GTEx | DepMap | Descartes | 0.60 | 37.79 |
| PRKCH | -0.0011527 | 12224 | GTEx | DepMap | Descartes | 0.09 | 5.61 |
| EVL | -0.0011848 | 12257 | GTEx | DepMap | Descartes | 0.71 | 42.74 |
Below shows the ranks on this GEP for immune marker gene lists curated by CellTypist (https://www.celltypist.org/encyclopedia).
High ranks indicate this gene is a driver of this GEP.
These curated gene list are ranked by P-value (on this GEP) of their constituent genes.
The Mean Count column shows the mean read count in cells scoring highly (H > 50) on this gene expression program.
Fibroblasts: Fibroblasts (model markers)
the most common cells of connective tissues which synthesize the extracellular matrix and collagen to maintain tissue homeostasis:
Wilcoxon ranksum test P-value for gene set overrepresentation: 3.29e-07
Mean rank of genes in gene set: 271.44
Rank on gene expression program of genes in gene set:
| Genes | Weight | Rank | GTEx | DepMap | Decartes | Mean.Counts | Mean.TPM |
|---|---|---|---|---|---|---|---|
| SMOC2 | 0.0037067 | 77 | GTEx | DepMap | Descartes | 3.51 | 224.85 |
| SFRP1 | 0.0034072 | 97 | GTEx | DepMap | Descartes | 2.61 | 127.65 |
| PDGFRA | 0.0031669 | 125 | GTEx | DepMap | Descartes | 1.96 | 68.71 |
| EBF2 | 0.0025107 | 215 | GTEx | DepMap | Descartes | 1.37 | 69.54 |
| NTRK2 | 0.0024484 | 225 | GTEx | DepMap | Descartes | 1.54 | 46.53 |
| PRRX1 | 0.0023775 | 239 | GTEx | DepMap | Descartes | 2.87 | 172.11 |
| OLFML1 | 0.0023232 | 247 | GTEx | DepMap | Descartes | 0.76 | 62.36 |
| ANGPTL1 | 0.0013251 | 575 | GTEx | DepMap | Descartes | 0.38 | 22.09 |
| F10 | 0.0012140 | 643 | GTEx | DepMap | Descartes | 0.22 | 34.26 |
Fibroblasts: Fibroblasts (curated markers)
the most common cells of connective tissues which synthesize the extracellular matrix and collagen to maintain tissue homeostasis:
Wilcoxon ranksum test P-value for gene set overrepresentation: 3.16e-03
Mean rank of genes in gene set: 563.33
Rank on gene expression program of genes in gene set:
| Genes | Weight | Rank | GTEx | DepMap | Decartes | Mean.Counts | Mean.TPM |
|---|---|---|---|---|---|---|---|
| DCN | 0.0068289 | 10 | GTEx | DepMap | Descartes | 63.72 | 2280.75 |
| COL1A2 | 0.0014207 | 513 | GTEx | DepMap | Descartes | 63.62 | 1912.19 |
| COL1A1 | 0.0007252 | 1167 | GTEx | DepMap | Descartes | 144.60 | 4094.47 |
DC: Transitional DC (curated markers)
immature dendritic cells which follow dendritic cell precursors and are committed to the mature dendritic cells:
Wilcoxon ranksum test P-value for gene set overrepresentation: 1.78e-02
Mean rank of genes in gene set: 893
Rank on gene expression program of genes in gene set:
| Genes | Weight | Rank | GTEx | DepMap | Decartes | Mean.Counts | Mean.TPM |
|---|---|---|---|---|---|---|---|
| KLF4 | 0.0063517 | 16 | GTEx | DepMap | Descartes | 6.55 | 587.08 |
| AXL | 0.0004680 | 1770 | GTEx | DepMap | Descartes | 1.87 | 83.96 |