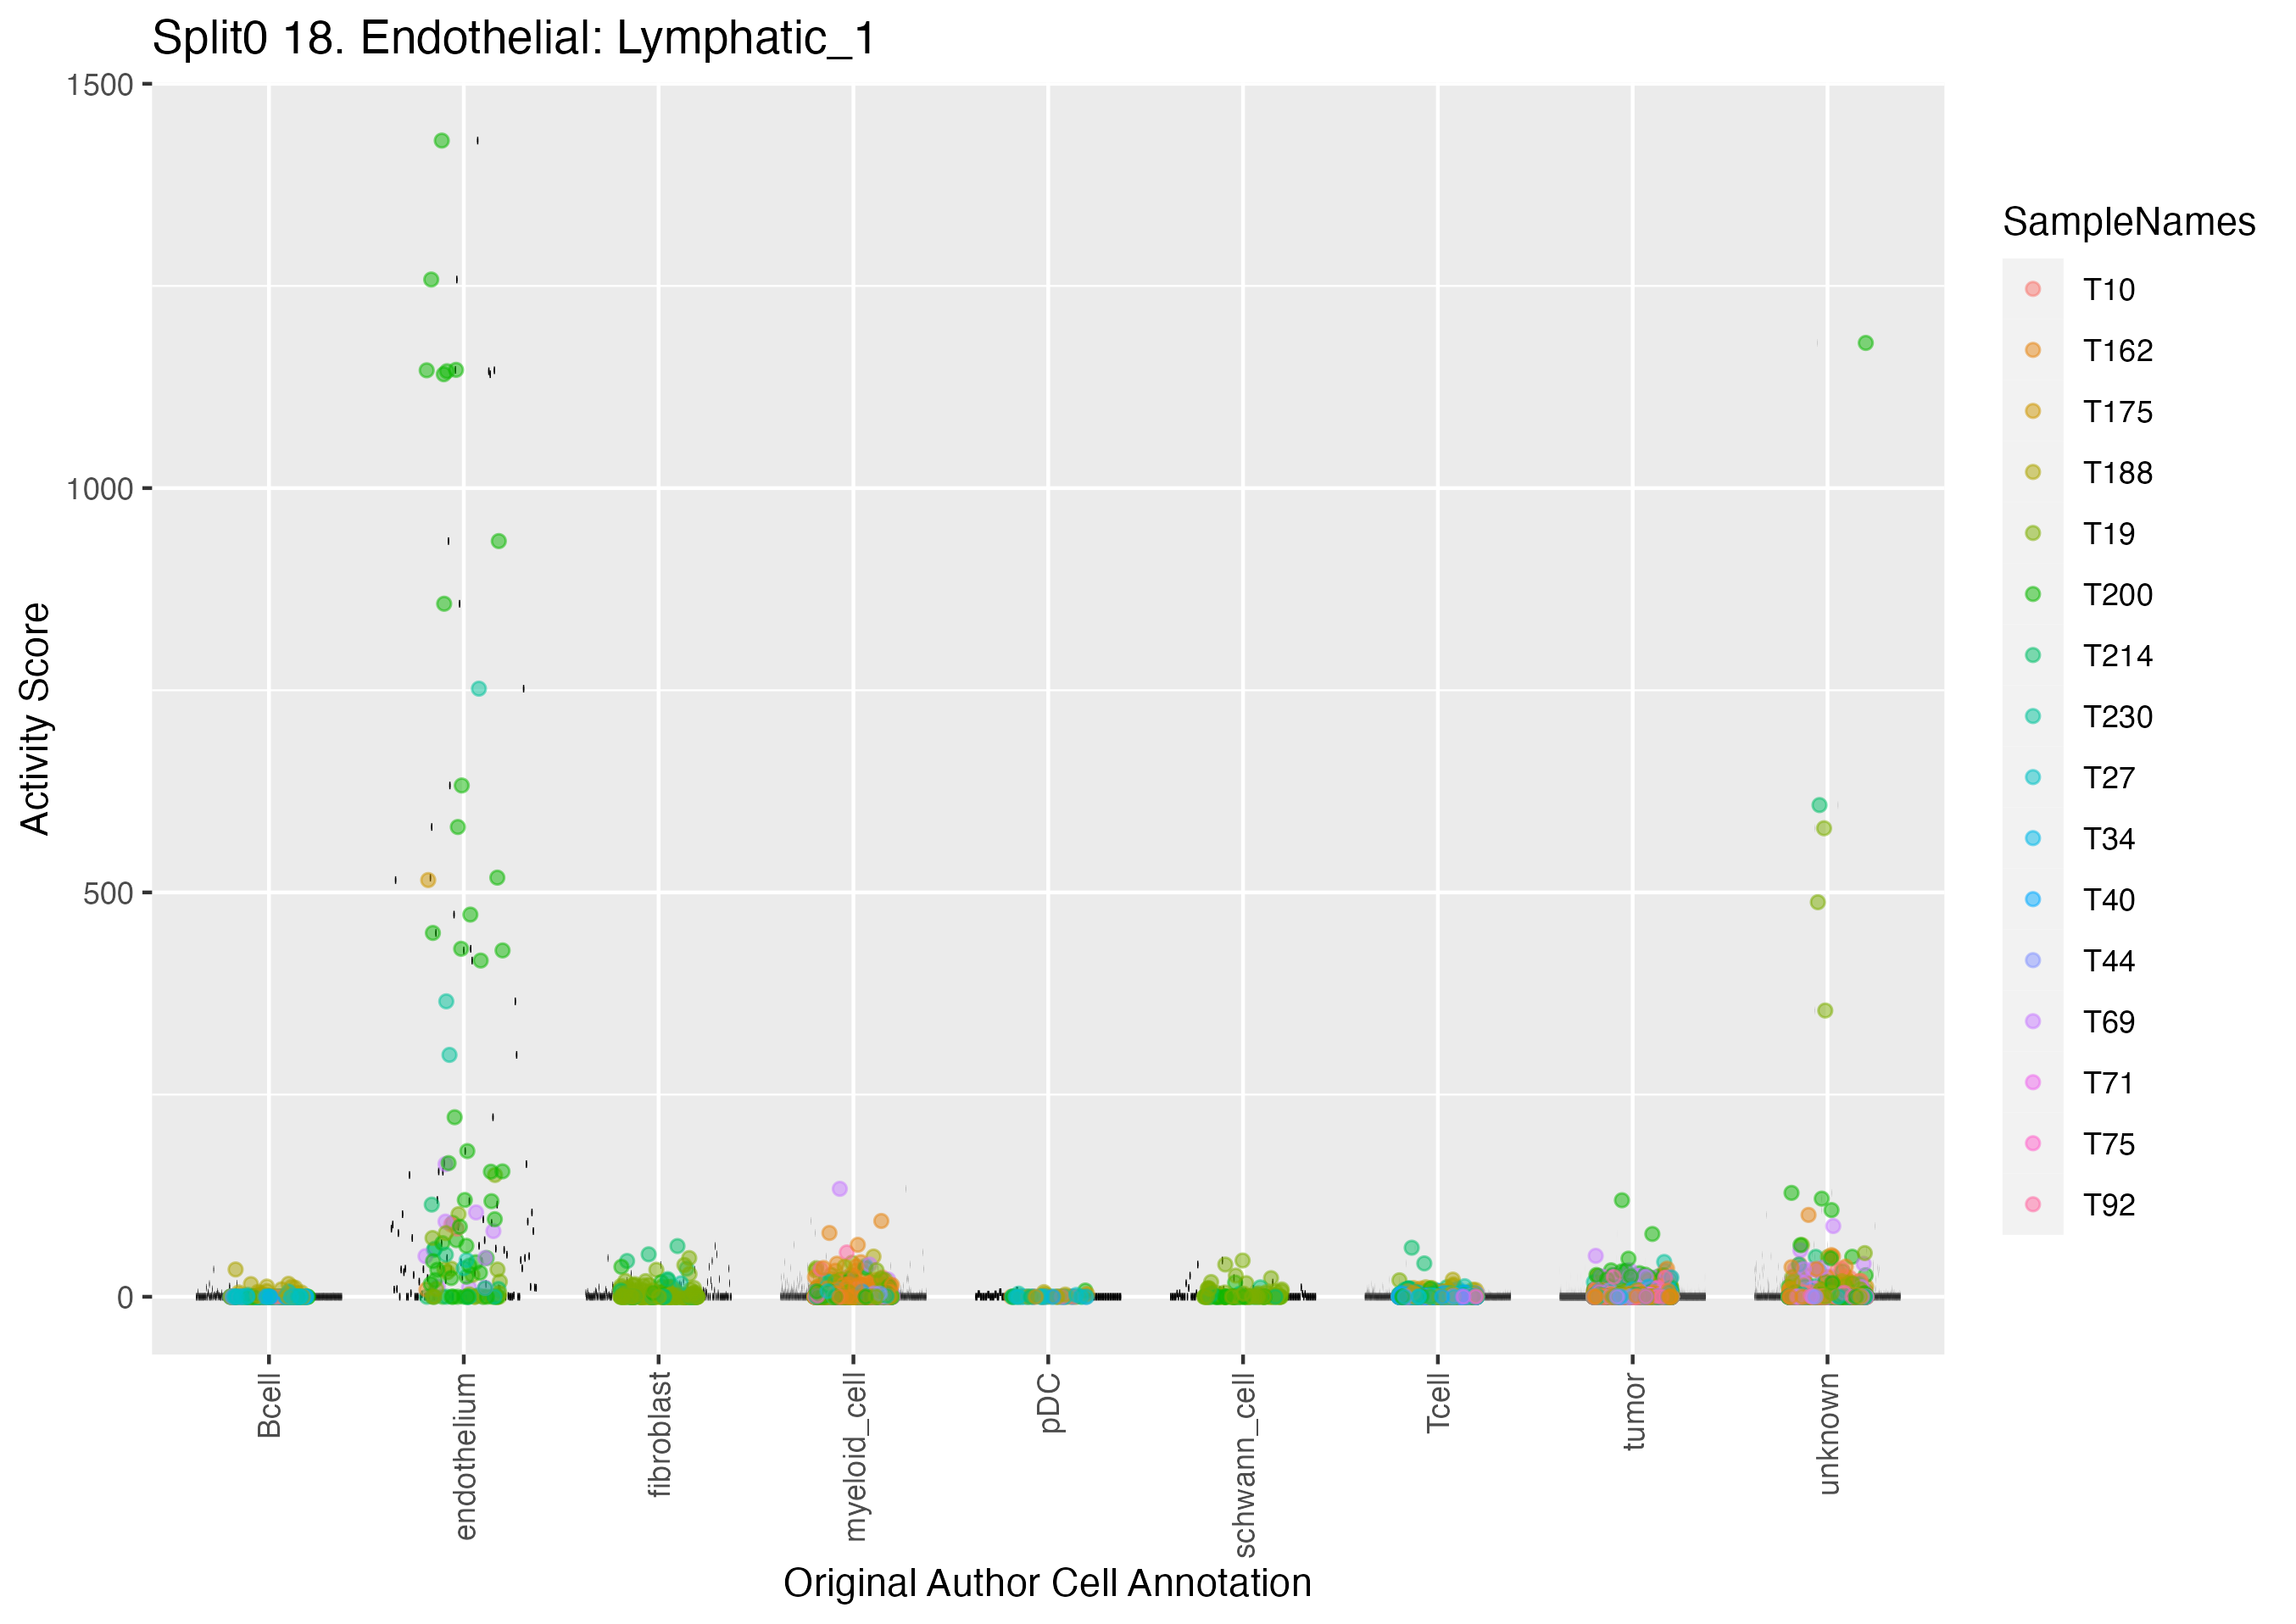
Program: 18. Endothelial: Lymphatic.
Submit a comment on this gene expression program’s interpretation: CLICK
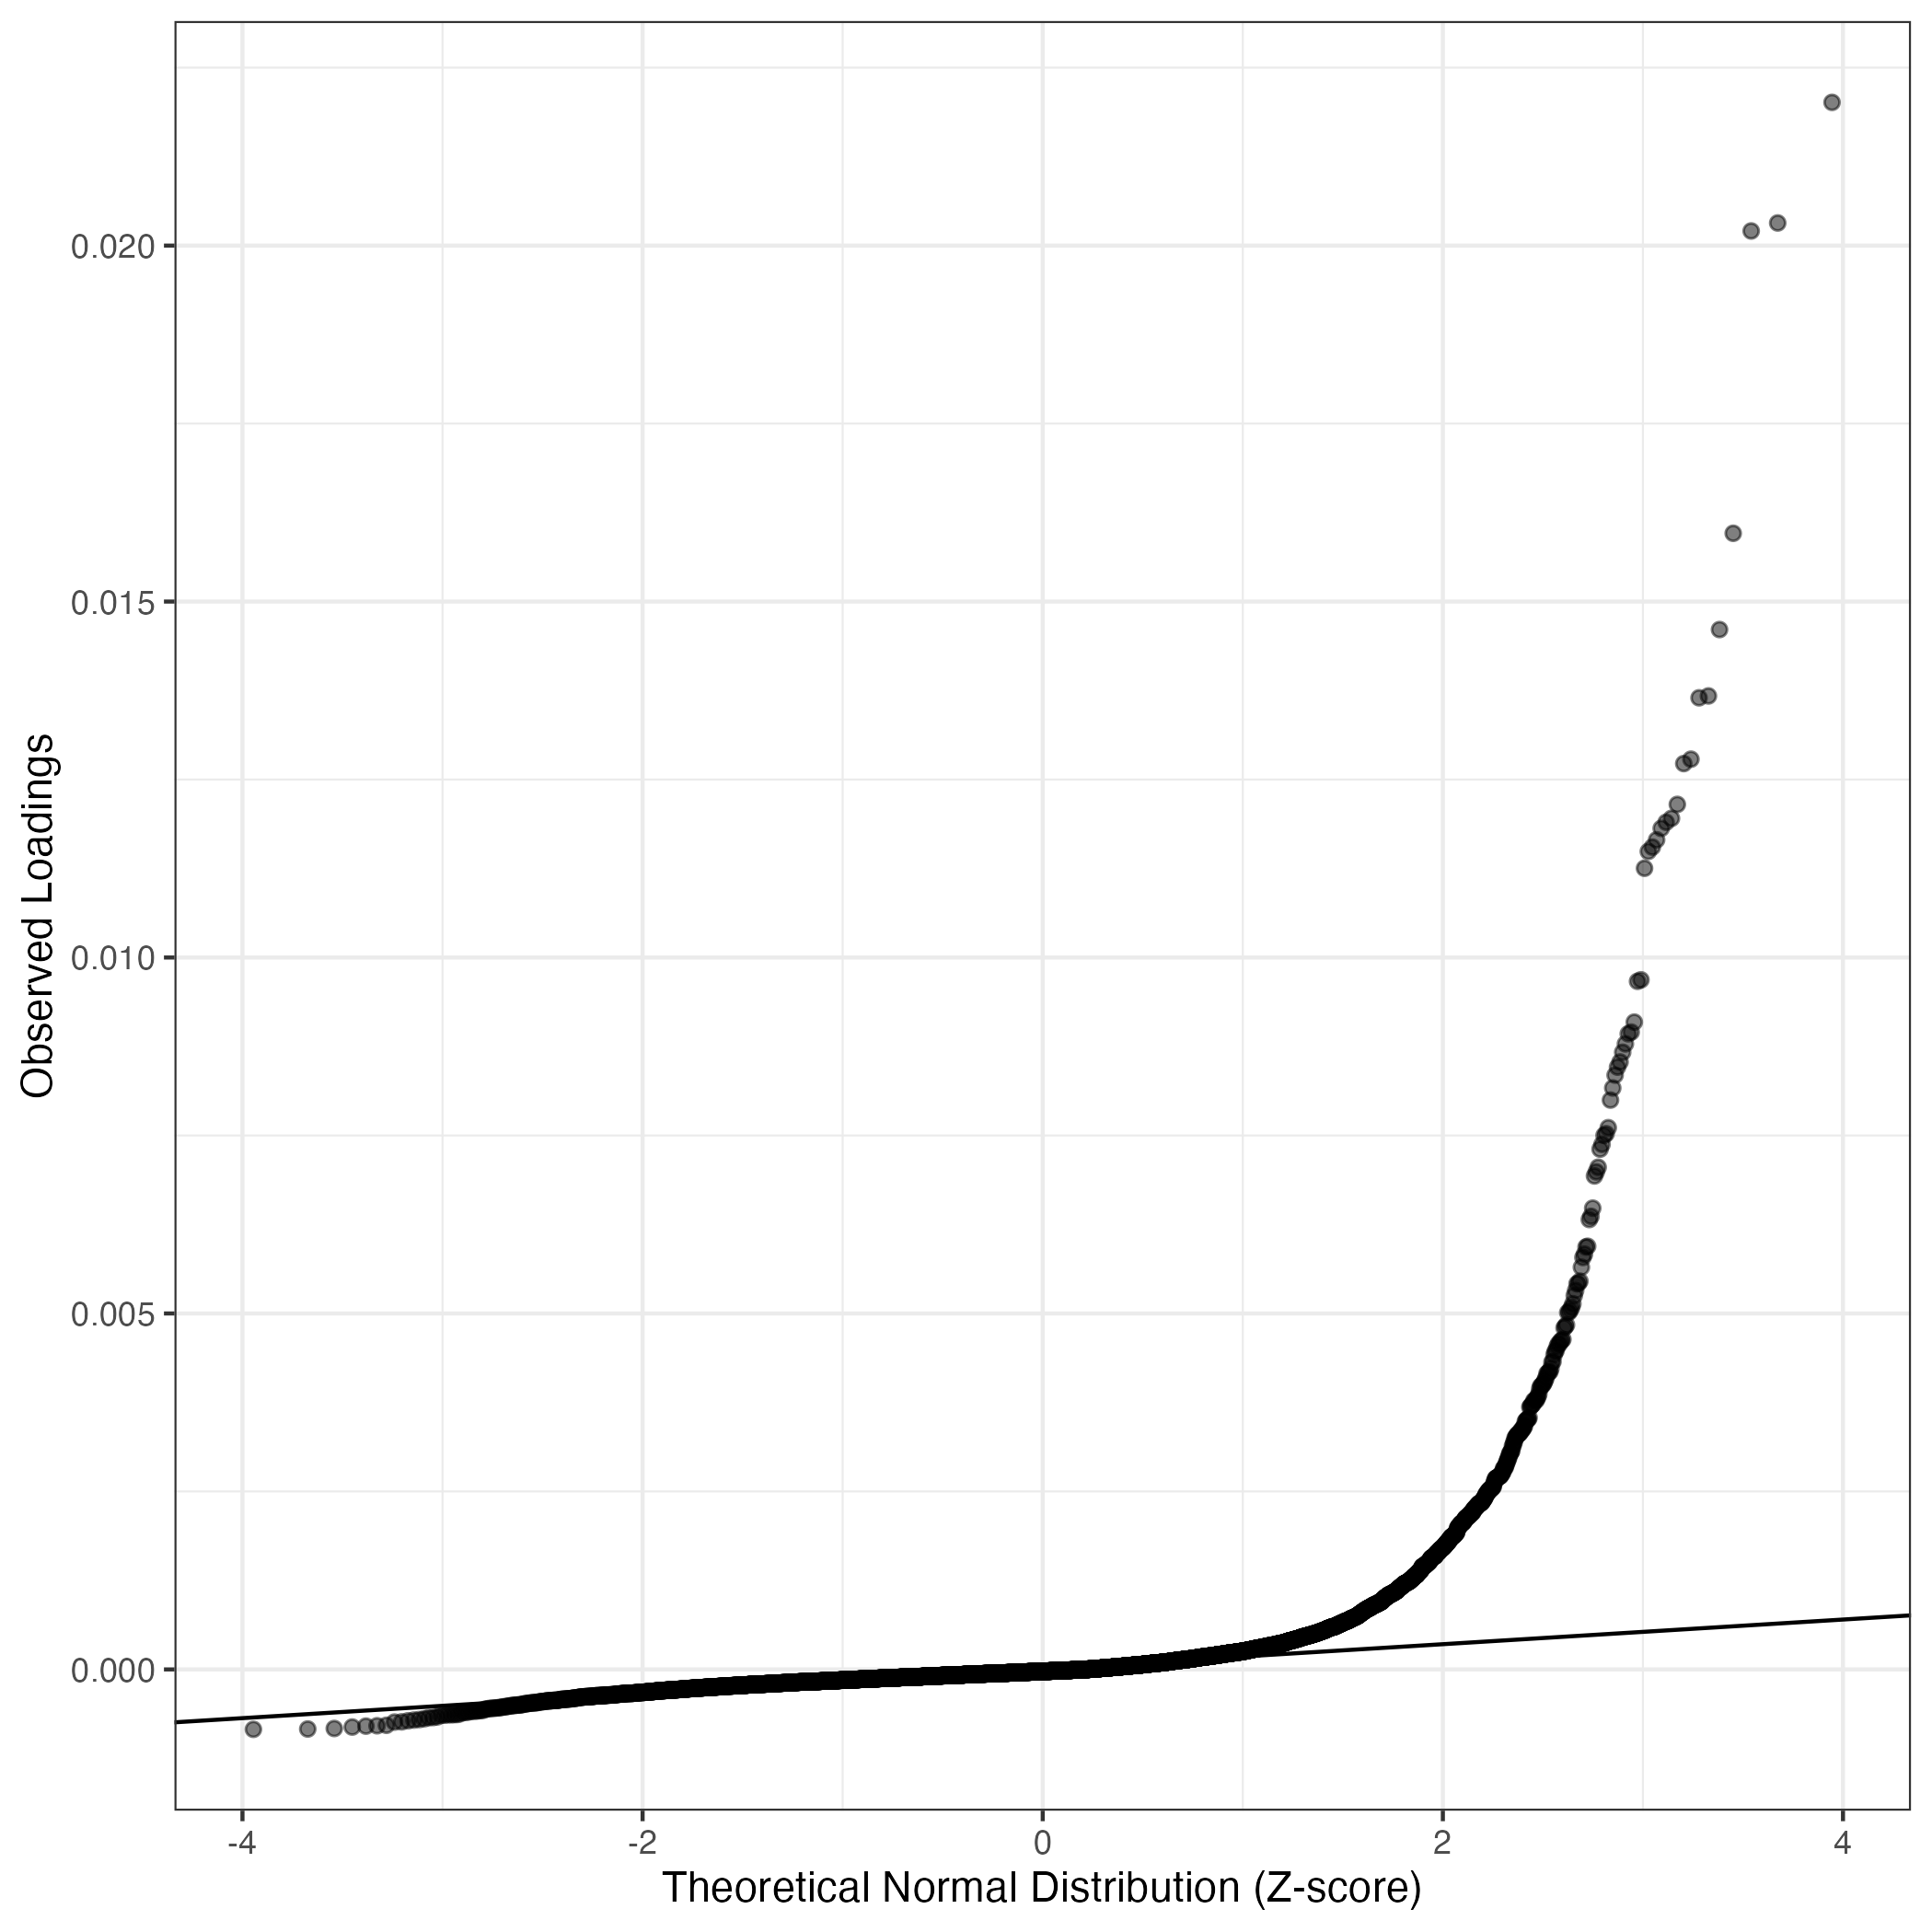
QQ-plot of gene loadings, averaged over both independent splits of the data
This plot highlights the relative contribution of each gene to the GEP
Top genes driving this program.
Note: Decartes website is buggy, try refreshing. Also, Decartes fetal adrenal data have been collected at specific time points (89-122 days), all possible cell types of interest may not be represented, do not overinterpret.
The Mean Count column shows the mean read count in cells scoring highly (H > 50) on this gene expression program.
| Gene | Loading | Gene.Name | GTEx | DepMap | Descartes | Mean.Counts | Mean.Tpm | |
|---|---|---|---|---|---|---|---|---|
| 1 | MMRN1 | 0.0220120 | multimerin 1 | GTEx | DepMap | Descartes | 2.42 | 142.01 |
| 2 | GNG11 | 0.0203177 | G protein subunit gamma 11 | GTEx | DepMap | Descartes | 21.68 | 1614.62 |
| 3 | TFPI | 0.0202054 | tissue factor pathway inhibitor | GTEx | DepMap | Descartes | 3.38 | 131.53 |
| 4 | HSD17B2 | 0.0159589 | hydroxysteroid 17-beta dehydrogenase 2 | GTEx | DepMap | Descartes | 0.28 | 9.62 |
| 5 | PDPN | 0.0146064 | podoplanin | GTEx | DepMap | Descartes | 1.61 | 147.00 |
| 6 | ANGPT2 | 0.0136742 | angiopoietin 2 | GTEx | DepMap | Descartes | 4.00 | 195.97 |
| 7 | FABP4 | 0.0136478 | fatty acid binding protein 4 | GTEx | DepMap | Descartes | 20.04 | 5015.90 |
| 8 | EDN1 | 0.0127857 | endothelin 1 | GTEx | DepMap | Descartes | 1.36 | 190.49 |
| 9 | TBX1 | 0.0127242 | T-box transcription factor 1 | GTEx | DepMap | Descartes | 0.66 | 117.89 |
| 10 | EFEMP1 | 0.0121508 | EGF containing fibulin extracellular matrix protein 1 | GTEx | DepMap | Descartes | 3.35 | 298.36 |
| 11 | TIE1 | 0.0119550 | tyrosine kinase with immunoglobulin like and EGF like domains 1 | GTEx | DepMap | Descartes | 1.80 | 103.10 |
| 12 | CLDN5 | 0.0119000 | claudin 5 | GTEx | DepMap | Descartes | 9.36 | 919.28 |
| 13 | FLT4 | 0.0118141 | fms related receptor tyrosine kinase 4 | GTEx | DepMap | Descartes | 0.96 | 44.45 |
| 14 | TMEM255B | 0.0116528 | transmembrane protein 255B | GTEx | DepMap | Descartes | 1.77 | NA |
| 15 | PGM5 | 0.0115506 | phosphoglucomutase 5 | GTEx | DepMap | Descartes | 0.26 | 20.91 |
| 16 | STAB2 | 0.0114903 | stabilin 2 | GTEx | DepMap | Descartes | 0.12 | 2.76 |
| 17 | ABCA4 | 0.0112536 | ATP binding cassette subfamily A member 4 | GTEx | DepMap | Descartes | 0.18 | 5.62 |
| 18 | TFPI2 | 0.0096863 | tissue factor pathway inhibitor 2 | GTEx | DepMap | Descartes | 1.15 | 125.14 |
| 19 | TM4SF1 | 0.0096657 | transmembrane 4 L six family member 1 | GTEx | DepMap | Descartes | 6.66 | 549.27 |
| 20 | S100A16 | 0.0090924 | S100 calcium binding protein A16 | GTEx | DepMap | Descartes | 4.42 | 823.86 |
| 21 | EGFL7 | 0.0089522 | EGF like domain multiple 7 | GTEx | DepMap | Descartes | 8.09 | 816.36 |
| 22 | MYCT1 | 0.0089285 | MYC target 1 | GTEx | DepMap | Descartes | 1.53 | 107.87 |
| 23 | CDC42EP5 | 0.0087870 | CDC42 effector protein 5 | GTEx | DepMap | Descartes | 1.46 | 493.94 |
| 24 | RHOJ | 0.0086689 | ras homolog family member J | GTEx | DepMap | Descartes | 0.97 | 64.38 |
| 25 | ACKR2 | 0.0085327 | atypical chemokine receptor 2 | GTEx | DepMap | Descartes | 0.12 | NA |
| 26 | PLSCR4 | 0.0084602 | phospholipid scramblase 4 | GTEx | DepMap | Descartes | 0.54 | 48.73 |
| 27 | PPFIBP1 | 0.0083478 | PPFIA binding protein 1 | GTEx | DepMap | Descartes | 2.54 | 102.78 |
| 28 | BMP6 | 0.0081673 | bone morphogenetic protein 6 | GTEx | DepMap | Descartes | 0.18 | 9.10 |
| 29 | ALDH1A1 | 0.0079974 | aldehyde dehydrogenase 1 family member A1 | GTEx | DepMap | Descartes | 1.38 | 172.70 |
| 30 | FILIP1 | 0.0076094 | filamin A interacting protein 1 | GTEx | DepMap | Descartes | 1.53 | 43.29 |
| 31 | KANK3 | 0.0075246 | KN motif and ankyrin repeat domains 3 | GTEx | DepMap | Descartes | 1.03 | 85.75 |
| 32 | ROBO4 | 0.0075007 | roundabout guidance receptor 4 | GTEx | DepMap | Descartes | 2.05 | 111.71 |
| 33 | ERG | 0.0073760 | ETS transcription factor ERG | GTEx | DepMap | Descartes | 1.08 | NA |
| 34 | ART4 | 0.0073081 | ADP-ribosyltransferase 4 (inactive) (Dombrock blood group) | GTEx | DepMap | Descartes | 0.16 | 7.60 |
| 35 | THBS1 | 0.0070537 | thrombospondin 1 | GTEx | DepMap | Descartes | 2.42 | 79.15 |
| 36 | RELN | 0.0069887 | reelin | GTEx | DepMap | Descartes | 0.42 | 12.35 |
| 37 | GJA1 | 0.0069317 | gap junction protein alpha 1 | GTEx | DepMap | Descartes | 1.69 | 112.25 |
| 38 | AFAP1L1 | 0.0064791 | actin filament associated protein 1 like 1 | GTEx | DepMap | Descartes | 0.89 | 34.41 |
| 39 | MEDAG | 0.0063643 | mesenteric estrogen dependent adipogenesis | GTEx | DepMap | Descartes | 0.22 | NA |
| 40 | CAV1 | 0.0063196 | caveolin 1 | GTEx | DepMap | Descartes | 5.82 | 401.89 |
| 41 | WWTR1 | 0.0059435 | WW domain containing transcription regulator 1 | GTEx | DepMap | Descartes | 2.12 | 81.54 |
| 42 | CALCRL | 0.0059335 | calcitonin receptor like receptor | GTEx | DepMap | Descartes | 1.80 | 73.40 |
| 43 | LAMA4 | 0.0058328 | laminin subunit alpha 4 | GTEx | DepMap | Descartes | 4.05 | 131.52 |
| 44 | BMX | 0.0057865 | BMX non-receptor tyrosine kinase | GTEx | DepMap | Descartes | 0.26 | 25.17 |
| 45 | FABP5 | 0.0056493 | fatty acid binding protein 5 | GTEx | DepMap | Descartes | 20.31 | 4630.36 |
| 46 | MGP | 0.0054541 | matrix Gla protein | GTEx | DepMap | Descartes | 23.28 | 3758.99 |
| 47 | TGM2 | 0.0054255 | transglutaminase 2 | GTEx | DepMap | Descartes | 1.51 | 54.54 |
| 48 | CRIM1 | 0.0054172 | cysteine rich transmembrane BMP regulator 1 | GTEx | DepMap | Descartes | 1.61 | 48.76 |
| 49 | NTN4 | 0.0053220 | netrin 4 | GTEx | DepMap | Descartes | 0.49 | 39.73 |
| 50 | LMO2 | 0.0052502 | LIM domain only 2 | GTEx | DepMap | Descartes | 1.64 | 170.01 |
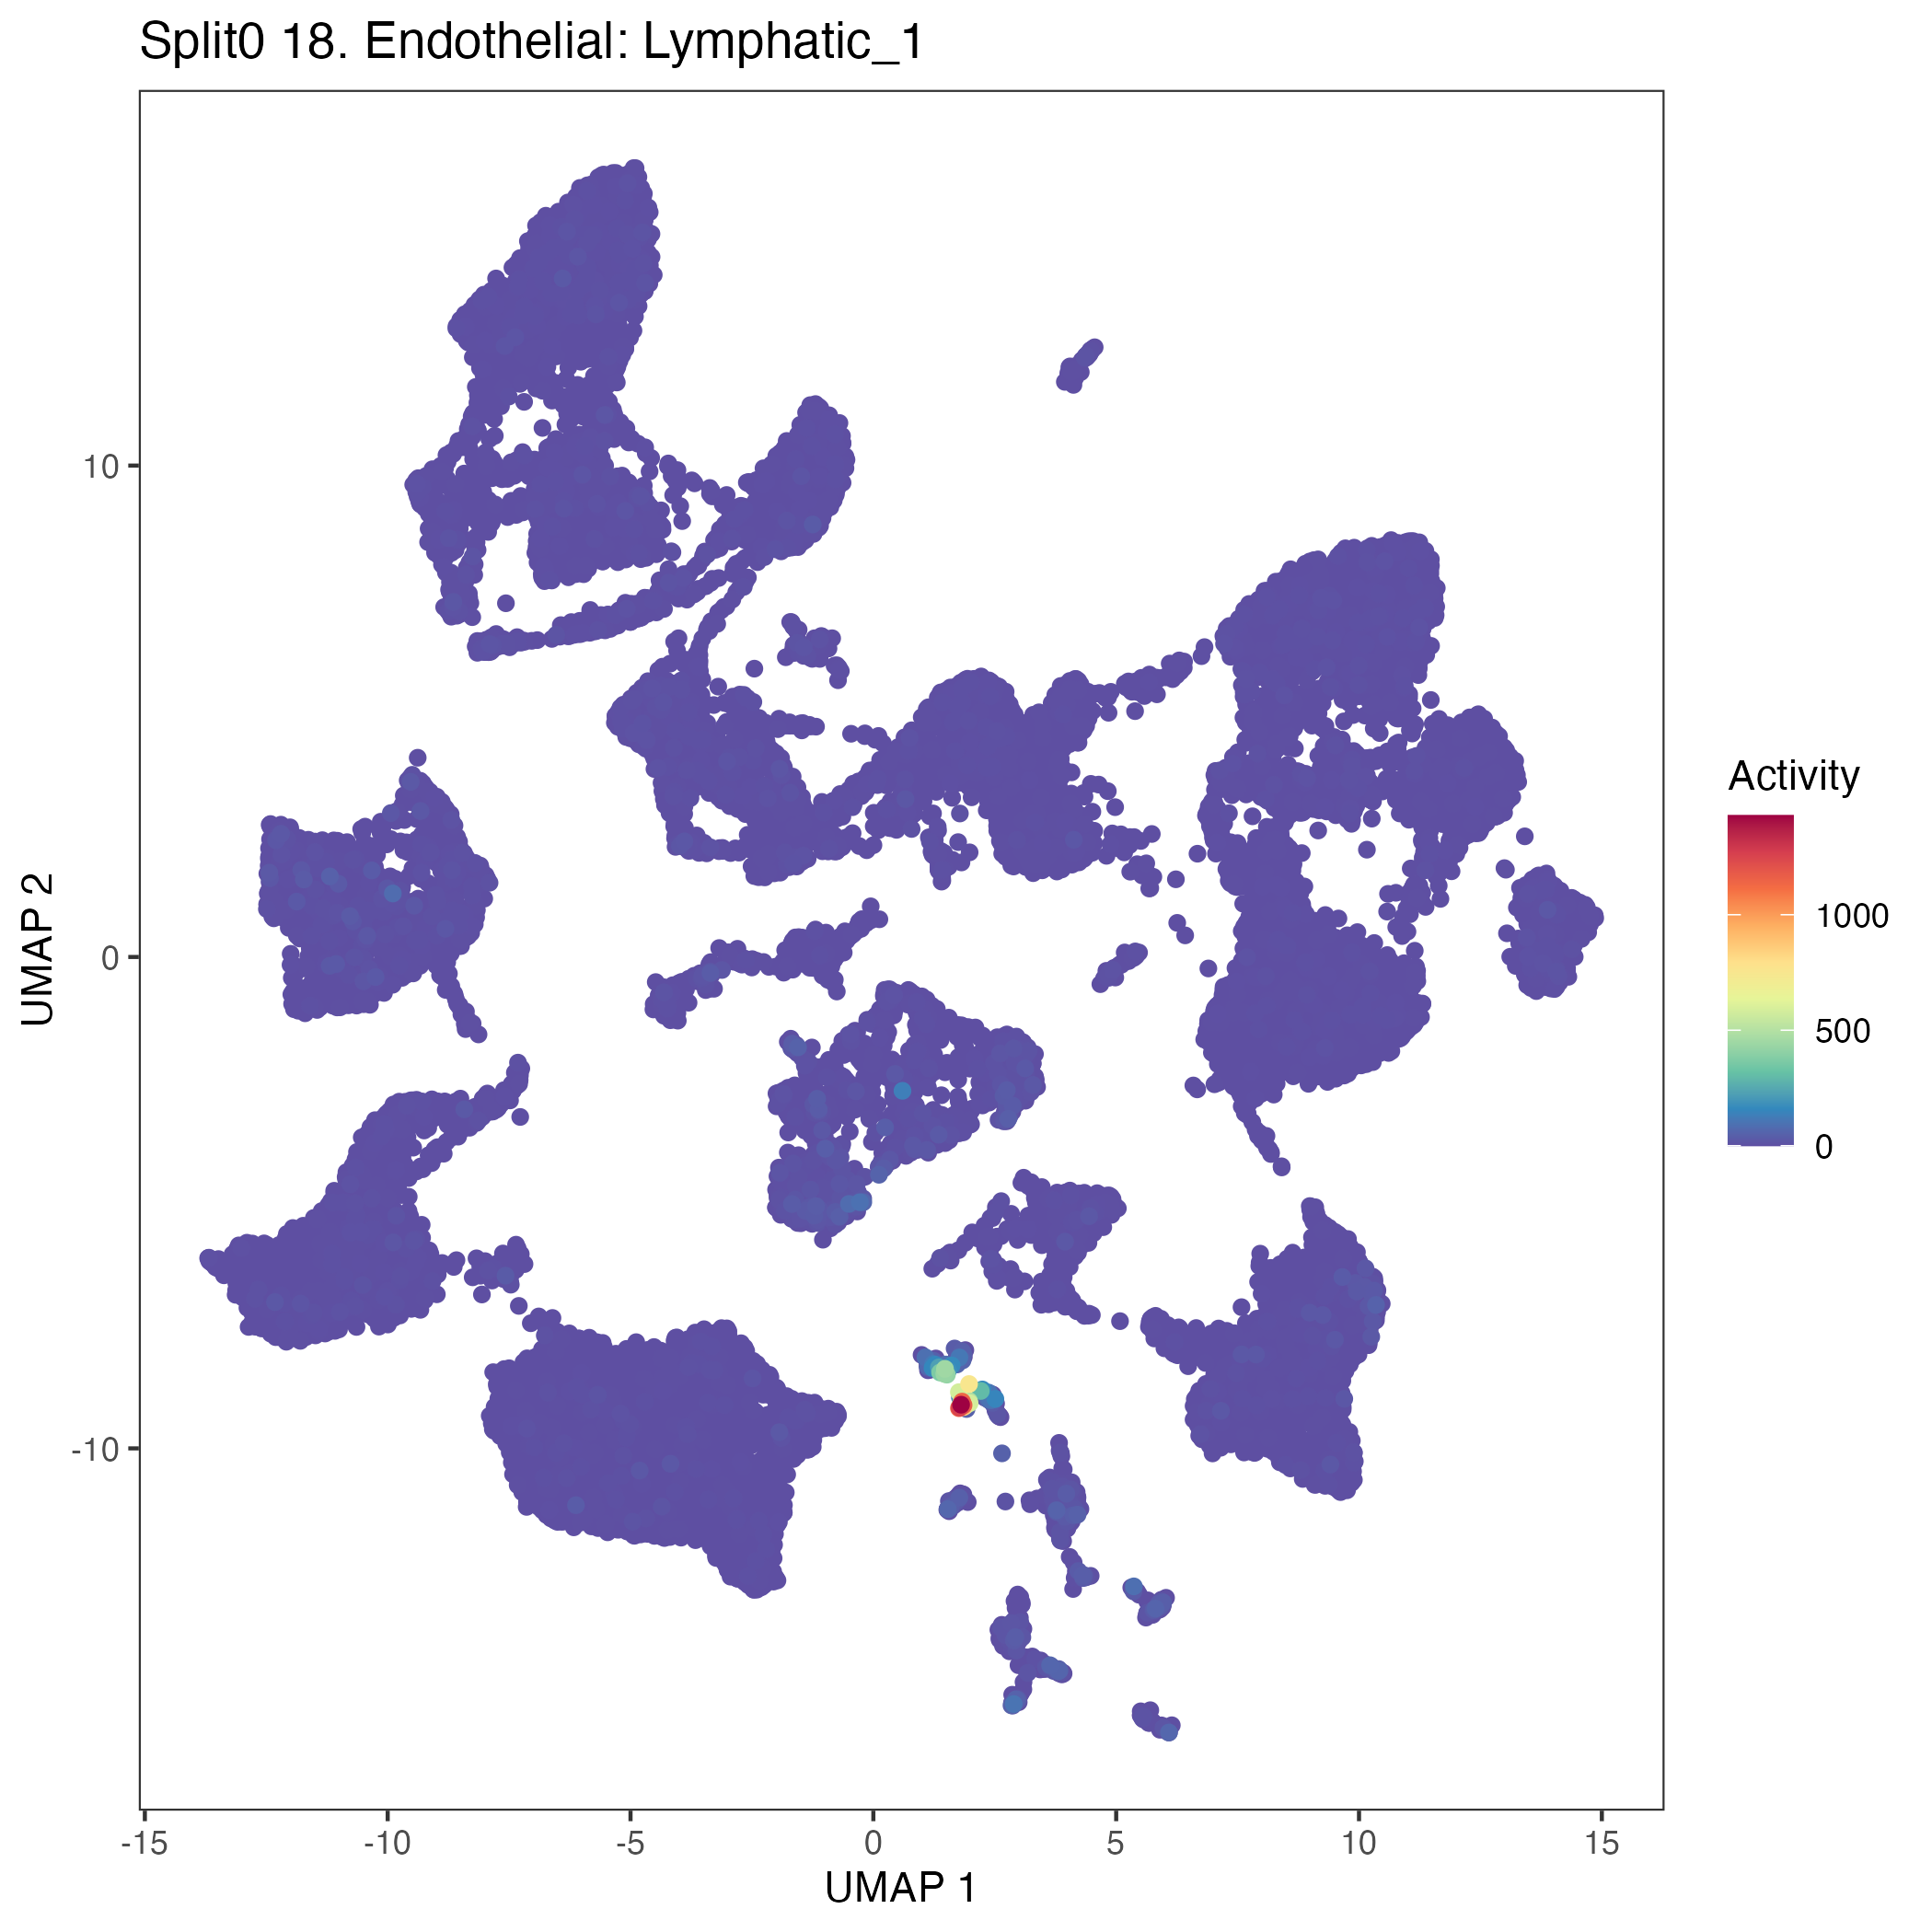
UMAP plots showing activity of gene expression program identified in GEP 18. Endothelial: Lymphatic:
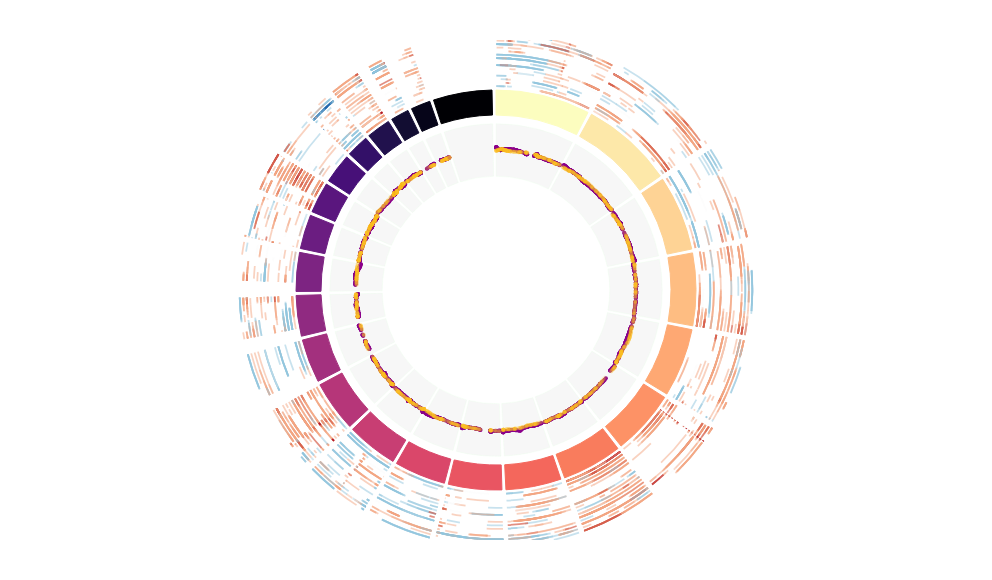
CNV Data procured from inferCNV.
Outer tracks are putative CNV regions (gains = red, losses = blue) for each patient
Inner track is expression data representing:
The top cells expressing this GEP (purple)
Random cells (n =50) from the reference set used in inferCNV (orange)
Gene set Enrichments for this program, caculated from top 50 genes
mSigDB Cell Types Gene Set:
| P-value | OR | Lower 95% CI | FDR | FWER | Genes Found | Gene Set Size | |
|---|---|---|---|---|---|---|---|
| DESCARTES_FETAL_THYMUS_VASCULAR_ENDOTHELIAL_CELLS | 4.42e-22 | 56.37 | 28.60 | 4.94e-20 | 2.96e-19 | 17MMRN1, TFPI, TIE1, CLDN5, PGM5, STAB2, EGFL7, MYCT1, RHOJ, PPFIBP1, KANK3, ERG, RELN, CAV1, WWTR1, CALCRL, TGM2 |
131 |
| DESCARTES_MAIN_FETAL_LYMPHATIC_ENDOTHELIAL_CELLS | 7.58e-18 | 60.02 | 28.07 | 5.09e-16 | 5.09e-15 | 13GNG11, TFPI, TBX1, TIE1, FLT4, TMEM255B, PGM5, STAB2, S100A16, RHOJ, PLSCR4, PPFIBP1, GJA1 |
86 |
| DESCARTES_FETAL_INTESTINE_LYMPHATIC_ENDOTHELIAL_CELLS | 1.16e-10 | 65.43 | 23.04 | 3.70e-09 | 7.77e-08 | 7MMRN1, TFPI, TBX1, FLT4, STAB2, ABCA4, PLSCR4 |
38 |
| FAN_OVARY_CL16_LYMPHATIC_ENDOTHELIAL_CELL | 4.65e-24 | 42.89 | 22.84 | 1.04e-21 | 3.12e-21 | 21MMRN1, GNG11, TFPI, PDPN, ANGPT2, FABP4, EFEMP1, TIE1, CLDN5, FLT4, TMEM255B, TM4SF1, S100A16, EGFL7, MYCT1, PPFIBP1, ALDH1A1, GJA1, CALCRL, LAMA4, FABP5 |
232 |
| AIZARANI_LIVER_C29_MVECS_2 | 5.30e-26 | 39.96 | 21.67 | 3.55e-23 | 3.55e-23 | 24MMRN1, GNG11, TFPI, EDN1, TIE1, CLDN5, PGM5, TFPI2, TM4SF1, S100A16, MYCT1, RHOJ, PLSCR4, FILIP1, ERG, GJA1, CAV1, WWTR1, CALCRL, BMX, MGP, TGM2, CRIM1, LMO2 |
313 |
| AIZARANI_LIVER_C9_LSECS_1 | 1.05e-24 | 37.92 | 20.48 | 3.53e-22 | 7.05e-22 | 23MMRN1, GNG11, TFPI, ANGPT2, EDN1, TIE1, FLT4, STAB2, TFPI2, TM4SF1, S100A16, EGFL7, MYCT1, RHOJ, PPFIBP1, FILIP1, ROBO4, ERG, RELN, WWTR1, TGM2, CRIM1, NTN4 |
304 |
| AIZARANI_LIVER_C13_LSECS_2 | 8.12e-24 | 37.63 | 20.23 | 1.36e-21 | 5.45e-21 | 22GNG11, TFPI, EDN1, TIE1, CLDN5, FLT4, TMEM255B, PGM5, STAB2, TFPI2, TM4SF1, S100A16, EGFL7, MYCT1, PPFIBP1, FILIP1, ROBO4, ERG, RELN, CALCRL, TGM2, NTN4 |
283 |
| AIZARANI_LIVER_C10_MVECS_1 | 1.03e-22 | 36.50 | 19.50 | 1.38e-20 | 6.91e-20 | 21MMRN1, GNG11, EDN1, TIE1, CLDN5, PGM5, TM4SF1, EGFL7, MYCT1, RHOJ, FILIP1, ROBO4, ERG, GJA1, CAV1, WWTR1, CALCRL, MGP, TGM2, CRIM1, LMO2 |
269 |
| GAO_LARGE_INTESTINE_24W_C2_MKI67POS_PROGENITOR | 1.28e-14 | 39.06 | 18.03 | 5.38e-13 | 8.61e-12 | 12MMRN1, GNG11, TFPI, FABP4, TIE1, CLDN5, TM4SF1, EGFL7, MYCT1, ROBO4, ERG, CALCRL |
113 |
| CUI_DEVELOPING_HEART_C4_ENDOTHELIAL_CELL | 2.47e-16 | 36.80 | 17.90 | 1.38e-14 | 1.66e-13 | 14MMRN1, GNG11, TFPI, TIE1, TM4SF1, S100A16, EGFL7, MYCT1, ROBO4, AFAP1L1, WWTR1, CALCRL, BMX, TGM2 |
146 |
| TRAVAGLINI_LUNG_LYMPHATIC_CELL | 1.40e-18 | 33.52 | 17.20 | 1.17e-16 | 9.40e-16 | 17MMRN1, PDPN, ANGPT2, FABP4, TBX1, EFEMP1, FLT4, PGM5, STAB2, RHOJ, ACKR2, PPFIBP1, FILIP1, RELN, MEDAG, LAMA4, FABP5 |
209 |
| CUI_DEVELOPING_HEART_CORONARY_VASCULAR_ENDOTHELIAL_CELL | 1.16e-08 | 48.57 | 15.89 | 2.89e-07 | 7.81e-06 | 6FABP4, CLDN5, FLT4, ROBO4, CAV1, FABP5 |
41 |
| DESCARTES_FETAL_EYE_VASCULAR_ENDOTHELIAL_CELLS | 6.17e-11 | 33.83 | 13.99 | 2.07e-09 | 4.14e-08 | 9TIE1, CLDN5, FLT4, EGFL7, MYCT1, KANK3, ROBO4, ERG, CALCRL |
90 |
| FAN_EMBRYONIC_CTX_BRAIN_ENDOTHELIAL_1 | 4.05e-21 | 25.55 | 13.87 | 3.89e-19 | 2.72e-18 | 23GNG11, ANGPT2, EDN1, TIE1, CLDN5, FLT4, TM4SF1, S100A16, EGFL7, MYCT1, RHOJ, PPFIBP1, KANK3, ROBO4, ERG, GJA1, AFAP1L1, CAV1, WWTR1, CALCRL, LAMA4, TGM2, LMO2 |
440 |
| DESCARTES_FETAL_PANCREAS_LYMPHATIC_ENDOTHELIAL_CELLS | 5.81e-09 | 35.05 | 12.76 | 1.56e-07 | 3.90e-06 | 7MMRN1, TFPI, TBX1, PGM5, STAB2, ABCA4, BMP6 |
65 |
| AIZARANI_LIVER_C20_LSECS_3 | 9.75e-15 | 21.09 | 10.74 | 4.67e-13 | 6.54e-12 | 16TFPI, TIE1, STAB2, TFPI2, TM4SF1, S100A16, MYCT1, RHOJ, PPFIBP1, FILIP1, ROBO4, ERG, RELN, WWTR1, TGM2, CRIM1 |
295 |
| DESCARTES_FETAL_ADRENAL_VASCULAR_ENDOTHELIAL_CELLS | 1.27e-10 | 24.19 | 10.57 | 3.88e-09 | 8.53e-08 | 10EDN1, TIE1, CLDN5, FLT4, TMEM255B, STAB2, KANK3, ROBO4, AFAP1L1, CALCRL |
139 |
| DURANTE_ADULT_OLFACTORY_NEUROEPITHELIUM_PERICYTES | 2.30e-08 | 28.24 | 10.37 | 5.52e-07 | 1.54e-05 | 7GNG11, EDN1, CLDN5, TM4SF1, EGFL7, CAV1, CALCRL |
79 |
| MURARO_PANCREAS_ENDOTHELIAL_CELL | 1.19e-14 | 18.67 | 9.66 | 5.34e-13 | 8.01e-12 | 17GNG11, ANGPT2, TIE1, FLT4, TM4SF1, MYCT1, RHOJ, ROBO4, ERG, THBS1, AFAP1L1, CAV1, WWTR1, CALCRL, LAMA4, FABP5, LMO2 |
362 |
| FAN_OVARY_CL9_PUTATIVE_APOPTOTIC_ENDOTHELIAL_CELL | 1.36e-14 | 18.51 | 9.57 | 5.38e-13 | 9.15e-12 | 17GNG11, TFPI, ANGPT2, CLDN5, TMEM255B, TM4SF1, S100A16, MYCT1, PPFIBP1, ERG, THBS1, CAV1, WWTR1, CALCRL, LAMA4, MGP, CRIM1 |
365 |
Dowload full table
mSigDB Hallmark Gene Sets:
| P-value | OR | Lower 95% CI | FDR | FWER | Genes Found | Gene Set Size | |
|---|---|---|---|---|---|---|---|
| HALLMARK_EPITHELIAL_MESENCHYMAL_TRANSITION | 1.08e-03 | 7.12 | 2.18 | 5.40e-02 | 5.40e-02 | 5TFPI2, THBS1, GJA1, MGP, TGM2 |
200 |
| HALLMARK_UV_RESPONSE_DN | 2.44e-03 | 7.76 | 2.00 | 6.10e-02 | 1.22e-01 | 4TFPI, EFEMP1, GJA1, CAV1 |
144 |
| HALLMARK_KRAS_SIGNALING_UP | 7.71e-03 | 5.55 | 1.44 | 1.22e-01 | 3.85e-01 | 4GNG11, TFPI, FLT4, RELN |
200 |
| HALLMARK_BILE_ACID_METABOLISM | 9.77e-03 | 7.32 | 1.44 | 1.22e-01 | 4.88e-01 | 3ABCA4, BMP6, ALDH1A1 |
112 |
| HALLMARK_TGF_BETA_SIGNALING | 1.94e-02 | 10.01 | 1.15 | 1.94e-01 | 9.68e-01 | 2THBS1, WWTR1 |
54 |
| HALLMARK_ESTROGEN_RESPONSE_LATE | 4.35e-02 | 4.05 | 0.80 | 3.11e-01 | 1.00e+00 | 3TFPI2, CAV1, FABP5 |
200 |
| HALLMARK_INFLAMMATORY_RESPONSE | 4.35e-02 | 4.05 | 0.80 | 3.11e-01 | 1.00e+00 | 3PDPN, EDN1, CALCRL |
200 |
| HALLMARK_COAGULATION | 1.03e-01 | 3.83 | 0.45 | 6.42e-01 | 1.00e+00 | 2TFPI2, THBS1 |
138 |
| HALLMARK_HYPOXIA | 1.85e-01 | 2.63 | 0.31 | 7.70e-01 | 1.00e+00 | 2CAV1, TGM2 |
200 |
| HALLMARK_ADIPOGENESIS | 1.85e-01 | 2.63 | 0.31 | 7.70e-01 | 1.00e+00 | 2FABP4, LAMA4 |
200 |
| HALLMARK_ESTROGEN_RESPONSE_EARLY | 1.85e-01 | 2.63 | 0.31 | 7.70e-01 | 1.00e+00 | 2GJA1, TGM2 |
200 |
| HALLMARK_PANCREAS_BETA_CELLS | 1.47e-01 | 6.54 | 0.16 | 7.70e-01 | 1.00e+00 | 1LMO2 |
40 |
| HALLMARK_CHOLESTEROL_HOMEOSTASIS | 2.55e-01 | 3.49 | 0.09 | 9.81e-01 | 1.00e+00 | 1FABP5 |
74 |
| HALLMARK_PEROXISOME | 3.39e-01 | 2.48 | 0.06 | 1.00e+00 | 1.00e+00 | 1ALDH1A1 |
104 |
| HALLMARK_FATTY_ACID_METABOLISM | 4.66e-01 | 1.62 | 0.04 | 1.00e+00 | 1.00e+00 | 1ALDH1A1 |
158 |
| HALLMARK_APOPTOSIS | 4.72e-01 | 1.59 | 0.04 | 1.00e+00 | 1.00e+00 | 1CAV1 |
161 |
| HALLMARK_IL2_STAT5_SIGNALING | 5.45e-01 | 1.29 | 0.03 | 1.00e+00 | 1.00e+00 | 1TGM2 |
199 |
| HALLMARK_TNFA_SIGNALING_VIA_NFKB | 5.47e-01 | 1.28 | 0.03 | 1.00e+00 | 1.00e+00 | 1EDN1 |
200 |
| HALLMARK_MYOGENESIS | 5.47e-01 | 1.28 | 0.03 | 1.00e+00 | 1.00e+00 | 1WWTR1 |
200 |
| HALLMARK_APICAL_JUNCTION | 5.47e-01 | 1.28 | 0.03 | 1.00e+00 | 1.00e+00 | 1CLDN5 |
200 |
Dowload full table
KEGG Pathways:
| P-value | OR | Lower 95% CI | FDR | FWER | Genes Found | Gene Set Size | |
|---|---|---|---|---|---|---|---|
| KEGG_FOCAL_ADHESION | 1.06e-03 | 7.16 | 2.19 | 1.96e-01 | 1.96e-01 | 5FLT4, THBS1, RELN, CAV1, LAMA4 |
199 |
| KEGG_ECM_RECEPTOR_INTERACTION | 4.44e-03 | 9.85 | 1.92 | 4.13e-01 | 8.25e-01 | 3THBS1, RELN, LAMA4 |
84 |
| KEGG_PPAR_SIGNALING_PATHWAY | 3.05e-02 | 7.77 | 0.90 | 1.00e+00 | 1.00e+00 | 2FABP4, FABP5 |
69 |
| KEGG_TGF_BETA_SIGNALING_PATHWAY | 4.54e-02 | 6.20 | 0.72 | 1.00e+00 | 1.00e+00 | 2BMP6, THBS1 |
86 |
| KEGG_BLADDER_CANCER | 1.54e-01 | 6.22 | 0.15 | 1.00e+00 | 1.00e+00 | 1THBS1 |
42 |
| KEGG_ABC_TRANSPORTERS | 1.61e-01 | 5.93 | 0.14 | 1.00e+00 | 1.00e+00 | 1ABCA4 |
44 |
| KEGG_STEROID_HORMONE_BIOSYNTHESIS | 1.97e-01 | 4.72 | 0.12 | 1.00e+00 | 1.00e+00 | 1HSD17B2 |
55 |
| KEGG_HEDGEHOG_SIGNALING_PATHWAY | 2.00e-01 | 4.64 | 0.11 | 1.00e+00 | 1.00e+00 | 1BMP6 |
56 |
| KEGG_RETINOL_METABOLISM | 2.25e-01 | 4.05 | 0.10 | 1.00e+00 | 1.00e+00 | 1ALDH1A1 |
64 |
| KEGG_P53_SIGNALING_PATHWAY | 2.37e-01 | 3.81 | 0.09 | 1.00e+00 | 1.00e+00 | 1THBS1 |
68 |
| KEGG_COMPLEMENT_AND_COAGULATION_CASCADES | 2.40e-01 | 3.75 | 0.09 | 1.00e+00 | 1.00e+00 | 1TFPI |
69 |
| KEGG_VIRAL_MYOCARDITIS | 2.43e-01 | 3.70 | 0.09 | 1.00e+00 | 1.00e+00 | 1CAV1 |
70 |
| KEGG_ARRHYTHMOGENIC_RIGHT_VENTRICULAR_CARDIOMYOPATHY_ARVC | 2.55e-01 | 3.49 | 0.09 | 1.00e+00 | 1.00e+00 | 1GJA1 |
74 |
| KEGG_SMALL_CELL_LUNG_CANCER | 2.84e-01 | 3.07 | 0.08 | 1.00e+00 | 1.00e+00 | 1LAMA4 |
84 |
| KEGG_GAP_JUNCTION | 3.01e-01 | 2.87 | 0.07 | 1.00e+00 | 1.00e+00 | 1GJA1 |
90 |
| KEGG_MELANOGENESIS | 3.31e-01 | 2.55 | 0.06 | 1.00e+00 | 1.00e+00 | 1EDN1 |
101 |
| KEGG_VASCULAR_SMOOTH_MUSCLE_CONTRACTION | 3.67e-01 | 2.24 | 0.06 | 1.00e+00 | 1.00e+00 | 1CALCRL |
115 |
| KEGG_LEUKOCYTE_TRANSENDOTHELIAL_MIGRATION | 3.69e-01 | 2.22 | 0.05 | 1.00e+00 | 1.00e+00 | 1CLDN5 |
116 |
| KEGG_AXON_GUIDANCE | 4.01e-01 | 1.99 | 0.05 | 1.00e+00 | 1.00e+00 | 1NTN4 |
129 |
| KEGG_TIGHT_JUNCTION | 4.08e-01 | 1.95 | 0.05 | 1.00e+00 | 1.00e+00 | 1CLDN5 |
132 |
Dowload full table
CHR Positional Gene Sets:
| P-value | OR | Lower 95% CI | FDR | FWER | Genes Found | Gene Set Size | |
|---|---|---|---|---|---|---|---|
| chr6p24 | 2.14e-02 | 9.46 | 1.09 | 1.00e+00 | 1.00e+00 | 2EDN1, BMP6 |
57 |
| chr12p12 | 6.67e-02 | 4.96 | 0.58 | 1.00e+00 | 1.00e+00 | 2ART4, MGP |
107 |
| chr2q32 | 6.78e-02 | 4.91 | 0.57 | 1.00e+00 | 1.00e+00 | 2TFPI, CALCRL |
108 |
| chr3q25 | 1.20e-01 | 3.47 | 0.41 | 1.00e+00 | 1.00e+00 | 2TM4SF1, WWTR1 |
152 |
| chr7q21 | 1.36e-01 | 3.21 | 0.38 | 1.00e+00 | 1.00e+00 | 2GNG11, TFPI2 |
164 |
| chr8q21 | 1.55e-01 | 2.96 | 0.35 | 1.00e+00 | 1.00e+00 | 2FABP4, FABP5 |
178 |
| chr9q21 | 1.68e-01 | 2.80 | 0.33 | 1.00e+00 | 1.00e+00 | 2PGM5, ALDH1A1 |
188 |
| chr22q11 | 6.61e-01 | 1.36 | 0.16 | 1.00e+00 | 1.00e+00 | 2TBX1, CLDN5 |
384 |
| chr12q22 | 1.84e-01 | 5.10 | 0.12 | 1.00e+00 | 1.00e+00 | 1NTN4 |
51 |
| chr15q14 | 2.00e-01 | 4.64 | 0.11 | 1.00e+00 | 1.00e+00 | 1THBS1 |
56 |
| chr4q22 | 2.43e-01 | 3.70 | 0.09 | 1.00e+00 | 1.00e+00 | 1MMRN1 |
70 |
| chr12p11 | 2.64e-01 | 3.36 | 0.08 | 1.00e+00 | 1.00e+00 | 1PPFIBP1 |
77 |
| chr6q14 | 3.09e-01 | 2.77 | 0.07 | 1.00e+00 | 1.00e+00 | 1FILIP1 |
93 |
| chr2p22 | 3.23e-01 | 2.63 | 0.06 | 1.00e+00 | 1.00e+00 | 1CRIM1 |
98 |
| chr16q23 | 3.39e-01 | 2.48 | 0.06 | 1.00e+00 | 1.00e+00 | 1HSD17B2 |
104 |
| chr2p16 | 3.64e-01 | 2.26 | 0.06 | 1.00e+00 | 1.00e+00 | 1EFEMP1 |
114 |
| chr6q21 | 3.72e-01 | 2.20 | 0.05 | 1.00e+00 | 1.00e+00 | 1LAMA4 |
117 |
| chr6q22 | 3.77e-01 | 2.16 | 0.05 | 1.00e+00 | 1.00e+00 | 1GJA1 |
119 |
| chr14q23 | 3.89e-01 | 2.07 | 0.05 | 1.00e+00 | 1.00e+00 | 1RHOJ |
124 |
| chr1p22 | 4.01e-01 | 1.99 | 0.05 | 1.00e+00 | 1.00e+00 | 1ABCA4 |
129 |
Dowload full table
Transcription Factor Targets:
| P-value | OR | Lower 95% CI | FDR | FWER | Genes Found | Gene Set Size | |
|---|---|---|---|---|---|---|---|
| GATA1_05 | 1.07e-04 | 7.35 | 2.76 | 1.21e-01 | 1.21e-01 | 7ANGPT2, EGFL7, MYCT1, ALDH1A1, FILIP1, ERG, LMO2 |
284 |
| GATA_Q6 | 1.10e-03 | 7.08 | 2.17 | 1.88e-01 | 1.00e+00 | 5EDN1, MYCT1, BMP6, ERG, LMO2 |
201 |
| GATAAGR_GATA_C | 1.01e-03 | 5.82 | 2.01 | 1.88e-01 | 1.00e+00 | 6ANGPT2, EDN1, MYCT1, BMP6, ERG, LMO2 |
299 |
| GATA3_01 | 2.60e-03 | 5.79 | 1.78 | 2.94e-01 | 1.00e+00 | 5EDN1, EFEMP1, BMP6, FILIP1, ERG |
245 |
| RYTTCCTG_ETS2_B | 5.29e-04 | 3.59 | 1.70 | 1.88e-01 | 6.00e-01 | 12MMRN1, GNG11, ANGPT2, CLDN5, EGFL7, MYCT1, RHOJ, FILIP1, ROBO4, ERG, CALCRL, BMX |
1112 |
| GATA_C | 3.79e-03 | 5.28 | 1.62 | 3.57e-01 | 1.00e+00 | 5ANGPT2, EDN1, MYCT1, BMP6, LMO2 |
268 |
| FOXJ2_02 | 1.48e-02 | 4.55 | 1.18 | 6.67e-01 | 1.00e+00 | 4EDN1, EFEMP1, ERG, CRIM1 |
243 |
| EVI1_02 | 1.67e-02 | 5.95 | 1.17 | 6.67e-01 | 1.00e+00 | 3S100A16, MYCT1, LMO2 |
137 |
| NKX62_Q2 | 1.54e-02 | 4.49 | 1.17 | 6.67e-01 | 1.00e+00 | 4FABP4, FILIP1, ERG, BMX |
246 |
| STAT6_02 | 1.84e-02 | 4.25 | 1.10 | 6.67e-01 | 1.00e+00 | 4EDN1, EGFL7, RHOJ, ERG |
260 |
| EVI1_03 | 2.21e-02 | 9.30 | 1.07 | 6.77e-01 | 1.00e+00 | 2MYCT1, LMO2 |
58 |
| GATA6_01 | 2.03e-02 | 4.12 | 1.07 | 6.67e-01 | 1.00e+00 | 4ANGPT2, MYCT1, BMP6, ERG |
268 |
| CEBP_Q2_01 | 2.13e-02 | 4.06 | 1.05 | 6.69e-01 | 1.00e+00 | 4EFEMP1, ERG, BMX, CRIM1 |
272 |
| EVI1_05 | 3.08e-02 | 4.67 | 0.92 | 8.24e-01 | 1.00e+00 | 3MYCT1, NTN4, LMO2 |
174 |
| AACTTT_UNKNOWN | 9.09e-02 | 1.84 | 0.85 | 9.43e-01 | 1.00e+00 | 11PDPN, ANGPT2, FABP4, ALDH1A1, FILIP1, ERG, THBS1, RELN, GJA1, LAMA4, CRIM1 |
1928 |
| GR_01 | 4.51e-02 | 3.99 | 0.79 | 9.14e-01 | 1.00e+00 | 3TIE1, FILIP1, CALCRL |
203 |
| CATTGTYY_SOX9_B1 | 5.35e-02 | 2.99 | 0.78 | 9.14e-01 | 1.00e+00 | 4GNG11, EDN1, MYCT1, ERG |
368 |
| FOX_Q2 | 5.07e-02 | 3.80 | 0.75 | 9.14e-01 | 1.00e+00 | 3FABP4, EFEMP1, CRIM1 |
213 |
| WGGAATGY_TEF1_Q6 | 6.19e-02 | 2.84 | 0.74 | 9.14e-01 | 1.00e+00 | 4EDN1, PPFIBP1, ERG, CAV1 |
387 |
| E4BP4_01 | 5.65e-02 | 3.63 | 0.72 | 9.14e-01 | 1.00e+00 | 3ALDH1A1, CALCRL, CRIM1 |
223 |
Dowload full table
GO Biological Processes:
| P-value | OR | Lower 95% CI | FDR | FWER | Genes Found | Gene Set Size | |
|---|---|---|---|---|---|---|---|
| GOBP_LYMPH_VESSEL_DEVELOPMENT | 3.10e-06 | 49.25 | 11.88 | 3.86e-03 | 2.32e-02 | 4PDPN, TBX1, TIE1, FLT4 |
26 |
| GOBP_LYMPHANGIOGENESIS | 3.88e-05 | 56.82 | 10.14 | 2.07e-02 | 2.90e-01 | 3PDPN, TIE1, FLT4 |
17 |
| GOBP_LYMPHATIC_ENDOTHELIAL_CELL_DIFFERENTIATION | 4.28e-04 | 86.37 | 8.33 | 1.04e-01 | 1.00e+00 | 2PDPN, TIE1 |
8 |
| GOBP_LYMPH_VESSEL_MORPHOGENESIS | 7.49e-05 | 44.24 | 8.07 | 3.05e-02 | 5.60e-01 | 3PDPN, TIE1, FLT4 |
21 |
| GOBP_GAP_JUNCTION_ASSEMBLY | 1.18e-03 | 47.19 | 4.96 | 1.92e-01 | 1.00e+00 | 2GJA1, CAV1 |
13 |
| GOBP_POSITIVE_REGULATION_OF_SMOOTH_MUSCLE_CELL_PROLIFERATION | 3.67e-05 | 15.25 | 4.62 | 2.07e-02 | 2.75e-01 | 5EDN1, THBS1, GJA1, CALCRL, TGM2 |
96 |
| GOBP_REGULATION_OF_CELL_COMMUNICATION_BY_ELECTRICAL_COUPLING | 1.37e-03 | 43.30 | 4.59 | 2.15e-01 | 1.00e+00 | 2GJA1, CAV1 |
14 |
| GOBP_ENDOTHELIUM_DEVELOPMENT | 1.53e-05 | 13.01 | 4.45 | 1.14e-02 | 1.14e-01 | 6PDPN, TIE1, CLDN5, BMP6, ROBO4, GJA1 |
137 |
| GOBP_RESPONSE_TO_RETINOIC_ACID | 5.14e-05 | 14.17 | 4.30 | 2.32e-02 | 3.84e-01 | 5HSD17B2, TBX1, TIE1, BMP6, GJA1 |
103 |
| GOBP_ENDOTHELIAL_CELL_PROLIFERATION | 8.83e-06 | 11.06 | 4.14 | 7.34e-03 | 6.61e-02 | 7TIE1, FLT4, EGFL7, BMP6, THBS1, GJA1, CAV1 |
191 |
| GOBP_REGULATION_OF_COAGULATION | 1.74e-04 | 16.21 | 4.12 | 5.92e-02 | 1.00e+00 | 4TFPI, EDN1, THBS1, CAV1 |
71 |
| GOBP_ADAPTIVE_THERMOGENESIS | 2.84e-05 | 11.59 | 3.97 | 1.77e-02 | 2.13e-01 | 6FABP4, ALDH1A1, GJA1, CAV1, LAMA4, FABP5 |
153 |
| GOBP_NEGATIVE_REGULATION_OF_WOUND_HEALING | 2.04e-04 | 15.52 | 3.95 | 6.50e-02 | 1.00e+00 | 4TFPI, EDN1, THBS1, GJA1 |
74 |
| GOBP_MIDDLE_EAR_MORPHOGENESIS | 2.03e-03 | 34.68 | 3.75 | 2.53e-01 | 1.00e+00 | 2EDN1, TBX1 |
17 |
| GOBP_TEMPERATURE_HOMEOSTASIS | 5.26e-05 | 10.32 | 3.55 | 2.32e-02 | 3.94e-01 | 6FABP4, ALDH1A1, GJA1, CAV1, LAMA4, FABP5 |
171 |
| GOBP_RESPONSE_TO_MAGNESIUM_ION | 2.28e-03 | 32.49 | 3.53 | 2.71e-01 | 1.00e+00 | 2BMP6, THBS1 |
18 |
| GOBP_REGULATION_OF_WOUND_HEALING | 1.59e-04 | 11.02 | 3.36 | 5.67e-02 | 1.00e+00 | 5TFPI, EDN1, THBS1, GJA1, CAV1 |
131 |
| GOBP_CHRONIC_INFLAMMATORY_RESPONSE | 2.54e-03 | 30.58 | 3.34 | 2.81e-01 | 1.00e+00 | 2THBS1, GJA1 |
19 |
| GOBP_NEGATIVE_REGULATION_OF_RESPONSE_TO_WOUNDING | 4.31e-04 | 12.63 | 3.23 | 1.04e-01 | 1.00e+00 | 4TFPI, EDN1, THBS1, GJA1 |
90 |
| GOBP_BLOOD_VESSEL_MORPHOGENESIS | 9.04e-07 | 6.62 | 3.21 | 1.35e-03 | 6.76e-03 | 13ANGPT2, EDN1, TBX1, TIE1, CLDN5, FLT4, STAB2, EGFL7, RHOJ, ROBO4, THBS1, CAV1, CALCRL |
677 |
Dowload full table
Immunological Gene Sets:
| P-value | OR | Lower 95% CI | FDR | FWER | Genes Found | Gene Set Size | |
|---|---|---|---|---|---|---|---|
| GSE9509_LPS_VS_LPS_AND_IL10_STIM_IL10_KO_MACROPHAGE_20MIN_UP | 9.76e-06 | 10.88 | 4.08 | 2.63e-02 | 4.76e-02 | 7MYCT1, PLSCR4, PPFIBP1, ALDH1A1, ROBO4, ERG, WWTR1 |
194 |
| GSE9509_LPS_VS_LPS_AND_IL10_STIM_IL10_KO_MACROPHAGE_30MIN_UP | 1.08e-05 | 10.71 | 4.01 | 2.63e-02 | 5.25e-02 | 7MMRN1, TFPI, MYCT1, PLSCR4, ALDH1A1, ROBO4, CALCRL |
197 |
| GSE7548_DAY7_VS_DAY28_PCC_IMMUNIZATION_CD4_TCELL_UP | 1.24e-04 | 8.78 | 3.02 | 1.21e-01 | 6.03e-01 | 6TFPI, FABP4, PPFIBP1, BMP6, KANK3, THBS1 |
200 |
| GSE21670_STAT3_KO_VS_WT_CD4_TCELL_IL6_TREATED_DN | 1.24e-04 | 8.78 | 3.02 | 1.21e-01 | 6.03e-01 | 6MMRN1, GNG11, TIE1, MYCT1, PLSCR4, TGM2 |
200 |
| GSE21379_WT_VS_SAP_KO_TFH_CD4_TCELL_UP | 1.24e-04 | 8.78 | 3.02 | 1.21e-01 | 6.03e-01 | 6GNG11, TFPI, TIE1, TM4SF1, RHOJ, KANK3 |
200 |
| GSE24671_CTRL_VS_BAKIMULC_INFECTED_MOUSE_SPLENOCYTES_DN | 5.24e-04 | 8.42 | 2.57 | 4.25e-01 | 1.00e+00 | 5TIE1, STAB2, GJA1, AFAP1L1, CALCRL |
170 |
| GSE8621_UNSTIM_VS_LPS_PRIMED_AND_LPS_STIM_MACROPHAGE_UP | 1.06e-03 | 7.16 | 2.19 | 4.38e-01 | 1.00e+00 | 5MYCT1, ALDH1A1, GJA1, TGM2, CRIM1 |
199 |
| GSE28783_ANTI_MIR33_VS_UNTREATED_ATHEROSCLEROSIS_MACROPHAGE_UP | 1.06e-03 | 7.16 | 2.19 | 4.38e-01 | 1.00e+00 | 5TFPI, TFPI2, ALDH1A1, RELN, LMO2 |
199 |
| GSE8621_LPS_STIM_VS_LPS_PRIMED_AND_LPS_STIM_MACROPHAGE_UP | 1.08e-03 | 7.12 | 2.18 | 4.38e-01 | 1.00e+00 | 5FABP4, RHOJ, GJA1, MEDAG, NTN4 |
200 |
| GSE19198_CTRL_VS_IL21_TREATED_TCELL_24H_UP | 1.08e-03 | 7.12 | 2.18 | 4.38e-01 | 1.00e+00 | 5ANGPT2, EDN1, TFPI2, RHOJ, TGM2 |
200 |
| GSE39556_UNTREATED_VS_3H_POLYIC_INJ_MOUSE_NK_CELL_DN | 1.08e-03 | 7.12 | 2.18 | 4.38e-01 | 1.00e+00 | 5MMRN1, GNG11, ERG, CRIM1, LMO2 |
200 |
| GSE43955_10H_VS_60H_ACT_CD4_TCELL_WITH_TGFB_IL6_DN | 1.08e-03 | 7.12 | 2.18 | 4.38e-01 | 1.00e+00 | 5HSD17B2, EDN1, TFPI2, WWTR1, MGP |
200 |
| GSE7509_UNSTIM_VS_FCGRIIB_STIM_DC_UP | 4.67e-03 | 6.43 | 1.66 | 8.35e-01 | 1.00e+00 | 4CLDN5, CDC42EP5, RHOJ, MGP |
173 |
| GSE37605_FOXP3_FUSION_GFP_VS_IRES_GFP_TREG_C57BL6_DN | 4.96e-03 | 6.32 | 1.63 | 8.35e-01 | 1.00e+00 | 4GNG11, TM4SF1, THBS1, MGP |
176 |
| GSE37605_FOXP3_FUSION_GFP_VS_IRES_GFP_TREG_C57BL6_UP | 5.90e-03 | 6.00 | 1.55 | 8.35e-01 | 1.00e+00 | 4ANGPT2, EDN1, TM4SF1, THBS1 |
185 |
| GSE6259_CD4_TCELL_VS_CD8_TCELL_UP | 6.12e-03 | 5.94 | 1.54 | 8.35e-01 | 1.00e+00 | 4FLT4, S100A16, RHOJ, WWTR1 |
187 |
| GSE11864_CSF1_PAM3CYS_VS_CSF1_IFNG_PAM3CYS_IN_MAC_UP | 7.07e-03 | 5.69 | 1.47 | 8.35e-01 | 1.00e+00 | 4PDPN, TMEM255B, PPFIBP1, BMP6 |
195 |
| GSE16385_ROSIGLITAZONE_IL4_VS_IFNG_TNF_STIM_MACROPHAGE_DN | 7.07e-03 | 5.69 | 1.47 | 8.35e-01 | 1.00e+00 | 4EFEMP1, ALDH1A1, GJA1, CAV1 |
195 |
| GSE24814_STAT5_KO_VS_WT_PRE_BCELL_UP | 7.32e-03 | 5.63 | 1.46 | 8.35e-01 | 1.00e+00 | 4PDPN, LAMA4, TGM2, LMO2 |
197 |
| GSE14769_UNSTIM_VS_80MIN_LPS_BMDM_DN | 7.58e-03 | 5.57 | 1.44 | 8.35e-01 | 1.00e+00 | 4FABP4, GJA1, CAV1, TGM2 |
199 |
Top Ranked Transcription Factors for this Gene Expression Program:
| Gene Symbol | TF Rank | DNA Binding Domain | Motif Status | IUPAC PWM | GTEx | DepMap | Decartes |
|---|---|---|---|---|---|---|---|
| EDN1 | 8 | No | Unlikely to be sequence specific TF | Not a DNA binding protein | No motif | None | Protein that is processed into a secreted signaling peptide |
| TBX1 | 9 | Yes | Known motif | Monomer or homomultimer | High-throughput in vitro | None | None |
| ERG | 33 | Yes | Known motif | Monomer or homomultimer | High-throughput in vitro | None | None |
| RELN | 36 | No | Unlikely to be sequence specific TF | Not a DNA binding protein | No motif | None | Protein is a large secreted extracellular matrix protein |
| WWTR1 | 41 | No | Unlikely to be sequence specific TF | Not a DNA binding protein | No motif | None | Transcriptional co-activator that binds to TEADs (PMID: 19324877) and TBX5 (PMID: 16332960) |
| LMO2 | 50 | No | Unlikely to be sequence specific TF | Not a DNA binding protein | No motif | Only known motifs are from Transfac or HocoMoco - origin is uncertain | Protein binds to bHLH TFs, which then bind to DNA (PMID: 9707419). Both transfac motifs are suspect - the bHLH motif likely resulted from an indirect interaction. |
| SPHK1 | 57 | No | Unlikely to be sequence specific TF | Not a DNA binding protein | No motif | None | None |
| ELK3 | 65 | Yes | Known motif | Monomer or homomultimer | High-throughput in vitro | None | None |
| HES1 | 95 | Yes | Known motif | Monomer or homomultimer | High-throughput in vitro | None | None |
| PROX1 | 99 | Yes | Known motif | Monomer or homomultimer | High-throughput in vitro | None | None |
| BCL6B | 101 | Yes | Known motif | Monomer or homomultimer | High-throughput in vitro | None | None |
| NR2F2 | 104 | Yes | Known motif | Monomer or homomultimer | 100 perc ID - in vitro | None | None |
| NFIA | 108 | Yes | Known motif | Monomer or homomultimer | High-throughput in vitro | None | None |
| HOXA7 | 137 | Yes | Known motif | Monomer or homomultimer | High-throughput in vitro | None | None |
| TAL1 | 144 | Yes | Known motif | Obligate heteromer | In vivo/Misc source | Only known motifs are from Transfac or HocoMoco - origin is uncertain | No motif yielded from PBMs or HT-SELEX. Binds DNA as heterodimer with TCF3 (PDB:2YPB and PDB:2YPA). |
| YBX3 | 146 | Yes | Known motif | Monomer or homomultimer | 100 perc ID - in vitro | None | Identical DBD to YBX1. Might also bind RNA. |
| PREX2 | 151 | No | Unlikely to be sequence specific TF | Not a DNA binding protein | No motif | None | None |
| SP6 | 155 | Yes | Inferred motif | Monomer or homomultimer | High-throughput in vitro | None | None |
| ID3 | 172 | No | Unlikely to be sequence specific TF | Not a DNA binding protein | No motif | None | ID bHLH proteins lack the basic region and should not be able to bind DNA. The HT-SELEX motif for ID4 is likely by a co-precipitated protein or it is a contamination |
| FZD4 | 178 | No | Unlikely to be sequence specific TF | Not a DNA binding protein | No motif | None | None |
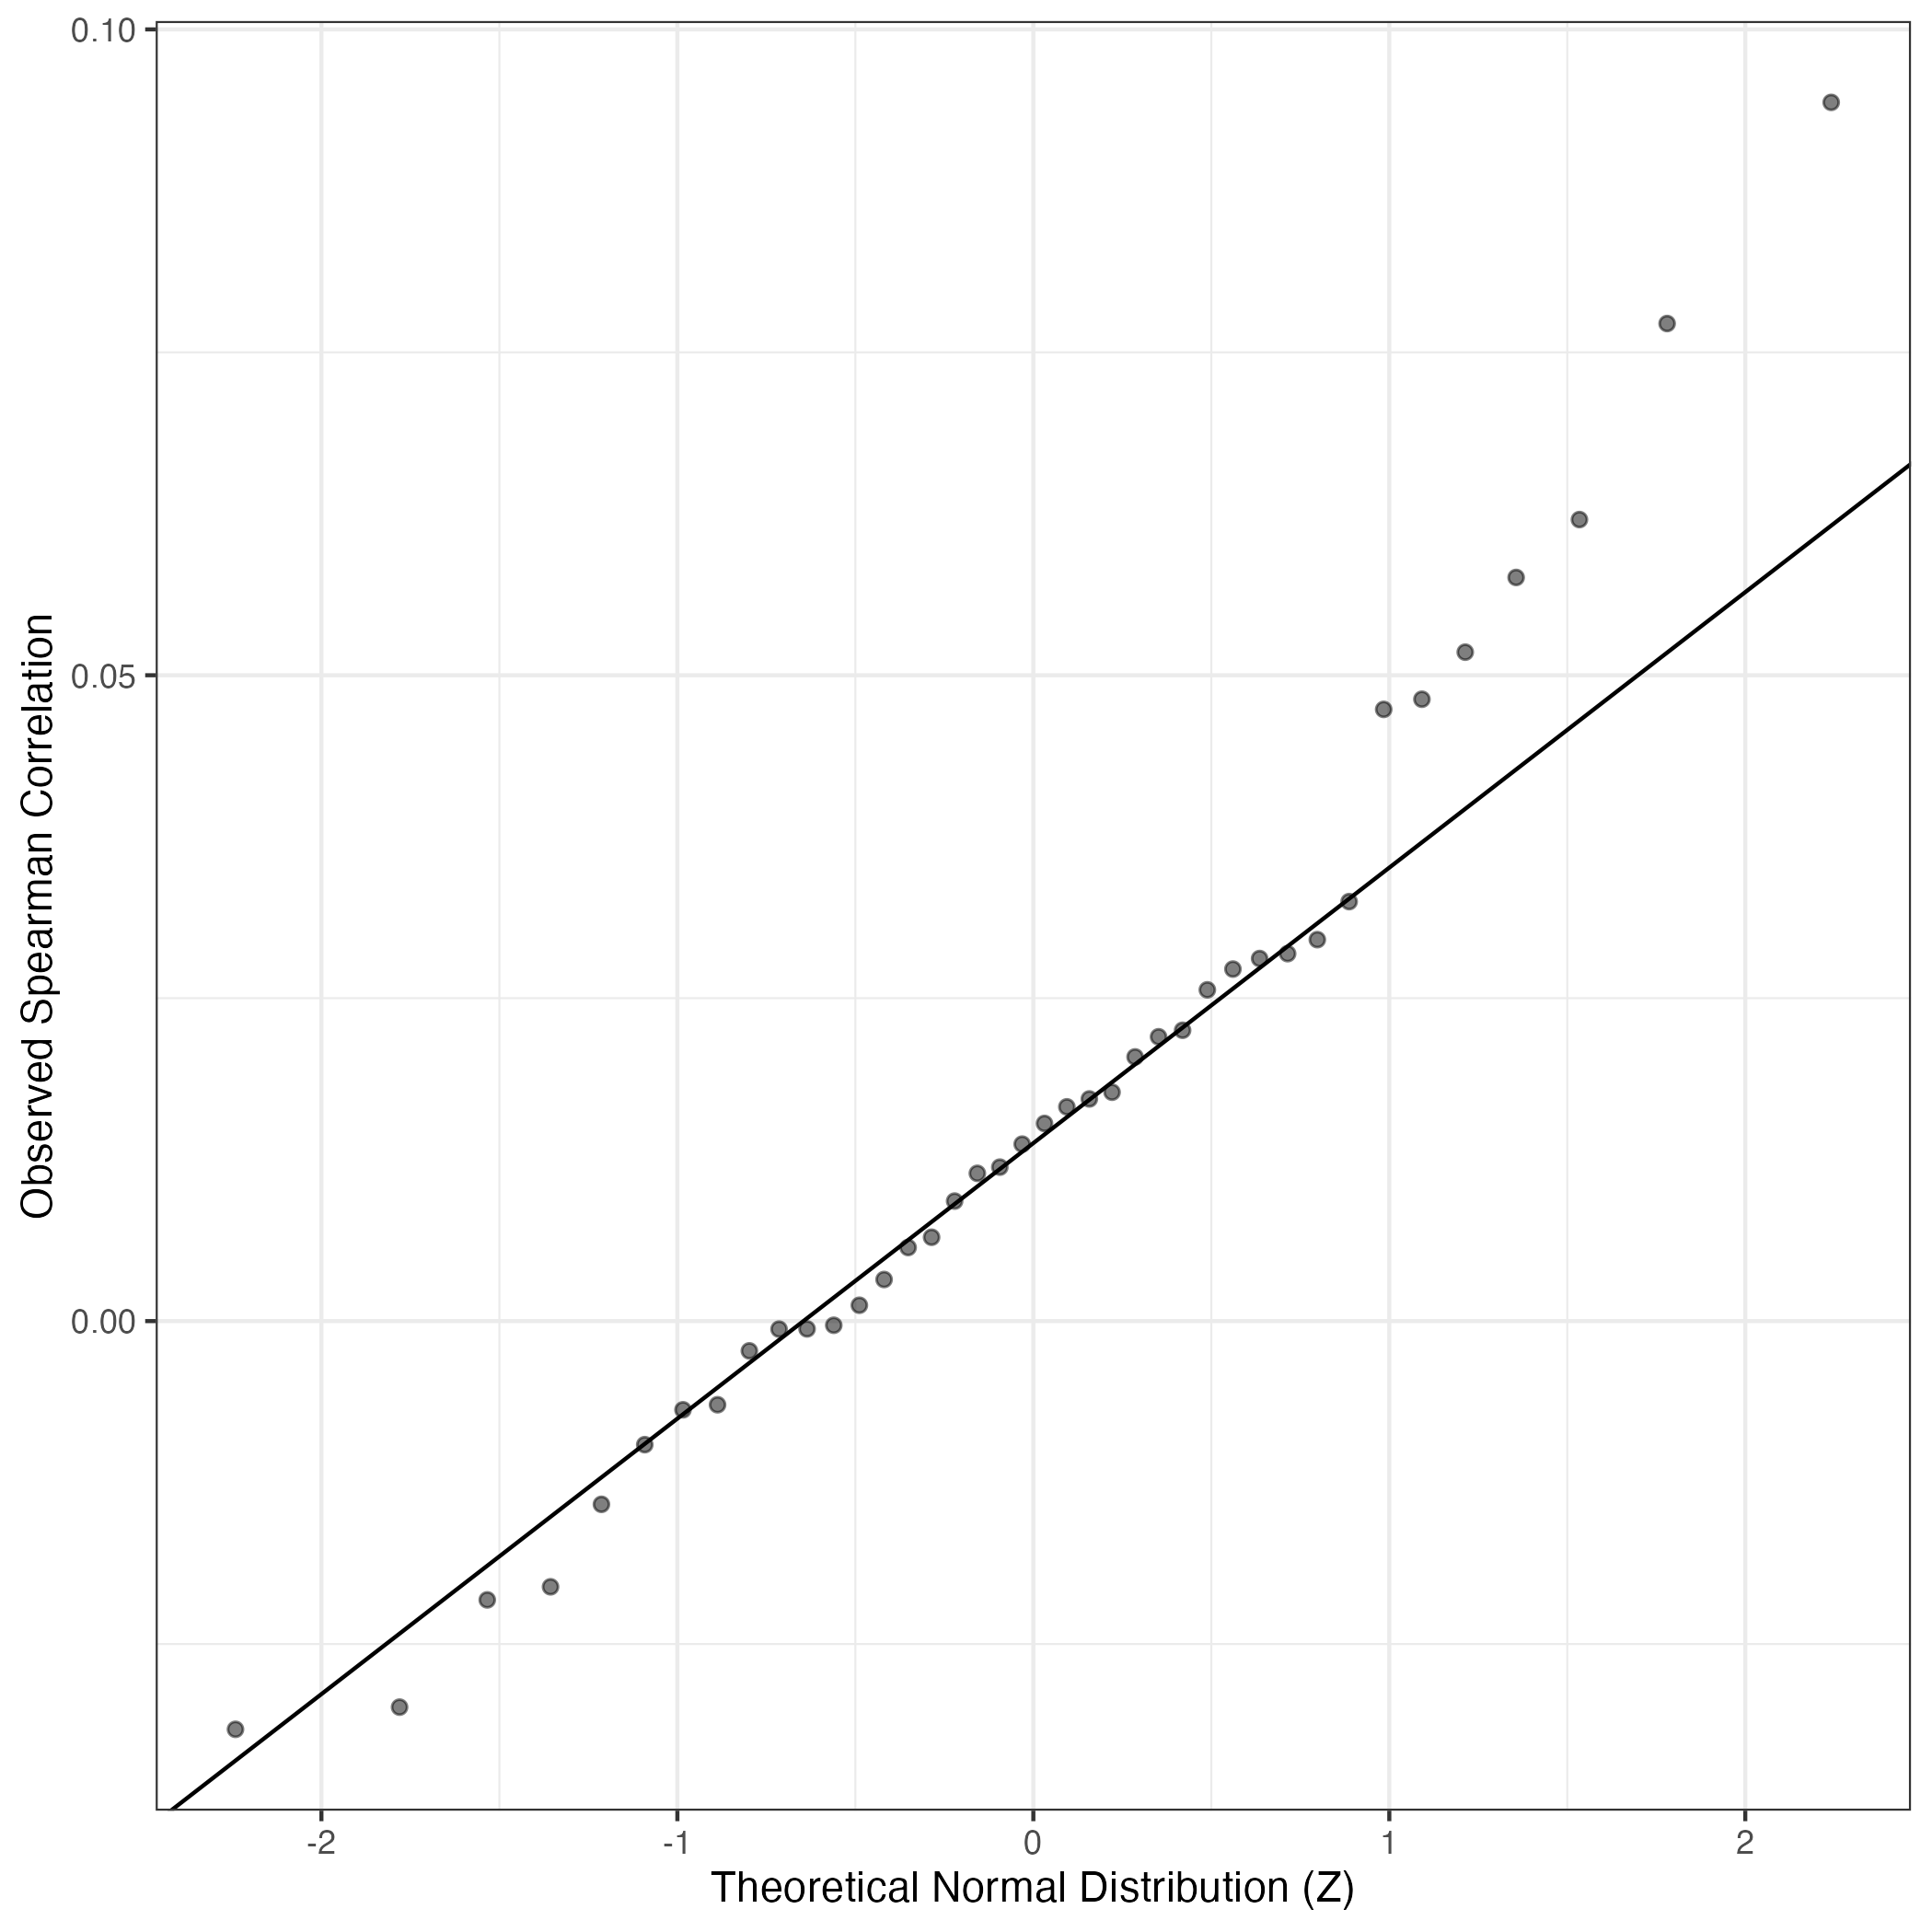
QQ Plot showing correlations with other GEPs in this dataset, calculated by Spearman correlation:
Interactive QQ-plot of gene loadings:
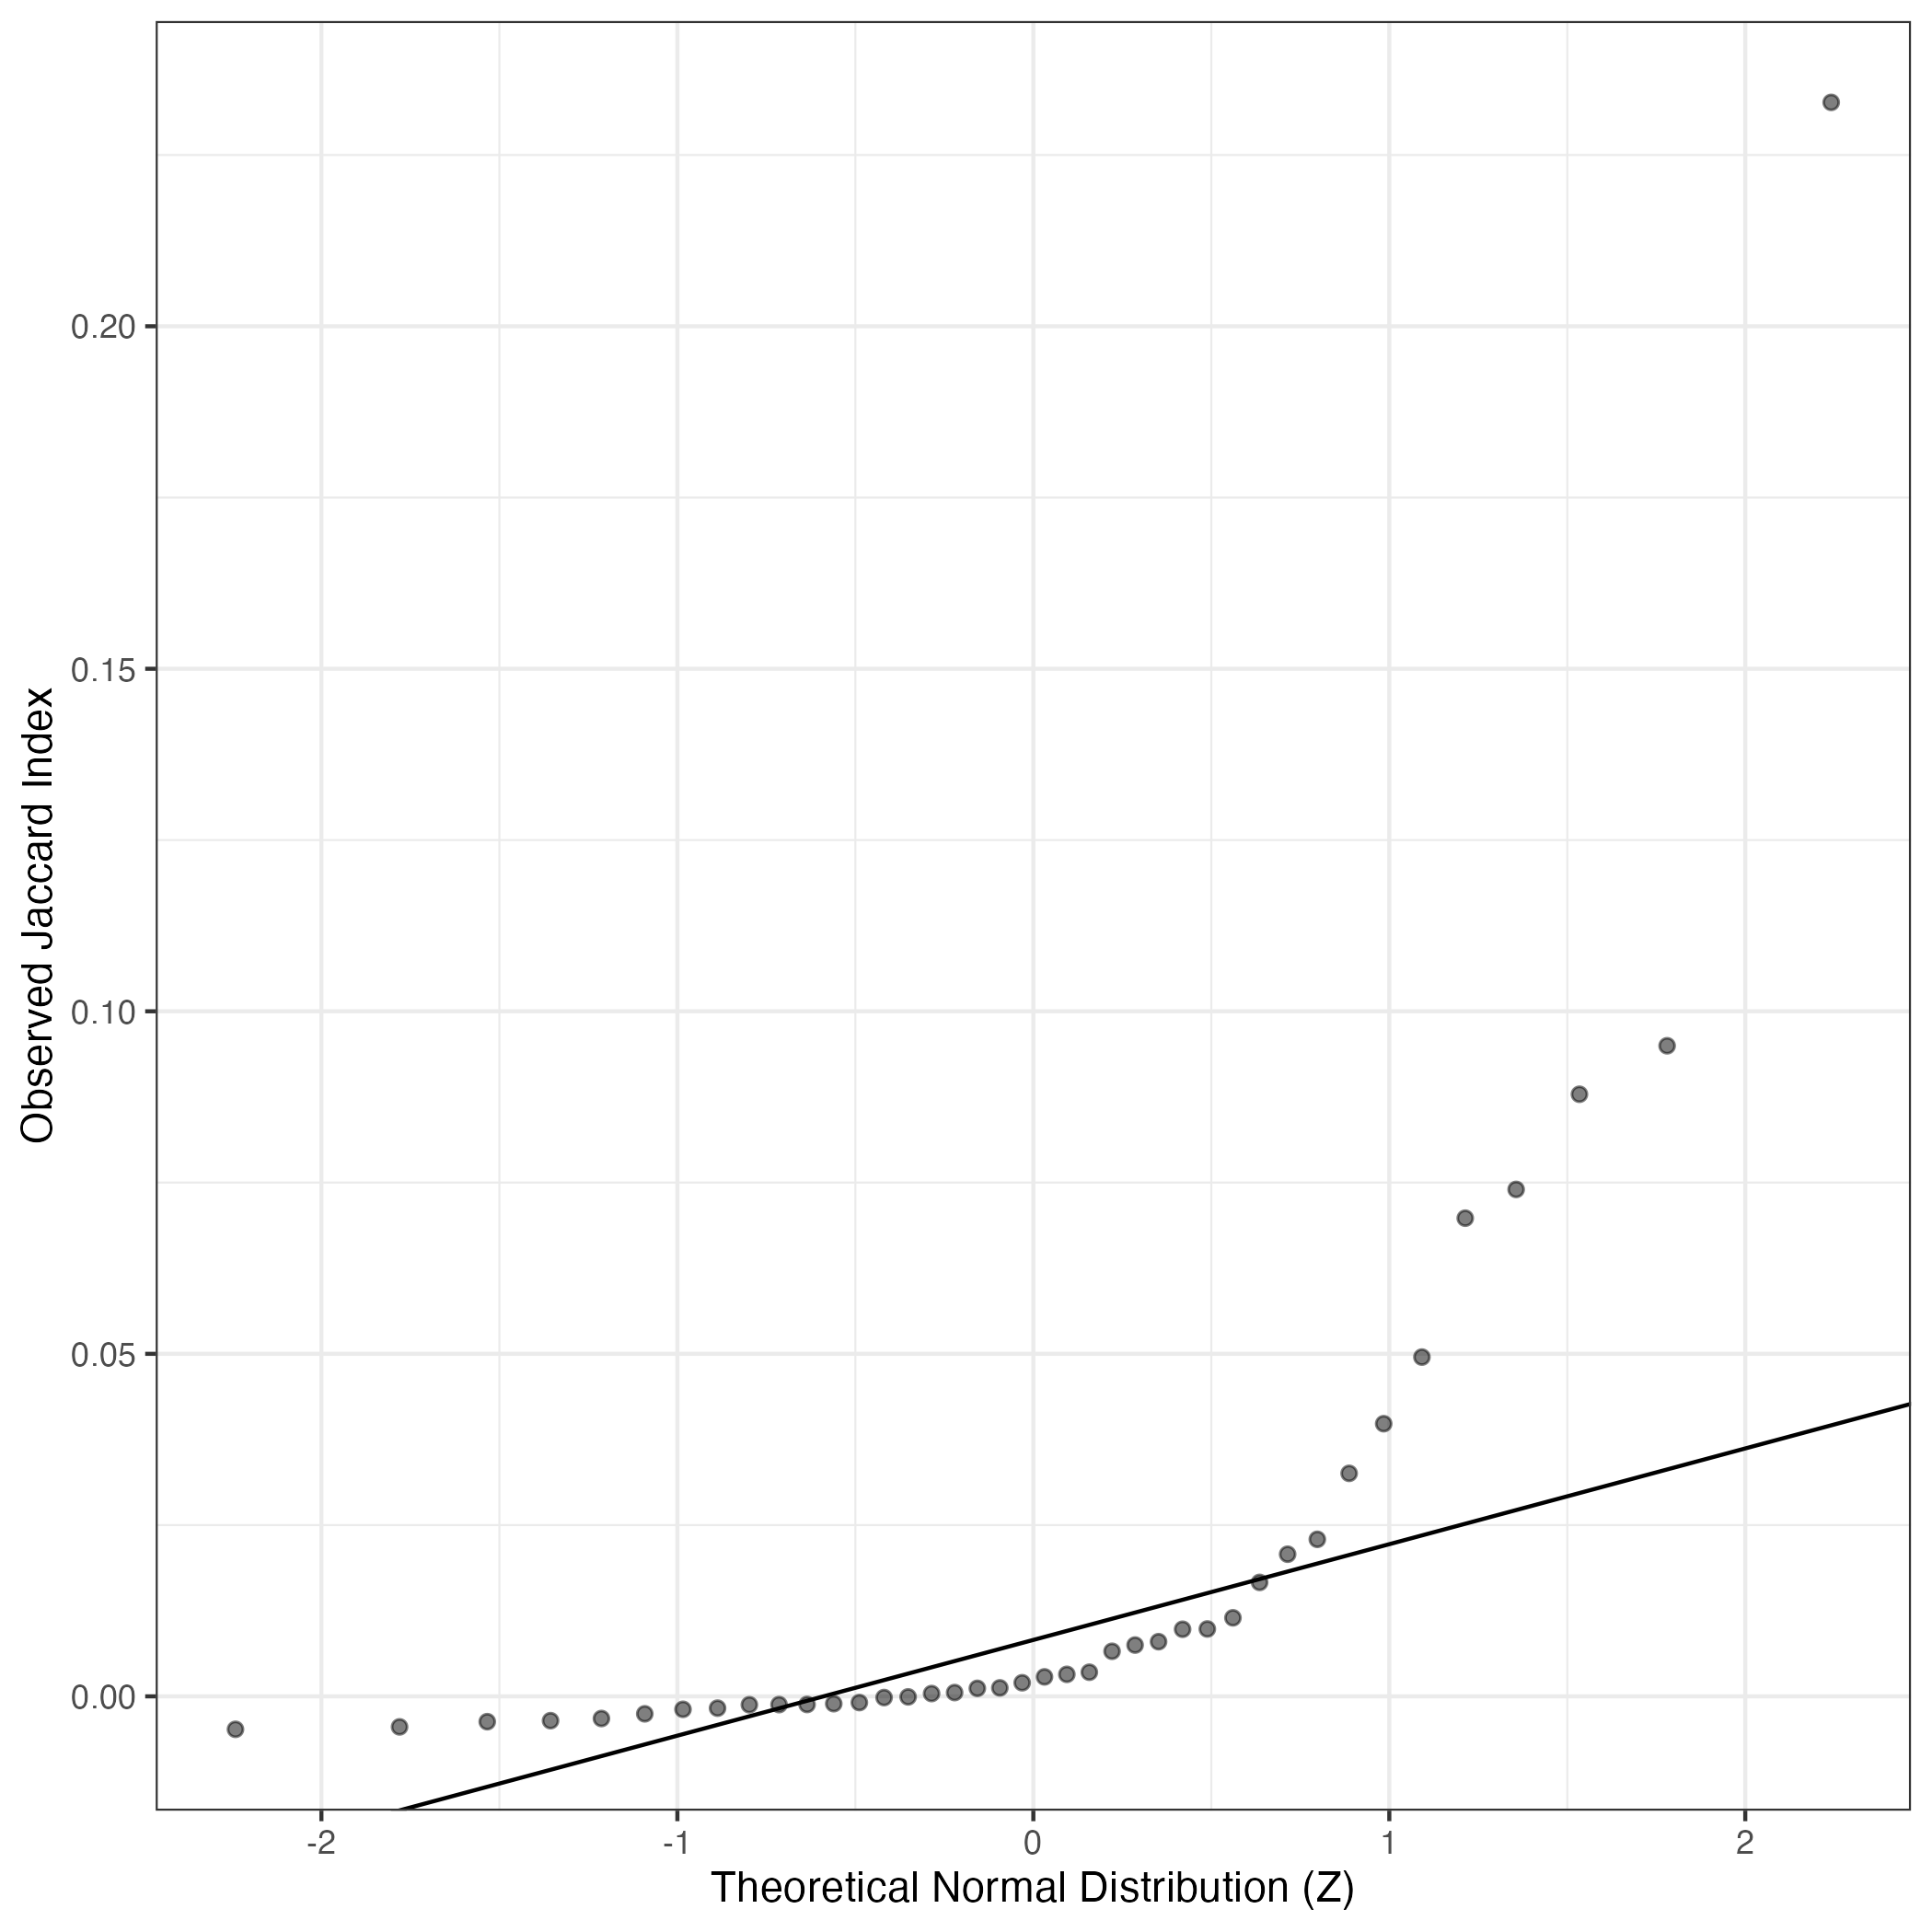
A similar QQ-plot as above, but only for instances where the H value is e.g. > 25, i.e. we are confident that the expression program is active above noise. Agreemenet between these binary vectors is tested using the Jaccard Index, with the P-values calculated by an exact test:
Interactive QQ-plot:
Singler cell type annotations for the top 50 cells on this program.
| Cell ID | Singler label | Singler Delta | Activity Score | Top Singler Raw Scores |
|---|---|---|---|---|
| T200_TATCGCCAGCTCCGAC-1 | Endothelial_cells:lymphatic:TNFa_48h | 0.20 | 1429.73 | Raw ScoresEndothelial_cells:lymphatic: 0.43, Endothelial_cells:lymphatic:TNFa_48h: 0.43, Endothelial_cells:lymphatic:KSHV: 0.38, Endothelial_cells:blood_vessel: 0.38, Endothelial_cells:HUVEC:Serum_Amyloid_A: 0.38, Endothelial_cells:HUVEC:B._anthracis_LT: 0.37, Endothelial_cells:HUVEC:FPV-infected: 0.37, Endothelial_cells:HUVEC: 0.37, Endothelial_cells:HUVEC:PR8-infected: 0.37, Endothelial_cells:HUVEC:H5N1-infected: 0.36 |
| T200_GAGATGGGTATGGAAT-1 | Endothelial_cells:lymphatic:TNFa_48h | 0.20 | 1257.91 | Raw ScoresEndothelial_cells:lymphatic:TNFa_48h: 0.44, Endothelial_cells:lymphatic: 0.44, Endothelial_cells:lymphatic:KSHV: 0.4, Endothelial_cells:HUVEC:PR8-infected: 0.4, Endothelial_cells:HUVEC:FPV-infected: 0.4, Endothelial_cells:blood_vessel: 0.4, Endothelial_cells:HUVEC:B._anthracis_LT: 0.39, Endothelial_cells:HUVEC:H5N1-infected: 0.39, Endothelial_cells:HUVEC:Serum_Amyloid_A: 0.39, Endothelial_cells:HUVEC: 0.38 |
| T200_AAGAACAAGGTATCTC-1 | Endothelial_cells:lymphatic:TNFa_48h | 0.16 | 1179.54 | Raw ScoresEndothelial_cells:lymphatic:TNFa_48h: 0.35, Endothelial_cells:lymphatic: 0.34, Endothelial_cells:HUVEC:FPV-infected: 0.33, Endothelial_cells:HUVEC:PR8-infected: 0.33, Endothelial_cells:HUVEC:B._anthracis_LT: 0.33, Endothelial_cells:HUVEC:H5N1-infected: 0.32, Endothelial_cells:HUVEC:IFNg: 0.32, Endothelial_cells:blood_vessel: 0.32, Endothelial_cells:lymphatic:KSHV: 0.32, Endothelial_cells:HUVEC: 0.32 |
| T200_GAATCGTCACAACATC-1 | Endothelial_cells:lymphatic:TNFa_48h | 0.20 | 1146.20 | Raw ScoresEndothelial_cells:lymphatic:TNFa_48h: 0.45, Endothelial_cells:lymphatic: 0.45, Endothelial_cells:HUVEC:PR8-infected: 0.41, Endothelial_cells:HUVEC:FPV-infected: 0.41, Endothelial_cells:HUVEC:B._anthracis_LT: 0.41, Endothelial_cells:HUVEC:H5N1-infected: 0.4, Endothelial_cells:HUVEC:Serum_Amyloid_A: 0.4, Endothelial_cells:lymphatic:KSHV: 0.4, Endothelial_cells:blood_vessel: 0.4, Endothelial_cells:HUVEC: 0.4 |
| T200_TTTGGAGGTAAGTCAA-1 | Endothelial_cells:lymphatic:TNFa_48h | 0.20 | 1145.66 | Raw ScoresEndothelial_cells:lymphatic:TNFa_48h: 0.44, Endothelial_cells:lymphatic: 0.43, Endothelial_cells:lymphatic:KSHV: 0.41, Endothelial_cells:blood_vessel: 0.4, Endothelial_cells:HUVEC:Serum_Amyloid_A: 0.4, Endothelial_cells:HUVEC:B._anthracis_LT: 0.4, Endothelial_cells:HUVEC:PR8-infected: 0.39, Endothelial_cells:HUVEC:FPV-infected: 0.39, Endothelial_cells:HUVEC:H5N1-infected: 0.39, Endothelial_cells:HUVEC: 0.38 |
| T200_TGTGAGTCAGAGACTG-1 | Endothelial_cells:lymphatic:TNFa_48h | 0.20 | 1144.54 | Raw ScoresEndothelial_cells:lymphatic:TNFa_48h: 0.4, Endothelial_cells:lymphatic: 0.4, Endothelial_cells:HUVEC:FPV-infected: 0.35, Endothelial_cells:blood_vessel: 0.35, Endothelial_cells:lymphatic:KSHV: 0.35, Endothelial_cells:HUVEC:PR8-infected: 0.35, Endothelial_cells:HUVEC:B._anthracis_LT: 0.35, Endothelial_cells:HUVEC:H5N1-infected: 0.35, Endothelial_cells:HUVEC:Serum_Amyloid_A: 0.35, Endothelial_cells:HUVEC: 0.34 |
| T200_TGTTCATTCACGACTA-1 | Endothelial_cells:lymphatic:TNFa_48h | 0.18 | 1140.79 | Raw ScoresEndothelial_cells:lymphatic:TNFa_48h: 0.41, Endothelial_cells:lymphatic: 0.4, Endothelial_cells:HUVEC:FPV-infected: 0.38, Endothelial_cells:HUVEC:PR8-infected: 0.38, Endothelial_cells:HUVEC:H5N1-infected: 0.37, Endothelial_cells:lymphatic:KSHV: 0.36, Endothelial_cells:blood_vessel: 0.36, Endothelial_cells:HUVEC:B._anthracis_LT: 0.36, Endothelial_cells:HUVEC: 0.36, Endothelial_cells:HUVEC:IFNg: 0.36 |
| T200_CGAAGGAGTGCATTAC-1 | Endothelial_cells:lymphatic:TNFa_48h | 0.19 | 934.47 | Raw ScoresEndothelial_cells:lymphatic:TNFa_48h: 0.42, Endothelial_cells:lymphatic: 0.42, Endothelial_cells:lymphatic:KSHV: 0.39, Endothelial_cells:HUVEC:FPV-infected: 0.38, Endothelial_cells:HUVEC:PR8-infected: 0.38, Endothelial_cells:blood_vessel: 0.38, Endothelial_cells:HUVEC:H5N1-infected: 0.37, Endothelial_cells:HUVEC:B._anthracis_LT: 0.37, Endothelial_cells:HUVEC:Serum_Amyloid_A: 0.36, Endothelial_cells:HUVEC:IFNg: 0.36 |
| T200_GGCGTCATCAGGAGAC-1 | Endothelial_cells:lymphatic | 0.17 | 856.99 | Raw ScoresEndothelial_cells:lymphatic:TNFa_48h: 0.45, Endothelial_cells:lymphatic: 0.44, Endothelial_cells:lymphatic:KSHV: 0.41, Endothelial_cells:HUVEC:FPV-infected: 0.41, Endothelial_cells:HUVEC:PR8-infected: 0.4, Endothelial_cells:blood_vessel: 0.4, Endothelial_cells:HUVEC:B._anthracis_LT: 0.4, Endothelial_cells:HUVEC:H5N1-infected: 0.4, Endothelial_cells:HUVEC:Serum_Amyloid_A: 0.39, Endothelial_cells:HUVEC: 0.39 |
| T230_TGTTGAGCAAATGATG-1 | Endothelial_cells:HUVEC:Borrelia_burgdorferi | 0.15 | 751.98 | Raw ScoresEndothelial_cells:lymphatic: 0.42, Endothelial_cells:lymphatic:TNFa_48h: 0.42, Endothelial_cells:HUVEC: 0.42, Endothelial_cells:HUVEC:VEGF: 0.42, Endothelial_cells:HUVEC:Serum_Amyloid_A: 0.42, Endothelial_cells:HUVEC:IFNg: 0.41, Endothelial_cells:HUVEC:B._anthracis_LT: 0.41, Endothelial_cells:HUVEC:H5N1-infected: 0.41, Endothelial_cells:HUVEC:PR8-infected: 0.41, Endothelial_cells:HUVEC:Borrelia_burgdorferi: 0.41 |
| T200_CGCCAGATCATAGACC-1 | Endothelial_cells:lymphatic:TNFa_48h | 0.16 | 632.25 | Raw ScoresEndothelial_cells:lymphatic:TNFa_48h: 0.4, Endothelial_cells:lymphatic: 0.39, Endothelial_cells:HUVEC:FPV-infected: 0.38, Endothelial_cells:HUVEC:PR8-infected: 0.37, Endothelial_cells:lymphatic:KSHV: 0.36, Endothelial_cells:HUVEC:H5N1-infected: 0.36, Endothelial_cells:HUVEC:IFNg: 0.36, Endothelial_cells:blood_vessel: 0.36, Endothelial_cells:HUVEC:B._anthracis_LT: 0.36, Endothelial_cells:HUVEC:Borrelia_burgdorferi: 0.36 |
| T214_GGGCTACTCACATACG-1 | Neurons:adrenal_medulla_cell_line | 0.10 | 608.02 | Raw ScoresEndothelial_cells:lymphatic:TNFa_48h: 0.36, Endothelial_cells:lymphatic: 0.35, Endothelial_cells:lymphatic:KSHV: 0.33, Endothelial_cells:HUVEC:Serum_Amyloid_A: 0.33, Endothelial_cells:blood_vessel: 0.33, Endothelial_cells:HUVEC:FPV-infected: 0.32, Endothelial_cells:HUVEC: 0.32, Endothelial_cells:HUVEC:IL-1b: 0.32, Endothelial_cells:HUVEC:B._anthracis_LT: 0.32, Endothelial_cells:HUVEC:PR8-infected: 0.32 |
| T200_ACAAGCTGTAGGTCAG-1 | Endothelial_cells:lymphatic:TNFa_48h | 0.20 | 580.91 | Raw ScoresEndothelial_cells:lymphatic:TNFa_48h: 0.46, Endothelial_cells:lymphatic: 0.45, Endothelial_cells:lymphatic:KSHV: 0.43, Endothelial_cells:blood_vessel: 0.42, Endothelial_cells:HUVEC:Serum_Amyloid_A: 0.42, Endothelial_cells:HUVEC:FPV-infected: 0.41, Endothelial_cells:HUVEC:PR8-infected: 0.41, Endothelial_cells:HUVEC: 0.41, Endothelial_cells:HUVEC:H5N1-infected: 0.41, Endothelial_cells:HUVEC:IL-1b: 0.41 |
| T19_GGACGTCCACGGATAG.1 | Endothelial_cells:lymphatic:TNFa_48h | 0.14 | 579.35 | Raw ScoresEndothelial_cells:lymphatic:TNFa_48h: 0.38, Endothelial_cells:lymphatic: 0.37, Endothelial_cells:blood_vessel: 0.34, Endothelial_cells:lymphatic:KSHV: 0.34, Endothelial_cells:HUVEC:PR8-infected: 0.34, Endothelial_cells:HUVEC:FPV-infected: 0.34, Endothelial_cells:HUVEC:IFNg: 0.33, Endothelial_cells:HUVEC:B._anthracis_LT: 0.33, Endothelial_cells:HUVEC:Borrelia_burgdorferi: 0.33, Endothelial_cells:HUVEC:H5N1-infected: 0.33 |
| T200_AAGACTCTCTCTCTAA-1 | Endothelial_cells:lymphatic:TNFa_48h | 0.17 | 518.30 | Raw ScoresEndothelial_cells:lymphatic:TNFa_48h: 0.42, Endothelial_cells:lymphatic: 0.41, Endothelial_cells:lymphatic:KSHV: 0.4, Endothelial_cells:blood_vessel: 0.39, Endothelial_cells:HUVEC:PR8-infected: 0.38, Endothelial_cells:HUVEC:Serum_Amyloid_A: 0.38, Endothelial_cells:HUVEC:FPV-infected: 0.38, Endothelial_cells:HUVEC:B._anthracis_LT: 0.37, Endothelial_cells:HUVEC:IL-1b: 0.37, Endothelial_cells:HUVEC: 0.37 |
| T175_CCACACTCAGCGTGCT-1 | Endothelial_cells:lymphatic | 0.15 | 515.28 | Raw ScoresEndothelial_cells:lymphatic:TNFa_48h: 0.34, Endothelial_cells:lymphatic: 0.34, Endothelial_cells:lymphatic:KSHV: 0.31, Endothelial_cells:blood_vessel: 0.31, Endothelial_cells:HUVEC:Serum_Amyloid_A: 0.3, Endothelial_cells:HUVEC:FPV-infected: 0.3, Endothelial_cells:HUVEC:B._anthracis_LT: 0.3, Endothelial_cells:HUVEC: 0.3, Endothelial_cells:HUVEC:VEGF: 0.3, Endothelial_cells:HUVEC:PR8-infected: 0.29 |
| T19_AGGTCATAGGCATGGT.1 | Endothelial_cells:lymphatic | 0.10 | 487.90 | Raw ScoresEndothelial_cells:lymphatic:TNFa_48h: 0.31, Endothelial_cells:lymphatic: 0.31, Endothelial_cells:HUVEC:IFNg: 0.29, Endothelial_cells:blood_vessel: 0.29, Endothelial_cells:HUVEC:Borrelia_burgdorferi: 0.29, Endothelial_cells:lymphatic:KSHV: 0.29, Endothelial_cells:HUVEC:PR8-infected: 0.28, Endothelial_cells:HUVEC: 0.28, Endothelial_cells:HUVEC:FPV-infected: 0.28, Endothelial_cells:HUVEC:H5N1-infected: 0.28 |
| T200_GAAATGATCATTCACT-1 | Endothelial_cells:lymphatic:TNFa_48h | 0.16 | 472.60 | Raw ScoresEndothelial_cells:lymphatic:TNFa_48h: 0.43, Endothelial_cells:lymphatic: 0.42, Endothelial_cells:lymphatic:KSHV: 0.41, Endothelial_cells:blood_vessel: 0.4, Endothelial_cells:HUVEC:FPV-infected: 0.4, Endothelial_cells:HUVEC:PR8-infected: 0.39, Endothelial_cells:HUVEC:H5N1-infected: 0.39, Endothelial_cells:HUVEC: 0.39, Endothelial_cells:HUVEC:Serum_Amyloid_A: 0.39, Endothelial_cells:HUVEC:IL-1b: 0.39 |
| T200_ACTGTGAGTGCTGTCG-1 | Endothelial_cells:blood_vessel | 0.20 | 449.91 | Raw ScoresEndothelial_cells:lymphatic:TNFa_48h: 0.42, Endothelial_cells:lymphatic:KSHV: 0.42, Endothelial_cells:blood_vessel: 0.42, Endothelial_cells:HUVEC:FPV-infected: 0.41, Endothelial_cells:lymphatic: 0.41, Endothelial_cells:HUVEC:PR8-infected: 0.41, Endothelial_cells:HUVEC:Serum_Amyloid_A: 0.41, Endothelial_cells:HUVEC:B._anthracis_LT: 0.41, Endothelial_cells:HUVEC:H5N1-infected: 0.4, Endothelial_cells:HUVEC: 0.39 |
| T200_GTGTCCTGTGGTCTAT-1 | Endothelial_cells:lymphatic:TNFa_48h | 0.18 | 430.33 | Raw ScoresEndothelial_cells:lymphatic:TNFa_48h: 0.43, Endothelial_cells:lymphatic: 0.42, Endothelial_cells:lymphatic:KSHV: 0.41, Endothelial_cells:blood_vessel: 0.4, Endothelial_cells:HUVEC:FPV-infected: 0.39, Endothelial_cells:HUVEC:PR8-infected: 0.39, Endothelial_cells:HUVEC:B._anthracis_LT: 0.38, Endothelial_cells:HUVEC:Serum_Amyloid_A: 0.38, Endothelial_cells:HUVEC:H5N1-infected: 0.38, Endothelial_cells:HUVEC: 0.38 |
| T200_GGGTCTGGTCCCTGAG-1 | Endothelial_cells:lymphatic:TNFa_48h | 0.19 | 428.26 | Raw ScoresEndothelial_cells:lymphatic:TNFa_48h: 0.44, Endothelial_cells:lymphatic: 0.44, Endothelial_cells:HUVEC:IFNg: 0.41, Endothelial_cells:HUVEC:PR8-infected: 0.41, Endothelial_cells:lymphatic:KSHV: 0.4, Endothelial_cells:blood_vessel: 0.4, Endothelial_cells:HUVEC:B._anthracis_LT: 0.4, Endothelial_cells:HUVEC:H5N1-infected: 0.4, Endothelial_cells:HUVEC:Serum_Amyloid_A: 0.4, Endothelial_cells:HUVEC:FPV-infected: 0.39 |
| T200_GTGTCCTGTTAGCTAC-1 | Endothelial_cells:lymphatic:TNFa_48h | 0.20 | 415.75 | Raw ScoresEndothelial_cells:lymphatic:TNFa_48h: 0.44, Endothelial_cells:lymphatic: 0.43, Endothelial_cells:HUVEC:IFNg: 0.42, Endothelial_cells:HUVEC:PR8-infected: 0.41, Endothelial_cells:blood_vessel: 0.4, Endothelial_cells:HUVEC:B._anthracis_LT: 0.4, Endothelial_cells:HUVEC:VEGF: 0.4, Endothelial_cells:HUVEC:Serum_Amyloid_A: 0.4, Endothelial_cells:HUVEC: 0.4, Endothelial_cells:HUVEC:H5N1-infected: 0.4 |
| T230_AGGTTGTCACCTCTGT-1 | Endothelial_cells:HUVEC:IFNg | 0.20 | 365.32 | Raw ScoresEndothelial_cells:HUVEC:IFNg: 0.44, Endothelial_cells:lymphatic:TNFa_48h: 0.41, Endothelial_cells:HUVEC:PR8-infected: 0.41, Endothelial_cells:HUVEC:B._anthracis_LT: 0.41, Endothelial_cells:lymphatic: 0.4, Endothelial_cells:HUVEC:Borrelia_burgdorferi: 0.4, Endothelial_cells:HUVEC:H5N1-infected: 0.4, Endothelial_cells:HUVEC:FPV-infected: 0.39, Endothelial_cells:blood_vessel: 0.39, Endothelial_cells:HUVEC: 0.39 |
| T19_GGGTTGCTCTTAGCCC.1 | Endothelial_cells:lymphatic:TNFa_48h | 0.11 | 353.95 | Raw ScoresEndothelial_cells:lymphatic:TNFa_48h: 0.32, Endothelial_cells:lymphatic: 0.31, Endothelial_cells:HUVEC:IFNg: 0.29, Endothelial_cells:blood_vessel: 0.29, Endothelial_cells:lymphatic:KSHV: 0.29, Endothelial_cells:HUVEC:Borrelia_burgdorferi: 0.29, Endothelial_cells:HUVEC:FPV-infected: 0.29, Endothelial_cells:HUVEC:PR8-infected: 0.28, Endothelial_cells:HUVEC:B._anthracis_LT: 0.28, Endothelial_cells:HUVEC: 0.28 |
| T230_ATCCGTCGTAACAGGC-1 | Endothelial_cells:HUVEC:Borrelia_burgdorferi | 0.18 | 299.10 | Raw ScoresEndothelial_cells:HUVEC:IFNg: 0.43, Endothelial_cells:HUVEC:Borrelia_burgdorferi: 0.42, Endothelial_cells:lymphatic:TNFa_48h: 0.42, Endothelial_cells:lymphatic: 0.42, Endothelial_cells:HUVEC:VEGF: 0.42, Endothelial_cells:HUVEC: 0.42, Endothelial_cells:HUVEC:Serum_Amyloid_A: 0.41, Endothelial_cells:HUVEC:H5N1-infected: 0.41, Endothelial_cells:HUVEC:FPV-infected: 0.41, Endothelial_cells:HUVEC:B._anthracis_LT: 0.41 |
| T200_TTCTCTCTCTCCGATC-1 | Endothelial_cells:blood_vessel | 0.19 | 222.00 | Raw ScoresEndothelial_cells:lymphatic:TNFa_48h: 0.44, Endothelial_cells:lymphatic: 0.43, Endothelial_cells:blood_vessel: 0.43, Endothelial_cells:lymphatic:KSHV: 0.43, Endothelial_cells:HUVEC:Serum_Amyloid_A: 0.42, Endothelial_cells:HUVEC:PR8-infected: 0.41, Endothelial_cells:HUVEC:B._anthracis_LT: 0.41, Endothelial_cells:HUVEC:FPV-infected: 0.4, Endothelial_cells:HUVEC:H5N1-infected: 0.4, Endothelial_cells:HUVEC: 0.4 |
| T200_GGTGAAGCAACAGCCC-1 | Endothelial_cells:blood_vessel | 0.17 | 180.15 | Raw ScoresEndothelial_cells:lymphatic:TNFa_48h: 0.39, Endothelial_cells:lymphatic:KSHV: 0.39, Endothelial_cells:blood_vessel: 0.38, Endothelial_cells:lymphatic: 0.38, Endothelial_cells:HUVEC:FPV-infected: 0.37, Endothelial_cells:HUVEC:B._anthracis_LT: 0.37, Endothelial_cells:HUVEC:PR8-infected: 0.37, Endothelial_cells:HUVEC:Serum_Amyloid_A: 0.37, Endothelial_cells:HUVEC: 0.36, Endothelial_cells:HUVEC:H5N1-infected: 0.36 |
| T200_CATCCCAGTGCCGAAA-1 | Endothelial_cells:HUVEC:FPV-infected | 0.12 | 165.28 | Raw ScoresEndothelial_cells:lymphatic:TNFa_48h: 0.37, Endothelial_cells:blood_vessel: 0.37, Endothelial_cells:lymphatic:KSHV: 0.37, Endothelial_cells:HUVEC:Serum_Amyloid_A: 0.36, Endothelial_cells:lymphatic: 0.36, Endothelial_cells:HUVEC:FPV-infected: 0.36, Endothelial_cells:HUVEC:PR8-infected: 0.36, Endothelial_cells:HUVEC:B._anthracis_LT: 0.35, Endothelial_cells:HUVEC: 0.35, Endothelial_cells:HUVEC:H5N1-infected: 0.35 |
| T69_AGCCTAAAGGAATCGC.1 | Endothelial_cells:HUVEC:Borrelia_burgdorferi | 0.13 | 164.05 | Raw ScoresEndothelial_cells:HUVEC:H5N1-infected: 0.35, Endothelial_cells:HUVEC:IFNg: 0.35, Endothelial_cells:HUVEC:PR8-infected: 0.35, Endothelial_cells:HUVEC:FPV-infected: 0.35, Endothelial_cells:HUVEC: 0.35, Endothelial_cells:HUVEC:Borrelia_burgdorferi: 0.35, Endothelial_cells:lymphatic:TNFa_48h: 0.34, Endothelial_cells:HUVEC:VEGF: 0.34, Endothelial_cells:HUVEC:B._anthracis_LT: 0.34, Endothelial_cells:lymphatic: 0.34 |
| T200_AGTTAGCGTGCAATGG-1 | Endothelial_cells:lymphatic:TNFa_48h | 0.19 | 155.04 | Raw ScoresEndothelial_cells:lymphatic:TNFa_48h: 0.43, Endothelial_cells:lymphatic: 0.43, Endothelial_cells:blood_vessel: 0.42, Endothelial_cells:lymphatic:KSHV: 0.42, Endothelial_cells:HUVEC:B._anthracis_LT: 0.41, Endothelial_cells:HUVEC:PR8-infected: 0.4, Endothelial_cells:HUVEC:IFNg: 0.4, Endothelial_cells:HUVEC:Serum_Amyloid_A: 0.4, Endothelial_cells:HUVEC:FPV-infected: 0.4, Endothelial_cells:HUVEC:H5N1-infected: 0.39 |
| T200_CAACCAAGTAGACACG-1 | Endothelial_cells:lymphatic:TNFa_48h | 0.13 | 154.68 | Raw ScoresEndothelial_cells:lymphatic:TNFa_48h: 0.41, Endothelial_cells:HUVEC:IFNg: 0.41, Endothelial_cells:blood_vessel: 0.41, Endothelial_cells:lymphatic: 0.4, Endothelial_cells:lymphatic:KSHV: 0.4, Endothelial_cells:HUVEC:PR8-infected: 0.39, Endothelial_cells:HUVEC:Borrelia_burgdorferi: 0.39, Endothelial_cells:HUVEC:B._anthracis_LT: 0.39, Endothelial_cells:HUVEC:Serum_Amyloid_A: 0.38, Endothelial_cells:HUVEC: 0.38 |
| T19_GAAACTCGTCAACTGT.1 | Endothelial_cells:blood_vessel | 0.10 | 150.58 | Raw ScoresEndothelial_cells:lymphatic:TNFa_48h: 0.33, Endothelial_cells:lymphatic: 0.32, Endothelial_cells:blood_vessel: 0.32, Endothelial_cells:HUVEC:IFNg: 0.31, Endothelial_cells:HUVEC:FPV-infected: 0.31, Endothelial_cells:lymphatic:KSHV: 0.31, Endothelial_cells:HUVEC:B._anthracis_LT: 0.31, Endothelial_cells:HUVEC:PR8-infected: 0.31, Endothelial_cells:HUVEC: 0.31, Endothelial_cells:HUVEC:Borrelia_burgdorferi: 0.3 |
| T69_CAGATCACAGTATCTG.1 | Neutrophil:commensal_E._coli_MG1655 | 0.08 | 133.47 | Raw ScoresMonocyte:S._typhimurium_flagellin: 0.31, Macrophage:monocyte-derived:M-CSF/Pam3Cys: 0.31, Macrophage:monocyte-derived:M-CSF/IFNg/Pam3Cys: 0.3, Monocyte:CD16-: 0.3, DC:monocyte-derived:A._fumigatus_germ_tubes_6h: 0.3, Monocyte:anti-FcgRIIB: 0.3, Monocyte:CD14+: 0.29, Monocyte: 0.29, Monocyte:leukotriene_D4: 0.29, DC:monocyte-derived:antiCD40/VAF347: 0.29 |
| T200_TGTGATGTCCAGTGTA-1 | Endothelial_cells:HUVEC:IFNg | 0.12 | 128.45 | Raw ScoresEndothelial_cells:HUVEC:IFNg: 0.33, Endothelial_cells:HUVEC:B._anthracis_LT: 0.32, Endothelial_cells:lymphatic:TNFa_48h: 0.32, Endothelial_cells:HUVEC:PR8-infected: 0.32, Endothelial_cells:HUVEC:FPV-infected: 0.32, Endothelial_cells:lymphatic: 0.32, Endothelial_cells:HUVEC:H5N1-infected: 0.32, Endothelial_cells:HUVEC: 0.31, Endothelial_cells:HUVEC:Borrelia_burgdorferi: 0.31, Endothelial_cells:blood_vessel: 0.31 |
| T200_CAATTTCGTATGAGAT-1 | Neurons:adrenal_medulla_cell_line | 0.06 | 121.35 | Raw ScoresEndothelial_cells:lymphatic:TNFa_48h: 0.27, Endothelial_cells:lymphatic:KSHV: 0.26, Endothelial_cells:lymphatic: 0.26, Endothelial_cells:HUVEC:Serum_Amyloid_A: 0.26, Endothelial_cells:blood_vessel: 0.26, Endothelial_cells:HUVEC:FPV-infected: 0.26, Endothelial_cells:HUVEC:PR8-infected: 0.26, Endothelial_cells:HUVEC: 0.26, Endothelial_cells:HUVEC:B._anthracis_LT: 0.26, Endothelial_cells:HUVEC:IL-1b: 0.25 |
| T200_AGACAGGTCACACCGG-1 | Endothelial_cells:blood_vessel | 0.16 | 119.69 | Raw ScoresEndothelial_cells:lymphatic:TNFa_48h: 0.43, Endothelial_cells:lymphatic: 0.42, Endothelial_cells:lymphatic:KSHV: 0.42, Endothelial_cells:blood_vessel: 0.41, Endothelial_cells:HUVEC:PR8-infected: 0.4, Endothelial_cells:HUVEC:B._anthracis_LT: 0.4, Endothelial_cells:HUVEC:IFNg: 0.39, Endothelial_cells:HUVEC:FPV-infected: 0.39, Endothelial_cells:HUVEC:H5N1-infected: 0.39, Endothelial_cells:HUVEC:Serum_Amyloid_A: 0.38 |
| T200_TACGGTACAGGAAGTC-1 | Neurons:adrenal_medulla_cell_line | 0.06 | 119.32 | Raw ScoresEndothelial_cells:lymphatic:TNFa_48h: 0.26, Endothelial_cells:lymphatic: 0.25, Endothelial_cells:lymphatic:KSHV: 0.25, Endothelial_cells:blood_vessel: 0.24, Endothelial_cells:HUVEC:Serum_Amyloid_A: 0.24, Endothelial_cells:HUVEC:PR8-infected: 0.24, Endothelial_cells:HUVEC:IL-1b: 0.23, Endothelial_cells:HUVEC: 0.23, Neurons:adrenal_medulla_cell_line: 0.23, Endothelial_cells:HUVEC:FPV-infected: 0.23 |
| T200_GTGCAGCGTGATGAAT-1 | Endothelial_cells:lymphatic:TNFa_48h | 0.17 | 118.20 | Raw ScoresEndothelial_cells:lymphatic:TNFa_48h: 0.42, Endothelial_cells:lymphatic:KSHV: 0.42, Endothelial_cells:lymphatic: 0.41, Endothelial_cells:blood_vessel: 0.41, Endothelial_cells:HUVEC:PR8-infected: 0.4, Endothelial_cells:HUVEC:FPV-infected: 0.4, Endothelial_cells:HUVEC:Serum_Amyloid_A: 0.4, Endothelial_cells:HUVEC:B._anthracis_LT: 0.39, Endothelial_cells:HUVEC: 0.39, Endothelial_cells:HUVEC:H5N1-infected: 0.39 |
| T214_AACCAACGTTCCCAAA-1 | Endothelial_cells:lymphatic:TNFa_48h | 0.21 | 113.98 | Raw ScoresEndothelial_cells:lymphatic:TNFa_48h: 0.43, Endothelial_cells:lymphatic:KSHV: 0.43, Endothelial_cells:HUVEC:Serum_Amyloid_A: 0.42, Endothelial_cells:HUVEC: 0.41, Endothelial_cells:HUVEC:IL-1b: 0.41, Endothelial_cells:blood_vessel: 0.41, Endothelial_cells:HUVEC:PR8-infected: 0.4, Endothelial_cells:lymphatic: 0.4, Endothelial_cells:HUVEC:VEGF: 0.4, Endothelial_cells:HUVEC:FPV-infected: 0.4 |
| T200_CAAGAGGTCTCCACTG-1 | Endothelial_cells:lymphatic | 0.08 | 107.20 | Raw ScoresEndothelial_cells:lymphatic:TNFa_48h: 0.3, Endothelial_cells:HUVEC:FPV-infected: 0.3, Endothelial_cells:lymphatic: 0.29, Endothelial_cells:HUVEC:PR8-infected: 0.29, Endothelial_cells:HUVEC:H5N1-infected: 0.29, Endothelial_cells:HUVEC:B._anthracis_LT: 0.29, Endothelial_cells:blood_vessel: 0.28, Endothelial_cells:lymphatic:KSHV: 0.28, Endothelial_cells:HUVEC: 0.28, Endothelial_cells:HUVEC:IFNg: 0.28 |
| T69_GGGATGACATTCCTGC.1 | Endothelial_cells:HUVEC:IFNg | 0.10 | 104.27 | Raw ScoresEndothelial_cells:HUVEC:IFNg: 0.26, Endothelial_cells:lymphatic: 0.26, Endothelial_cells:HUVEC:Borrelia_burgdorferi: 0.26, Endothelial_cells:lymphatic:TNFa_48h: 0.26, Endothelial_cells:HUVEC:PR8-infected: 0.26, Endothelial_cells:HUVEC:H5N1-infected: 0.26, Endothelial_cells:HUVEC:VEGF: 0.25, Endothelial_cells:HUVEC: 0.25, Endothelial_cells:HUVEC:FPV-infected: 0.25, Endothelial_cells:HUVEC:B._anthracis_LT: 0.25 |
| T19_CCTTTCTGTAGAAGGA.1 | Endothelial_cells:lymphatic:TNFa_48h | 0.14 | 102.10 | Raw ScoresEndothelial_cells:lymphatic:TNFa_48h: 0.4, Endothelial_cells:lymphatic: 0.4, Endothelial_cells:blood_vessel: 0.38, Endothelial_cells:HUVEC:IFNg: 0.38, Endothelial_cells:HUVEC:B._anthracis_LT: 0.37, Endothelial_cells:HUVEC:PR8-infected: 0.37, Endothelial_cells:lymphatic:KSHV: 0.37, Endothelial_cells:HUVEC: 0.37, Endothelial_cells:HUVEC:Borrelia_burgdorferi: 0.37, Endothelial_cells:HUVEC:H5N1-infected: 0.36 |
| T162_CCGCAAGGTGTAGGAC-1 | Smooth_muscle_cells:vascular | 0.17 | 101.20 | Raw ScoresMSC: 0.44, Fibroblasts:foreskin: 0.44, iPS_cells:skin_fibroblast: 0.43, Smooth_muscle_cells:vascular: 0.43, iPS_cells:PDB_fibroblasts: 0.43, Tissue_stem_cells:lipoma-derived_MSC: 0.43, iPS_cells:foreskin_fibrobasts: 0.43, Tissue_stem_cells:adipose-derived_MSC_AM3: 0.43, Smooth_muscle_cells:umbilical_vein: 0.42, Tissue_stem_cells:BM_MSC: 0.42 |
| T200_TCTAACTGTATTGAGA-1 | Endothelial_cells:lymphatic:TNFa_48h | 0.11 | 95.88 | Raw ScoresEndothelial_cells:HUVEC:PR8-infected: 0.34, Endothelial_cells:HUVEC:B._anthracis_LT: 0.33, Endothelial_cells:lymphatic:TNFa_48h: 0.33, Endothelial_cells:HUVEC:H5N1-infected: 0.33, Endothelial_cells:lymphatic: 0.33, Endothelial_cells:HUVEC:IFNg: 0.33, Endothelial_cells:HUVEC:FPV-infected: 0.32, Endothelial_cells:HUVEC:Serum_Amyloid_A: 0.32, Endothelial_cells:HUVEC: 0.32, Endothelial_cells:HUVEC:VEGF: 0.32 |
| T162_TACTGCCCATATCGGT-1 | Macrophage:monocyte-derived:S._aureus | 0.10 | 93.72 | Raw ScoresMacrophage:monocyte-derived: 0.37, Monocyte:MCSF: 0.37, Macrophage:monocyte-derived:S._aureus: 0.37, Macrophage:monocyte-derived:IL-4/cntrl: 0.37, Macrophage:monocyte-derived:IL-4/Dex/TGFb: 0.36, Monocyte:CXCL4: 0.36, Macrophage:monocyte-derived:IL-4/TGFb: 0.36, Macrophage:monocyte-derived:IL-4/Dex/cntrl: 0.36, Macrophage:monocyte-derived:M-CSF: 0.36, DC:monocyte-derived:AEC-conditioned: 0.36 |
| T69_ATGAGGGAGCACAGGT.1 | Endothelial_cells:HUVEC:Borrelia_burgdorferi | 0.08 | 92.98 | Raw ScoresEndothelial_cells:lymphatic: 0.28, Endothelial_cells:HUVEC:PR8-infected: 0.28, Endothelial_cells:lymphatic:TNFa_48h: 0.28, Endothelial_cells:HUVEC:IFNg: 0.28, Endothelial_cells:HUVEC:Borrelia_burgdorferi: 0.28, Endothelial_cells:HUVEC:H5N1-infected: 0.28, Endothelial_cells:HUVEC:FPV-infected: 0.27, Endothelial_cells:HUVEC:B._anthracis_LT: 0.27, Endothelial_cells:blood_vessel: 0.27, Endothelial_cells:HUVEC: 0.27 |
| T200_TTCGGTCGTCAGCTTA-1 | Endothelial_cells:blood_vessel | 0.16 | 91.27 | Raw ScoresEndothelial_cells:lymphatic:TNFa_48h: 0.4, Endothelial_cells:lymphatic:KSHV: 0.39, Endothelial_cells:lymphatic: 0.39, Endothelial_cells:blood_vessel: 0.39, Endothelial_cells:HUVEC:PR8-infected: 0.38, Endothelial_cells:HUVEC:FPV-infected: 0.38, Endothelial_cells:HUVEC:Serum_Amyloid_A: 0.38, Endothelial_cells:HUVEC:B._anthracis_LT: 0.38, Endothelial_cells:HUVEC: 0.38, Endothelial_cells:HUVEC:H5N1-infected: 0.37 |
| T10_TCACAAGGTGTGCCTG.1 | Endothelial_cells:lymphatic:TNFa_48h | 0.13 | 89.32 | Raw ScoresEndothelial_cells:lymphatic:TNFa_48h: 0.35, Endothelial_cells:lymphatic: 0.34, Endothelial_cells:HUVEC:IFNg: 0.33, Endothelial_cells:lymphatic:KSHV: 0.33, Endothelial_cells:blood_vessel: 0.33, Endothelial_cells:HUVEC: 0.33, Endothelial_cells:HUVEC:VEGF: 0.33, Endothelial_cells:HUVEC:Borrelia_burgdorferi: 0.32, Endothelial_cells:HUVEC:B._anthracis_LT: 0.32, Endothelial_cells:HUVEC:IL-1b: 0.32 |
| T69_GCTGGGTTCTCGATGA.1 | Epithelial_cells:bronchial | 0.06 | 87.45 | Raw ScoresEpithelial_cells:bronchial: 0.26, iPS_cells:CRL2097_foreskin-derived:undiff.: 0.25, iPS_cells:adipose_stem_cell-derived:lentiviral: 0.25, iPS_cells:iPS:minicircle-derived: 0.24, iPS_cells:adipose_stem_cell-derived:minicircle-derived: 0.24, iPS_cells:PDB_2lox-22: 0.24, iPS_cells:PDB_2lox-5: 0.24, Embryonic_stem_cells: 0.24, iPS_cells:fibroblast-derived:Direct_del._reprog: 0.24, iPS_cells:CRL2097_foreskin-derived:d20_hepatic_diff: 0.24 |
| T200_GCGGAAAGTCAGTTTG-1 | Endothelial_cells:blood_vessel | 0.15 | 86.64 | Raw ScoresEndothelial_cells:lymphatic:TNFa_48h: 0.38, Endothelial_cells:lymphatic:KSHV: 0.38, Endothelial_cells:blood_vessel: 0.37, Endothelial_cells:lymphatic: 0.37, Endothelial_cells:HUVEC:Serum_Amyloid_A: 0.36, Endothelial_cells:HUVEC:PR8-infected: 0.36, Endothelial_cells:HUVEC:FPV-infected: 0.36, Endothelial_cells:HUVEC:B._anthracis_LT: 0.36, Endothelial_cells:HUVEC: 0.35, Endothelial_cells:HUVEC:H5N1-infected: 0.35 |
Below shows the significant enrichments of this GEP for literature curated gene lists
This data was procured from existing single cell RNA-seq maps of neuroblastoma or related relevant data.
High ranks indicate this gene is a driver of this GEP.
These curated gene list are ranked by the P-value (on this GEP) of their constituent genes.
The Mean Count column shows the mean read count in cells scoring highly (H > 50) on this gene expression program.
Bridge region mesenchymal-SCP transition (Olsen)
As above but for cells in the mesenchymal transitioning to SCP region:
Wilcoxon ranksum test P-value for gene set overrepresentation: 1.93e-03
Mean rank of genes in gene set: 232.67
Rank on gene expression program of genes in gene set:
| Genes | Weight | Rank | GTEx | DepMap | Decartes | Mean.Counts | Mean.TPM |
|---|---|---|---|---|---|---|---|
| S100A10 | 0.0037802 | 87 | GTEx | DepMap | Descartes | 12.86 | 4524.29 |
| IFITM3 | 0.0027403 | 138 | GTEx | DepMap | Descartes | 21.59 | 6196.78 |
| B2M | 0.0011368 | 473 | GTEx | DepMap | Descartes | 112.36 | 9441.38 |
Endothelial subclusters 2-6 (Hanemaaijer)
Marker genes obtained from Supplementary Table SD of Hanemaaijer et al (PMID 33500353). The authors generated single-cell RNA-seq data (sort-seq, 2,229 cells total) from mouse adrenal glads at E13.5, E14.5, E17.5, E18.5, P1 and P5. These were marker genes that matched with a similar dataset generated by Furlan et al (PMID 28684471). This particular set of markers are for Various endothelial subclusters of Endothelium clusters:
Wilcoxon ranksum test P-value for gene set overrepresentation: 3.48e-03
Mean rank of genes in gene set: 4090.45
Rank on gene expression program of genes in gene set:
| Genes | Weight | Rank | GTEx | DepMap | Decartes | Mean.Counts | Mean.TPM |
|---|---|---|---|---|---|---|---|
| TM4SF1 | 0.0096657 | 19 | GTEx | DepMap | Descartes | 6.66 | 549.27 |
| GJA1 | 0.0069317 | 37 | GTEx | DepMap | Descartes | 1.69 | 112.25 |
| HES1 | 0.0035375 | 95 | GTEx | DepMap | Descartes | 2.65 | 419.36 |
| SPRY1 | 0.0023675 | 176 | GTEx | DepMap | Descartes | 3.78 | 317.67 |
| THBD | 0.0019809 | 240 | GTEx | DepMap | Descartes | 0.68 | 40.16 |
| DUSP6 | 0.0017865 | 270 | GTEx | DepMap | Descartes | 2.64 | 138.32 |
| FBLN2 | 0.0014642 | 351 | GTEx | DepMap | Descartes | 0.41 | 14.54 |
| JAG1 | 0.0007404 | 737 | GTEx | DepMap | Descartes | 0.61 | 30.51 |
| RHOB | 0.0006409 | 860 | GTEx | DepMap | Descartes | 4.69 | 417.03 |
| SHROOM2 | 0.0003374 | 1574 | GTEx | DepMap | Descartes | 0.09 | 2.76 |
| CLIC4 | 0.0003298 | 1614 | GTEx | DepMap | Descartes | 1.28 | 61.79 |
| FAM102A | 0.0002873 | 1821 | GTEx | DepMap | Descartes | 0.18 | 7.63 |
| MARCKSL1 | 0.0000636 | 3954 | GTEx | DepMap | Descartes | 8.96 | 1068.82 |
| LFNG | -0.0000231 | 6102 | GTEx | DepMap | Descartes | 0.09 | 8.28 |
| IVNS1ABP | -0.0000825 | 8482 | GTEx | DepMap | Descartes | 1.19 | 52.35 |
| ADAMTS1 | -0.0000937 | 8908 | GTEx | DepMap | Descartes | 0.50 | 21.65 |
| MCF2L | -0.0001493 | 10527 | GTEx | DepMap | Descartes | 0.32 | 7.95 |
| CDK1 | -0.0001829 | 11228 | GTEx | DepMap | Descartes | 0.12 | 11.79 |
| MECOM | -0.0003351 | 12301 | GTEx | DepMap | Descartes | 0.35 | 11.65 |
| IGFBP3 | -0.0005483 | 12513 | GTEx | DepMap | Descartes | 1.46 | 86.02 |
Vascular (Kildisiute)
Vascular markers obtained from Kildisiute et al, Supplmenentary Table 2, references supporting these genes are provided in Supp Table S2 of Kildisiute et al (PMID 33547074) https://www.science.org/doi/suppl/10.1126/sciadv.abd3311/suppl_file/abd3311_tables_s1_to_s12.xlsx:
Wilcoxon ranksum test P-value for gene set overrepresentation: 4.11e-03
Mean rank of genes in gene set: 747.67
Rank on gene expression program of genes in gene set:
| Genes | Weight | Rank | GTEx | DepMap | Decartes | Mean.Counts | Mean.TPM |
|---|---|---|---|---|---|---|---|
| KDR | 0.0024948 | 164 | GTEx | DepMap | Descartes | 1.73 | 54.98 |
| PTPRB | 0.0021239 | 217 | GTEx | DepMap | Descartes | 1.24 | 17.41 |
| PLVAP | 0.0002778 | 1862 | GTEx | DepMap | Descartes | 6.99 | 512.65 |
Below shows ranks on this GEP for literature curated gene lists for large gene sets
These include those reported as mesenchymal/adrenergic by Van Groningen et al.
High ranks indicate this gene is a driver of this GEP (note these results are not ordered).
The Mean Count column shows the mean read count in cells scoring highly (H > 50) on this gene expression program.
VanGroningen Adrenergic Genes
Adrenergic marker genes from Supplementary Table 2 of Van Groningen et al. Nature Genetics 2017. These genes were identified by differential expression analysis of mesenchymal-like and adrenergic-like neuroblastoma cell lines.
Wilcoxon ranksum test P-value for gene set overrepresentation: 1.00e+00
Mean rank of genes in gene set: 9959.87
Median rank of genes in gene set: 11516
Rank on gene expression program of top 30 genes in gene set:
| Genes | Weight | Rank | GTEx | DepMap | Descartes | Mean.Counts | Mean.TPM |
|---|---|---|---|---|---|---|---|
| AKAP12 | 0.0016994 | 290 | GTEx | DepMap | Descartes | 1.28 | 34.21 |
| FAM107B | 0.0008539 | 654 | GTEx | DepMap | Descartes | 0.85 | 48.00 |
| INO80C | 0.0008460 | 661 | GTEx | DepMap | Descartes | 0.57 | 37.65 |
| RBP1 | 0.0008412 | 665 | GTEx | DepMap | Descartes | 3.55 | 376.55 |
| ST3GAL6 | 0.0008241 | 676 | GTEx | DepMap | Descartes | 0.43 | 28.79 |
| ARL6IP1 | 0.0007550 | 725 | GTEx | DepMap | Descartes | 1.84 | 183.73 |
| ABLIM1 | 0.0007000 | 783 | GTEx | DepMap | Descartes | 0.68 | 23.42 |
| CD200 | 0.0006903 | 793 | GTEx | DepMap | Descartes | 0.97 | 114.31 |
| LYN | 0.0006884 | 797 | GTEx | DepMap | Descartes | 0.58 | 19.24 |
| SCN3A | 0.0006518 | 843 | GTEx | DepMap | Descartes | 0.34 | 9.33 |
| RPS6KA2 | 0.0006390 | 863 | GTEx | DepMap | Descartes | 0.89 | 27.94 |
| GNB1 | 0.0005521 | 994 | GTEx | DepMap | Descartes | 1.76 | 114.67 |
| GRB10 | 0.0005359 | 1025 | GTEx | DepMap | Descartes | 1.11 | 36.50 |
| SETD7 | 0.0004922 | 1113 | GTEx | DepMap | Descartes | 0.34 | 8.48 |
| TMOD2 | 0.0004209 | 1298 | GTEx | DepMap | Descartes | 0.84 | 18.71 |
| RET | 0.0003744 | 1429 | GTEx | DepMap | Descartes | 0.11 | 3.53 |
| MYO5A | 0.0002904 | 1805 | GTEx | DepMap | Descartes | 0.34 | 5.80 |
| TBC1D30 | 0.0002577 | 1966 | GTEx | DepMap | Descartes | 0.19 | 4.89 |
| EML4 | 0.0002402 | 2088 | GTEx | DepMap | Descartes | 0.47 | 21.95 |
| SLC35G2 | 0.0002374 | 2113 | GTEx | DepMap | Descartes | 0.24 | NA |
| FAM171B | 0.0002175 | 2273 | GTEx | DepMap | Descartes | 0.22 | 8.04 |
| RNF144A | 0.0001713 | 2680 | GTEx | DepMap | Descartes | 0.23 | 9.44 |
| ARHGEF7 | 0.0001600 | 2778 | GTEx | DepMap | Descartes | 0.53 | 27.65 |
| NCOA7 | 0.0001478 | 2894 | GTEx | DepMap | Descartes | 1.77 | NA |
| PHPT1 | 0.0001422 | 2943 | GTEx | DepMap | Descartes | 2.77 | 413.24 |
| IGSF3 | 0.0001302 | 3080 | GTEx | DepMap | Descartes | 0.14 | 2.99 |
| CETN3 | 0.0001239 | 3152 | GTEx | DepMap | Descartes | 0.16 | 15.56 |
| VRK1 | 0.0001188 | 3210 | GTEx | DepMap | Descartes | 0.19 | 19.88 |
| AHSA1 | 0.0001170 | 3230 | GTEx | DepMap | Descartes | 0.86 | 140.62 |
| TUBB4B | 0.0001105 | 3295 | GTEx | DepMap | Descartes | 1.99 | 197.95 |
VanGroningen Mesenchymal Genes
Mesenchymal marker genes from Supplementary Table 2 of Van Groningen et al. Nature Genetics 2017. These genes were identified by differential expression analysis of mesenchymal-like and adrenergic-like neuroblastoma cell lines.
Wilcoxon ranksum test P-value for gene set overrepresentation: 5.47e-50
Mean rank of genes in gene set: 3745.88
Median rank of genes in gene set: 1811
Rank on gene expression program of top 30 genes in gene set:
| Genes | Weight | Rank | GTEx | DepMap | Descartes | Mean.Counts | Mean.TPM |
|---|---|---|---|---|---|---|---|
| TFPI | 0.0202054 | 3 | GTEx | DepMap | Descartes | 3.38 | 131.53 |
| TM4SF1 | 0.0096657 | 19 | GTEx | DepMap | Descartes | 6.66 | 549.27 |
| RHOJ | 0.0086689 | 24 | GTEx | DepMap | Descartes | 0.97 | 64.38 |
| PLSCR4 | 0.0084602 | 26 | GTEx | DepMap | Descartes | 0.54 | 48.73 |
| THBS1 | 0.0070537 | 35 | GTEx | DepMap | Descartes | 2.42 | 79.15 |
| GJA1 | 0.0069317 | 37 | GTEx | DepMap | Descartes | 1.69 | 112.25 |
| WWTR1 | 0.0059435 | 41 | GTEx | DepMap | Descartes | 2.12 | 81.54 |
| MGP | 0.0054541 | 46 | GTEx | DepMap | Descartes | 23.28 | 3758.99 |
| ELK3 | 0.0044810 | 65 | GTEx | DepMap | Descartes | 2.04 | 93.81 |
| MYL12B | 0.0041831 | 71 | GTEx | DepMap | Descartes | 10.91 | 1892.16 |
| PDLIM1 | 0.0040994 | 75 | GTEx | DepMap | Descartes | 2.49 | 405.79 |
| IL6ST | 0.0040639 | 76 | GTEx | DepMap | Descartes | 2.50 | 62.09 |
| PPIC | 0.0037281 | 90 | GTEx | DepMap | Descartes | 1.09 | 171.39 |
| HES1 | 0.0035375 | 95 | GTEx | DepMap | Descartes | 2.65 | 419.36 |
| VIM | 0.0035106 | 97 | GTEx | DepMap | Descartes | 45.30 | 3574.83 |
| NFIA | 0.0033173 | 108 | GTEx | DepMap | Descartes | 1.42 | 7.30 |
| ARL4A | 0.0029290 | 127 | GTEx | DepMap | Descartes | 2.15 | 157.16 |
| PLS3 | 0.0028886 | 129 | GTEx | DepMap | Descartes | 0.96 | 72.55 |
| GDF15 | 0.0028252 | 133 | GTEx | DepMap | Descartes | 0.55 | 116.10 |
| IFITM3 | 0.0027403 | 138 | GTEx | DepMap | Descartes | 21.59 | 6196.78 |
| SASH1 | 0.0027073 | 143 | GTEx | DepMap | Descartes | 0.69 | 18.85 |
| LAMC1 | 0.0026958 | 145 | GTEx | DepMap | Descartes | 1.64 | 48.88 |
| PON2 | 0.0026782 | 149 | GTEx | DepMap | Descartes | 1.07 | 121.77 |
| HTRA1 | 0.0026467 | 150 | GTEx | DepMap | Descartes | 3.54 | 297.71 |
| SVIL | 0.0026076 | 152 | GTEx | DepMap | Descartes | 1.08 | 30.77 |
| MYL12A | 0.0025633 | 154 | GTEx | DepMap | Descartes | 10.22 | 1766.90 |
| GNG12 | 0.0025439 | 156 | GTEx | DepMap | Descartes | 0.51 | 30.50 |
| F2R | 0.0025402 | 158 | GTEx | DepMap | Descartes | 2.34 | 113.51 |
| TUBB6 | 0.0025323 | 159 | GTEx | DepMap | Descartes | 1.12 | 123.97 |
| APP | 0.0025167 | 161 | GTEx | DepMap | Descartes | 4.58 | 264.42 |
Descartes adrenocortical markers
Top 50 marker genes of adrenocortical cells in the Decartes fetal adrenal single cell map (https://atlas.brotmanbaty.org/bbi/human-gene-expression-during-development/cell/adrenocortical/in/adrenal)
Wilcoxon ranksum test P-value for gene set overrepresentation: 8.83e-01
Mean rank of genes in gene set: 6993.69
Median rank of genes in gene set: 7410
Rank on gene expression program of top 30 genes in gene set:
| Genes | Weight | Rank | GTEx | DepMap | Descartes | Mean.Counts | Mean.TPM |
|---|---|---|---|---|---|---|---|
| CLU | 0.0021386 | 213 | GTEx | DepMap | Descartes | 3.38 | 371.35 |
| FDPS | 0.0010504 | 519 | GTEx | DepMap | Descartes | 1.96 | 203.33 |
| SH3BP5 | 0.0007544 | 726 | GTEx | DepMap | Descartes | 1.80 | 123.50 |
| PAPSS2 | 0.0003192 | 1662 | GTEx | DepMap | Descartes | 0.12 | 6.47 |
| SCAP | 0.0002514 | 2014 | GTEx | DepMap | Descartes | 0.34 | 14.46 |
| IGF1R | 0.0002265 | 2207 | GTEx | DepMap | Descartes | 0.32 | 5.16 |
| CYB5B | 0.0002149 | 2294 | GTEx | DepMap | Descartes | 0.57 | 29.30 |
| POR | 0.0001610 | 2768 | GTEx | DepMap | Descartes | 0.39 | 33.62 |
| SH3PXD2B | 0.0001592 | 2784 | GTEx | DepMap | Descartes | 0.07 | 2.42 |
| FDX1 | 0.0001048 | 3353 | GTEx | DepMap | Descartes | 0.73 | 50.51 |
| LDLR | 0.0000958 | 3470 | GTEx | DepMap | Descartes | 0.20 | 6.64 |
| FDXR | 0.0000775 | 3745 | GTEx | DepMap | Descartes | 0.14 | 10.27 |
| DHCR24 | 0.0000301 | 4551 | GTEx | DepMap | Descartes | 0.07 | 2.72 |
| ERN1 | -0.0000125 | 5662 | GTEx | DepMap | Descartes | 0.11 | 2.24 |
| MSMO1 | -0.0000349 | 6572 | GTEx | DepMap | Descartes | 0.36 | 30.15 |
| BAIAP2L1 | -0.0000436 | 6926 | GTEx | DepMap | Descartes | 0.01 | 0.44 |
| SGCZ | -0.0000443 | 6946 | GTEx | DepMap | Descartes | 0.04 | 0.64 |
| INHA | -0.0000544 | 7378 | GTEx | DepMap | Descartes | 0.00 | 0.00 |
| NPC1 | -0.0000561 | 7442 | GTEx | DepMap | Descartes | 0.09 | 3.70 |
| STAR | -0.0000656 | 7864 | GTEx | DepMap | Descartes | 0.00 | 0.00 |
| DHCR7 | -0.0000989 | 9071 | GTEx | DepMap | Descartes | 0.12 | 8.58 |
| SCARB1 | -0.0000998 | 9099 | GTEx | DepMap | Descartes | 0.22 | 6.76 |
| FRMD5 | -0.0001017 | 9163 | GTEx | DepMap | Descartes | 0.04 | 1.24 |
| FREM2 | -0.0001113 | 9496 | GTEx | DepMap | Descartes | 0.00 | 0.00 |
| SLC16A9 | -0.0001204 | 9779 | GTEx | DepMap | Descartes | 0.01 | 0.86 |
| PDE10A | -0.0001424 | 10376 | GTEx | DepMap | Descartes | 0.18 | 3.43 |
| GRAMD1B | -0.0001461 | 10455 | GTEx | DepMap | Descartes | 0.05 | 0.97 |
| HMGCR | -0.0001728 | 11034 | GTEx | DepMap | Descartes | 0.15 | 5.66 |
| SLC1A2 | -0.0001766 | 11121 | GTEx | DepMap | Descartes | 0.01 | 0.12 |
| DNER | -0.0001939 | 11385 | GTEx | DepMap | Descartes | 0.08 | 4.51 |
Descartes chromaffin markers
Top 50 marker genes of chromaffin cells in the Decartes fetal adrenal single cell map (https://atlas.brotmanbaty.org/bbi/human-gene-expression-during-development/cell/chromaffin/in/adrenal)
Wilcoxon ranksum test P-value for gene set overrepresentation: 1.00e+00
Mean rank of genes in gene set: 10969.66
Median rank of genes in gene set: 12140
Rank on gene expression program of top 30 genes in gene set:
| Genes | Weight | Rank | GTEx | DepMap | Descartes | Mean.Counts | Mean.TPM |
|---|---|---|---|---|---|---|---|
| SLC44A5 | 0.0000778 | 3741 | GTEx | DepMap | Descartes | 0.03 | 1.49 |
| RYR2 | 0.0000060 | 5040 | GTEx | DepMap | Descartes | 0.08 | 0.86 |
| REEP1 | -0.0000517 | 7261 | GTEx | DepMap | Descartes | 0.15 | 5.81 |
| GREM1 | -0.0000520 | 7280 | GTEx | DepMap | Descartes | 0.19 | 2.21 |
| ANKFN1 | -0.0000636 | 7800 | GTEx | DepMap | Descartes | 0.00 | 0.00 |
| IL7 | -0.0000705 | 8044 | GTEx | DepMap | Descartes | 0.15 | 19.88 |
| EPHA6 | -0.0000760 | 8249 | GTEx | DepMap | Descartes | 0.00 | 0.00 |
| RPH3A | -0.0001033 | 9220 | GTEx | DepMap | Descartes | 0.04 | 0.76 |
| FAT3 | -0.0001225 | 9844 | GTEx | DepMap | Descartes | 0.08 | 0.74 |
| ALK | -0.0001436 | 10406 | GTEx | DepMap | Descartes | 0.01 | 0.27 |
| HS3ST5 | -0.0001475 | 10489 | GTEx | DepMap | Descartes | 0.01 | 0.40 |
| KCNB2 | -0.0001499 | 10540 | GTEx | DepMap | Descartes | 0.01 | 0.78 |
| EYA1 | -0.0001687 | 10949 | GTEx | DepMap | Descartes | 0.03 | 0.75 |
| EYA4 | -0.0001703 | 10985 | GTEx | DepMap | Descartes | 0.00 | 0.00 |
| PTCHD1 | -0.0001805 | 11186 | GTEx | DepMap | Descartes | 0.01 | 0.17 |
| CNKSR2 | -0.0002086 | 11573 | GTEx | DepMap | Descartes | 0.04 | 0.71 |
| TMEM132C | -0.0002156 | 11656 | GTEx | DepMap | Descartes | 0.00 | 0.00 |
| SLC6A2 | -0.0002182 | 11677 | GTEx | DepMap | Descartes | 0.04 | 1.33 |
| PLXNA4 | -0.0002223 | 11719 | GTEx | DepMap | Descartes | 0.00 | 0.00 |
| RBFOX1 | -0.0002610 | 12022 | GTEx | DepMap | Descartes | 0.05 | 1.48 |
| MAB21L2 | -0.0002863 | 12140 | GTEx | DepMap | Descartes | 0.26 | 10.97 |
| TMEFF2 | -0.0003007 | 12203 | GTEx | DepMap | Descartes | 0.07 | 2.83 |
| RGMB | -0.0003056 | 12217 | GTEx | DepMap | Descartes | 0.20 | 6.59 |
| SYNPO2 | -0.0003111 | 12230 | GTEx | DepMap | Descartes | 0.07 | 0.75 |
| MAB21L1 | -0.0003136 | 12242 | GTEx | DepMap | Descartes | 0.34 | 14.54 |
| NTRK1 | -0.0003385 | 12318 | GTEx | DepMap | Descartes | 0.07 | 3.16 |
| MARCH11 | -0.0003432 | 12327 | GTEx | DepMap | Descartes | 0.64 | NA |
| TUBA1A | -0.0003465 | 12333 | GTEx | DepMap | Descartes | 13.09 | 1126.82 |
| GAL | -0.0003568 | 12352 | GTEx | DepMap | Descartes | 0.11 | 17.65 |
| ELAVL2 | -0.0003594 | 12359 | GTEx | DepMap | Descartes | 0.23 | 7.27 |
Descartes Vascular_endothelial markers
Top 50 marker genes of Vascular_endothelial cells in the Decartes fetal adrenal single cell map (https://atlas.brotmanbaty.org/bbi/human-gene-expression-during-development/cell/vascular_endothelial/in/adrenal)
Wilcoxon ranksum test P-value for gene set overrepresentation: 3.84e-13
Mean rank of genes in gene set: 2069.5
Median rank of genes in gene set: 274.5
Rank on gene expression program of top 30 genes in gene set:
| Genes | Weight | Rank | GTEx | DepMap | Descartes | Mean.Counts | Mean.TPM |
|---|---|---|---|---|---|---|---|
| TIE1 | 0.0119550 | 11 | GTEx | DepMap | Descartes | 1.80 | 103.10 |
| CLDN5 | 0.0119000 | 12 | GTEx | DepMap | Descartes | 9.36 | 919.28 |
| FLT4 | 0.0118141 | 13 | GTEx | DepMap | Descartes | 0.96 | 44.45 |
| KANK3 | 0.0075246 | 31 | GTEx | DepMap | Descartes | 1.03 | 85.75 |
| ROBO4 | 0.0075007 | 32 | GTEx | DepMap | Descartes | 2.05 | 111.71 |
| CALCRL | 0.0059335 | 42 | GTEx | DepMap | Descartes | 1.80 | 73.40 |
| CDH5 | 0.0051366 | 51 | GTEx | DepMap | Descartes | 2.68 | 118.29 |
| RAMP2 | 0.0048394 | 56 | GTEx | DepMap | Descartes | 8.88 | 2052.15 |
| F8 | 0.0041786 | 72 | GTEx | DepMap | Descartes | 0.15 | 4.24 |
| NPR1 | 0.0039778 | 81 | GTEx | DepMap | Descartes | 0.39 | 20.46 |
| ARHGAP29 | 0.0039395 | 82 | GTEx | DepMap | Descartes | 4.07 | 90.81 |
| HYAL2 | 0.0038142 | 85 | GTEx | DepMap | Descartes | 4.39 | 235.67 |
| RASIP1 | 0.0036849 | 94 | GTEx | DepMap | Descartes | 1.05 | 69.68 |
| SHE | 0.0033581 | 105 | GTEx | DepMap | Descartes | 0.45 | 15.19 |
| PODXL | 0.0029634 | 126 | GTEx | DepMap | Descartes | 2.47 | 77.54 |
| KDR | 0.0024948 | 164 | GTEx | DepMap | Descartes | 1.73 | 54.98 |
| PTPRB | 0.0021239 | 217 | GTEx | DepMap | Descartes | 1.24 | 17.41 |
| TEK | 0.0020465 | 230 | GTEx | DepMap | Descartes | 0.26 | 7.71 |
| ID1 | 0.0020059 | 236 | GTEx | DepMap | Descartes | 4.84 | 767.14 |
| CEACAM1 | 0.0015929 | 313 | GTEx | DepMap | Descartes | 0.16 | 11.16 |
| GALNT15 | 0.0010633 | 512 | GTEx | DepMap | Descartes | 0.20 | NA |
| NR5A2 | 0.0010131 | 543 | GTEx | DepMap | Descartes | 0.16 | 5.44 |
| ESM1 | 0.0009354 | 581 | GTEx | DepMap | Descartes | 1.38 | 125.20 |
| SHANK3 | 0.0009199 | 596 | GTEx | DepMap | Descartes | 0.42 | 8.80 |
| MMRN2 | 0.0007906 | 701 | GTEx | DepMap | Descartes | 1.30 | 55.07 |
| SLCO2A1 | 0.0007264 | 754 | GTEx | DepMap | Descartes | 0.69 | 29.63 |
| CDH13 | 0.0006077 | 899 | GTEx | DepMap | Descartes | 0.59 | 16.22 |
| PLVAP | 0.0002778 | 1862 | GTEx | DepMap | Descartes | 6.99 | 512.65 |
| NOTCH4 | 0.0001997 | 2421 | GTEx | DepMap | Descartes | 1.14 | 33.81 |
| EFNB2 | 0.0001440 | 2924 | GTEx | DepMap | Descartes | 1.32 | 41.96 |
Descartes stromal markers
Top 50 marker genes of stromal cells in the Decartes fetal adrenal single cell map (https://atlas.brotmanbaty.org/bbi/human-gene-expression-during-development/cell/stromal/in/adrenal)
Wilcoxon ranksum test P-value for gene set overrepresentation: 9.98e-01
Mean rank of genes in gene set: 7836.55
Median rank of genes in gene set: 9480
Rank on gene expression program of top 30 genes in gene set:
| Genes | Weight | Rank | GTEx | DepMap | Descartes | Mean.Counts | Mean.TPM |
|---|---|---|---|---|---|---|---|
| MGP | 0.0054541 | 46 | GTEx | DepMap | Descartes | 23.28 | 3758.99 |
| LOX | 0.0030114 | 124 | GTEx | DepMap | Descartes | 0.85 | 47.41 |
| LAMC3 | 0.0025201 | 160 | GTEx | DepMap | Descartes | 0.04 | 1.14 |
| ADAMTSL3 | 0.0018369 | 261 | GTEx | DepMap | Descartes | 0.07 | 2.75 |
| ELN | 0.0006232 | 881 | GTEx | DepMap | Descartes | 0.50 | 26.38 |
| C7 | 0.0003560 | 1499 | GTEx | DepMap | Descartes | 0.27 | 14.72 |
| ABCC9 | 0.0002839 | 1840 | GTEx | DepMap | Descartes | 0.11 | 4.20 |
| COL27A1 | 0.0002185 | 2265 | GTEx | DepMap | Descartes | 0.15 | 7.47 |
| ACTA2 | 0.0001297 | 3095 | GTEx | DepMap | Descartes | 0.73 | 89.24 |
| ABCA6 | 0.0001081 | 3317 | GTEx | DepMap | Descartes | 0.07 | 2.47 |
| RSPO3 | 0.0001005 | 3401 | GTEx | DepMap | Descartes | 0.07 | NA |
| CCDC80 | 0.0000206 | 4753 | GTEx | DepMap | Descartes | 0.64 | 9.36 |
| PRICKLE1 | -0.0000057 | 5394 | GTEx | DepMap | Descartes | 0.09 | 3.12 |
| SCARA5 | -0.0000380 | 6712 | GTEx | DepMap | Descartes | 0.00 | 0.00 |
| PAMR1 | -0.0000403 | 6791 | GTEx | DepMap | Descartes | 0.01 | 1.20 |
| CDH11 | -0.0000526 | 7305 | GTEx | DepMap | Descartes | 0.09 | 2.31 |
| EDNRA | -0.0000533 | 7333 | GTEx | DepMap | Descartes | 0.08 | 4.16 |
| BICC1 | -0.0000676 | 7937 | GTEx | DepMap | Descartes | 0.09 | 3.82 |
| GAS2 | -0.0000723 | 8119 | GTEx | DepMap | Descartes | 0.00 | 0.00 |
| GLI2 | -0.0000956 | 8974 | GTEx | DepMap | Descartes | 0.00 | 0.00 |
| CLDN11 | -0.0001008 | 9131 | GTEx | DepMap | Descartes | 0.00 | 0.00 |
| HHIP | -0.0001065 | 9335 | GTEx | DepMap | Descartes | 0.05 | 0.85 |
| FREM1 | -0.0001155 | 9625 | GTEx | DepMap | Descartes | 0.00 | 0.00 |
| DKK2 | -0.0001165 | 9658 | GTEx | DepMap | Descartes | 0.03 | 1.98 |
| PCDH18 | -0.0001179 | 9703 | GTEx | DepMap | Descartes | 0.04 | 1.00 |
| ITGA11 | -0.0001236 | 9874 | GTEx | DepMap | Descartes | 0.01 | 0.20 |
| LUM | -0.0001255 | 9930 | GTEx | DepMap | Descartes | 1.28 | 131.27 |
| PRRX1 | -0.0001361 | 10225 | GTEx | DepMap | Descartes | 0.23 | 13.86 |
| CD248 | -0.0001388 | 10289 | GTEx | DepMap | Descartes | 0.05 | 4.31 |
| COL12A1 | -0.0001534 | 10626 | GTEx | DepMap | Descartes | 0.32 | 5.20 |
Descartes sympathoblasts markers
Top 50 marker genes of sympathoblasts cells in the Decartes fetal adrenal single cell map (https://atlas.brotmanbaty.org/bbi/human-gene-expression-during-development/cell/sympathoblasts/in/adrenal)
Wilcoxon ranksum test P-value for gene set overrepresentation: 1.00e+00
Mean rank of genes in gene set: 9488.03
Median rank of genes in gene set: 9394
Rank on gene expression program of top 30 genes in gene set:
| Genes | Weight | Rank | GTEx | DepMap | Descartes | Mean.Counts | Mean.TPM |
|---|---|---|---|---|---|---|---|
| PENK | 0.0000334 | 4485 | GTEx | DepMap | Descartes | 0.04 | 3.72 |
| ST18 | -0.0000136 | 5698 | GTEx | DepMap | Descartes | 0.01 | 0.27 |
| GRM7 | -0.0000287 | 6306 | GTEx | DepMap | Descartes | 0.00 | 0.00 |
| KSR2 | -0.0000354 | 6599 | GTEx | DepMap | Descartes | 0.03 | 0.37 |
| CDH18 | -0.0000556 | 7426 | GTEx | DepMap | Descartes | 0.01 | 0.60 |
| SORCS3 | -0.0000558 | 7434 | GTEx | DepMap | Descartes | 0.00 | 0.00 |
| TBX20 | -0.0000603 | 7641 | GTEx | DepMap | Descartes | 0.00 | 0.00 |
| CNTN3 | -0.0000650 | 7845 | GTEx | DepMap | Descartes | 0.00 | 0.00 |
| LAMA3 | -0.0000661 | 7880 | GTEx | DepMap | Descartes | 0.03 | 0.40 |
| SLC24A2 | -0.0000683 | 7957 | GTEx | DepMap | Descartes | 0.00 | 0.00 |
| SLC35F3 | -0.0000739 | 8179 | GTEx | DepMap | Descartes | 0.00 | 0.00 |
| DGKK | -0.0000825 | 8481 | GTEx | DepMap | Descartes | 0.01 | 0.21 |
| TENM1 | -0.0000862 | 8637 | GTEx | DepMap | Descartes | 0.01 | NA |
| HTATSF1 | -0.0000936 | 8907 | GTEx | DepMap | Descartes | 0.51 | 34.58 |
| GALNTL6 | -0.0000943 | 8926 | GTEx | DepMap | Descartes | 0.01 | 0.37 |
| MGAT4C | -0.0000986 | 9066 | GTEx | DepMap | Descartes | 0.04 | 0.32 |
| CDH12 | -0.0000989 | 9072 | GTEx | DepMap | Descartes | 0.00 | 0.00 |
| CCSER1 | -0.0000997 | 9097 | GTEx | DepMap | Descartes | 0.01 | NA |
| PCSK2 | -0.0001051 | 9290 | GTEx | DepMap | Descartes | 0.00 | 0.00 |
| GRID2 | -0.0001114 | 9498 | GTEx | DepMap | Descartes | 0.05 | 1.29 |
| FAM155A | -0.0001177 | 9694 | GTEx | DepMap | Descartes | 0.20 | 3.21 |
| EML6 | -0.0001248 | 9909 | GTEx | DepMap | Descartes | 0.00 | 0.00 |
| PACRG | -0.0001311 | 10101 | GTEx | DepMap | Descartes | 0.01 | 0.92 |
| AGBL4 | -0.0001312 | 10105 | GTEx | DepMap | Descartes | 0.00 | 0.00 |
| FGF14 | -0.0001410 | 10344 | GTEx | DepMap | Descartes | 0.01 | 0.11 |
| SPOCK3 | -0.0001554 | 10670 | GTEx | DepMap | Descartes | 0.00 | 0.00 |
| UNC80 | -0.0001630 | 10832 | GTEx | DepMap | Descartes | 0.09 | 0.81 |
| TIAM1 | -0.0001686 | 10948 | GTEx | DepMap | Descartes | 0.09 | 3.92 |
| NTNG1 | -0.0001909 | 11338 | GTEx | DepMap | Descartes | 0.08 | 2.52 |
| KCTD16 | -0.0001945 | 11391 | GTEx | DepMap | Descartes | 0.09 | 0.93 |
Descartes erythroblasts markers
Top 50 marker genes of erythroblasts cells in the Decartes fetal adrenal single cell map (https://atlas.brotmanbaty.org/bbi/human-gene-expression-during-development/cell/erythroblasts/in/adrenal)
Wilcoxon ranksum test P-value for gene set overrepresentation: 6.71e-02
Mean rank of genes in gene set: 5268.55
Median rank of genes in gene set: 4733
Rank on gene expression program of top 30 genes in gene set:
| Genes | Weight | Rank | GTEx | DepMap | Descartes | Mean.Counts | Mean.TPM |
|---|---|---|---|---|---|---|---|
| GYPC | 0.0033570 | 106 | GTEx | DepMap | Descartes | 3.38 | 439.70 |
| TSPAN5 | 0.0012641 | 412 | GTEx | DepMap | Descartes | 0.89 | 50.99 |
| MICAL2 | 0.0010499 | 520 | GTEx | DepMap | Descartes | 0.24 | 8.78 |
| MARCH3 | 0.0007676 | 715 | GTEx | DepMap | Descartes | 0.39 | NA |
| GCLC | 0.0003474 | 1536 | GTEx | DepMap | Descartes | 0.04 | 3.17 |
| BLVRB | 0.0003140 | 1687 | GTEx | DepMap | Descartes | 1.03 | 128.81 |
| SNCA | 0.0002338 | 2149 | GTEx | DepMap | Descartes | 0.36 | 26.65 |
| XPO7 | 0.0002260 | 2211 | GTEx | DepMap | Descartes | 0.20 | 9.55 |
| CAT | 0.0002060 | 2366 | GTEx | DepMap | Descartes | 0.28 | 29.74 |
| TRAK2 | 0.0001964 | 2443 | GTEx | DepMap | Descartes | 0.27 | 13.77 |
| RGS6 | 0.0001707 | 2690 | GTEx | DepMap | Descartes | 0.00 | 0.00 |
| DENND4A | 0.0001323 | 3059 | GTEx | DepMap | Descartes | 0.26 | 6.86 |
| CPOX | 0.0001045 | 3354 | GTEx | DepMap | Descartes | 0.14 | 12.53 |
| SLC25A37 | 0.0000830 | 3669 | GTEx | DepMap | Descartes | 0.51 | 35.30 |
| SLC25A21 | 0.0000215 | 4733 | GTEx | DepMap | Descartes | 0.00 | 0.00 |
| RAPGEF2 | -0.0000226 | 6077 | GTEx | DepMap | Descartes | 0.39 | 12.76 |
| RHD | -0.0000248 | 6172 | GTEx | DepMap | Descartes | 0.00 | 0.00 |
| ALAS2 | -0.0000258 | 6215 | GTEx | DepMap | Descartes | 0.00 | 0.00 |
| SLC4A1 | -0.0000313 | 6434 | GTEx | DepMap | Descartes | 0.00 | 0.00 |
| TMCC2 | -0.0000823 | 8474 | GTEx | DepMap | Descartes | 0.04 | 1.92 |
| SELENBP1 | -0.0001019 | 9168 | GTEx | DepMap | Descartes | 0.04 | 5.01 |
| ABCB10 | -0.0001034 | 9225 | GTEx | DepMap | Descartes | 0.05 | 1.69 |
| EPB41 | -0.0001071 | 9355 | GTEx | DepMap | Descartes | 0.19 | 4.11 |
| TFR2 | -0.0001135 | 9568 | GTEx | DepMap | Descartes | 0.00 | 0.00 |
| SPTB | -0.0001183 | 9716 | GTEx | DepMap | Descartes | 0.01 | 0.22 |
| ANK1 | -0.0001208 | 9789 | GTEx | DepMap | Descartes | 0.03 | 0.30 |
| FECH | -0.0001210 | 9796 | GTEx | DepMap | Descartes | 0.03 | 0.76 |
| SPECC1 | -0.0001250 | 9913 | GTEx | DepMap | Descartes | 0.07 | 1.07 |
| SOX6 | -0.0001835 | 11236 | GTEx | DepMap | Descartes | 0.01 | 0.16 |
| NA | NA | NA | NA | NA | NA | NA | NA |
Descartes myeloid markers
Top 50 marker genes of myeloid cells in the Decartes fetal adrenal single cell map (https://atlas.brotmanbaty.org/bbi/human-gene-expression-during-development/cell/myeloid/in/adrenal)
Wilcoxon ranksum test P-value for gene set overrepresentation: 4.32e-01
Mean rank of genes in gene set: 6174.87
Median rank of genes in gene set: 6338
Rank on gene expression program of top 30 genes in gene set:
| Genes | Weight | Rank | GTEx | DepMap | Descartes | Mean.Counts | Mean.TPM |
|---|---|---|---|---|---|---|---|
| PTPRE | 0.0022590 | 194 | GTEx | DepMap | Descartes | 0.99 | 35.51 |
| SLC9A9 | 0.0008644 | 646 | GTEx | DepMap | Descartes | 0.20 | 10.94 |
| CST3 | 0.0005082 | 1077 | GTEx | DepMap | Descartes | 8.22 | 550.51 |
| LGMN | 0.0004654 | 1187 | GTEx | DepMap | Descartes | 1.62 | 143.13 |
| WWP1 | 0.0004410 | 1246 | GTEx | DepMap | Descartes | 0.42 | 20.32 |
| SLCO2B1 | 0.0003798 | 1415 | GTEx | DepMap | Descartes | 0.24 | 6.94 |
| MERTK | 0.0003490 | 1530 | GTEx | DepMap | Descartes | 0.14 | 4.83 |
| RGL1 | 0.0002490 | 2029 | GTEx | DepMap | Descartes | 0.26 | 8.72 |
| FGL2 | 0.0001694 | 2701 | GTEx | DepMap | Descartes | 0.34 | 11.64 |
| CD163L1 | 0.0000955 | 3473 | GTEx | DepMap | Descartes | 0.08 | 4.98 |
| IFNGR1 | 0.0000944 | 3484 | GTEx | DepMap | Descartes | 0.53 | 49.15 |
| HRH1 | 0.0000937 | 3494 | GTEx | DepMap | Descartes | 0.09 | 2.85 |
| FGD2 | 0.0000893 | 3578 | GTEx | DepMap | Descartes | 0.01 | 1.36 |
| SFMBT2 | 0.0000872 | 3609 | GTEx | DepMap | Descartes | 0.05 | 1.27 |
| ITPR2 | 0.0000710 | 3831 | GTEx | DepMap | Descartes | 0.26 | 4.89 |
| CTSS | 0.0000627 | 3966 | GTEx | DepMap | Descartes | 1.08 | 51.84 |
| CSF1R | 0.0000416 | 4333 | GTEx | DepMap | Descartes | 0.12 | 5.26 |
| CD74 | -0.0000003 | 5236 | GTEx | DepMap | Descartes | 13.50 | 827.43 |
| HCK | -0.0000075 | 5460 | GTEx | DepMap | Descartes | 0.09 | 6.15 |
| ATP8B4 | -0.0000504 | 7216 | GTEx | DepMap | Descartes | 0.00 | 0.00 |
| CPVL | -0.0000598 | 7610 | GTEx | DepMap | Descartes | 0.12 | 15.09 |
| SLC1A3 | -0.0000612 | 7679 | GTEx | DepMap | Descartes | 0.03 | 1.18 |
| MS4A4A | -0.0000755 | 8233 | GTEx | DepMap | Descartes | 0.30 | 18.09 |
| ADAP2 | -0.0000764 | 8262 | GTEx | DepMap | Descartes | 0.08 | 3.08 |
| CTSB | -0.0000889 | 8741 | GTEx | DepMap | Descartes | 4.70 | 229.90 |
| CYBB | -0.0000891 | 8748 | GTEx | DepMap | Descartes | 0.05 | 0.76 |
| AXL | -0.0000953 | 8957 | GTEx | DepMap | Descartes | 0.16 | 5.97 |
| CTSD | -0.0000965 | 8997 | GTEx | DepMap | Descartes | 4.74 | 424.01 |
| ABCA1 | -0.0001047 | 9278 | GTEx | DepMap | Descartes | 0.20 | 3.46 |
| MSR1 | -0.0001206 | 9782 | GTEx | DepMap | Descartes | 0.19 | 7.39 |
Descartes Schwann markers
Top 50 marker genes of Schwann cells in the Decartes fetal adrenal single cell map (https://atlas.brotmanbaty.org/bbi/human-gene-expression-during-development/cell/schwann/in/adrenal)
Wilcoxon ranksum test P-value for gene set overrepresentation: 5.66e-01
Mean rank of genes in gene set: 6364.93
Median rank of genes in gene set: 6378
Rank on gene expression program of top 30 genes in gene set:
| Genes | Weight | Rank | GTEx | DepMap | Descartes | Mean.Counts | Mean.TPM |
|---|---|---|---|---|---|---|---|
| LAMA4 | 0.0058328 | 43 | GTEx | DepMap | Descartes | 4.05 | 131.52 |
| EDNRB | 0.0044186 | 67 | GTEx | DepMap | Descartes | 0.99 | 44.06 |
| VIM | 0.0035106 | 97 | GTEx | DepMap | Descartes | 45.30 | 3574.83 |
| LAMC1 | 0.0026958 | 145 | GTEx | DepMap | Descartes | 1.64 | 48.88 |
| KCTD12 | 0.0023284 | 182 | GTEx | DepMap | Descartes | 0.97 | 34.30 |
| ADAMTS5 | 0.0015052 | 339 | GTEx | DepMap | Descartes | 0.59 | 9.49 |
| COL5A2 | 0.0014765 | 348 | GTEx | DepMap | Descartes | 0.62 | 18.24 |
| LAMB1 | 0.0013288 | 387 | GTEx | DepMap | Descartes | 1.53 | 53.39 |
| MARCKS | 0.0005849 | 948 | GTEx | DepMap | Descartes | 7.96 | 360.64 |
| STARD13 | 0.0003098 | 1708 | GTEx | DepMap | Descartes | 0.19 | 6.54 |
| COL18A1 | 0.0002984 | 1759 | GTEx | DepMap | Descartes | 2.66 | 90.02 |
| VCAN | 0.0001736 | 2653 | GTEx | DepMap | Descartes | 0.88 | 14.74 |
| HMGA2 | 0.0001595 | 2782 | GTEx | DepMap | Descartes | 0.04 | 1.17 |
| DST | 0.0000594 | 4024 | GTEx | DepMap | Descartes | 1.28 | 12.55 |
| COL25A1 | 0.0000591 | 4032 | GTEx | DepMap | Descartes | 0.07 | 1.63 |
| OLFML2A | 0.0000441 | 4299 | GTEx | DepMap | Descartes | 0.36 | 9.47 |
| EGFLAM | 0.0000324 | 4501 | GTEx | DepMap | Descartes | 0.16 | 6.17 |
| PLCE1 | 0.0000304 | 4544 | GTEx | DepMap | Descartes | 0.05 | 0.53 |
| GAS7 | 0.0000129 | 4904 | GTEx | DepMap | Descartes | 0.11 | 2.67 |
| MPZ | -0.0000048 | 5366 | GTEx | DepMap | Descartes | 0.22 | 15.25 |
| MDGA2 | -0.0000091 | 5528 | GTEx | DepMap | Descartes | 0.00 | 0.00 |
| TRPM3 | -0.0000141 | 5718 | GTEx | DepMap | Descartes | 0.01 | 0.17 |
| IL1RAPL1 | -0.0000465 | 7038 | GTEx | DepMap | Descartes | 0.00 | 0.00 |
| IL1RAPL2 | -0.0000642 | 7815 | GTEx | DepMap | Descartes | 0.00 | 0.00 |
| ERBB4 | -0.0000800 | 8377 | GTEx | DepMap | Descartes | 0.00 | 0.00 |
| PLP1 | -0.0000898 | 8766 | GTEx | DepMap | Descartes | 0.16 | 6.65 |
| NRXN3 | -0.0000900 | 8779 | GTEx | DepMap | Descartes | 0.01 | 0.26 |
| XKR4 | -0.0001029 | 9206 | GTEx | DepMap | Descartes | 0.05 | 0.32 |
| GRIK3 | -0.0001062 | 9321 | GTEx | DepMap | Descartes | 0.00 | 0.00 |
| SLC35F1 | -0.0001073 | 9367 | GTEx | DepMap | Descartes | 0.03 | 0.73 |
Descartes Megakaryocytes markers
Top 50 marker genes of Megakaryocytes cells in the Decartes fetal adrenal single cell map (https://atlas.brotmanbaty.org/bbi/human-gene-expression-during-development/cell/megakaryocytes/in/adrenal)
Wilcoxon ranksum test P-value for gene set overrepresentation: 1.42e-04
Mean rank of genes in gene set: 4318.09
Median rank of genes in gene set: 1707
Rank on gene expression program of top 30 genes in gene set:
| Genes | Weight | Rank | GTEx | DepMap | Descartes | Mean.Counts | Mean.TPM |
|---|---|---|---|---|---|---|---|
| MMRN1 | 0.0220120 | 1 | GTEx | DepMap | Descartes | 2.42 | 142.01 |
| THBS1 | 0.0070537 | 35 | GTEx | DepMap | Descartes | 2.42 | 79.15 |
| LIMS1 | 0.0046370 | 59 | GTEx | DepMap | Descartes | 3.65 | 184.20 |
| ITGB3 | 0.0025408 | 157 | GTEx | DepMap | Descartes | 0.03 | 1.37 |
| TRPC6 | 0.0022026 | 201 | GTEx | DepMap | Descartes | 0.08 | 4.58 |
| CD9 | 0.0019912 | 239 | GTEx | DepMap | Descartes | 3.58 | 431.02 |
| TPM4 | 0.0016791 | 296 | GTEx | DepMap | Descartes | 5.35 | 231.98 |
| TGFB1 | 0.0015702 | 323 | GTEx | DepMap | Descartes | 2.09 | 162.17 |
| STON2 | 0.0013806 | 374 | GTEx | DepMap | Descartes | 0.16 | 9.77 |
| MYH9 | 0.0011995 | 446 | GTEx | DepMap | Descartes | 2.78 | 79.75 |
| LTBP1 | 0.0011916 | 449 | GTEx | DepMap | Descartes | 0.15 | 4.63 |
| STOM | 0.0011817 | 452 | GTEx | DepMap | Descartes | 2.28 | 151.95 |
| ARHGAP6 | 0.0010907 | 492 | GTEx | DepMap | Descartes | 0.23 | 7.24 |
| MCTP1 | 0.0009423 | 578 | GTEx | DepMap | Descartes | 0.32 | 14.93 |
| FLI1 | 0.0009227 | 595 | GTEx | DepMap | Descartes | 0.43 | 15.26 |
| TLN1 | 0.0009096 | 607 | GTEx | DepMap | Descartes | 1.30 | 29.82 |
| FLNA | 0.0008894 | 625 | GTEx | DepMap | Descartes | 2.47 | 58.30 |
| ACTN1 | 0.0008478 | 658 | GTEx | DepMap | Descartes | 1.15 | 55.35 |
| TMSB4X | 0.0006282 | 877 | GTEx | DepMap | Descartes | 100.12 | 12725.40 |
| RAP1B | 0.0005792 | 955 | GTEx | DepMap | Descartes | 1.72 | 26.64 |
| VCL | 0.0004203 | 1300 | GTEx | DepMap | Descartes | 0.51 | 14.24 |
| ACTB | 0.0004141 | 1317 | GTEx | DepMap | Descartes | 33.70 | 3044.56 |
| ZYX | 0.0003103 | 1707 | GTEx | DepMap | Descartes | 0.76 | 72.05 |
| INPP4B | 0.0001367 | 3010 | GTEx | DepMap | Descartes | 0.11 | 2.98 |
| GSN | 0.0001201 | 3193 | GTEx | DepMap | Descartes | 4.78 | 143.35 |
| GP1BA | 0.0001010 | 3394 | GTEx | DepMap | Descartes | 0.09 | 5.30 |
| TUBB1 | 0.0000985 | 3435 | GTEx | DepMap | Descartes | 0.00 | 0.00 |
| RAB27B | -0.0000220 | 6043 | GTEx | DepMap | Descartes | 0.01 | 0.21 |
| SLC24A3 | -0.0000278 | 6281 | GTEx | DepMap | Descartes | 0.03 | 0.81 |
| FERMT3 | -0.0000304 | 6388 | GTEx | DepMap | Descartes | 0.20 | 14.56 |
Descartes Lyphoid markers
Top 50 marker genes of Lyphoid cells in the Decartes fetal adrenal single cell map (https://atlas.brotmanbaty.org/bbi/human-gene-expression-during-development/cell/lymphoid/in/adrenal)
Wilcoxon ranksum test P-value for gene set overrepresentation: 9.96e-01
Mean rank of genes in gene set: 7754.6
Median rank of genes in gene set: 10098
Rank on gene expression program of top 30 genes in gene set:
| Genes | Weight | Rank | GTEx | DepMap | Descartes | Mean.Counts | Mean.TPM |
|---|---|---|---|---|---|---|---|
| SP100 | 0.0017125 | 285 | GTEx | DepMap | Descartes | 1.78 | 71.12 |
| B2M | 0.0011368 | 473 | GTEx | DepMap | Descartes | 112.36 | 9441.38 |
| MSN | 0.0009142 | 602 | GTEx | DepMap | Descartes | 3.19 | 159.80 |
| ABLIM1 | 0.0007000 | 783 | GTEx | DepMap | Descartes | 0.68 | 23.42 |
| ARID5B | 0.0005933 | 933 | GTEx | DepMap | Descartes | 0.95 | 25.69 |
| TMSB10 | 0.0005855 | 947 | GTEx | DepMap | Descartes | 72.32 | 30953.80 |
| PRKCH | 0.0004537 | 1213 | GTEx | DepMap | Descartes | 0.59 | 32.73 |
| MBNL1 | 0.0003895 | 1388 | GTEx | DepMap | Descartes | 1.09 | 41.45 |
| ETS1 | 0.0003684 | 1451 | GTEx | DepMap | Descartes | 1.51 | 53.47 |
| ITPKB | 0.0002555 | 1984 | GTEx | DepMap | Descartes | 0.24 | 11.05 |
| FOXP1 | 0.0001723 | 2668 | GTEx | DepMap | Descartes | 0.89 | 20.59 |
| RCSD1 | 0.0001444 | 2922 | GTEx | DepMap | Descartes | 0.18 | 9.23 |
| CCND3 | 0.0000904 | 3557 | GTEx | DepMap | Descartes | 0.46 | 38.65 |
| NCALD | -0.0000194 | 5942 | GTEx | DepMap | Descartes | 0.19 | 9.19 |
| MCTP2 | -0.0000201 | 5974 | GTEx | DepMap | Descartes | 0.08 | 2.37 |
| WIPF1 | -0.0000419 | 6855 | GTEx | DepMap | Descartes | 0.45 | 18.67 |
| CCL5 | -0.0000593 | 7589 | GTEx | DepMap | Descartes | 0.09 | 10.70 |
| DOCK10 | -0.0000726 | 8131 | GTEx | DepMap | Descartes | 0.16 | 3.65 |
| PITPNC1 | -0.0000885 | 8730 | GTEx | DepMap | Descartes | 0.30 | 6.66 |
| SAMD3 | -0.0001185 | 9721 | GTEx | DepMap | Descartes | 0.01 | 0.45 |
| PLEKHA2 | -0.0001241 | 9888 | GTEx | DepMap | Descartes | 0.07 | 2.24 |
| BACH2 | -0.0001397 | 10308 | GTEx | DepMap | Descartes | 0.09 | 1.22 |
| SKAP1 | -0.0001474 | 10485 | GTEx | DepMap | Descartes | 0.07 | 5.26 |
| ARHGAP15 | -0.0001594 | 10770 | GTEx | DepMap | Descartes | 0.07 | 4.78 |
| SCML4 | -0.0001726 | 11030 | GTEx | DepMap | Descartes | 0.01 | 0.50 |
| SORL1 | -0.0001836 | 11239 | GTEx | DepMap | Descartes | 0.05 | 0.81 |
| GNG2 | -0.0001910 | 11340 | GTEx | DepMap | Descartes | 0.53 | 27.87 |
| LEF1 | -0.0001985 | 11442 | GTEx | DepMap | Descartes | 0.31 | 18.85 |
| PDE3B | -0.0001993 | 11452 | GTEx | DepMap | Descartes | 0.01 | 0.48 |
| IKZF1 | -0.0001997 | 11457 | GTEx | DepMap | Descartes | 0.04 | 0.61 |
Below shows the ranks on this GEP for immune marker gene lists curated by CellTypist (https://www.celltypist.org/encyclopedia).
High ranks indicate this gene is a driver of this GEP.
These curated gene list are ranked by P-value (on this GEP) of their constituent genes.
The Mean Count column shows the mean read count in cells scoring highly (H > 50) on this gene expression program.
Endothelial cells: Endothelial cells (curated markers)
single-layered lining cells that constitute the interior vasculature:
Wilcoxon ranksum test P-value for gene set overrepresentation: 4.26e-03
Mean rank of genes in gene set: 773.67
Rank on gene expression program of genes in gene set:
| Genes | Weight | Rank | GTEx | DepMap | Decartes | Mean.Counts | Mean.TPM |
|---|---|---|---|---|---|---|---|
| CLDN5 | 0.0119000 | 12 | GTEx | DepMap | Descartes | 9.36 | 919.28 |
| SPARCL1 | 0.0011963 | 447 | GTEx | DepMap | Descartes | 10.42 | 766.15 |
| PLVAP | 0.0002778 | 1862 | GTEx | DepMap | Descartes | 6.99 | 512.65 |
Endothelial cells: Endothelial cells (model markers)
single-layered lining cells that constitute the interior vasculature:
Wilcoxon ranksum test P-value for gene set overrepresentation: 1.44e-02
Mean rank of genes in gene set: 2317
Rank on gene expression program of genes in gene set:
| Genes | Weight | Rank | GTEx | DepMap | Decartes | Mean.Counts | Mean.TPM |
|---|---|---|---|---|---|---|---|
| VWF | 0.0046105 | 61 | GTEx | DepMap | Descartes | 10.69 | 235.16 |
| MMRN2 | 0.0007906 | 701 | GTEx | DepMap | Descartes | 1.30 | 55.07 |
| RAMP3 | 0.0004025 | 1356 | GTEx | DepMap | Descartes | 2.76 | 347.93 |
| JAM2 | -0.0000491 | 7150 | GTEx | DepMap | Descartes | 0.74 | 36.88 |
pDC precursor: pDC precursor (curated markers)
precursors of plasmacytoid dendritic cells which have intermixed lymphoid and myeloid origins and give rise to plasmacytoid dendritic cells:
Wilcoxon ranksum test P-value for gene set overrepresentation: 1.92e-02
Mean rank of genes in gene set: 973.5
Rank on gene expression program of genes in gene set:
| Genes | Weight | Rank | GTEx | DepMap | Decartes | Mean.Counts | Mean.TPM |
|---|---|---|---|---|---|---|---|
| CCDC50 | 0.0009731 | 563 | GTEx | DepMap | Descartes | 1.68 | 36.99 |
| IRF7 | 0.0003916 | 1384 | GTEx | DepMap | Descartes | 1.03 | 110.25 |