Program: 9. NB Cell Line #9 (SKNSH Mesenchymal).
Program description and justification of annotation: 9.
Submit a comment on this gene expression program’s interpretation: CLICK
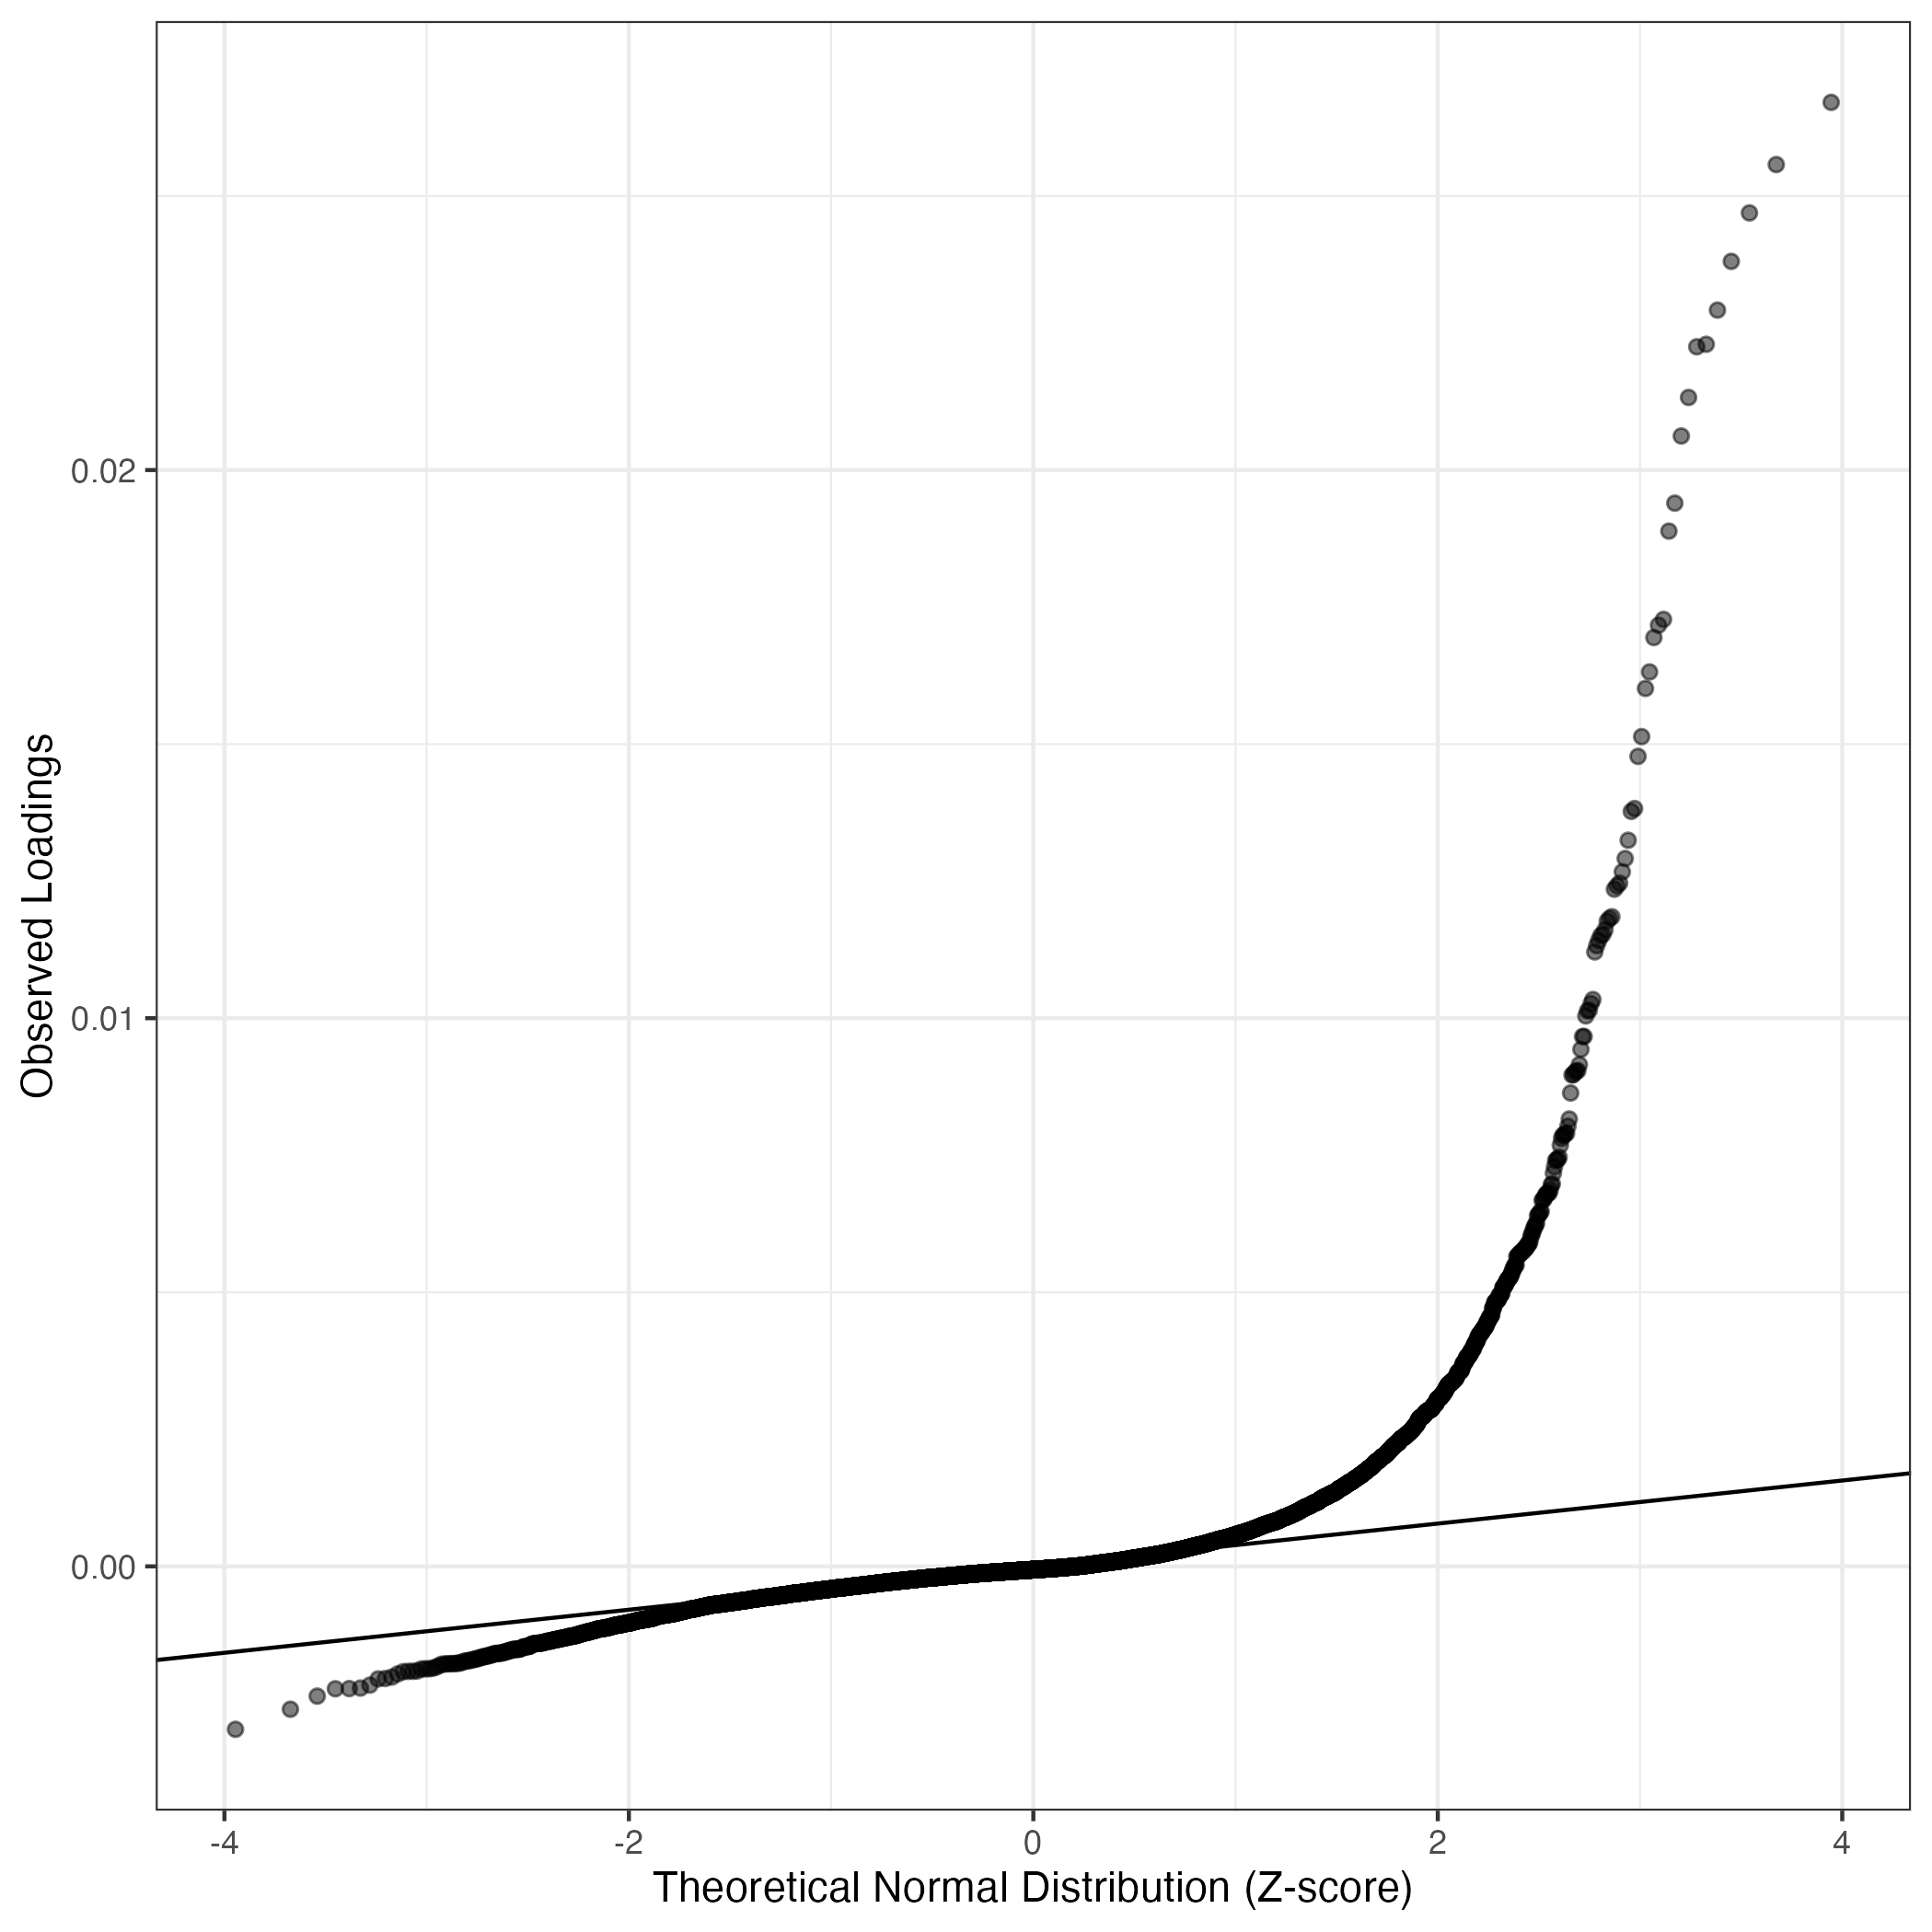
QQ-plot of gene loadings, averaged over both independent splits of the data
This plot highlights the relative contribution of each gene to the GEP
Top genes driving this program.
Note: Decartes website is buggy, try refreshing. Also, Decartes fetal adrenal data have been collected at specific time points (89-122 days), all possible cell types of interest may not be represented, do not overinterpret.
The Mean Count column shows the mean read count in cells scoring highly (H > 50) on this gene expression program.
| Gene | Loading | Gene.Name | GTEx | DepMap | Descartes | Mean.Counts | Mean.Tpm | |
|---|---|---|---|---|---|---|---|---|
| 1 | CTHRC1 | 0.0267078 | collagen triple helix repeat containing 1 | GTEx | DepMap | Descartes | 13.58 | 700.03 |
| 2 | POSTN | 0.0255729 | periostin | GTEx | DepMap | Descartes | 4.56 | 87.10 |
| 3 | PRRX1 | 0.0246906 | paired related homeobox 1 | GTEx | DepMap | Descartes | 16.14 | 263.40 |
| 4 | SOD3 | 0.0238070 | superoxide dismutase 3 | GTEx | DepMap | Descartes | 1.55 | 66.66 |
| 5 | TGFBI | 0.0229178 | transforming growth factor beta induced | GTEx | DepMap | Descartes | 18.15 | 252.04 |
| 6 | TGM2 | 0.0222946 | transglutaminase 2 | GTEx | DepMap | Descartes | 16.17 | 185.92 |
| 7 | MOXD1 | 0.0222487 | monooxygenase DBH like 1 | GTEx | DepMap | Descartes | 4.78 | 105.58 |
| 8 | MMP3 | 0.0213244 | matrix metallopeptidase 3 | GTEx | DepMap | Descartes | 3.87 | 136.29 |
| 9 | FBLN5 | 0.0206212 | fibulin 5 | GTEx | DepMap | Descartes | 1.15 | 30.69 |
| 10 | CAV1 | 0.0193961 | caveolin 1 | GTEx | DepMap | Descartes | 14.65 | 284.13 |
| 11 | VEGFC | 0.0188859 | vascular endothelial growth factor C | GTEx | DepMap | Descartes | 2.52 | 71.37 |
| 12 | CAV2 | 0.0172752 | caveolin 2 | GTEx | DepMap | Descartes | 1.97 | 42.13 |
| 13 | COL8A1 | 0.0171689 | collagen type VIII alpha 1 chain | GTEx | DepMap | Descartes | 2.60 | 31.11 |
| 14 | NT5E | 0.0169442 | 5’-nucleotidase ecto | GTEx | DepMap | Descartes | 8.17 | 137.33 |
| 15 | MDFIC | 0.0163172 | MyoD family inhibitor domain containing | GTEx | DepMap | Descartes | 1.08 | 15.37 |
| 16 | MYOF | 0.0160158 | myoferlin | GTEx | DepMap | Descartes | 4.66 | 40.66 |
| 17 | INHBA | 0.0151367 | inhibin subunit beta A | GTEx | DepMap | Descartes | 3.10 | 35.16 |
| 18 | SLC38A4 | 0.0147765 | solute carrier family 38 member 4 | GTEx | DepMap | Descartes | 1.26 | 22.28 |
| 19 | SIX1 | 0.0138249 | SIX homeobox 1 | GTEx | DepMap | Descartes | 4.47 | 72.09 |
| 20 | TMSB4X | 0.0137728 | thymosin beta 4 X-linked | GTEx | DepMap | Descartes | 210.92 | 7639.78 |
| 21 | PLAT | 0.0132467 | plasminogen activator, tissue type | GTEx | DepMap | Descartes | 8.22 | 153.27 |
| 22 | SLIT2 | 0.0129130 | slit guidance ligand 2 | GTEx | DepMap | Descartes | 3.62 | 29.35 |
| 23 | GALNT5 | 0.0126703 | polypeptide N-acetylgalactosaminyltransferase 5 | GTEx | DepMap | Descartes | 0.76 | 5.05 |
| 24 | MYLK | 0.0124641 | myosin light chain kinase | GTEx | DepMap | Descartes | 6.38 | 39.95 |
| 25 | HTRA1 | 0.0124132 | HtrA serine peptidase 1 | GTEx | DepMap | Descartes | 4.71 | 136.84 |
| 26 | SERPINE1 | 0.0123534 | serpin family E member 1 | GTEx | DepMap | Descartes | 10.20 | 181.70 |
| 27 | PLAU | 0.0118510 | plasminogen activator, urokinase | GTEx | DepMap | Descartes | 2.22 | 50.61 |
| 28 | MLPH | 0.0118205 | melanophilin | GTEx | DepMap | Descartes | 1.09 | 18.03 |
| 29 | TMEM173 | 0.0117698 | NA | GTEx | DepMap | Descartes | 0.86 | NA |
| 30 | TPM2 | 0.0116125 | tropomyosin 2 | GTEx | DepMap | Descartes | 12.00 | 477.60 |
| 31 | TNC | 0.0115276 | tenascin C | GTEx | DepMap | Descartes | 3.41 | 26.65 |
| 32 | ARHGAP18 | 0.0115067 | Rho GTPase activating protein 18 | GTEx | DepMap | Descartes | 6.09 | NA |
| 33 | FGF5 | 0.0114185 | fibroblast growth factor 5 | GTEx | DepMap | Descartes | 3.63 | 42.59 |
| 34 | SLC7A8 | 0.0113247 | solute carrier family 7 member 8 | GTEx | DepMap | Descartes | 0.32 | 4.88 |
| 35 | DHRS3 | 0.0112091 | dehydrogenase/reductase 3 | GTEx | DepMap | Descartes | 1.90 | 54.14 |
| 36 | ITGA3 | 0.0103410 | integrin subunit alpha 3 | GTEx | DepMap | Descartes | 5.44 | 63.28 |
| 37 | EFEMP1 | 0.0102669 | EGF containing fibulin extracellular matrix protein 1 | GTEx | DepMap | Descartes | 2.28 | 47.74 |
| 38 | ESM1 | 0.0101441 | endothelial cell specific molecule 1 | GTEx | DepMap | Descartes | 0.20 | 6.81 |
| 39 | NTS | 0.0101359 | neurotensin | GTEx | DepMap | Descartes | 1.15 | 65.66 |
| 40 | NPR3 | 0.0100422 | natriuretic peptide receptor 3 | GTEx | DepMap | Descartes | 1.84 | 16.57 |
| 41 | ZYX | 0.0096659 | zyxin | GTEx | DepMap | Descartes | 11.07 | 308.18 |
| 42 | ITGBL1 | 0.0096657 | integrin subunit beta like 1 | GTEx | DepMap | Descartes | 1.96 | 28.93 |
| 43 | IFITM2 | 0.0094319 | interferon induced transmembrane protein 2 | GTEx | DepMap | Descartes | 3.85 | 284.07 |
| 44 | HEPH | 0.0091542 | hephaestin | GTEx | DepMap | Descartes | 0.16 | 2.02 |
| 45 | CD109 | 0.0090428 | CD109 molecule | GTEx | DepMap | Descartes | 2.31 | 16.09 |
| 46 | ITGA2 | 0.0090395 | integrin subunit alpha 2 | GTEx | DepMap | Descartes | 5.96 | 49.42 |
| 47 | IGFBP6 | 0.0090121 | insulin like growth factor binding protein 6 | GTEx | DepMap | Descartes | 6.64 | 359.34 |
| 48 | REM1 | 0.0089723 | RRAD and GEM like GTPase 1 | GTEx | DepMap | Descartes | 0.05 | 1.59 |
| 49 | COL18A1 | 0.0089630 | collagen type XVIII alpha 1 chain | GTEx | DepMap | Descartes | 3.58 | 34.65 |
| 50 | SUCNR1 | 0.0086353 | succinate receptor 1 | GTEx | DepMap | Descartes | 0.48 | 6.84 |
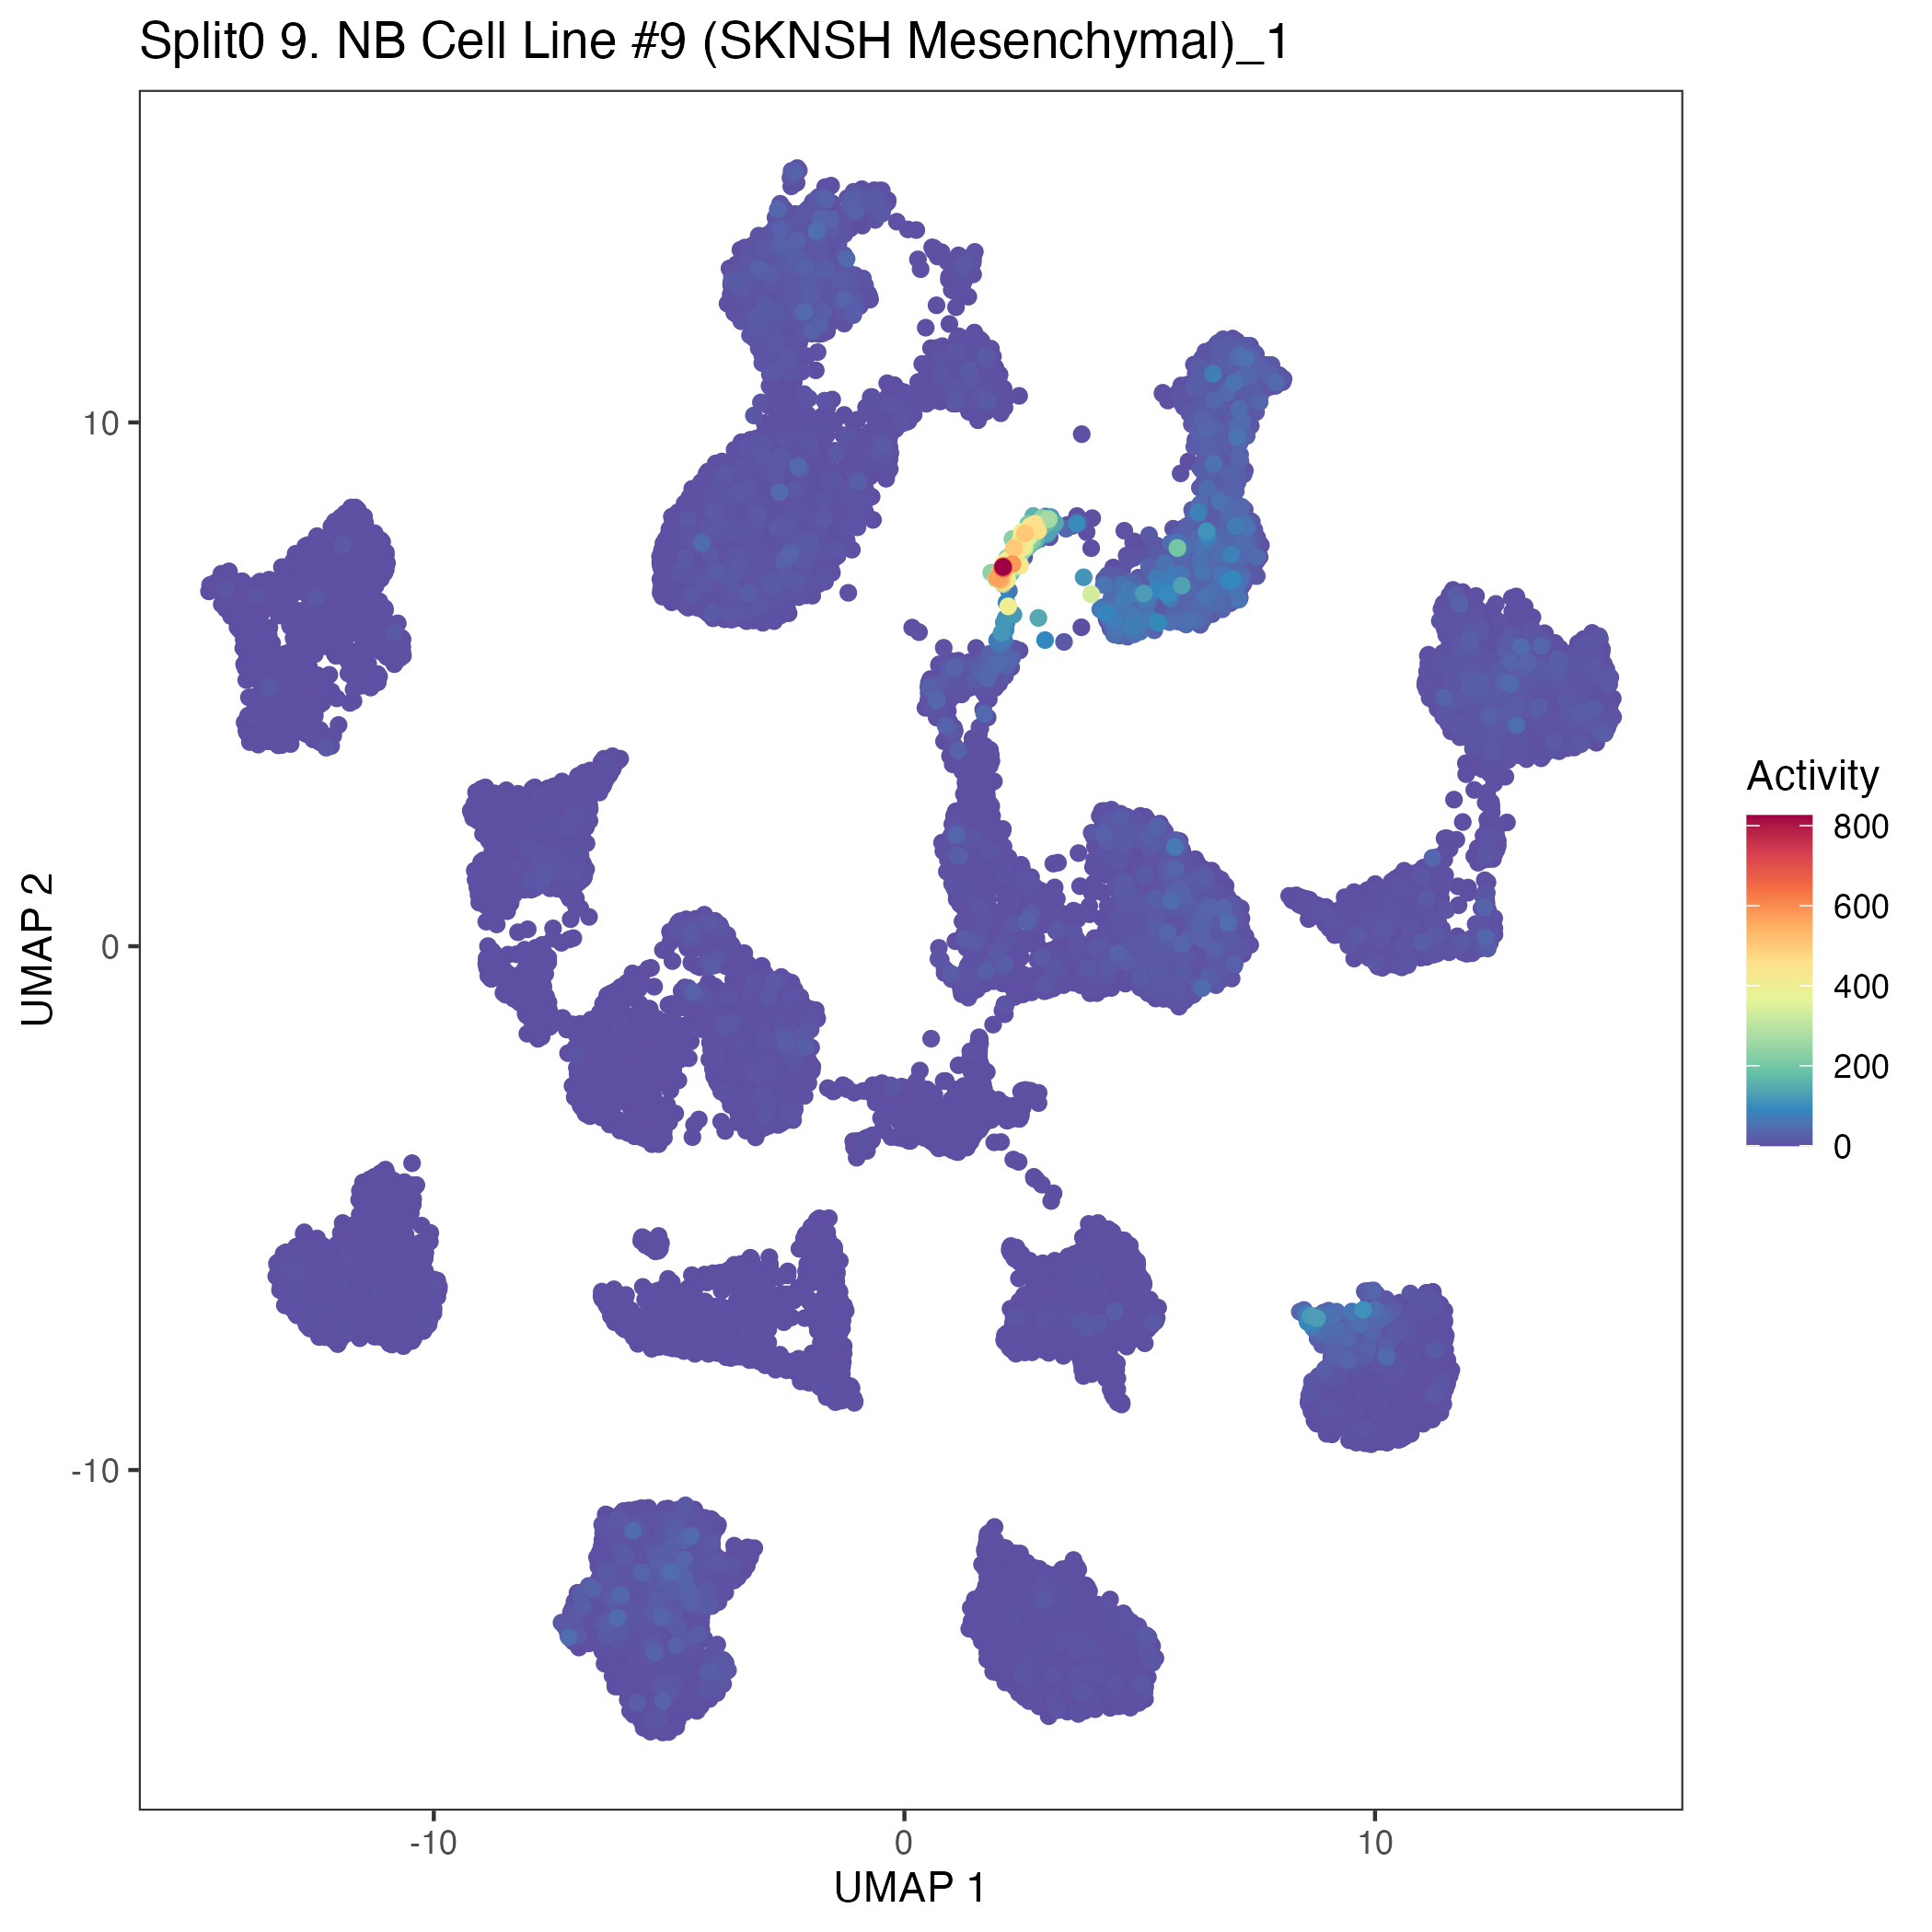
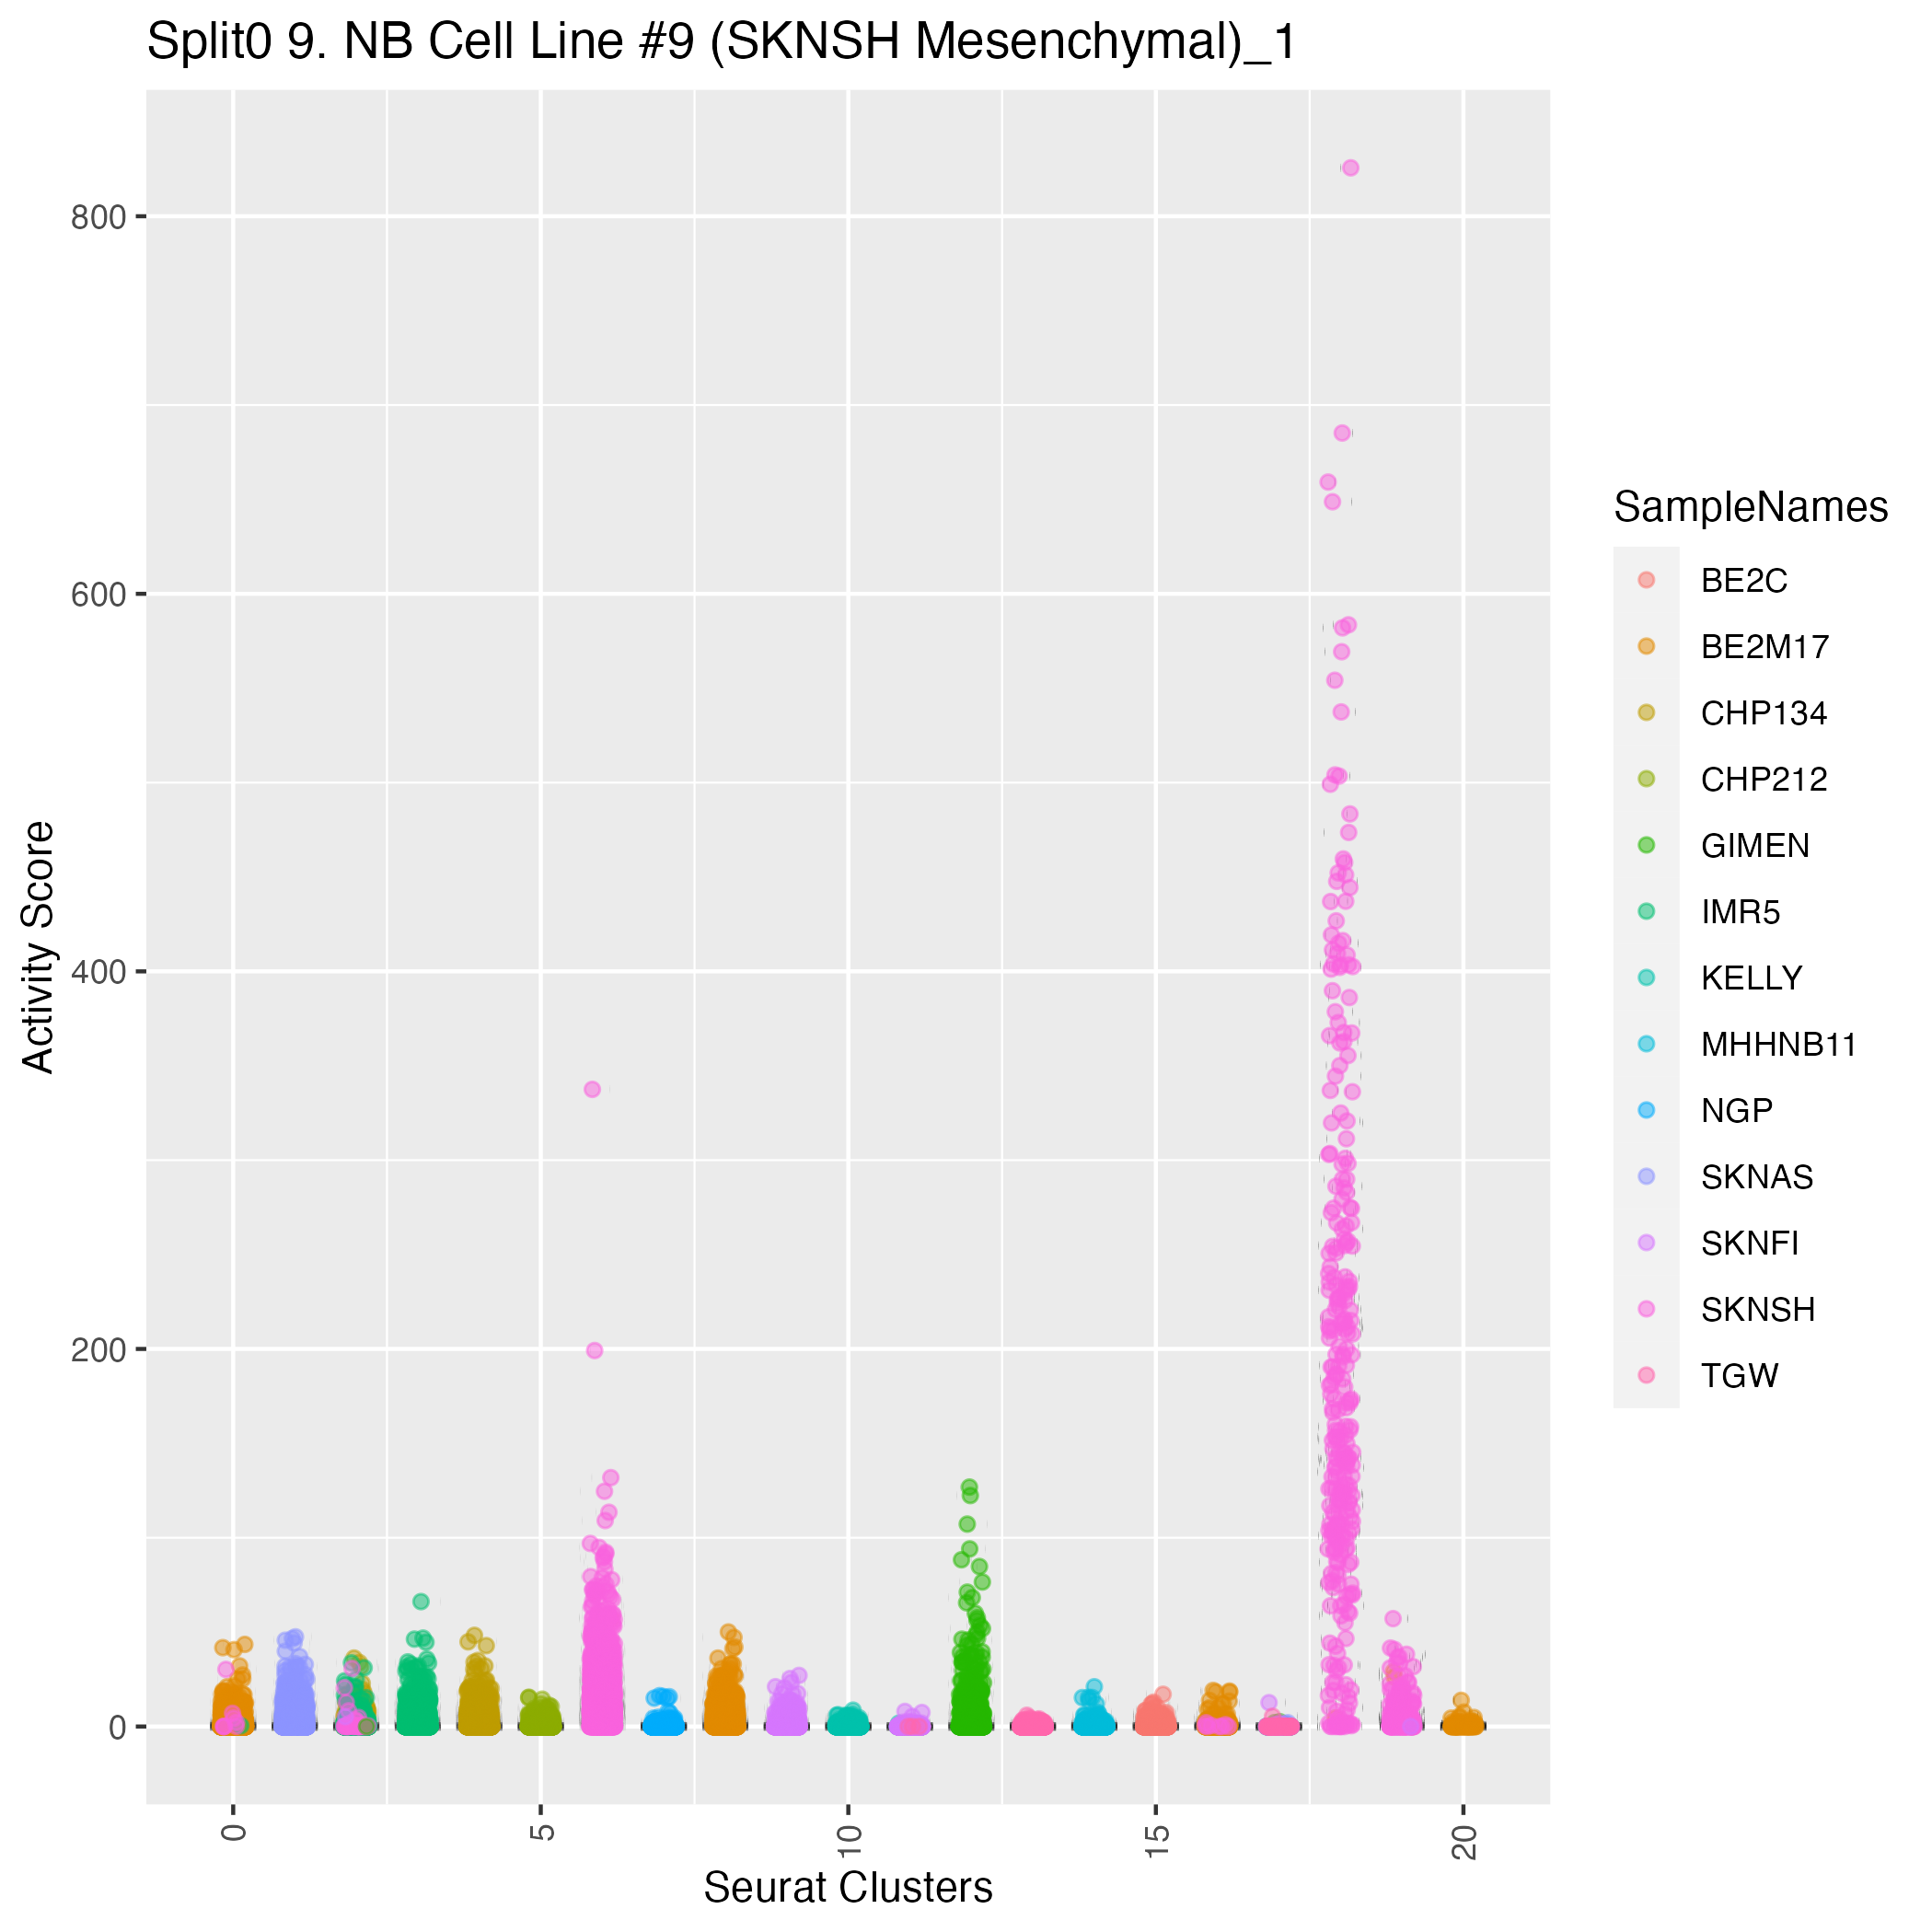
UMAP plots showing activity of gene expression program identified in community:9. NB Cell Line #9 (SKNSH Mesenchymal)
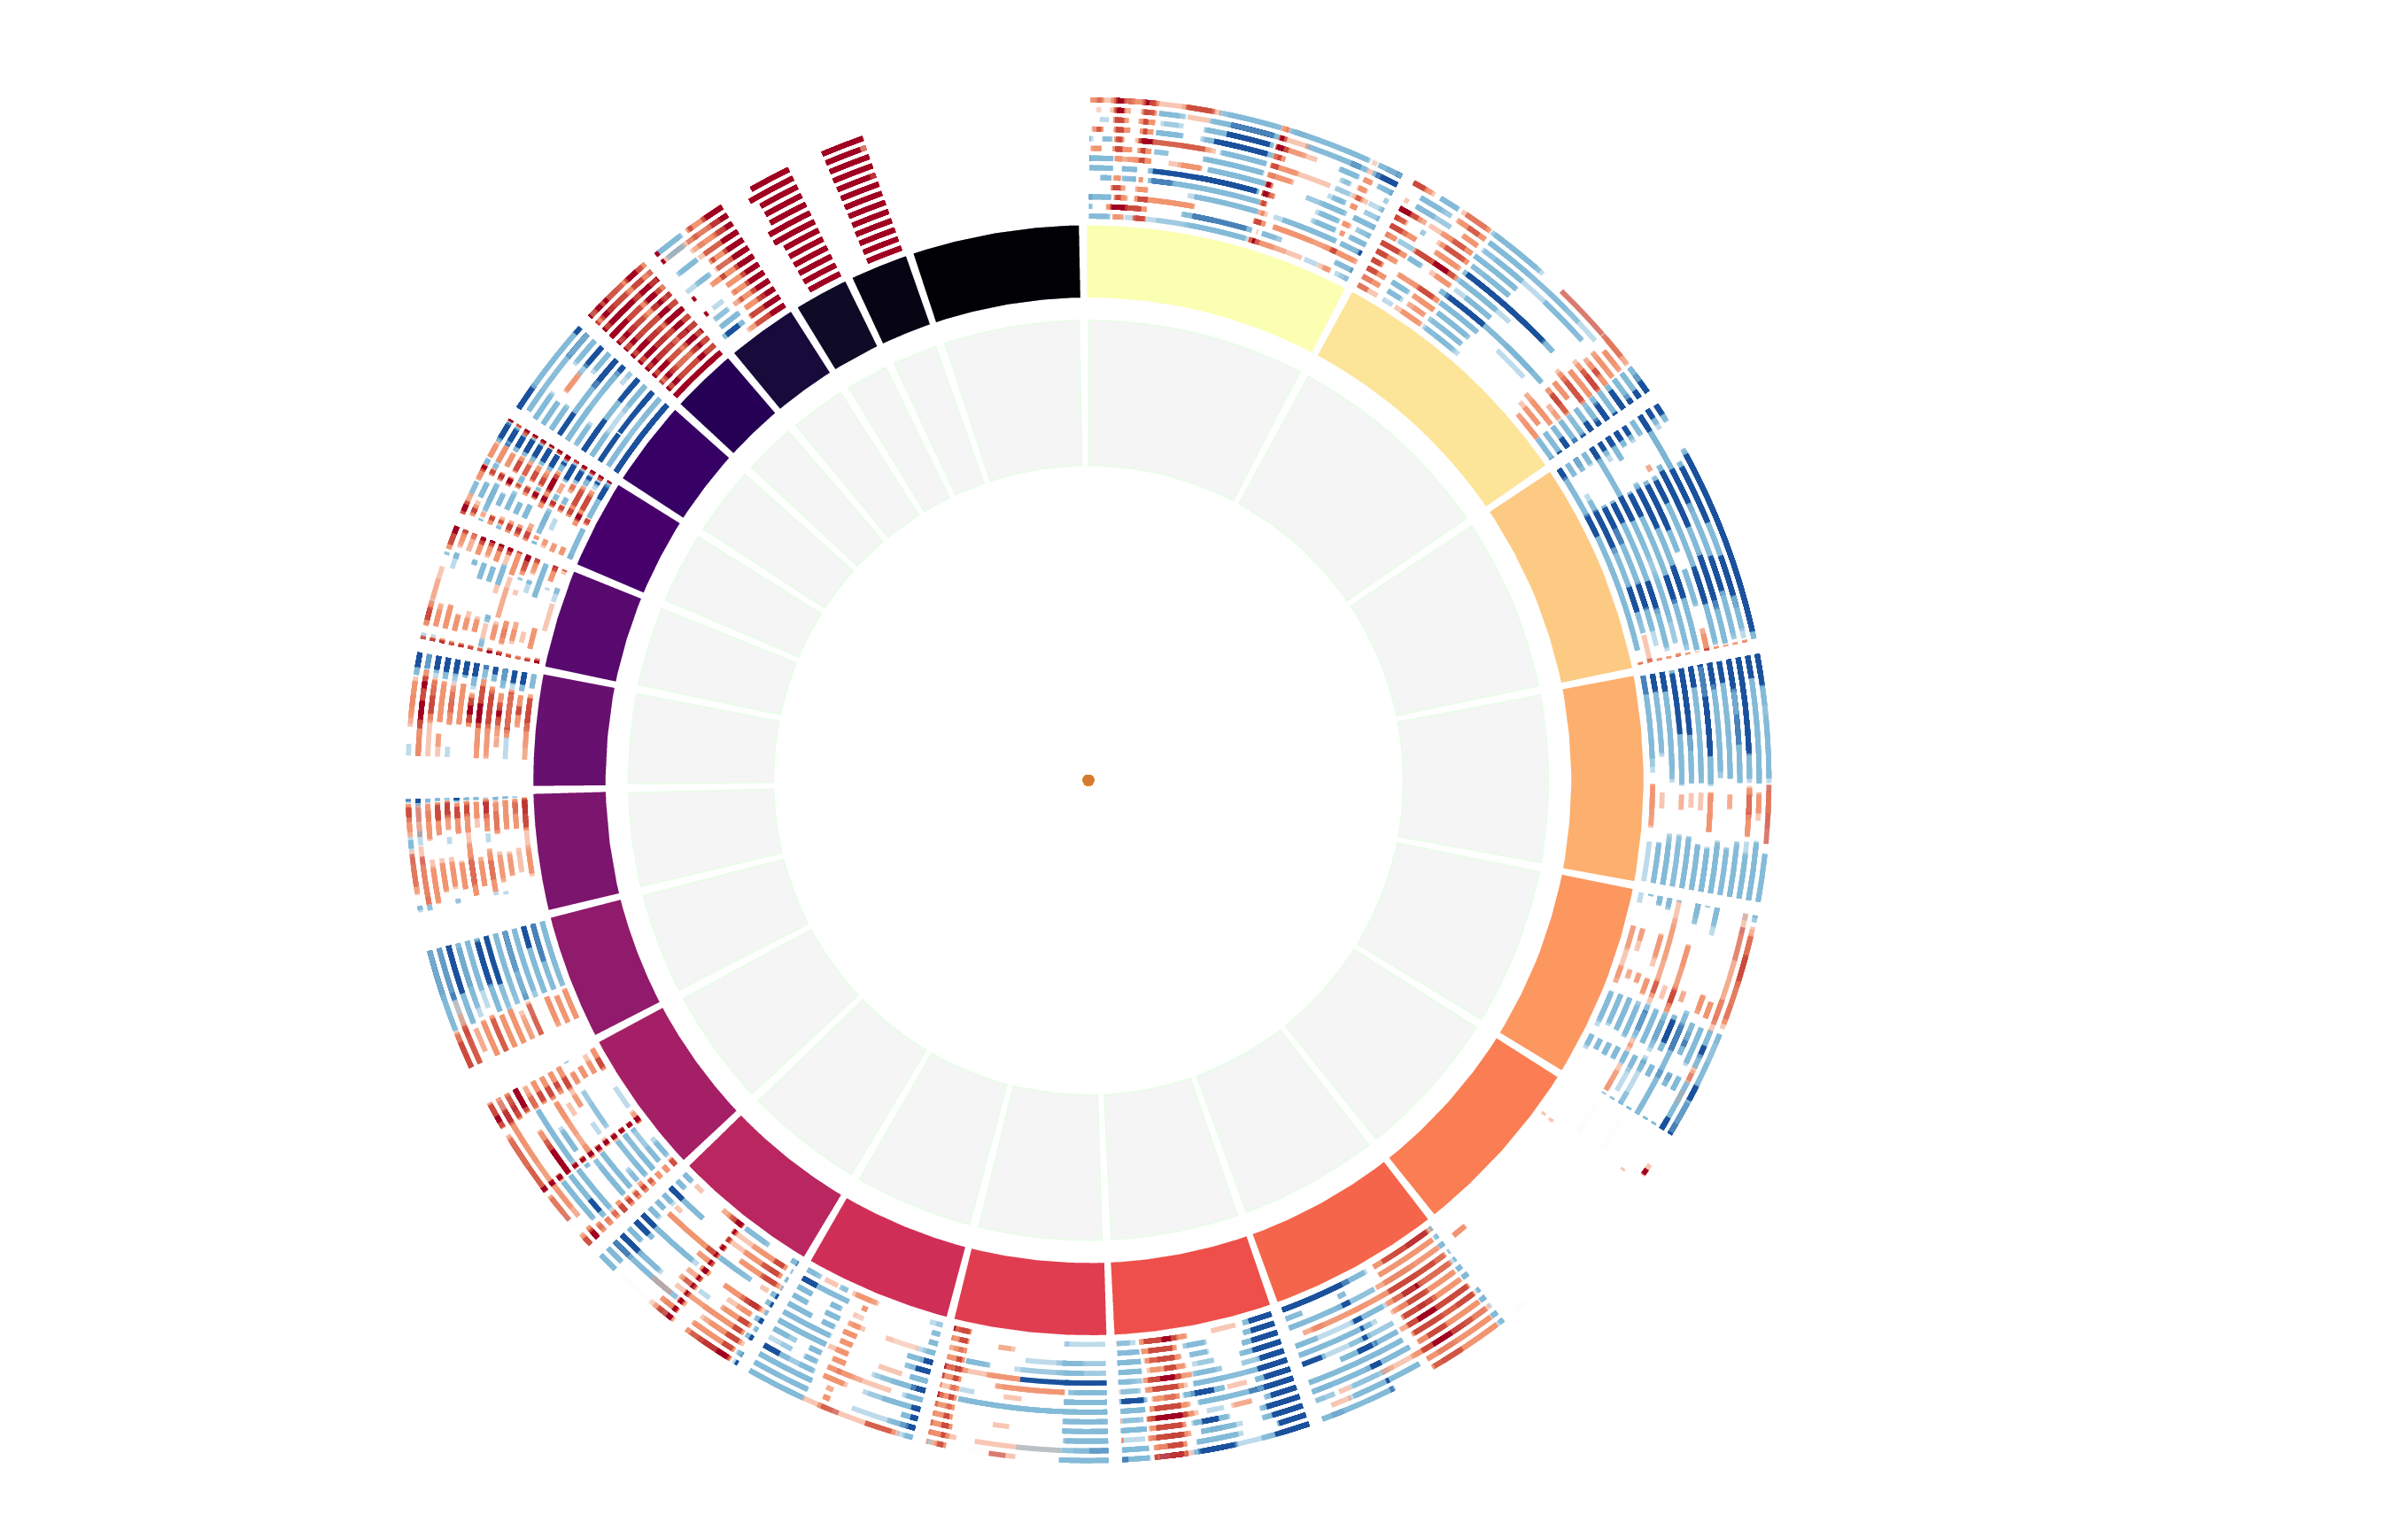
CNV Data procured from inferCNV.
Outer tracks are putative CNV regions (gains = red, losses = blue) for each patient
Inner track is expression data representing:
The top cells expressing this GEP (purple)
Random cells (n =50) from the reference set used in inferCNV (orange)
Gene set Enrichments for this program, caculated from top 50 genes
mSigDB Cell Types Gene Set:
| P-value | OR | Lower 95% CI | FDR | FWER | Genes Found | Gene Set Size | |
|---|---|---|---|---|---|---|---|
| DURANTE_ADULT_OLFACTORY_NEUROEPITHELIUM_FIBROBLASTS_STROMAL_CELLS | 2.99e-08 | 27.08 | 9.96 | 5.01e-06 | 2.00e-05 | 7POSTN, PRRX1, TGFBI, TGM2, TPM2, ITGBL1, IGFBP6 |
82 |
| MURARO_PANCREAS_MESENCHYMAL_STROMAL_CELL | 4.55e-17 | 16.22 | 8.83 | 3.06e-14 | 3.06e-14 | 23CTHRC1, POSTN, PRRX1, TGFBI, TGM2, CAV1, COL8A1, NT5E, MDFIC, MYOF, INHBA, TMSB4X, PLAT, MYLK, HTRA1, SERPINE1, PLAU, TPM2, TNC, ZYX, IFITM2, ITGA2, COL18A1 |
680 |
| CUI_DEVELOPING_HEART_ENDOCARDIAL_CELL | 1.99e-06 | 28.90 | 8.58 | 1.67e-04 | 1.34e-03 | 5CTHRC1, POSTN, NT5E, NPR3, COL18A1 |
53 |
| TRAVAGLINI_LUNG_ALVEOLAR_FIBROBLAST_CELL | 1.26e-08 | 17.70 | 7.43 | 2.83e-06 | 8.49e-06 | 9TGM2, MOXD1, FBLN5, VEGFC, COL8A1, SLIT2, DHRS3, ZYX, ITGA2 |
164 |
| CUI_DEVELOPING_HEART_C4_ENDOTHELIAL_CELL | 9.01e-08 | 17.25 | 6.86 | 1.21e-05 | 6.05e-05 | 8CTHRC1, POSTN, TGM2, CAV2, NT5E, NPR3, IFITM2, COL18A1 |
146 |
| MENON_FETAL_KIDNEY_3_STROMAL_CELLS | 1.62e-05 | 18.27 | 5.51 | 7.24e-04 | 1.09e-02 | 5POSTN, TMSB4X, MYLK, TPM2, TNC |
81 |
| DESCARTES_FETAL_EYE_STROMAL_CELLS | 2.69e-05 | 16.33 | 4.94 | 1.10e-03 | 1.81e-02 | 5CTHRC1, POSTN, INHBA, ITGBL1, IGFBP6 |
90 |
| GAO_LARGE_INTESTINE_ADULT_CJ_IMMUNE_CELLS | 3.66e-09 | 9.91 | 4.90 | 1.23e-06 | 2.46e-06 | 14POSTN, TGFBI, TGM2, FBLN5, CAV1, CAV2, PLAT, HTRA1, PLAU, TPM2, EFEMP1, NPR3, IGFBP6, COL18A1 |
505 |
| AIZARANI_LIVER_C33_STELLATE_CELLS_2 | 9.51e-06 | 14.20 | 4.85 | 5.04e-04 | 6.38e-03 | 6SOD3, CAV1, PLAT, MYLK, TPM2, IFITM2 |
126 |
| TRAVAGLINI_LUNG_ADVENTITIAL_FIBROBLAST_CELL | 1.65e-07 | 10.93 | 4.82 | 1.84e-05 | 1.11e-04 | 10PRRX1, MOXD1, FBLN5, NT5E, PLAT, SLIT2, PLAU, DHRS3, EFEMP1, IGFBP6 |
296 |
| TRAVAGLINI_LUNG_VASCULAR_SMOOTH_MUSCLE_CELL | 9.66e-05 | 19.05 | 4.82 | 3.09e-03 | 6.48e-02 | 4SOD3, CAV1, MYLK, TPM2 |
61 |
| TRAVAGLINI_LUNG_MYOFIBROBLAST_CELL | 1.24e-04 | 17.81 | 4.52 | 3.46e-03 | 8.31e-02 | 4CTHRC1, POSTN, TGFBI, TNC |
65 |
| CUI_DEVELOPING_HEART_LEFT_VENTRICULAR_CARDIOMYOCYTE | 5.25e-04 | 21.53 | 4.11 | 1.22e-02 | 3.52e-01 | 3CTHRC1, POSTN, SLIT2 |
40 |
| AIZARANI_LIVER_C21_STELLATE_CELLS_1 | 9.76e-06 | 10.88 | 4.08 | 5.04e-04 | 6.55e-03 | 7SOD3, FBLN5, CAV1, MYLK, SERPINE1, EFEMP1, IFITM2 |
194 |
| AIZARANI_LIVER_C29_MVECS_2 | 2.78e-06 | 9.03 | 3.82 | 1.86e-04 | 1.86e-03 | 9POSTN, TGM2, CAV1, CAV2, COL8A1, MYOF, SERPINE1, NTS, IFITM2 |
313 |
| TRAVAGLINI_LUNG_AIRWAY_SMOOTH_MUSCLE_CELL | 4.47e-05 | 10.65 | 3.66 | 1.67e-03 | 3.00e-02 | 6SOD3, TGM2, CAV1, CAV2, MYLK, TPM2 |
166 |
| FAN_EMBRYONIC_CTX_BIG_GROUPS_BRAIN_ENDOTHELIAL | 9.38e-06 | 7.71 | 3.27 | 5.04e-04 | 6.29e-03 | 9TGM2, CAV1, CAV2, PLAT, TPM2, ARHGAP18, SLC7A8, IFITM2, COL18A1 |
365 |
| TRAVAGLINI_LUNG_BASAL_CELL | 8.84e-05 | 9.36 | 3.22 | 2.97e-03 | 5.93e-02 | 6SOD3, TGFBI, TPM2, DHRS3, ITGA2, IGFBP6 |
188 |
| HAY_BONE_MARROW_STROMAL | 5.14e-07 | 6.48 | 3.21 | 4.92e-05 | 3.45e-04 | 14PRRX1, SOD3, CAV1, VEGFC, CAV2, SIX1, SLIT2, HTRA1, TNC, EFEMP1, ESM1, ITGBL1, HEPH, IGFBP6 |
765 |
| CUI_DEVELOPING_HEART_VASCULAR_ENDOTHELIAL_CELL | 1.02e-04 | 9.11 | 3.14 | 3.11e-03 | 6.84e-02 | 6FBLN5, HTRA1, SERPINE1, SLC7A8, DHRS3, EFEMP1 |
193 |
Dowload full table
mSigDB Hallmark Gene Sets:
| P-value | OR | Lower 95% CI | FDR | FWER | Genes Found | Gene Set Size | |
|---|---|---|---|---|---|---|---|
| HALLMARK_EPITHELIAL_MESENCHYMAL_TRANSITION | 6.65e-19 | 35.18 | 18.04 | 3.32e-17 | 3.32e-17 | 17CTHRC1, POSTN, PRRX1, TGFBI, TGM2, MMP3, FBLN5, VEGFC, NT5E, INHBA, SLIT2, MYLK, HTRA1, SERPINE1, TPM2, TNC, ITGA2 |
200 |
| HALLMARK_COAGULATION | 1.59e-05 | 12.91 | 4.42 | 3.98e-04 | 7.96e-04 | 6MMP3, PLAT, HTRA1, SERPINE1, PLAU, ITGA2 |
138 |
| HALLMARK_KRAS_SIGNALING_UP | 1.24e-04 | 8.78 | 3.02 | 2.06e-03 | 6.18e-03 | 6PRRX1, INHBA, PLAT, PLAU, ITGBL1, ITGA2 |
200 |
| HALLMARK_APICAL_JUNCTION | 1.08e-03 | 7.12 | 2.18 | 1.35e-02 | 5.40e-02 | 5TGFBI, SLIT2, ITGA3, ZYX, ITGA2 |
200 |
| HALLMARK_UV_RESPONSE_DN | 2.44e-03 | 7.76 | 2.00 | 2.44e-02 | 1.22e-01 | 4FBLN5, CAV1, SERPINE1, EFEMP1 |
144 |
| HALLMARK_TNFA_SIGNALING_VIA_NFKB | 7.71e-03 | 5.55 | 1.44 | 4.82e-02 | 3.85e-01 | 4INHBA, SERPINE1, PLAU, TNC |
200 |
| HALLMARK_HYPOXIA | 7.71e-03 | 5.55 | 1.44 | 4.82e-02 | 3.85e-01 | 4TGFBI, TGM2, CAV1, SERPINE1 |
200 |
| HALLMARK_ESTROGEN_RESPONSE_EARLY | 7.71e-03 | 5.55 | 1.44 | 4.82e-02 | 3.85e-01 | 4TGM2, MYOF, MLPH, DHRS3 |
200 |
| HALLMARK_APOPTOSIS | 2.53e-02 | 5.05 | 0.99 | 1.41e-01 | 1.00e+00 | 3CAV1, PLAT, IGFBP6 |
161 |
| HALLMARK_IL2_STAT5_SIGNALING | 4.30e-02 | 4.07 | 0.80 | 1.98e-01 | 1.00e+00 | 3TGM2, NT5E, DHRS3 |
199 |
| HALLMARK_MYOGENESIS | 4.35e-02 | 4.05 | 0.80 | 1.98e-01 | 1.00e+00 | 3SOD3, MYLK, TPM2 |
200 |
| HALLMARK_ESTROGEN_RESPONSE_LATE | 1.85e-01 | 2.63 | 0.31 | 5.69e-01 | 1.00e+00 | 2CAV1, MYOF |
200 |
| HALLMARK_COMPLEMENT | 1.85e-01 | 2.63 | 0.31 | 5.69e-01 | 1.00e+00 | 2PLAT, SERPINE1 |
200 |
| HALLMARK_INFLAMMATORY_RESPONSE | 1.85e-01 | 2.63 | 0.31 | 5.69e-01 | 1.00e+00 | 2INHBA, SERPINE1 |
200 |
| HALLMARK_GLYCOLYSIS | 1.85e-01 | 2.63 | 0.31 | 5.69e-01 | 1.00e+00 | 2TGFBI, NT5E |
200 |
| HALLMARK_ANGIOGENESIS | 1.34e-01 | 7.29 | 0.18 | 5.57e-01 | 1.00e+00 | 1POSTN |
36 |
| HALLMARK_TGF_BETA_SIGNALING | 1.94e-01 | 4.81 | 0.12 | 5.69e-01 | 1.00e+00 | 1SERPINE1 |
54 |
| HALLMARK_PROTEIN_SECRETION | 3.17e-01 | 2.68 | 0.07 | 8.42e-01 | 1.00e+00 | 1CAV2 |
96 |
| HALLMARK_INTERFERON_ALPHA_RESPONSE | 3.20e-01 | 2.66 | 0.07 | 8.42e-01 | 1.00e+00 | 1IFITM2 |
97 |
| HALLMARK_PEROXISOME | 3.39e-01 | 2.48 | 0.06 | 8.47e-01 | 1.00e+00 | 1DHRS3 |
104 |
Dowload full table
KEGG Pathways:
| P-value | OR | Lower 95% CI | FDR | FWER | Genes Found | Gene Set Size | |
|---|---|---|---|---|---|---|---|
| KEGG_FOCAL_ADHESION | 9.38e-07 | 12.47 | 4.99 | 1.74e-04 | 1.74e-04 | 8CAV1, VEGFC, CAV2, MYLK, TNC, ITGA3, ZYX, ITGA2 |
199 |
| KEGG_COMPLEMENT_AND_COAGULATION_CASCADES | 2.55e-03 | 12.08 | 2.35 | 1.58e-01 | 4.75e-01 | 3PLAT, SERPINE1, PLAU |
69 |
| KEGG_REGULATION_OF_ACTIN_CYTOSKELETON | 1.42e-03 | 6.68 | 2.05 | 1.32e-01 | 2.64e-01 | 5TMSB4X, MYLK, FGF5, ITGA3, ITGA2 |
213 |
| KEGG_HYPERTROPHIC_CARDIOMYOPATHY_HCM | 4.29e-03 | 9.97 | 1.94 | 1.65e-01 | 7.98e-01 | 3TPM2, ITGA3, ITGA2 |
83 |
| KEGG_ECM_RECEPTOR_INTERACTION | 4.44e-03 | 9.85 | 1.92 | 1.65e-01 | 8.25e-01 | 3TNC, ITGA3, ITGA2 |
84 |
| KEGG_DILATED_CARDIOMYOPATHY | 5.37e-03 | 9.17 | 1.79 | 1.67e-01 | 1.00e+00 | 3TPM2, ITGA3, ITGA2 |
90 |
| KEGG_PATHWAYS_IN_CANCER | 3.70e-02 | 3.39 | 0.88 | 8.60e-01 | 1.00e+00 | 4VEGFC, FGF5, ITGA3, ITGA2 |
325 |
| KEGG_ARRHYTHMOGENIC_RIGHT_VENTRICULAR_CARDIOMYOPATHY_ARVC | 3.47e-02 | 7.23 | 0.84 | 8.60e-01 | 1.00e+00 | 2ITGA3, ITGA2 |
74 |
| KEGG_SMALL_CELL_LUNG_CANCER | 4.36e-02 | 6.35 | 0.74 | 8.63e-01 | 1.00e+00 | 2ITGA3, ITGA2 |
84 |
| KEGG_HEMATOPOIETIC_CELL_LINEAGE | 4.64e-02 | 6.13 | 0.71 | 8.63e-01 | 1.00e+00 | 2ITGA3, ITGA2 |
87 |
| KEGG_NICOTINATE_AND_NICOTINAMIDE_METABOLISM | 9.13e-02 | 11.08 | 0.26 | 1.00e+00 | 1.00e+00 | 1NT5E |
24 |
| KEGG_CYTOKINE_CYTOKINE_RECEPTOR_INTERACTION | 2.77e-01 | 1.98 | 0.23 | 1.00e+00 | 1.00e+00 | 2VEGFC, INHBA |
265 |
| KEGG_O_GLYCAN_BIOSYNTHESIS | 1.13e-01 | 8.79 | 0.21 | 1.00e+00 | 1.00e+00 | 1GALNT5 |
30 |
| KEGG_BLADDER_CANCER | 1.54e-01 | 6.22 | 0.15 | 1.00e+00 | 1.00e+00 | 1VEGFC |
42 |
| KEGG_MTOR_SIGNALING_PATHWAY | 1.87e-01 | 5.00 | 0.12 | 1.00e+00 | 1.00e+00 | 1VEGFC |
52 |
| KEGG_RETINOL_METABOLISM | 2.25e-01 | 4.05 | 0.10 | 1.00e+00 | 1.00e+00 | 1DHRS3 |
64 |
| KEGG_P53_SIGNALING_PATHWAY | 2.37e-01 | 3.81 | 0.09 | 1.00e+00 | 1.00e+00 | 1SERPINE1 |
68 |
| KEGG_RENAL_CELL_CARCINOMA | 2.43e-01 | 3.70 | 0.09 | 1.00e+00 | 1.00e+00 | 1VEGFC |
70 |
| KEGG_PANCREATIC_CANCER | 2.43e-01 | 3.70 | 0.09 | 1.00e+00 | 1.00e+00 | 1VEGFC |
70 |
| KEGG_VIRAL_MYOCARDITIS | 2.43e-01 | 3.70 | 0.09 | 1.00e+00 | 1.00e+00 | 1CAV1 |
70 |
Dowload full table
CHR Positional Gene Sets:
| P-value | OR | Lower 95% CI | FDR | FWER | Genes Found | Gene Set Size | |
|---|---|---|---|---|---|---|---|
| chr7q31 | 1.42e-02 | 6.33 | 1.24 | 1.00e+00 | 1.00e+00 | 3CAV1, CAV2, MDFIC |
129 |
| chr5q11 | 4.45e-02 | 6.27 | 0.73 | 1.00e+00 | 1.00e+00 | 2ESM1, ITGA2 |
85 |
| chr4p15 | 8.36e-02 | 4.34 | 0.51 | 1.00e+00 | 1.00e+00 | 2SOD3, SLIT2 |
122 |
| chr20q11 | 2.37e-01 | 2.22 | 0.26 | 1.00e+00 | 1.00e+00 | 2TGM2, REM1 |
237 |
| chrXq12 | 9.85e-02 | 10.19 | 0.24 | 1.00e+00 | 1.00e+00 | 1HEPH |
26 |
| chr12q13 | 6.71e-01 | 1.29 | 0.15 | 1.00e+00 | 1.00e+00 | 2SLC38A4, IGFBP6 |
407 |
| chr3q12 | 1.67e-01 | 5.67 | 0.14 | 1.00e+00 | 1.00e+00 | 1COL8A1 |
46 |
| chr13q33 | 1.97e-01 | 4.72 | 0.12 | 1.00e+00 | 1.00e+00 | 1ITGBL1 |
55 |
| chr6q13 | 2.00e-01 | 4.64 | 0.11 | 1.00e+00 | 1.00e+00 | 1CD109 |
56 |
| chr13q13 | 2.67e-01 | 3.31 | 0.08 | 1.00e+00 | 1.00e+00 | 1POSTN |
78 |
| chr6q14 | 3.09e-01 | 2.77 | 0.07 | 1.00e+00 | 1.00e+00 | 1NT5E |
93 |
| chr8p11 | 3.15e-01 | 2.71 | 0.07 | 1.00e+00 | 1.00e+00 | 1PLAT |
95 |
| chr11q22 | 3.23e-01 | 2.63 | 0.06 | 1.00e+00 | 1.00e+00 | 1MMP3 |
98 |
| chr6q23 | 3.44e-01 | 2.43 | 0.06 | 1.00e+00 | 1.00e+00 | 1MOXD1 |
106 |
| chr2p16 | 3.64e-01 | 2.26 | 0.06 | 1.00e+00 | 1.00e+00 | 1EFEMP1 |
114 |
| chr6q22 | 3.77e-01 | 2.16 | 0.05 | 1.00e+00 | 1.00e+00 | 1ARHGAP18 |
119 |
| chr1q24 | 3.87e-01 | 2.09 | 0.05 | 1.00e+00 | 1.00e+00 | 1PRRX1 |
123 |
| chr14q23 | 3.89e-01 | 2.07 | 0.05 | 1.00e+00 | 1.00e+00 | 1SIX1 |
124 |
| chr2q24 | 3.91e-01 | 2.06 | 0.05 | 1.00e+00 | 1.00e+00 | 1GALNT5 |
125 |
| chr12q21 | 3.99e-01 | 2.01 | 0.05 | 1.00e+00 | 1.00e+00 | 1NTS |
128 |
Dowload full table
Transcription Factor Targets:
| P-value | OR | Lower 95% CI | FDR | FWER | Genes Found | Gene Set Size | |
|---|---|---|---|---|---|---|---|
| PXR_Q2 | 4.96e-04 | 6.71 | 2.32 | 3.41e-01 | 5.62e-01 | 6PRRX1, SOD3, SIX1, PLAT, ARHGAP18, DHRS3 |
260 |
| NKX6_1_TARGET_GENES | 7.55e-03 | 16.78 | 1.89 | 4.74e-01 | 1.00e+00 | 2MLPH, IGFBP6 |
33 |
| GGATTA_PITX2_Q2 | 1.66e-03 | 4.06 | 1.64 | 3.90e-01 | 1.00e+00 | 8PRRX1, SIX1, TPM2, DHRS3, ITGA3, EFEMP1, ESM1, SUCNR1 |
594 |
| TATAAA_TATA_01 | 6.03e-04 | 3.37 | 1.64 | 3.41e-01 | 6.83e-01 | 13CTHRC1, POSTN, MMP3, FBLN5, COL8A1, INHBA, SLC38A4, MYLK, SERPINE1, TPM2, FGF5, EFEMP1, ESM1 |
1317 |
| TTANTCA_UNKNOWN | 2.49e-03 | 3.27 | 1.45 | 3.90e-01 | 1.00e+00 | 10PRRX1, MMP3, COL8A1, SIX1, PLAT, MYLK, FGF5, EFEMP1, IGFBP6, SUCNR1 |
967 |
| FOX_Q2 | 9.54e-03 | 5.20 | 1.35 | 4.74e-01 | 1.00e+00 | 4CTHRC1, ITGA3, EFEMP1, ITGBL1 |
213 |
| MYOGNF1_01 | 1.55e-02 | 11.31 | 1.29 | 4.74e-01 | 1.00e+00 | 2MYLK, ESM1 |
48 |
| SRY_01 | 1.20e-02 | 4.85 | 1.26 | 4.74e-01 | 1.00e+00 | 4PRRX1, SLC38A4, DHRS3, NTS |
228 |
| SUPT16H_TARGET_GENES | 5.64e-03 | 2.52 | 1.25 | 4.74e-01 | 1.00e+00 | 14CTHRC1, SOD3, TGFBI, CAV1, COL8A1, NT5E, TMSB4X, PLAT, MYLK, PLAU, TPM2, FGF5, ITGA3, ZYX |
1944 |
| TGANTCA_AP1_C | 7.29e-03 | 2.77 | 1.23 | 4.74e-01 | 1.00e+00 | 10CTHRC1, MMP3, MYLK, PLAU, TPM2, SLC7A8, DHRS3, HEPH, ITGA2, IGFBP6 |
1139 |
| SOX9_B1 | 1.38e-02 | 4.65 | 1.20 | 4.74e-01 | 1.00e+00 | 4FBLN5, INHBA, SIX1, SLIT2 |
238 |
| MEF2_03 | 1.42e-02 | 4.61 | 1.19 | 4.74e-01 | 1.00e+00 | 4PRRX1, COL8A1, MYLK, TPM2 |
240 |
| TCF4_Q5 | 1.50e-02 | 4.53 | 1.17 | 4.74e-01 | 1.00e+00 | 4CTHRC1, PRRX1, SLC7A8, COL18A1 |
244 |
| CIZ_01 | 1.71e-02 | 4.35 | 1.13 | 4.74e-01 | 1.00e+00 | 4PRRX1, MYLK, ESM1, NPR3 |
254 |
| WGGAATGY_TEF1_Q6 | 1.64e-02 | 3.64 | 1.12 | 4.74e-01 | 1.00e+00 | 5CAV1, INHBA, ITGA3, ITGA2, IGFBP6 |
387 |
| TGGAAA_NFAT_Q4_01 | 1.89e-02 | 2.29 | 1.11 | 4.74e-01 | 1.00e+00 | 13CTHRC1, PRRX1, MMP3, VEGFC, COL8A1, MDFIC, INHBA, TPM2, ARHGAP18, SLC7A8, DHRS3, NPR3, ITGA2 |
1934 |
| CP2_01 | 1.84e-02 | 4.25 | 1.10 | 4.74e-01 | 1.00e+00 | 4SOD3, DHRS3, ESM1, IGFBP6 |
260 |
| TGCTGAY_UNKNOWN | 1.73e-02 | 3.15 | 1.09 | 4.74e-01 | 1.00e+00 | 6SIX1, MYLK, PLAU, DHRS3, ITGA3, IGFBP6 |
547 |
| TST1_01 | 1.96e-02 | 4.16 | 1.08 | 4.74e-01 | 1.00e+00 | 4FBLN5, TMSB4X, HEPH, IGFBP6 |
265 |
| LEF1_Q6 | 2.00e-02 | 4.13 | 1.07 | 4.74e-01 | 1.00e+00 | 4PRRX1, SIX1, SLC7A8, COL18A1 |
267 |
Dowload full table
GO Biological Processes:
| P-value | OR | Lower 95% CI | FDR | FWER | Genes Found | Gene Set Size | |
|---|---|---|---|---|---|---|---|
| GOBP_PLASMA_MEMBRANE_RAFT_ASSEMBLY | 2.31e-04 | 129.66 | 11.45 | 4.11e-02 | 1.00e+00 | 2CAV1, CAV2 |
6 |
| GOBP_SMOOTH_MUSCLE_CELL_MATRIX_ADHESION | 2.31e-04 | 129.66 | 11.45 | 4.11e-02 | 1.00e+00 | 2SERPINE1, PLAU |
6 |
| GOBP_DENTINOGENESIS | 2.31e-04 | 129.66 | 11.45 | 4.11e-02 | 1.00e+00 | 2HTRA1, SERPINE1 |
6 |
| GOBP_ENDOCYTOSIS_INVOLVED_IN_VIRAL_ENTRY_INTO_HOST_CELL | 3.22e-04 | 103.49 | 9.64 | 5.36e-02 | 1.00e+00 | 2CAV1, CAV2 |
7 |
| GOBP_MUSCLE_CELL_MIGRATION | 1.26e-07 | 21.64 | 8.00 | 3.15e-04 | 9.46e-04 | 7POSTN, SIX1, PLAT, SLIT2, SERPINE1, PLAU, ITGA2 |
101 |
| GOBP_PLASMA_MEMBRANE_RAFT_ORGANIZATION | 5.49e-04 | 74.10 | 7.33 | 7.76e-02 | 1.00e+00 | 2CAV1, CAV2 |
9 |
| GOBP_PLASMINOGEN_ACTIVATION | 9.91e-05 | 39.79 | 7.33 | 2.97e-02 | 7.41e-01 | 3PLAT, SERPINE1, PLAU |
23 |
| GOBP_SMOOTH_MUSCLE_CELL_MIGRATION | 1.19e-06 | 20.77 | 7.04 | 1.78e-03 | 8.92e-03 | 6POSTN, PLAT, SLIT2, SERPINE1, PLAU, ITGA2 |
88 |
| GOBP_SUBSTRATE_DEPENDENT_CELL_MIGRATION | 1.13e-04 | 37.87 | 7.01 | 3.13e-02 | 8.45e-01 | 3VEGFC, SLIT2, ITGA2 |
24 |
| GOBP_FIBRINOLYSIS | 1.28e-04 | 36.22 | 6.71 | 3.18e-02 | 9.57e-01 | 3PLAT, SERPINE1, PLAU |
25 |
| GOBP_HYPOTONIC_RESPONSE | 6.85e-04 | 64.86 | 6.55 | 9.49e-02 | 1.00e+00 | 2MYLK, ITGA2 |
10 |
| GOBP_MEMBRANE_RAFT_ASSEMBLY | 8.35e-04 | 57.69 | 5.91 | 1.10e-01 | 1.00e+00 | 2CAV1, CAV2 |
11 |
| GOBP_EXTERNAL_ENCAPSULATING_STRUCTURE_ORGANIZATION | 2.15e-09 | 11.47 | 5.55 | 1.60e-05 | 1.60e-05 | 13POSTN, TGFBI, MMP3, FBLN5, CAV1, CAV2, COL8A1, HTRA1, SERPINE1, TNC, ITGA3, ITGA2, COL18A1 |
396 |
| GOBP_MESODERMAL_CELL_DIFFERENTIATION | 2.70e-04 | 27.48 | 5.18 | 4.59e-02 | 1.00e+00 | 3INHBA, ITGA3, ITGA2 |
32 |
| GOBP_REGULATION_OF_WOUND_HEALING | 1.19e-05 | 13.64 | 4.66 | 6.83e-03 | 8.88e-02 | 6CAV1, PLAT, MYLK, SERPINE1, PLAU, CD109 |
131 |
| GOBP_POSITIVE_REGULATION_OF_CHEMOTAXIS | 1.66e-05 | 12.81 | 4.39 | 8.27e-03 | 1.24e-01 | 6VEGFC, TMSB4X, SLIT2, SERPINE1, ITGA2, SUCNR1 |
139 |
| GOBP_CELL_MATRIX_ADHESION | 2.73e-06 | 10.73 | 4.30 | 2.63e-03 | 2.04e-02 | 8POSTN, FBLN5, SERPINE1, PLAU, ITGA3, ZYX, ITGBL1, ITGA2 |
230 |
| GOBP_REGULATION_OF_COAGULATION | 1.74e-04 | 16.21 | 4.12 | 3.62e-02 | 1.00e+00 | 4CAV1, PLAT, SERPINE1, PLAU |
71 |
| GOBP_CELL_ADHESION_MEDIATED_BY_INTEGRIN | 1.84e-04 | 15.97 | 4.06 | 3.72e-02 | 1.00e+00 | 4SERPINE1, PLAU, ITGBL1, ITGA2 |
72 |
| GOBP_MULTI_ORGANISM_CELLULAR_PROCESS | 1.80e-03 | 37.11 | 3.99 | 1.98e-01 | 1.00e+00 | 2CAV1, CAV2 |
16 |
Dowload full table
Immunological Gene Sets:
| P-value | OR | Lower 95% CI | FDR | FWER | Genes Found | Gene Set Size | |
|---|---|---|---|---|---|---|---|
| GSE41978_WT_VS_ID2_KO_KLRG1_LOW_EFFECTOR_CD8_TCELL_DN | 1.24e-04 | 8.78 | 3.02 | 4.38e-01 | 6.03e-01 | 6TGM2, FBLN5, NT5E, SERPINE1, MLPH, DHRS3 |
200 |
| GSE17721_0.5H_VS_8H_CPG_BMDC_DN | 1.06e-03 | 7.16 | 2.19 | 4.38e-01 | 1.00e+00 | 5CAV1, VEGFC, SERPINE1, SLC7A8, IFITM2 |
199 |
| GSE17721_PAM3CSK4_VS_CPG_6H_BMDC_DN | 1.08e-03 | 7.12 | 2.18 | 4.38e-01 | 1.00e+00 | 5PLAT, TPM2, TNC, FGF5, IFITM2 |
200 |
| GSE17721_12H_VS_24H_LPS_BMDC_UP | 1.08e-03 | 7.12 | 2.18 | 4.38e-01 | 1.00e+00 | 5MDFIC, SLIT2, SLC7A8, ITGA3, ZYX |
200 |
| GSE339_CD4POS_VS_CD8POS_DC_UP | 1.08e-03 | 7.12 | 2.18 | 4.38e-01 | 1.00e+00 | 5TGM2, TPM2, FGF5, DHRS3, IFITM2 |
200 |
| GSE2585_CD80_HIGH_VS_LOW_AIRE_KO_MTEC_UP | 1.08e-03 | 7.12 | 2.18 | 4.38e-01 | 1.00e+00 | 5POSTN, TGFBI, CAV1, NT5E, ZYX |
200 |
| GSE4748_CTRL_VS_LPS_STIM_DC_3H_UP | 1.08e-03 | 7.12 | 2.18 | 4.38e-01 | 1.00e+00 | 5POSTN, CAV1, INHBA, SERPINE1, NPR3 |
200 |
| GSE19198_1H_VS_24H_IL21_TREATED_TCELL_UP | 1.08e-03 | 7.12 | 2.18 | 4.38e-01 | 1.00e+00 | 5TGFBI, CAV1, CAV2, ARHGAP18, SUCNR1 |
200 |
| GSE21379_WT_VS_SAP_KO_CD4_TCELL_UP | 1.08e-03 | 7.12 | 2.18 | 4.38e-01 | 1.00e+00 | 5TGFBI, MYLK, SLC7A8, DHRS3, COL18A1 |
200 |
| GSE22140_GERMFREE_VS_SPF_MOUSE_CD4_TCELL_DN | 1.08e-03 | 7.12 | 2.18 | 4.38e-01 | 1.00e+00 | 5TGFBI, HTRA1, SERPINE1, SLC7A8, IFITM2 |
200 |
| GSE22140_GERMFREE_VS_SPF_ARTHRITIC_MOUSE_CD4_TCELL_UP | 1.08e-03 | 7.12 | 2.18 | 4.38e-01 | 1.00e+00 | 5FBLN5, HTRA1, PLAU, SLC7A8, IFITM2 |
200 |
| GSE23502_BM_VS_COLON_TUMOR_HDC_KO_MYELOID_DERIVED_SUPPRESSOR_CELL_UP | 1.08e-03 | 7.12 | 2.18 | 4.38e-01 | 1.00e+00 | 5MOXD1, VEGFC, COL8A1, SLC38A4, SLIT2 |
200 |
| GSE16385_ROSIGLITAZONE_IL4_VS_IFNG_TNF_STIM_MACROPHAGE_DN | 7.07e-03 | 5.69 | 1.47 | 7.36e-01 | 1.00e+00 | 4CAV1, SLC38A4, SLIT2, EFEMP1 |
195 |
| GSE2706_UNSTIM_VS_8H_R848_DC_DN | 7.32e-03 | 5.63 | 1.46 | 7.36e-01 | 1.00e+00 | 4MOXD1, INHBA, PLAT, TNC |
197 |
| GSE2585_THYMIC_DC_VS_THYMIC_MACROPHAGE_DN | 7.45e-03 | 5.60 | 1.45 | 7.36e-01 | 1.00e+00 | 4FBLN5, CAV1, NT5E, TNC |
198 |
| GSE21546_UNSTIM_VS_ANTI_CD3_STIM_SAP1A_KO_DP_THYMOCYTES_UP | 7.45e-03 | 5.60 | 1.45 | 7.36e-01 | 1.00e+00 | 4NT5E, SERPINE1, DHRS3, ITGA2 |
198 |
| GSE22025_UNTREATED_VS_TGFB1_TREATED_CD4_TCELL_DN | 7.45e-03 | 5.60 | 1.45 | 7.36e-01 | 1.00e+00 | 4SOD3, MDFIC, INHBA, DHRS3 |
198 |
| GSE17721_CTRL_VS_LPS_1H_BMDC_DN | 7.58e-03 | 5.57 | 1.44 | 7.36e-01 | 1.00e+00 | 4TGM2, FBLN5, INHBA, SIX1 |
199 |
| GSE17721_0.5H_VS_8H_POLYIC_BMDC_DN | 7.58e-03 | 5.57 | 1.44 | 7.36e-01 | 1.00e+00 | 4TGM2, CAV1, VEGFC, MDFIC |
199 |
| GSE24634_IL4_VS_CTRL_TREATED_NAIVE_CD4_TCELL_DAY10_DN | 7.58e-03 | 5.57 | 1.44 | 7.36e-01 | 1.00e+00 | 4MYOF, INHBA, DHRS3, IGFBP6 |
199 |
Top Ranked Transcription Factors for this Gene Expression Program:
| Gene Symbol | TF Rank | DNA Binding Domain | Motif Status | IUPAC PWM | GTEx | DepMap | Decartes |
|---|---|---|---|---|---|---|---|
| PRRX1 | 3 | Yes | Known motif | Monomer or homomultimer | High-throughput in vitro | None | None |
| SIX1 | 19 | Yes | Known motif | Monomer or homomultimer | High-throughput in vitro | None | None |
| CDKN1A | 52 | No | Unlikely to be sequence specific TF | Not a DNA binding protein | No motif | None | None |
| TNFSF4 | 99 | No | Unlikely to be sequence specific TF | Not a DNA binding protein | No motif | None | Extracellular signaling molecule. Included only because it regulates TFs. |
| AEBP1 | 126 | Yes | Likely to be sequence specific TF | Monomer or homomultimer | No motif | None | This is a protease, but its ability to bind DNA is supported by both gel-shift (PMID: 15654748) and ChIP (PMID: 22723309). |
| FBN1 | 130 | No | Unlikely to be sequence specific TF | Not a DNA binding protein | No motif | None | None |
| FLNA | 144 | No | Unlikely to be sequence specific TF | Not a DNA binding protein | No motif | None | Go annotation is based on (PMID: 15684392), which shows that it binds FOXC1 and PBX1 but doesnt show evidence for binding to DNA |
| SP100 | 158 | Yes | Likely to be sequence specific TF | Monomer or homomultimer | No motif | None | Gel-shift experiments using human SP100 have shown binding to specific TTCG half sites (PMID: 11427895). |
| POLR2L | 189 | No | Unlikely to be sequence specific TF | Not a DNA binding protein | No motif | None | Does not contact DNA in the structure (PDB: 5FLM) |
| CITED2 | 200 | No | Unlikely to be sequence specific TF | Not a DNA binding protein | No motif | None | None |
| GAS6 | 208 | No | Unlikely to be sequence specific TF | Not a DNA binding protein | No motif | None | None |
| FOSL1 | 219 | Yes | Known motif | Monomer or homomultimer | High-throughput in vitro | None | None |
| NRG1 | 224 | No | Unlikely to be sequence specific TF | Not a DNA binding protein | No motif | None | Cell surface receptor - does not have predicted DBDs |
| WWTR1 | 225 | No | Unlikely to be sequence specific TF | Not a DNA binding protein | No motif | None | Transcriptional co-activator that binds to TEADs (PMID: 19324877) and TBX5 (PMID: 16332960) |
| ANXA4 | 226 | No | Unlikely to be sequence specific TF | Not a DNA binding protein | No motif | None | None |
| LPP | 234 | No | Unlikely to be sequence specific TF | Not a DNA binding protein | No motif | None | znfLIM is probably not a DNA binding domain (PMID: 8506279). The protein has been reported to be coactivator for ETV4 (PMID: 16738319). |
| OSR1 | 240 | Yes | Known motif | Monomer or homomultimer | High-throughput in vitro | None | None |
| NPAS3 | 247 | Yes | Inferred motif | Obligate heteromer | In vivo/Misc source | None | Likely obligate heteromer (PMID: 9374395; PMID: 27782878). |
| TGFB1 | 249 | No | Unlikely to be sequence specific TF | Not a DNA binding protein | No motif | None | None |
| ZMAT3 | 254 | No | ssDNA/RNA binding | Not a DNA binding protein | No motif | None | Protein binds RNA (PMID: 19805223 and PMID: 16844115). |
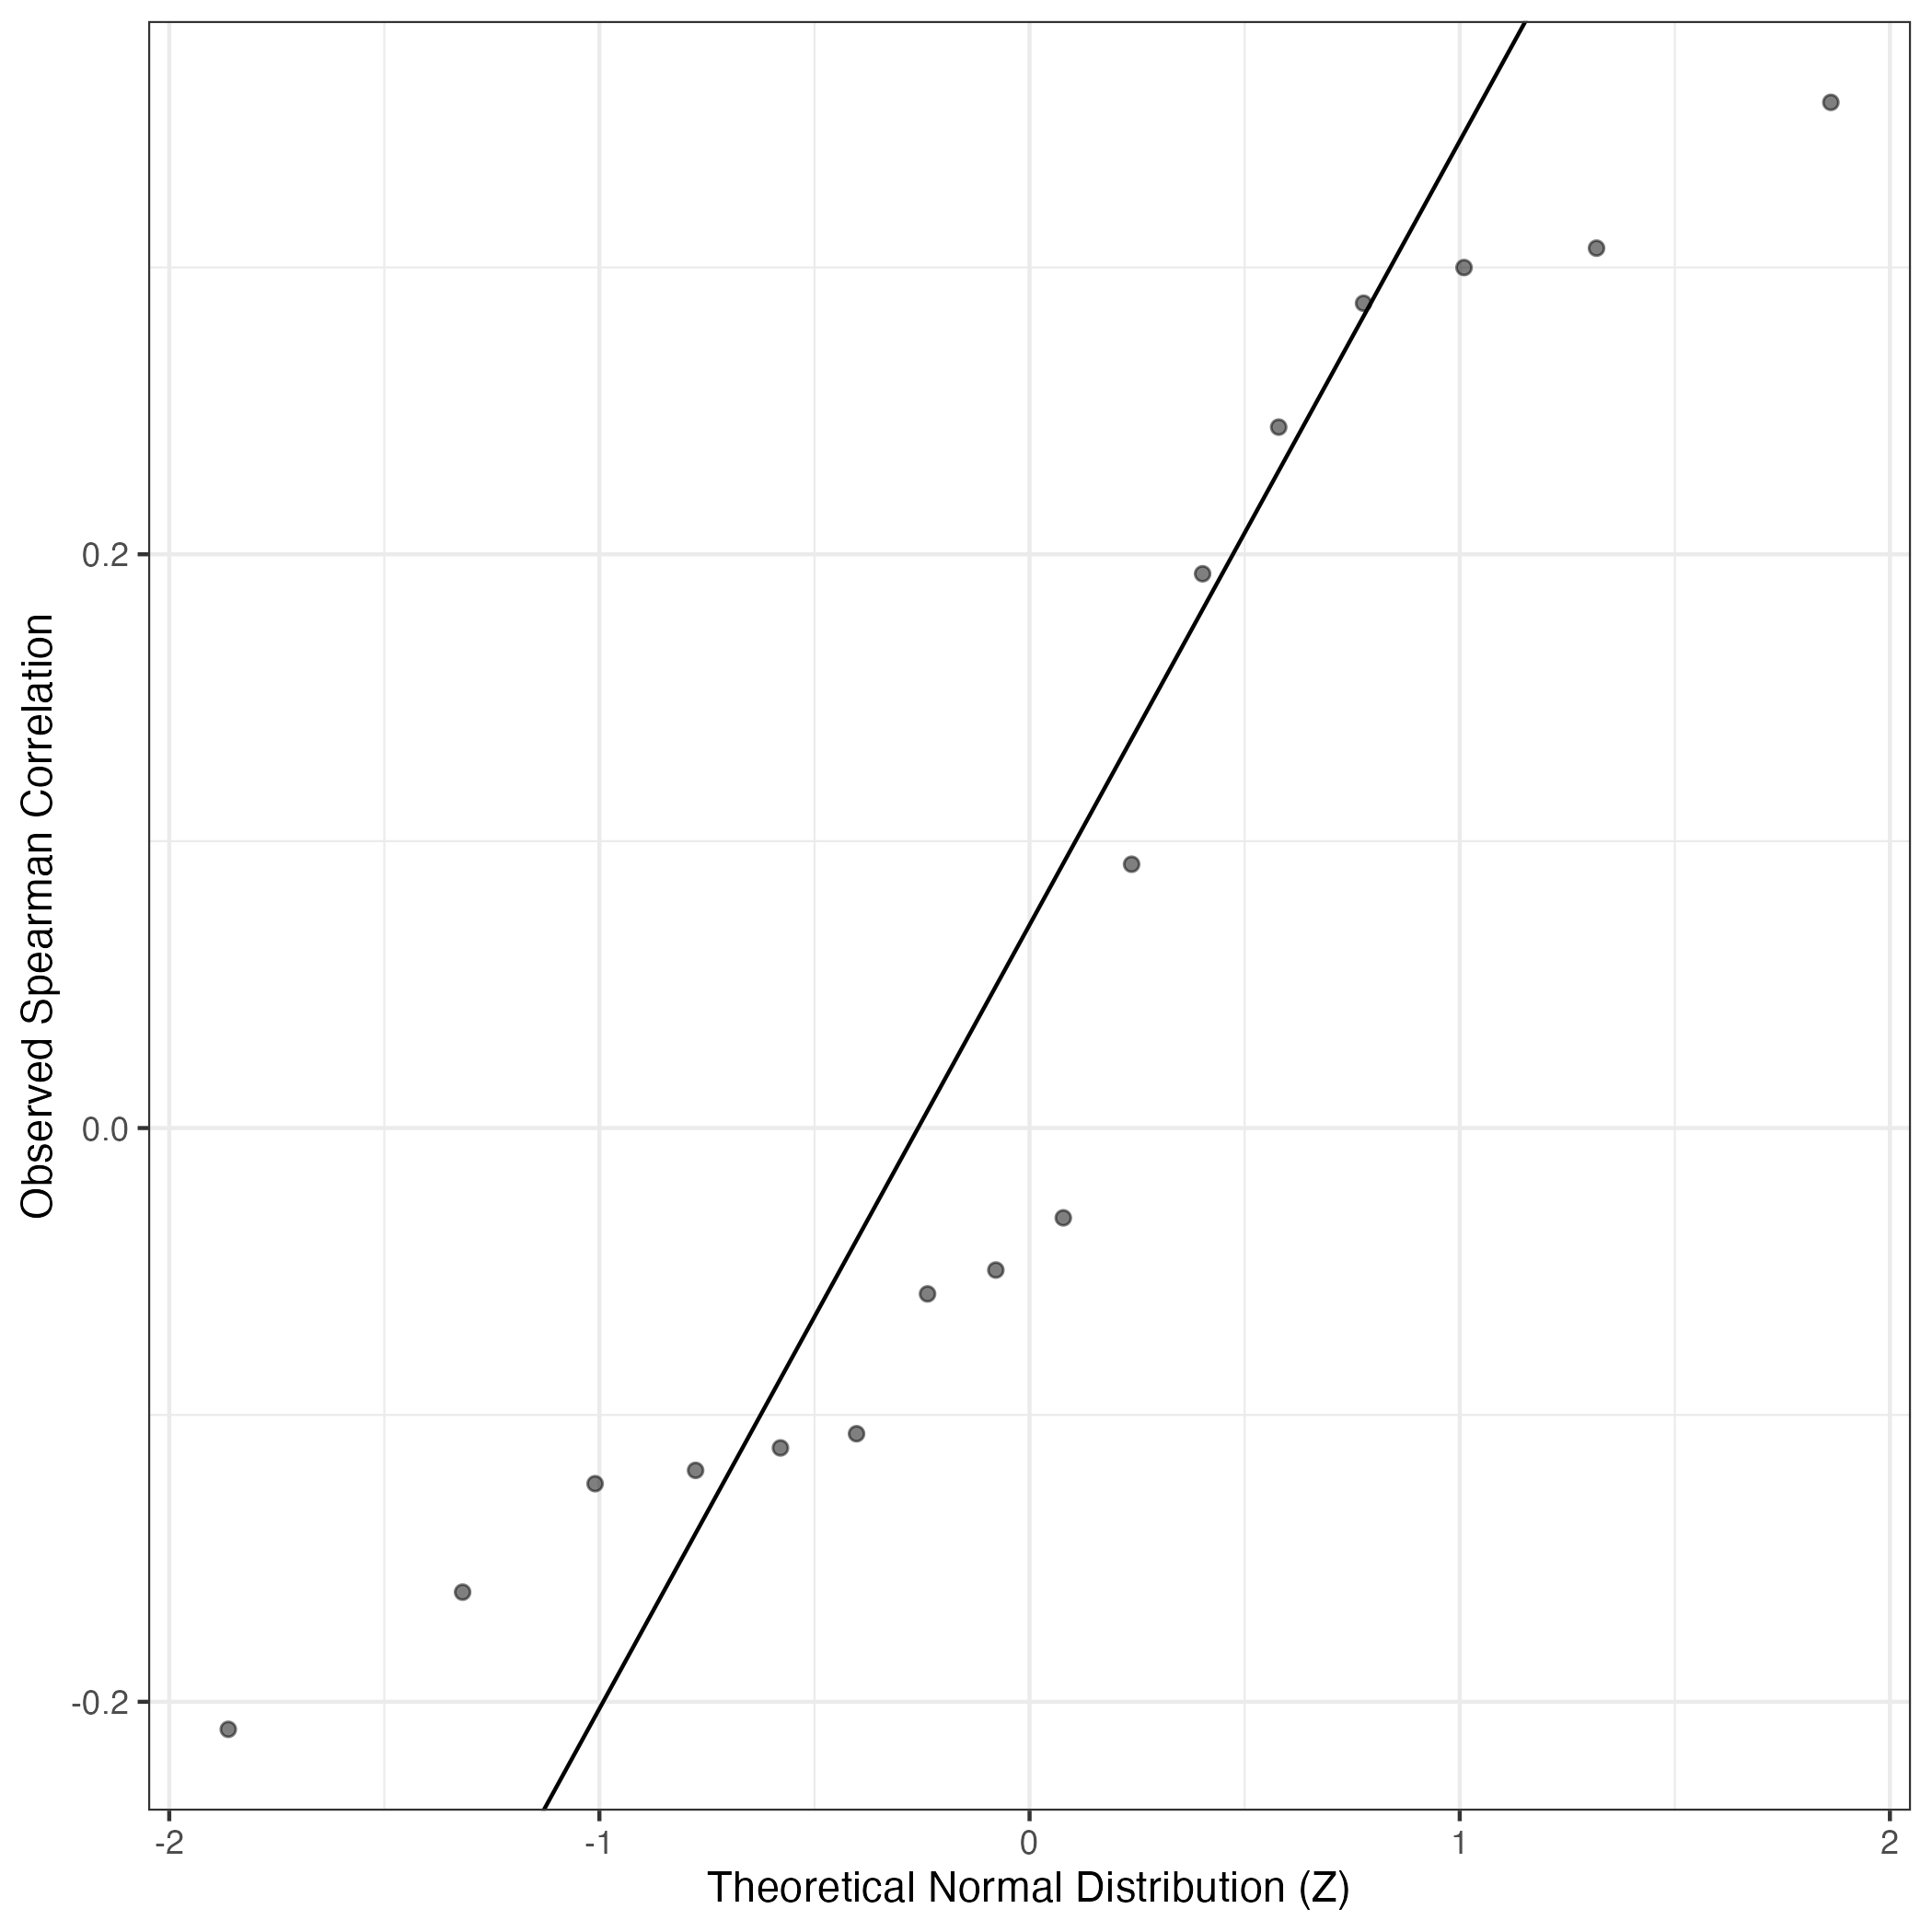
QQ Plot showing correlations with other Gene Expression Programs in this dataset, calculated by Spearman correlation:
Interactive QQ-plot of gene loadings:
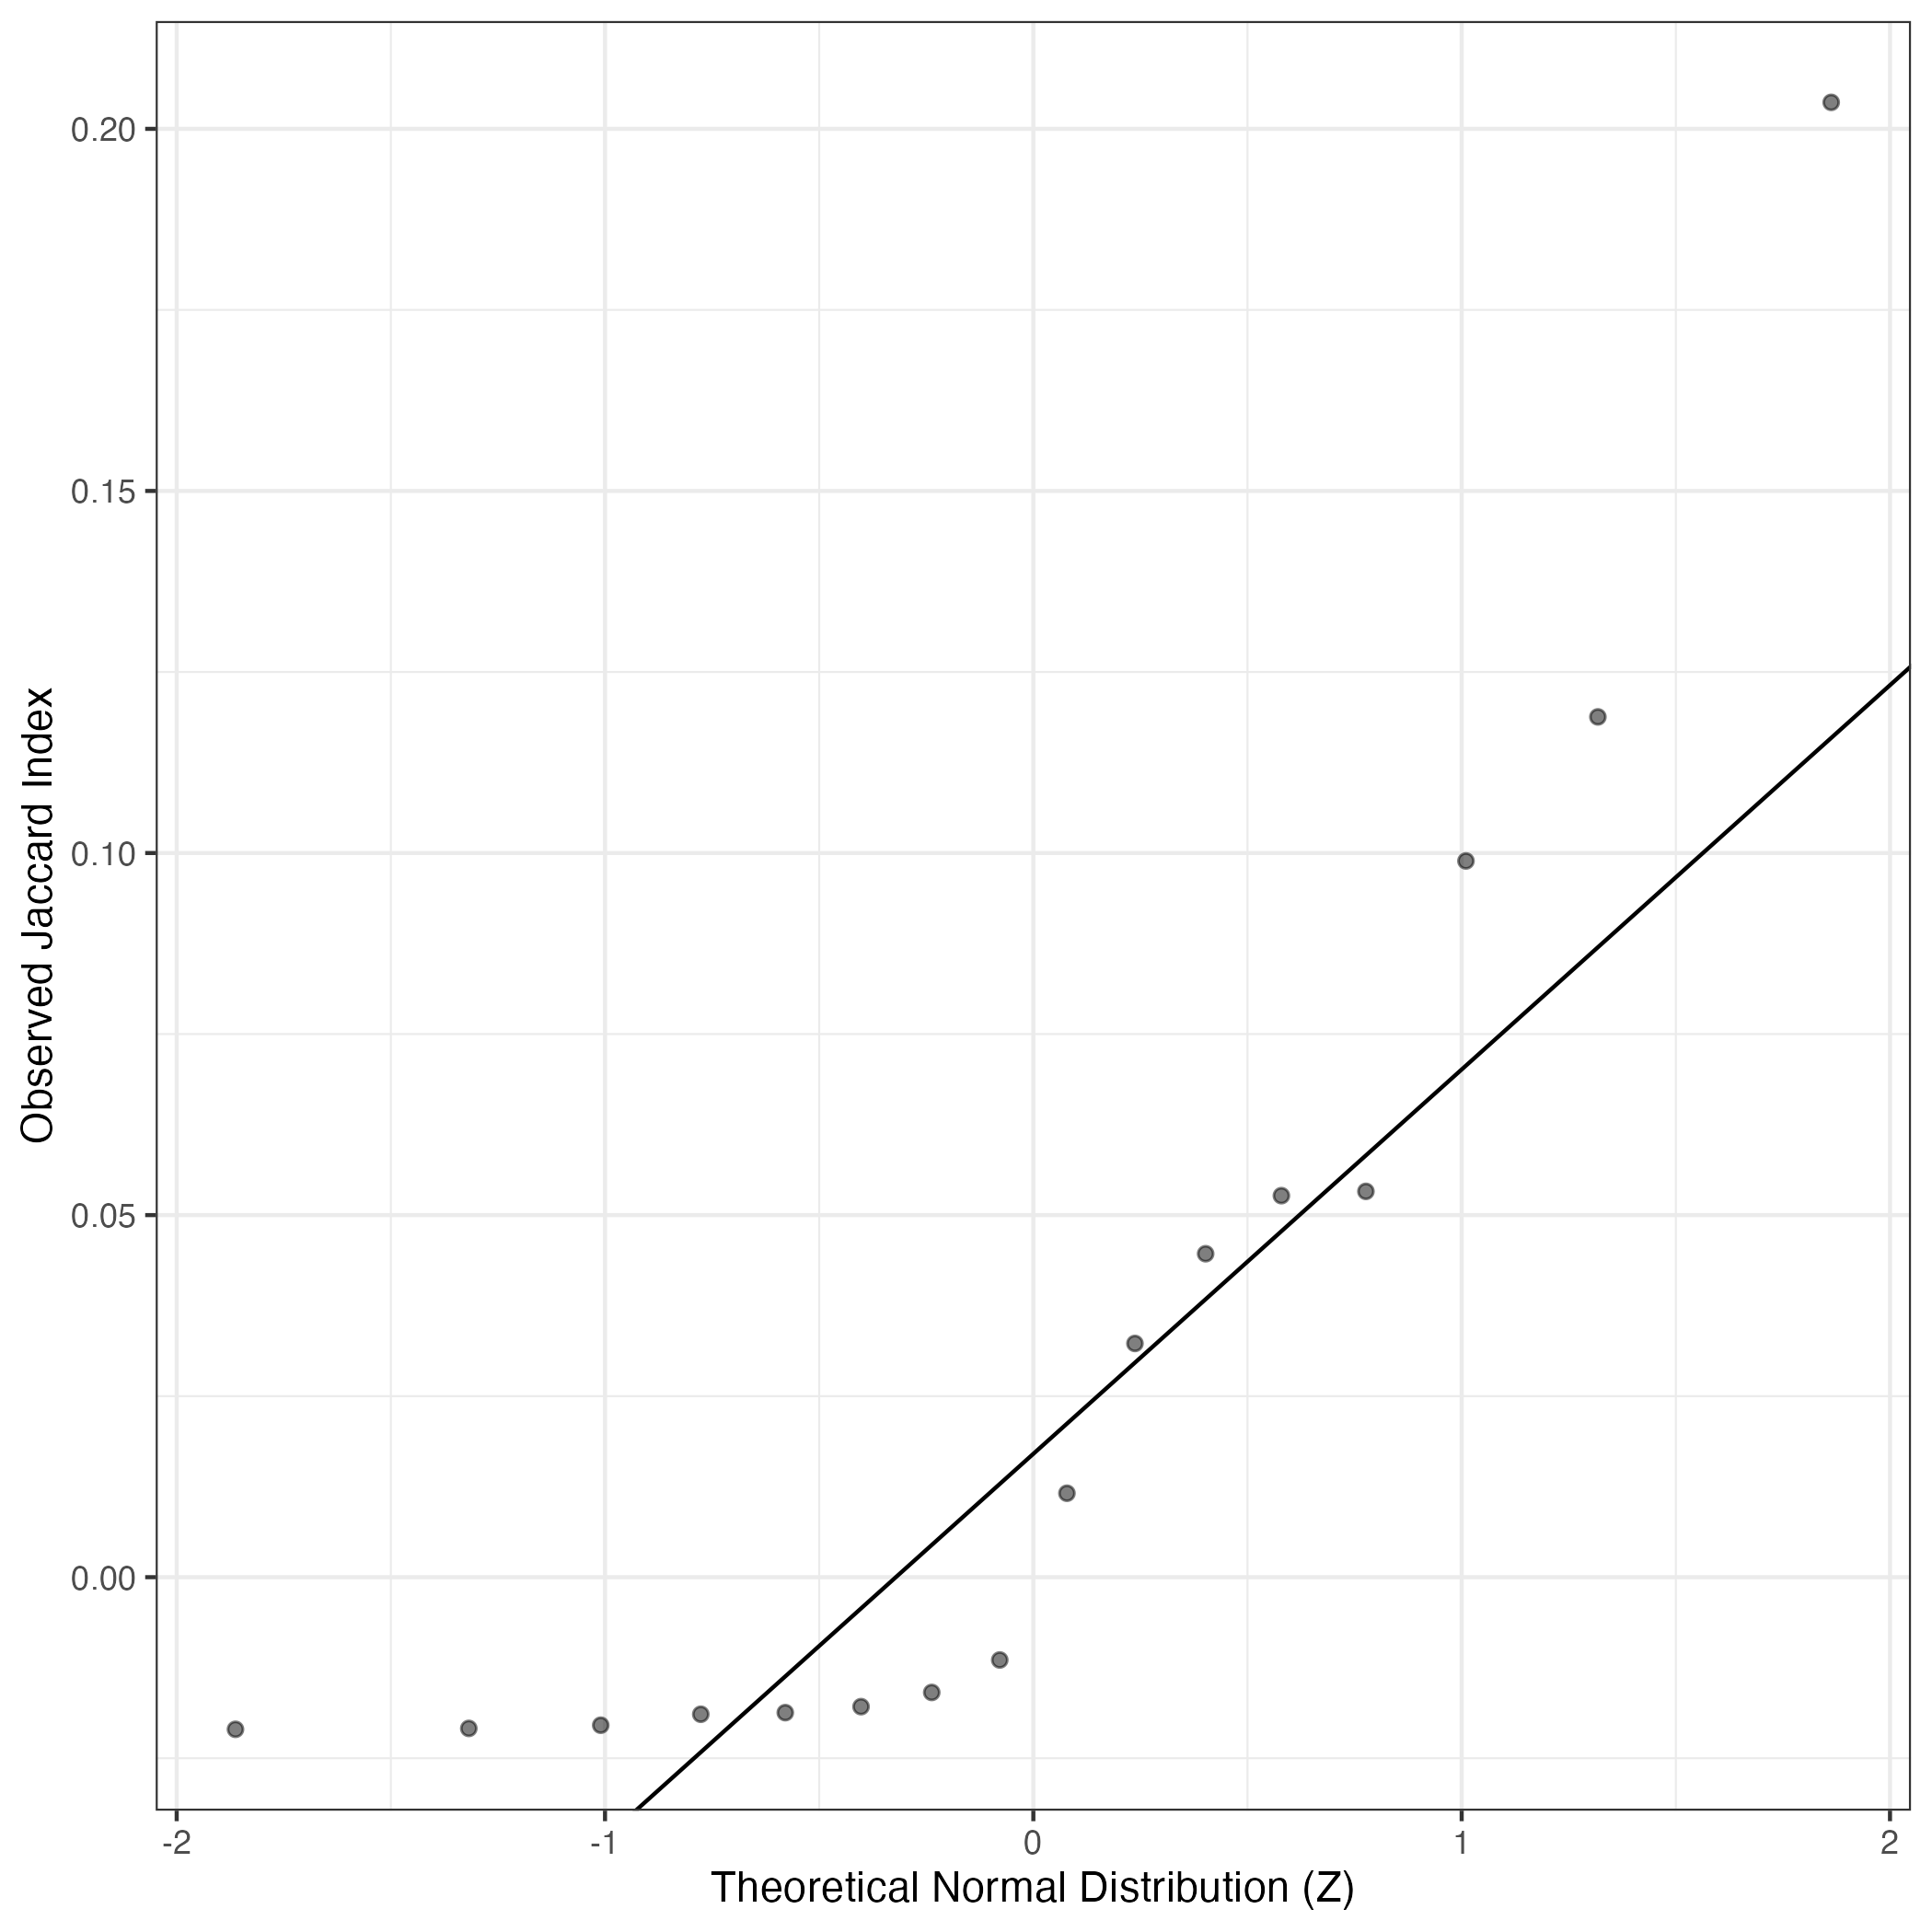
A similar QQ-plot as above, but only for instances where the H value is e.g. > 25, i.e. we are confident that the expression program is active above noise. Agreemenet between these binary vectors is tested using the Jaccard Index, with the P-values calculated by an exact test:
Interactive QQ-plot:
Singler cell type annotations for the top 50 cells on this program.
| Cell ID | Singler label | Singler Delta | Activity Score | Top Singler Raw Scores |
|---|---|---|---|---|
| SKNSH_GAACGTTCAAGAGTAT-1 | Smooth_muscle_cells | 0.24 | 825.65 | Raw ScoresMSC: 0.53, iPS_cells:CRL2097_foreskin: 0.53, iPS_cells:foreskin_fibrobasts: 0.53, Smooth_muscle_cells:vascular:IL-17: 0.53, Smooth_muscle_cells:vascular: 0.52, Fibroblasts:breast: 0.52, iPS_cells:skin_fibroblast: 0.52, Fibroblasts:foreskin: 0.52, Smooth_muscle_cells:umbilical_vein: 0.52, Tissue_stem_cells:dental_pulp: 0.52 |
| SKNSH_TATGTTCAGAATCCCT-1 | Smooth_muscle_cells | 0.26 | 685.18 | Raw ScoresMSC: 0.55, Smooth_muscle_cells:vascular:IL-17: 0.55, Smooth_muscle_cells:vascular: 0.54, iPS_cells:foreskin_fibrobasts: 0.54, iPS_cells:skin_fibroblast: 0.54, iPS_cells:CRL2097_foreskin: 0.54, Fibroblasts:breast: 0.54, Smooth_muscle_cells:umbilical_vein: 0.53, Fibroblasts:foreskin: 0.53, Tissue_stem_cells:lipoma-derived_MSC: 0.53 |
| SKNSH_CGATGGCTCCGCTGTT-1 | MSC | 0.24 | 659.20 | Raw ScoresMSC: 0.53, iPS_cells:foreskin_fibrobasts: 0.52, Smooth_muscle_cells:vascular: 0.52, iPS_cells:skin_fibroblast: 0.52, iPS_cells:CRL2097_foreskin: 0.52, Fibroblasts:foreskin: 0.51, Fibroblasts:breast: 0.51, Smooth_muscle_cells:vascular:IL-17: 0.51, Smooth_muscle_cells:umbilical_vein: 0.51, Tissue_stem_cells:lipoma-derived_MSC: 0.5 |
| SKNSH_TACCTCGTCCTTCTTC-1 | Smooth_muscle_cells | 0.22 | 648.77 | Raw ScoresMSC: 0.53, iPS_cells:CRL2097_foreskin: 0.53, iPS_cells:foreskin_fibrobasts: 0.53, iPS_cells:skin_fibroblast: 0.53, Smooth_muscle_cells:vascular: 0.52, Fibroblasts:breast: 0.52, Fibroblasts:foreskin: 0.52, Smooth_muscle_cells:vascular:IL-17: 0.52, Smooth_muscle_cells:bronchial: 0.51, Smooth_muscle_cells:bronchial:vit_D: 0.51 |
| SKNSH_CCATCACGTTGCATAC-1 | Smooth_muscle_cells | 0.22 | 583.57 | Raw ScoresiPS_cells:foreskin_fibrobasts: 0.5, iPS_cells:skin_fibroblast: 0.5, MSC: 0.5, iPS_cells:CRL2097_foreskin: 0.5, Fibroblasts:breast: 0.5, Smooth_muscle_cells:vascular: 0.49, Smooth_muscle_cells:umbilical_vein: 0.49, Fibroblasts:foreskin: 0.49, Smooth_muscle_cells:bronchial:vit_D: 0.49, Smooth_muscle_cells:vascular:IL-17: 0.49 |
| SKNSH_AGACCCGCATACTGAC-1 | MSC | 0.28 | 581.97 | Raw ScoresMSC: 0.59, iPS_cells:skin_fibroblast: 0.57, Fibroblasts:foreskin: 0.57, iPS_cells:foreskin_fibrobasts: 0.57, Tissue_stem_cells:lipoma-derived_MSC: 0.56, iPS_cells:CRL2097_foreskin: 0.56, Smooth_muscle_cells:umbilical_vein: 0.56, Smooth_muscle_cells:vascular: 0.55, iPS_cells:PDB_fibroblasts: 0.55, Tissue_stem_cells:adipose-derived_MSC_AM3: 0.55 |
| SKNSH_AGGGCTCTCTGGTCAA-1 | Tissue_stem_cells | 0.24 | 569.32 | Raw ScoresMSC: 0.51, Smooth_muscle_cells:vascular:IL-17: 0.5, Smooth_muscle_cells:vascular: 0.5, iPS_cells:skin_fibroblast: 0.5, iPS_cells:foreskin_fibrobasts: 0.5, iPS_cells:CRL2097_foreskin: 0.5, Fibroblasts:breast: 0.5, Smooth_muscle_cells:bronchial:vit_D: 0.49, Smooth_muscle_cells:bronchial: 0.49, Fibroblasts:foreskin: 0.49 |
| SKNSH_CAGGTATGTCTTGGTA-1 | Tissue_stem_cells | 0.23 | 554.22 | Raw ScoresSmooth_muscle_cells:vascular:IL-17: 0.52, Smooth_muscle_cells:vascular: 0.52, MSC: 0.51, Fibroblasts:breast: 0.51, iPS_cells:foreskin_fibrobasts: 0.51, iPS_cells:skin_fibroblast: 0.51, iPS_cells:CRL2097_foreskin: 0.51, Tissue_stem_cells:BM_MSC: 0.5, Smooth_muscle_cells:bronchial: 0.5, Smooth_muscle_cells:bronchial:vit_D: 0.5 |
| SKNSH_TCATGTTTCCTCTAAT-1 | Tissue_stem_cells | 0.25 | 537.44 | Raw ScoresMSC: 0.53, iPS_cells:CRL2097_foreskin: 0.52, iPS_cells:foreskin_fibrobasts: 0.52, Smooth_muscle_cells:vascular:IL-17: 0.52, iPS_cells:skin_fibroblast: 0.52, Fibroblasts:breast: 0.52, Fibroblasts:foreskin: 0.52, Smooth_muscle_cells:vascular: 0.52, Tissue_stem_cells:BM_MSC: 0.51, iPS_cells:adipose_stem_cells: 0.51 |
| SKNSH_GCATCTCCACTCCCTA-1 | Smooth_muscle_cells | 0.24 | 504.06 | Raw ScoresiPS_cells:CRL2097_foreskin: 0.52, MSC: 0.52, iPS_cells:foreskin_fibrobasts: 0.52, iPS_cells:skin_fibroblast: 0.51, Smooth_muscle_cells:vascular: 0.51, Fibroblasts:foreskin: 0.5, Smooth_muscle_cells:vascular:IL-17: 0.5, Fibroblasts:breast: 0.5, Smooth_muscle_cells:bronchial: 0.5, Smooth_muscle_cells:bronchial:vit_D: 0.5 |
| SKNSH_GTTGAACAGGACTAAT-1 | MSC | 0.25 | 503.46 | Raw ScoresMSC: 0.59, Tissue_stem_cells:lipoma-derived_MSC: 0.58, Tissue_stem_cells:adipose-derived_MSC_AM3: 0.57, iPS_cells:skin_fibroblast: 0.57, Fibroblasts:foreskin: 0.56, Smooth_muscle_cells:umbilical_vein: 0.56, iPS_cells:foreskin_fibrobasts: 0.56, Smooth_muscle_cells:vascular: 0.55, Tissue_stem_cells:dental_pulp: 0.55, iPS_cells:CRL2097_foreskin: 0.55 |
| SKNSH_AGAGAATAGGCAGGTT-1 | MSC | 0.26 | 499.13 | Raw ScoresMSC: 0.54, iPS_cells:foreskin_fibrobasts: 0.54, iPS_cells:CRL2097_foreskin: 0.54, iPS_cells:skin_fibroblast: 0.54, Smooth_muscle_cells:vascular: 0.53, Fibroblasts:foreskin: 0.53, Fibroblasts:breast: 0.53, Smooth_muscle_cells:vascular:IL-17: 0.52, Tissue_stem_cells:lipoma-derived_MSC: 0.52, iPS_cells:PDB_fibroblasts: 0.52 |
| SKNSH_GTAACACTCTGAGGTT-1 | Smooth_muscle_cells | 0.24 | 483.40 | Raw ScoresFibroblasts:breast: 0.49, iPS_cells:CRL2097_foreskin: 0.49, MSC: 0.49, iPS_cells:foreskin_fibrobasts: 0.49, iPS_cells:skin_fibroblast: 0.49, Smooth_muscle_cells:vascular: 0.49, Smooth_muscle_cells:vascular:IL-17: 0.49, Smooth_muscle_cells:bronchial:vit_D: 0.49, Smooth_muscle_cells:bronchial: 0.48, Fibroblasts:foreskin: 0.48 |
| SKNSH_AGCATCATCTATGCCC-1 | Smooth_muscle_cells | 0.22 | 473.60 | Raw ScoresiPS_cells:CRL2097_foreskin: 0.48, MSC: 0.48, iPS_cells:foreskin_fibrobasts: 0.48, Smooth_muscle_cells:vascular: 0.48, Fibroblasts:breast: 0.48, Smooth_muscle_cells:vascular:IL-17: 0.48, iPS_cells:skin_fibroblast: 0.48, Smooth_muscle_cells:bronchial:vit_D: 0.48, Smooth_muscle_cells:bronchial: 0.47, Tissue_stem_cells:dental_pulp: 0.47 |
| SKNSH_GGTGAAGAGGCTCCCA-1 | Tissue_stem_cells | 0.22 | 459.55 | Raw ScoresMSC: 0.53, Smooth_muscle_cells:vascular:IL-17: 0.53, Smooth_muscle_cells:vascular: 0.53, iPS_cells:foreskin_fibrobasts: 0.52, iPS_cells:skin_fibroblast: 0.52, Smooth_muscle_cells:umbilical_vein: 0.52, Fibroblasts:breast: 0.52, iPS_cells:CRL2097_foreskin: 0.52, Fibroblasts:foreskin: 0.51, Tissue_stem_cells:BM_MSC: 0.51 |
| SKNSH_TAGACCAAGCTACTAC-1 | MSC | 0.25 | 457.67 | Raw ScoresMSC: 0.52, iPS_cells:skin_fibroblast: 0.51, Fibroblasts:foreskin: 0.51, iPS_cells:foreskin_fibrobasts: 0.5, iPS_cells:CRL2097_foreskin: 0.5, Smooth_muscle_cells:vascular: 0.5, Tissue_stem_cells:dental_pulp: 0.5, Tissue_stem_cells:lipoma-derived_MSC: 0.5, Smooth_muscle_cells:umbilical_vein: 0.49, iPS_cells:PDB_fibroblasts: 0.49 |
| SKNSH_GATTTCTTCGCAATTG-1 | MSC | 0.27 | 452.16 | Raw ScoresMSC: 0.62, Tissue_stem_cells:lipoma-derived_MSC: 0.58, Smooth_muscle_cells:umbilical_vein: 0.58, iPS_cells:skin_fibroblast: 0.58, Fibroblasts:foreskin: 0.57, Tissue_stem_cells:adipose-derived_MSC_AM3: 0.57, iPS_cells:foreskin_fibrobasts: 0.57, Smooth_muscle_cells:vascular: 0.57, iPS_cells:CRL2097_foreskin: 0.56, Tissue_stem_cells:dental_pulp: 0.56 |
| SKNSH_CTGCCTACAGCCCACA-1 | Smooth_muscle_cells | 0.23 | 451.14 | Raw ScoresMSC: 0.5, iPS_cells:foreskin_fibrobasts: 0.5, iPS_cells:skin_fibroblast: 0.5, iPS_cells:CRL2097_foreskin: 0.5, Fibroblasts:foreskin: 0.49, Smooth_muscle_cells:bronchial: 0.49, Fibroblasts:breast: 0.49, Smooth_muscle_cells:vascular: 0.49, Smooth_muscle_cells:bronchial:vit_D: 0.49, Smooth_muscle_cells:vascular:IL-17: 0.49 |
| SKNSH_TGAGGAGGTTACTCAG-1 | Smooth_muscle_cells | 0.25 | 447.68 | Raw ScoresMSC: 0.58, iPS_cells:foreskin_fibrobasts: 0.57, iPS_cells:skin_fibroblast: 0.56, iPS_cells:CRL2097_foreskin: 0.56, Smooth_muscle_cells:vascular: 0.56, Smooth_muscle_cells:umbilical_vein: 0.56, Tissue_stem_cells:lipoma-derived_MSC: 0.56, Fibroblasts:foreskin: 0.56, Smooth_muscle_cells:vascular:IL-17: 0.55, Fibroblasts:breast: 0.55 |
| SKNSH_GAGCCTGGTAGATGTA-1 | Smooth_muscle_cells | 0.23 | 444.41 | Raw ScoresSmooth_muscle_cells:vascular:IL-17: 0.49, Smooth_muscle_cells:vascular: 0.49, iPS_cells:CRL2097_foreskin: 0.49, MSC: 0.49, iPS_cells:foreskin_fibrobasts: 0.48, Fibroblasts:breast: 0.48, iPS_cells:skin_fibroblast: 0.48, Fibroblasts:foreskin: 0.48, iPS_cells:adipose_stem_cells: 0.48, Smooth_muscle_cells:bronchial: 0.47 |
| SKNSH_GTACAGTTCTGGGCAC-1 | MSC | 0.27 | 437.15 | Raw ScoresMSC: 0.61, Tissue_stem_cells:lipoma-derived_MSC: 0.58, Tissue_stem_cells:adipose-derived_MSC_AM3: 0.58, iPS_cells:skin_fibroblast: 0.57, Fibroblasts:foreskin: 0.57, Smooth_muscle_cells:umbilical_vein: 0.57, iPS_cells:foreskin_fibrobasts: 0.56, Smooth_muscle_cells:vascular: 0.56, Tissue_stem_cells:dental_pulp: 0.56, iPS_cells:PDB_fibroblasts: 0.56 |
| SKNSH_CCGGTGAAGATAACAC-1 | Smooth_muscle_cells | 0.22 | 436.99 | Raw ScoresMSC: 0.52, iPS_cells:skin_fibroblast: 0.52, iPS_cells:foreskin_fibrobasts: 0.51, Smooth_muscle_cells:umbilical_vein: 0.51, Smooth_muscle_cells:vascular: 0.51, Tissue_stem_cells:lipoma-derived_MSC: 0.51, Smooth_muscle_cells:vascular:IL-17: 0.51, iPS_cells:CRL2097_foreskin: 0.51, Tissue_stem_cells:dental_pulp: 0.5, Fibroblasts:foreskin: 0.5 |
| SKNSH_CTCCCTCGTACCTATG-1 | Tissue_stem_cells | 0.21 | 426.76 | Raw ScoresMSC: 0.52, iPS_cells:foreskin_fibrobasts: 0.52, iPS_cells:CRL2097_foreskin: 0.52, iPS_cells:skin_fibroblast: 0.52, Smooth_muscle_cells:vascular: 0.51, Fibroblasts:foreskin: 0.51, Smooth_muscle_cells:vascular:IL-17: 0.51, Fibroblasts:breast: 0.51, Smooth_muscle_cells:umbilical_vein: 0.5, Smooth_muscle_cells:bronchial: 0.5 |
| SKNSH_AGGTGTTTCCTCATAT-1 | Smooth_muscle_cells | 0.24 | 419.34 | Raw ScoresMSC: 0.51, iPS_cells:foreskin_fibrobasts: 0.51, iPS_cells:CRL2097_foreskin: 0.51, iPS_cells:skin_fibroblast: 0.51, Fibroblasts:breast: 0.5, Fibroblasts:foreskin: 0.5, Smooth_muscle_cells:vascular: 0.5, Smooth_muscle_cells:vascular:IL-17: 0.5, Smooth_muscle_cells:umbilical_vein: 0.5, Smooth_muscle_cells:bronchial: 0.49 |
| SKNSH_TAACGACCAGGGATAC-1 | MSC | 0.26 | 416.29 | Raw ScoresMSC: 0.57, Tissue_stem_cells:lipoma-derived_MSC: 0.56, Smooth_muscle_cells:umbilical_vein: 0.55, iPS_cells:skin_fibroblast: 0.55, Tissue_stem_cells:adipose-derived_MSC_AM3: 0.54, iPS_cells:foreskin_fibrobasts: 0.54, Tissue_stem_cells:dental_pulp: 0.54, Smooth_muscle_cells:vascular: 0.54, Fibroblasts:foreskin: 0.54, iPS_cells:PDB_fibroblasts: 0.53 |
| SKNSH_TGCAGGCGTTATCCAG-1 | Smooth_muscle_cells | 0.26 | 414.90 | Raw ScoresMSC: 0.51, Smooth_muscle_cells:vascular: 0.51, iPS_cells:skin_fibroblast: 0.51, iPS_cells:foreskin_fibrobasts: 0.51, Smooth_muscle_cells:vascular:IL-17: 0.51, iPS_cells:CRL2097_foreskin: 0.51, Fibroblasts:foreskin: 0.5, Fibroblasts:breast: 0.5, iPS_cells:PDB_fibroblasts: 0.5, Tissue_stem_cells:lipoma-derived_MSC: 0.49 |
| SKNSH_CAGTTCCGTGGACTAG-1 | MSC | 0.23 | 411.35 | Raw ScoresMSC: 0.56, Tissue_stem_cells:lipoma-derived_MSC: 0.54, iPS_cells:skin_fibroblast: 0.53, Tissue_stem_cells:adipose-derived_MSC_AM3: 0.53, Fibroblasts:foreskin: 0.53, Smooth_muscle_cells:umbilical_vein: 0.53, iPS_cells:foreskin_fibrobasts: 0.53, iPS_cells:CRL2097_foreskin: 0.52, Tissue_stem_cells:dental_pulp: 0.52, Smooth_muscle_cells:vascular: 0.52 |
| SKNSH_AGTAACCCAGAAGCTG-1 | MSC | 0.24 | 409.46 | Raw ScoresMSC: 0.5, iPS_cells:foreskin_fibrobasts: 0.5, Smooth_muscle_cells:vascular: 0.5, iPS_cells:CRL2097_foreskin: 0.5, iPS_cells:skin_fibroblast: 0.5, Smooth_muscle_cells:vascular:IL-17: 0.5, Fibroblasts:foreskin: 0.49, Fibroblasts:breast: 0.49, Tissue_stem_cells:BM_MSC: 0.49, iPS_cells:adipose_stem_cells: 0.48 |
| SKNSH_CTCCCAACATCCGAGC-1 | Smooth_muscle_cells | 0.24 | 408.65 | Raw ScoresiPS_cells:CRL2097_foreskin: 0.47, MSC: 0.46, iPS_cells:foreskin_fibrobasts: 0.46, Smooth_muscle_cells:vascular:IL-17: 0.46, Smooth_muscle_cells:vascular: 0.46, iPS_cells:skin_fibroblast: 0.46, Fibroblasts:breast: 0.46, Fibroblasts:foreskin: 0.45, Smooth_muscle_cells:bronchial: 0.45, Smooth_muscle_cells:bronchial:vit_D: 0.45 |
| SKNSH_ATCACTTAGTGGACTG-1 | Smooth_muscle_cells | 0.25 | 403.98 | Raw ScoresMSC: 0.53, Smooth_muscle_cells:vascular: 0.52, iPS_cells:CRL2097_foreskin: 0.52, Smooth_muscle_cells:vascular:IL-17: 0.52, Fibroblasts:breast: 0.52, Tissue_stem_cells:BM_MSC: 0.51, iPS_cells:foreskin_fibrobasts: 0.51, iPS_cells:skin_fibroblast: 0.51, Fibroblasts:foreskin: 0.51, Tissue_stem_cells:dental_pulp: 0.51 |
| SKNSH_AAGTCGTTCAGGGATG-1 | MSC | 0.24 | 403.49 | Raw ScoresMSC: 0.49, iPS_cells:skin_fibroblast: 0.48, iPS_cells:foreskin_fibrobasts: 0.48, iPS_cells:CRL2097_foreskin: 0.48, Tissue_stem_cells:lipoma-derived_MSC: 0.48, Fibroblasts:foreskin: 0.47, Smooth_muscle_cells:vascular: 0.47, Smooth_muscle_cells:umbilical_vein: 0.47, iPS_cells:PDB_fibroblasts: 0.47, Smooth_muscle_cells:vascular:IL-17: 0.47 |
| SKNSH_GGTGTCGGTGATCATC-1 | Tissue_stem_cells | 0.21 | 403.37 | Raw ScoresiPS_cells:skin_fibroblast: 0.5, iPS_cells:foreskin_fibrobasts: 0.5, MSC: 0.5, Fibroblasts:breast: 0.5, iPS_cells:CRL2097_foreskin: 0.5, Smooth_muscle_cells:vascular: 0.49, Smooth_muscle_cells:vascular:IL-17: 0.49, Fibroblasts:foreskin: 0.49, iPS_cells:PDB_fibroblasts: 0.49, Tissue_stem_cells:lipoma-derived_MSC: 0.49 |
| SKNSH_CAGCACGAGAGGCGTT-1 | MSC | 0.22 | 402.56 | Raw ScoresMSC: 0.55, Fibroblasts:foreskin: 0.52, Smooth_muscle_cells:umbilical_vein: 0.52, Tissue_stem_cells:lipoma-derived_MSC: 0.52, iPS_cells:skin_fibroblast: 0.52, iPS_cells:foreskin_fibrobasts: 0.52, Smooth_muscle_cells:vascular: 0.51, Tissue_stem_cells:dental_pulp: 0.51, iPS_cells:CRL2097_foreskin: 0.51, Tissue_stem_cells:adipose-derived_MSC_AM3: 0.51 |
| SKNSH_TGTTTGTCAATTGCGT-1 | Smooth_muscle_cells | 0.22 | 402.13 | Raw ScoresFibroblasts:breast: 0.46, Smooth_muscle_cells:vascular: 0.46, Smooth_muscle_cells:vascular:IL-17: 0.46, MSC: 0.45, iPS_cells:skin_fibroblast: 0.45, iPS_cells:CRL2097_foreskin: 0.45, Smooth_muscle_cells:bronchial: 0.45, iPS_cells:foreskin_fibrobasts: 0.45, Smooth_muscle_cells:bronchial:vit_D: 0.45, iPS_cells:adipose_stem_cells: 0.44 |
| SKNSH_AGCCAATGTGTCCGGT-1 | MSC | 0.26 | 401.20 | Raw ScoresMSC: 0.52, iPS_cells:skin_fibroblast: 0.52, iPS_cells:foreskin_fibrobasts: 0.52, Fibroblasts:foreskin: 0.51, Fibroblasts:breast: 0.51, Tissue_stem_cells:lipoma-derived_MSC: 0.51, iPS_cells:CRL2097_foreskin: 0.51, Smooth_muscle_cells:umbilical_vein: 0.5, iPS_cells:PDB_fibroblasts: 0.5, iPS_cells:adipose_stem_cells: 0.5 |
| SKNSH_CACATGATCGCACGGT-1 | MSC | 0.25 | 389.76 | Raw ScoresMSC: 0.58, iPS_cells:skin_fibroblast: 0.56, Tissue_stem_cells:lipoma-derived_MSC: 0.56, iPS_cells:foreskin_fibrobasts: 0.56, Fibroblasts:foreskin: 0.55, iPS_cells:CRL2097_foreskin: 0.55, Smooth_muscle_cells:vascular: 0.55, Smooth_muscle_cells:umbilical_vein: 0.55, iPS_cells:PDB_fibroblasts: 0.54, Tissue_stem_cells:adipose-derived_MSC_AM3: 0.54 |
| SKNSH_ATTTCTGTCGACATCA-1 | MSC | 0.25 | 386.14 | Raw ScoresMSC: 0.58, Tissue_stem_cells:lipoma-derived_MSC: 0.55, iPS_cells:skin_fibroblast: 0.55, iPS_cells:foreskin_fibrobasts: 0.54, Smooth_muscle_cells:umbilical_vein: 0.54, Fibroblasts:foreskin: 0.54, Tissue_stem_cells:adipose-derived_MSC_AM3: 0.54, iPS_cells:CRL2097_foreskin: 0.54, Tissue_stem_cells:dental_pulp: 0.53, iPS_cells:PDB_fibroblasts: 0.53 |
| SKNSH_TAGGGTTCAATCGCGC-1 | Smooth_muscle_cells | 0.22 | 378.63 | Raw ScoresMSC: 0.5, Smooth_muscle_cells:vascular:IL-17: 0.5, Smooth_muscle_cells:vascular: 0.5, iPS_cells:skin_fibroblast: 0.5, iPS_cells:foreskin_fibrobasts: 0.49, iPS_cells:CRL2097_foreskin: 0.49, Smooth_muscle_cells:umbilical_vein: 0.49, Fibroblasts:breast: 0.49, Smooth_muscle_cells:bronchial: 0.49, Smooth_muscle_cells:bronchial:vit_D: 0.49 |
| SKNSH_TGGTGATCACATGAAA-1 | Tissue_stem_cells | 0.20 | 372.89 | Raw ScoresMSC: 0.5, iPS_cells:skin_fibroblast: 0.49, iPS_cells:foreskin_fibrobasts: 0.49, iPS_cells:CRL2097_foreskin: 0.49, Fibroblasts:foreskin: 0.49, Smooth_muscle_cells:vascular: 0.48, Fibroblasts:breast: 0.48, iPS_cells:PDB_fibroblasts: 0.48, Smooth_muscle_cells:umbilical_vein: 0.48, Tissue_stem_cells:lipoma-derived_MSC: 0.48 |
| SKNSH_TAACACGCATGTCGTA-1 | Smooth_muscle_cells | 0.22 | 367.62 | Raw ScoresMSC: 0.48, iPS_cells:foreskin_fibrobasts: 0.47, iPS_cells:skin_fibroblast: 0.47, Fibroblasts:breast: 0.47, Smooth_muscle_cells:vascular:IL-17: 0.47, Smooth_muscle_cells:vascular: 0.47, iPS_cells:CRL2097_foreskin: 0.47, Smooth_muscle_cells:bronchial: 0.47, Smooth_muscle_cells:bronchial:vit_D: 0.47, Fibroblasts:foreskin: 0.47 |
| SKNSH_CAATGACGTACACGTT-1 | MSC | 0.25 | 367.36 | Raw ScoresMSC: 0.53, iPS_cells:skin_fibroblast: 0.51, iPS_cells:foreskin_fibrobasts: 0.51, Fibroblasts:foreskin: 0.51, Tissue_stem_cells:lipoma-derived_MSC: 0.51, iPS_cells:CRL2097_foreskin: 0.51, iPS_cells:PDB_fibroblasts: 0.5, Smooth_muscle_cells:vascular: 0.5, Tissue_stem_cells:dental_pulp: 0.5, Smooth_muscle_cells:umbilical_vein: 0.5 |
| SKNSH_CAGCACGGTGTCATCA-1 | Smooth_muscle_cells | 0.25 | 365.98 | Raw ScoresMSC: 0.5, iPS_cells:foreskin_fibrobasts: 0.5, iPS_cells:skin_fibroblast: 0.5, iPS_cells:CRL2097_foreskin: 0.5, Smooth_muscle_cells:vascular: 0.5, Smooth_muscle_cells:bronchial: 0.49, Smooth_muscle_cells:bronchial:vit_D: 0.49, Smooth_muscle_cells:vascular:IL-17: 0.49, Fibroblasts:foreskin: 0.49, iPS_cells:PDB_fibroblasts: 0.49 |
| SKNSH_TGAGGGAAGAAGGTAG-1 | Fibroblasts | 0.21 | 362.78 | Raw ScoresiPS_cells:foreskin_fibrobasts: 0.48, MSC: 0.48, iPS_cells:skin_fibroblast: 0.47, Smooth_muscle_cells:umbilical_vein: 0.47, Fibroblasts:breast: 0.47, Smooth_muscle_cells:vascular: 0.47, Fibroblasts:foreskin: 0.47, Smooth_muscle_cells:vascular:IL-17: 0.47, iPS_cells:CRL2097_foreskin: 0.47, Smooth_muscle_cells:bronchial: 0.46 |
| SKNSH_ATTCATCGTTATCTTC-1 | Smooth_muscle_cells | 0.24 | 362.07 | Raw ScoresiPS_cells:foreskin_fibrobasts: 0.51, iPS_cells:CRL2097_foreskin: 0.51, MSC: 0.51, iPS_cells:skin_fibroblast: 0.5, Fibroblasts:foreskin: 0.5, Smooth_muscle_cells:bronchial: 0.5, Smooth_muscle_cells:bronchial:vit_D: 0.49, Smooth_muscle_cells:vascular: 0.49, iPS_cells:PDB_fibroblasts: 0.49, Smooth_muscle_cells:vascular:IL-17: 0.49 |
| SKNSH_TTAGTCTCAAACTGCT-1 | Smooth_muscle_cells | 0.24 | 355.40 | Raw ScoresMSC: 0.53, iPS_cells:foreskin_fibrobasts: 0.53, Smooth_muscle_cells:vascular:IL-17: 0.53, iPS_cells:CRL2097_foreskin: 0.53, Smooth_muscle_cells:vascular: 0.53, iPS_cells:skin_fibroblast: 0.53, Fibroblasts:breast: 0.52, Smooth_muscle_cells:umbilical_vein: 0.52, Tissue_stem_cells:dental_pulp: 0.52, iPS_cells:adipose_stem_cells: 0.52 |
| SKNSH_ATCACTTAGGGTTAAT-1 | MSC | 0.24 | 350.10 | Raw ScoresMSC: 0.55, Tissue_stem_cells:lipoma-derived_MSC: 0.54, Tissue_stem_cells:adipose-derived_MSC_AM3: 0.53, iPS_cells:skin_fibroblast: 0.52, Fibroblasts:foreskin: 0.52, iPS_cells:foreskin_fibrobasts: 0.52, Smooth_muscle_cells:umbilical_vein: 0.52, iPS_cells:CRL2097_foreskin: 0.51, Smooth_muscle_cells:vascular: 0.51, iPS_cells:PDB_fibroblasts: 0.51 |
| SKNSH_TTACTGTCACGCTGTG-1 | MSC | 0.21 | 344.51 | Raw ScoresMSC: 0.54, iPS_cells:foreskin_fibrobasts: 0.53, iPS_cells:skin_fibroblast: 0.53, Fibroblasts:foreskin: 0.53, Tissue_stem_cells:lipoma-derived_MSC: 0.52, iPS_cells:CRL2097_foreskin: 0.52, iPS_cells:PDB_fibroblasts: 0.52, Tissue_stem_cells:adipose-derived_MSC_AM3: 0.51, Smooth_muscle_cells:umbilical_vein: 0.51, Smooth_muscle_cells:vascular: 0.51 |
| SKNSH_GTGAGTTGTTACGATC-1 | Smooth_muscle_cells | 0.23 | 337.50 | Raw ScoresMSC: 0.53, Smooth_muscle_cells:umbilical_vein: 0.53, iPS_cells:foreskin_fibrobasts: 0.53, iPS_cells:skin_fibroblast: 0.53, Smooth_muscle_cells:vascular: 0.53, iPS_cells:CRL2097_foreskin: 0.52, Smooth_muscle_cells:vascular:IL-17: 0.52, Fibroblasts:foreskin: 0.52, Fibroblasts:breast: 0.52, Tissue_stem_cells:BM_MSC: 0.51 |
| SKNSH_CTCGAGGCACGACTAT-1 | Smooth_muscle_cells | 0.24 | 336.94 | Raw ScoresiPS_cells:CRL2097_foreskin: 0.49, Smooth_muscle_cells:bronchial:vit_D: 0.49, Smooth_muscle_cells:bronchial: 0.49, iPS_cells:foreskin_fibrobasts: 0.49, MSC: 0.49, iPS_cells:skin_fibroblast: 0.49, Smooth_muscle_cells:vascular: 0.48, Fibroblasts:foreskin: 0.48, Fibroblasts:breast: 0.48, Smooth_muscle_cells:vascular:IL-17: 0.48 |
| SKNSH_GGTGTCGCAGCGTATT-1 | MSC | 0.25 | 336.24 | Raw ScoresMSC: 0.58, Tissue_stem_cells:lipoma-derived_MSC: 0.56, iPS_cells:skin_fibroblast: 0.56, iPS_cells:foreskin_fibrobasts: 0.56, Fibroblasts:foreskin: 0.55, Smooth_muscle_cells:umbilical_vein: 0.55, Tissue_stem_cells:adipose-derived_MSC_AM3: 0.55, iPS_cells:CRL2097_foreskin: 0.54, Tissue_stem_cells:dental_pulp: 0.54, Smooth_muscle_cells:vascular: 0.54 |
Below shows the significant enrichments of this GEP for literature curated gene lists
This data was procured from existing single cell RNA-seq maps of neuroblastoma or related relevant data.
High ranks indicate this gene is a driver of this GEP.
These curated gene list are ranked by the P-value (on this GEP) of their constituent genes.
The Mean Count column shows the mean read count in cells scoring highly (H > 50) on this gene expression program.
Myofibroblastic CAF
These marker genes were curated across cancer subtypes in multiple organ systems as reviewed in Lavie et. al. (PMID 35883004) and contain myofibroblastic specific CAF genes:
Wilcoxon ranksum test P-value for gene set overrepresentation: 2.96e-05
Mean rank of genes in gene set: 4200.67
Rank on gene expression program of genes in gene set:
| Genes | Weight | Rank | GTEx | DepMap | Decartes | Mean.Counts | Mean.TPM |
|---|---|---|---|---|---|---|---|
| POSTN | 0.0255729 | 2 | GTEx | DepMap | Descartes | 4.56 | 87.10 |
| COL8A1 | 0.0171689 | 13 | GTEx | DepMap | Descartes | 2.60 | 31.11 |
| MYLK | 0.0124641 | 24 | GTEx | DepMap | Descartes | 6.38 | 39.95 |
| TPM2 | 0.0116125 | 30 | GTEx | DepMap | Descartes | 12.00 | 477.60 |
| TNC | 0.0115276 | 31 | GTEx | DepMap | Descartes | 3.41 | 26.65 |
| COL1A1 | 0.0076822 | 58 | GTEx | DepMap | Descartes | 23.82 | 239.91 |
| THBS2 | 0.0062578 | 81 | GTEx | DepMap | Descartes | 1.01 | 11.50 |
| COL3A1 | 0.0060486 | 87 | GTEx | DepMap | Descartes | 15.62 | 181.99 |
| CNN2 | 0.0045665 | 149 | GTEx | DepMap | Descartes | 2.79 | 74.24 |
| VCAN | 0.0044913 | 154 | GTEx | DepMap | Descartes | 7.30 | 38.27 |
| TAGLN | 0.0043156 | 165 | GTEx | DepMap | Descartes | 5.03 | 68.00 |
| MMP2 | 0.0041884 | 175 | GTEx | DepMap | Descartes | 6.08 | 105.76 |
| ACTA2 | 0.0034071 | 235 | GTEx | DepMap | Descartes | 1.48 | 63.18 |
| TGFB1 | 0.0033253 | 249 | GTEx | DepMap | Descartes | 2.67 | 56.80 |
| COL15A1 | 0.0031816 | 266 | GTEx | DepMap | Descartes | 0.01 | 0.14 |
| TPM1 | 0.0031043 | 275 | GTEx | DepMap | Descartes | 37.18 | 541.77 |
| TGFBR2 | 0.0022584 | 447 | GTEx | DepMap | Descartes | 1.31 | 12.45 |
| WNT5A | 0.0021708 | 476 | GTEx | DepMap | Descartes | 0.54 | 5.57 |
| COL5A1 | 0.0013440 | 859 | GTEx | DepMap | Descartes | 1.71 | 11.91 |
| MEF2C | 0.0012798 | 916 | GTEx | DepMap | Descartes | 0.51 | 4.07 |
| MMP11 | 0.0009270 | 1294 | GTEx | DepMap | Descartes | 0.51 | 8.16 |
| COL13A1 | 0.0008923 | 1343 | GTEx | DepMap | Descartes | 0.23 | 4.18 |
| COL5A2 | 0.0008885 | 1351 | GTEx | DepMap | Descartes | 0.51 | 4.09 |
| THY1 | 0.0008590 | 1396 | GTEx | DepMap | Descartes | 7.09 | 93.91 |
| TMEM119 | 0.0005485 | 2053 | GTEx | DepMap | Descartes | 0.61 | 13.29 |
| FN1 | 0.0003376 | 2788 | GTEx | DepMap | Descartes | 9.34 | 50.39 |
| COL4A1 | 0.0002953 | 2972 | GTEx | DepMap | Descartes | 0.61 | 6.76 |
| COL10A1 | 0.0002613 | 3128 | GTEx | DepMap | Descartes | 0.01 | 0.15 |
| PGF | 0.0001741 | 3674 | GTEx | DepMap | Descartes | 0.26 | 4.70 |
| ITGA7 | 0.0000431 | 4757 | GTEx | DepMap | Descartes | 0.07 | 1.05 |
| CNN3 | 0.0000160 | 5040 | GTEx | DepMap | Descartes | 5.85 | 170.73 |
| LUM | -0.0000430 | 5939 | GTEx | DepMap | Descartes | 1.14 | 27.70 |
| MYH11 | -0.0000556 | 6181 | GTEx | DepMap | Descartes | 0.01 | 0.19 |
| TGFBR1 | -0.0001220 | 7471 | GTEx | DepMap | Descartes | 0.52 | 5.13 |
| ACTG2 | -0.0001252 | 7536 | GTEx | DepMap | Descartes | 0.00 | 0.06 |
| VEGFA | -0.0001558 | 8008 | GTEx | DepMap | Descartes | 0.73 | 3.03 |
| COL14A1 | -0.0001672 | 8170 | GTEx | DepMap | Descartes | 0.00 | 0.00 |
| MYL9 | -0.0001872 | 8436 | GTEx | DepMap | Descartes | 0.00 | 0.00 |
| IGFBP3 | -0.0002365 | 9045 | GTEx | DepMap | Descartes | 4.13 | 59.63 |
| HOPX | -0.0002963 | 9663 | GTEx | DepMap | Descartes | 0.02 | 0.42 |
| IGFBP7 | -0.0003010 | 9701 | GTEx | DepMap | Descartes | 0.05 | 1.39 |
| COL11A1 | -0.0003095 | 9785 | GTEx | DepMap | Descartes | 0.14 | 1.00 |
| THBS1 | -0.0003770 | 10307 | GTEx | DepMap | Descartes | 0.88 | 5.63 |
| TGFB2 | -0.0003917 | 10428 | GTEx | DepMap | Descartes | 0.19 | 1.80 |
| DCN | -0.0006576 | 11704 | GTEx | DepMap | Descartes | 0.13 | 1.07 |
| BGN | -0.0006916 | 11810 | GTEx | DepMap | Descartes | 0.77 | 14.60 |
| COL12A1 | -0.0008980 | 12138 | GTEx | DepMap | Descartes | 0.00 | 0.01 |
| RGS5 | -0.0016325 | 12506 | GTEx | DepMap | Descartes | 15.61 | 155.14 |
| COL1A2 | -0.0017238 | 12517 | GTEx | DepMap | Descartes | 0.08 | 0.48 |
Stromal 2 (Hanemaaijer)
Marker genes obtained from Supplementary Table SD of Hanemaaijer et al (PMID 33500353). The authors generated single-cell RNA-seq data (sort-seq, 2,229 cells total) from mouse adrenal glads at E13.5, E14.5, E17.5, E18.5, P1 and P5. These were marker genes that matched with a similar dataset generated by Furlan et al (PMID 28684471). This particular set of markers are for Stroma subcluster:
Wilcoxon ranksum test P-value for gene set overrepresentation: 1.43e-03
Mean rank of genes in gene set: 3158.08
Rank on gene expression program of genes in gene set:
| Genes | Weight | Rank | GTEx | DepMap | Decartes | Mean.Counts | Mean.TPM |
|---|---|---|---|---|---|---|---|
| POSTN | 0.0255729 | 2 | GTEx | DepMap | Descartes | 4.56 | 87.10 |
| FBN1 | 0.0049708 | 130 | GTEx | DepMap | Descartes | 6.34 | 33.01 |
| GSN | 0.0033580 | 245 | GTEx | DepMap | Descartes | 1.83 | 15.10 |
| GAS1 | 0.0028803 | 306 | GTEx | DepMap | Descartes | 1.12 | 23.04 |
| FSTL1 | 0.0025869 | 366 | GTEx | DepMap | Descartes | 3.24 | 34.82 |
| IGFBP5 | 0.0015239 | 745 | GTEx | DepMap | Descartes | 3.00 | 29.95 |
| FBN2 | 0.0014422 | 793 | GTEx | DepMap | Descartes | 0.40 | 2.32 |
| COL5A2 | 0.0008885 | 1351 | GTEx | DepMap | Descartes | 0.51 | 4.09 |
| PENK | -0.0000104 | 5379 | GTEx | DepMap | Descartes | 0.00 | 0.00 |
| COL14A1 | -0.0001672 | 8170 | GTEx | DepMap | Descartes | 0.00 | 0.00 |
| ITM2A | -0.0002250 | 8935 | GTEx | DepMap | Descartes | 0.13 | 4.22 |
| SFRP1 | -0.0005893 | 11475 | GTEx | DepMap | Descartes | 10.33 | 112.05 |
EMT I melanoma (Kinker)
These marker genes were obtained in a pan cancer cell lines NMF analysis of scRNA-eq data in Kinker et al (PMID 33128048) - 10 metaprograms were recovered that manifest across cancers, this EMT program was melanoma specific.:
Wilcoxon ranksum test P-value for gene set overrepresentation: 1.64e-03
Mean rank of genes in gene set: 125.67
Rank on gene expression program of genes in gene set:
| Genes | Weight | Rank | GTEx | DepMap | Decartes | Mean.Counts | Mean.TPM |
|---|---|---|---|---|---|---|---|
| CAV1 | 0.0193961 | 10 | GTEx | DepMap | Descartes | 14.65 | 284.13 |
| RRAS | 0.0058658 | 92 | GTEx | DepMap | Descartes | 3.22 | 186.30 |
| TPM1 | 0.0031043 | 275 | GTEx | DepMap | Descartes | 37.18 | 541.77 |
Below shows ranks on this GEP for literature curated gene lists for large gene sets
These include those reported as mesenchymal/adrenergic by Van Groningen et al.
High ranks indicate this gene is a driver of this GEP (note these results are not ordered).
The Mean Count column shows the mean read count in cells scoring highly (H > 50) on this gene expression program.
VanGroningen Adrenergic Genes
Adrenergic marker genes from Supplementary Table 2 of Van Groningen et al. Nature Genetics 2017. These genes were identified by differential expression analysis of mesenchymal-like and adrenergic-like neuroblastoma cell lines.
Wilcoxon ranksum test P-value for gene set overrepresentation: 1.00e+00
Mean rank of genes in gene set: 10484.23
Median rank of genes in gene set: 11528
Rank on gene expression program of top 30 genes in gene set:
| Genes | Weight | Rank | GTEx | DepMap | Descartes | Mean.Counts | Mean.TPM |
|---|---|---|---|---|---|---|---|
| MAP1B | 0.0045503 | 151 | GTEx | DepMap | Descartes | 39.64 | 205.56 |
| PHPT1 | 0.0031144 | 274 | GTEx | DepMap | Descartes | 14.98 | 661.28 |
| AKAP12 | 0.0019940 | 531 | GTEx | DepMap | Descartes | 9.31 | 68.32 |
| PBX3 | 0.0016439 | 674 | GTEx | DepMap | Descartes | 2.13 | 44.70 |
| HMGA1 | 0.0015797 | 708 | GTEx | DepMap | Descartes | 9.34 | 271.96 |
| SEC11C | 0.0011570 | 1031 | GTEx | DepMap | Descartes | 3.07 | 92.94 |
| RPS6KA2 | 0.0009810 | 1218 | GTEx | DepMap | Descartes | 1.40 | 13.21 |
| IRS2 | 0.0009807 | 1220 | GTEx | DepMap | Descartes | 1.70 | 12.60 |
| CYFIP2 | 0.0008875 | 1354 | GTEx | DepMap | Descartes | 0.69 | 6.13 |
| CDC42EP3 | 0.0005932 | 1939 | GTEx | DepMap | Descartes | 6.82 | 76.12 |
| POLB | 0.0005719 | 1989 | GTEx | DepMap | Descartes | 0.84 | 38.24 |
| FHOD3 | 0.0005293 | 2107 | GTEx | DepMap | Descartes | 0.44 | 5.37 |
| ACOT7 | 0.0004766 | 2282 | GTEx | DepMap | Descartes | 1.73 | 41.77 |
| GNB1 | 0.0004560 | 2353 | GTEx | DepMap | Descartes | 4.27 | 83.53 |
| AHSA1 | 0.0003738 | 2644 | GTEx | DepMap | Descartes | 3.63 | 162.16 |
| DPYSL3 | 0.0003566 | 2712 | GTEx | DepMap | Descartes | 3.09 | 32.65 |
| GRB10 | 0.0002638 | 3121 | GTEx | DepMap | Descartes | 0.12 | 1.34 |
| HEY1 | 0.0002226 | 3333 | GTEx | DepMap | Descartes | 0.25 | 4.02 |
| MYO5A | 0.0001665 | 3727 | GTEx | DepMap | Descartes | 0.58 | 2.65 |
| PKIA | 0.0001572 | 3796 | GTEx | DepMap | Descartes | 1.80 | 26.96 |
| ST3GAL6 | 0.0001108 | 4137 | GTEx | DepMap | Descartes | 0.80 | 13.98 |
| RAB6B | 0.0000787 | 4412 | GTEx | DepMap | Descartes | 0.11 | 1.12 |
| MXI1 | 0.0000619 | 4586 | GTEx | DepMap | Descartes | 0.98 | 16.85 |
| DUSP4 | 0.0000236 | 4942 | GTEx | DepMap | Descartes | 1.58 | 17.02 |
| PPP1R9A | 0.0000230 | 4951 | GTEx | DepMap | Descartes | 0.28 | 1.53 |
| TUBB2A | -0.0000388 | 5877 | GTEx | DepMap | Descartes | 1.70 | 58.03 |
| AP1S2 | -0.0000465 | 6001 | GTEx | DepMap | Descartes | 1.78 | 30.17 |
| CERK | -0.0000560 | 6187 | GTEx | DepMap | Descartes | 1.01 | 13.92 |
| DNER | -0.0000587 | 6247 | GTEx | DepMap | Descartes | 0.04 | 0.60 |
| SETD7 | -0.0000595 | 6265 | GTEx | DepMap | Descartes | 0.48 | 4.00 |
VanGroningen Mesenchymal Genes
Mesenchymal marker genes from Supplementary Table 2 of Van Groningen et al. Nature Genetics 2017. These genes were identified by differential expression analysis of mesenchymal-like and adrenergic-like neuroblastoma cell lines.
Wilcoxon ranksum test P-value for gene set overrepresentation: 1.56e-83
Mean rank of genes in gene set: 2976.47
Median rank of genes in gene set: 1200
Rank on gene expression program of top 30 genes in gene set:
| Genes | Weight | Rank | GTEx | DepMap | Descartes | Mean.Counts | Mean.TPM |
|---|---|---|---|---|---|---|---|
| POSTN | 0.0255729 | 2 | GTEx | DepMap | Descartes | 4.56 | 87.10 |
| PRRX1 | 0.0246906 | 3 | GTEx | DepMap | Descartes | 16.14 | 263.40 |
| SIX1 | 0.0138249 | 19 | GTEx | DepMap | Descartes | 4.47 | 72.09 |
| HTRA1 | 0.0124132 | 25 | GTEx | DepMap | Descartes | 4.71 | 136.84 |
| TPM2 | 0.0116125 | 30 | GTEx | DepMap | Descartes | 12.00 | 477.60 |
| TNC | 0.0115276 | 31 | GTEx | DepMap | Descartes | 3.41 | 26.65 |
| IFITM2 | 0.0094319 | 43 | GTEx | DepMap | Descartes | 3.85 | 284.07 |
| IGFBP6 | 0.0090121 | 47 | GTEx | DepMap | Descartes | 6.64 | 359.34 |
| TNFRSF12A | 0.0078633 | 55 | GTEx | DepMap | Descartes | 12.12 | 426.84 |
| COL1A1 | 0.0076822 | 58 | GTEx | DepMap | Descartes | 23.82 | 239.91 |
| NPC2 | 0.0074660 | 59 | GTEx | DepMap | Descartes | 10.26 | 439.96 |
| DKK3 | 0.0074032 | 62 | GTEx | DepMap | Descartes | 3.42 | 22.02 |
| ARPC1B | 0.0072901 | 63 | GTEx | DepMap | Descartes | 12.79 | 425.17 |
| MRC2 | 0.0068112 | 68 | GTEx | DepMap | Descartes | 3.37 | 38.01 |
| LGALS1 | 0.0068096 | 69 | GTEx | DepMap | Descartes | 121.01 | 10909.22 |
| PLK2 | 0.0067091 | 73 | GTEx | DepMap | Descartes | 4.24 | 93.52 |
| LRP10 | 0.0064690 | 77 | GTEx | DepMap | Descartes | 3.06 | 26.22 |
| SQSTM1 | 0.0064210 | 78 | GTEx | DepMap | Descartes | 10.35 | 219.39 |
| ATP2B4 | 0.0064165 | 79 | GTEx | DepMap | Descartes | 4.22 | 29.56 |
| VIM | 0.0063946 | 80 | GTEx | DepMap | Descartes | 155.82 | 3283.30 |
| CALD1 | 0.0061957 | 83 | GTEx | DepMap | Descartes | 27.67 | 324.59 |
| LTBP1 | 0.0061756 | 84 | GTEx | DepMap | Descartes | 5.20 | 50.91 |
| IFITM3 | 0.0061228 | 85 | GTEx | DepMap | Descartes | 3.82 | 338.45 |
| COL3A1 | 0.0060486 | 87 | GTEx | DepMap | Descartes | 15.62 | 181.99 |
| PAPSS2 | 0.0059136 | 89 | GTEx | DepMap | Descartes | 2.04 | 29.65 |
| F2R | 0.0058819 | 90 | GTEx | DepMap | Descartes | 5.64 | 92.55 |
| LMNA | 0.0058227 | 93 | GTEx | DepMap | Descartes | 18.84 | 370.49 |
| CD44 | 0.0057951 | 95 | GTEx | DepMap | Descartes | 4.24 | 48.25 |
| PHLDA3 | 0.0057380 | 98 | GTEx | DepMap | Descartes | 3.46 | 73.08 |
| ANXA5 | 0.0057105 | 102 | GTEx | DepMap | Descartes | 13.85 | 491.62 |
Descartes adrenocortical markers
Top 50 marker genes of adrenocortical cells in the Decartes fetal adrenal single cell map (https://atlas.brotmanbaty.org/bbi/human-gene-expression-during-development/cell/adrenocortical/in/adrenal)
Wilcoxon ranksum test P-value for gene set overrepresentation: 8.52e-01
Mean rank of genes in gene set: 6905.92
Median rank of genes in gene set: 7549.5
Rank on gene expression program of top 30 genes in gene set:
| Genes | Weight | Rank | GTEx | DepMap | Descartes | Mean.Counts | Mean.TPM |
|---|---|---|---|---|---|---|---|
| PAPSS2 | 0.0059136 | 89 | GTEx | DepMap | Descartes | 2.04 | 29.65 |
| TM7SF2 | 0.0043790 | 159 | GTEx | DepMap | Descartes | 3.62 | 103.94 |
| FDXR | 0.0029389 | 299 | GTEx | DepMap | Descartes | 2.16 | 48.83 |
| BAIAP2L1 | 0.0027607 | 335 | GTEx | DepMap | Descartes | 0.26 | 4.06 |
| CLU | 0.0027304 | 342 | GTEx | DepMap | Descartes | 5.57 | 121.76 |
| FRMD5 | 0.0011671 | 1021 | GTEx | DepMap | Descartes | 0.54 | 6.18 |
| SH3PXD2B | 0.0005091 | 2174 | GTEx | DepMap | Descartes | 0.52 | 3.94 |
| SLC16A9 | 0.0005081 | 2181 | GTEx | DepMap | Descartes | 0.36 | 5.62 |
| NPC1 | 0.0004538 | 2359 | GTEx | DepMap | Descartes | 0.28 | 3.78 |
| POR | 0.0003317 | 2810 | GTEx | DepMap | Descartes | 0.99 | 24.13 |
| SH3BP5 | 0.0002735 | 3073 | GTEx | DepMap | Descartes | 1.06 | 18.18 |
| GRAMD1B | 0.0001304 | 3981 | GTEx | DepMap | Descartes | 0.14 | 1.30 |
| SCAP | 0.0001296 | 3988 | GTEx | DepMap | Descartes | 0.54 | 7.54 |
| ERN1 | 0.0000195 | 4987 | GTEx | DepMap | Descartes | 0.15 | 1.10 |
| DNER | -0.0000587 | 6247 | GTEx | DepMap | Descartes | 0.04 | 0.60 |
| FDX1 | -0.0000768 | 6606 | GTEx | DepMap | Descartes | 0.86 | 15.83 |
| INHA | -0.0001153 | 7358 | GTEx | DepMap | Descartes | 0.00 | 0.16 |
| STAR | -0.0001244 | 7521 | GTEx | DepMap | Descartes | 0.00 | 0.06 |
| SGCZ | -0.0001273 | 7578 | GTEx | DepMap | Descartes | 0.00 | 0.01 |
| FREM2 | -0.0001279 | 7589 | GTEx | DepMap | Descartes | 0.00 | 0.00 |
| SCARB1 | -0.0001974 | 8570 | GTEx | DepMap | Descartes | 0.46 | 5.13 |
| APOC1 | -0.0002628 | 9333 | GTEx | DepMap | Descartes | 0.15 | 12.10 |
| SLC1A2 | -0.0002957 | 9658 | GTEx | DepMap | Descartes | 0.00 | 0.00 |
| DHCR7 | -0.0003731 | 10281 | GTEx | DepMap | Descartes | 0.44 | 9.97 |
| PEG3 | -0.0004281 | 10667 | GTEx | DepMap | Descartes | 0.03 | NA |
| PDE10A | -0.0004414 | 10756 | GTEx | DepMap | Descartes | 0.03 | 0.18 |
| LDLR | -0.0005305 | 11224 | GTEx | DepMap | Descartes | 0.64 | 6.65 |
| CYB5B | -0.0005406 | 11266 | GTEx | DepMap | Descartes | 1.18 | 16.72 |
| MSMO1 | -0.0005499 | 11307 | GTEx | DepMap | Descartes | 0.88 | 25.56 |
| GSTA4 | -0.0005544 | 11329 | GTEx | DepMap | Descartes | 0.57 | 19.82 |
Descartes chromaffin markers
Top 50 marker genes of chromaffin cells in the Decartes fetal adrenal single cell map (https://atlas.brotmanbaty.org/bbi/human-gene-expression-during-development/cell/chromaffin/in/adrenal)
Wilcoxon ranksum test P-value for gene set overrepresentation: 1.00e+00
Mean rank of genes in gene set: 9604.54
Median rank of genes in gene set: 10904
Rank on gene expression program of top 30 genes in gene set:
| Genes | Weight | Rank | GTEx | DepMap | Descartes | Mean.Counts | Mean.TPM |
|---|---|---|---|---|---|---|---|
| MAP1B | 0.0045503 | 151 | GTEx | DepMap | Descartes | 39.64 | 205.56 |
| GREM1 | 0.0014794 | 770 | GTEx | DepMap | Descartes | 1.03 | 4.25 |
| RGMB | 0.0004359 | 2413 | GTEx | DepMap | Descartes | 0.68 | 8.32 |
| FAT3 | 0.0003514 | 2727 | GTEx | DepMap | Descartes | 0.10 | 0.31 |
| SLC44A5 | -0.0000099 | 5370 | GTEx | DepMap | Descartes | 0.22 | 2.98 |
| ANKFN1 | -0.0000255 | 5616 | GTEx | DepMap | Descartes | 0.00 | 0.05 |
| TUBB2A | -0.0000388 | 5877 | GTEx | DepMap | Descartes | 1.70 | 58.03 |
| TMEM132C | -0.0000717 | 6501 | GTEx | DepMap | Descartes | 0.00 | 0.00 |
| CCND1 | -0.0000750 | 6576 | GTEx | DepMap | Descartes | 10.14 | 133.73 |
| IL7 | -0.0000916 | 6900 | GTEx | DepMap | Descartes | 0.27 | 7.06 |
| EPHA6 | -0.0001800 | 8347 | GTEx | DepMap | Descartes | 0.00 | 0.02 |
| PTCHD1 | -0.0002525 | 9229 | GTEx | DepMap | Descartes | 0.00 | 0.01 |
| TMEFF2 | -0.0002570 | 9267 | GTEx | DepMap | Descartes | 0.07 | 1.39 |
| REEP1 | -0.0002814 | 9524 | GTEx | DepMap | Descartes | 0.01 | 0.08 |
| RBFOX1 | -0.0003792 | 10322 | GTEx | DepMap | Descartes | 0.00 | 0.00 |
| GAP43 | -0.0003901 | 10415 | GTEx | DepMap | Descartes | 0.83 | 23.90 |
| HS3ST5 | -0.0003995 | 10489 | GTEx | DepMap | Descartes | 0.05 | 0.58 |
| KCNB2 | -0.0004116 | 10558 | GTEx | DepMap | Descartes | 0.01 | 0.17 |
| PLXNA4 | -0.0004272 | 10658 | GTEx | DepMap | Descartes | 0.35 | 1.72 |
| ALK | -0.0004450 | 10776 | GTEx | DepMap | Descartes | 0.06 | 0.62 |
| EYA4 | -0.0004674 | 10904 | GTEx | DepMap | Descartes | 0.01 | 0.15 |
| RYR2 | -0.0004775 | 10958 | GTEx | DepMap | Descartes | 0.01 | 0.01 |
| EYA1 | -0.0005718 | 11415 | GTEx | DepMap | Descartes | 0.09 | 1.46 |
| TUBB2B | -0.0005909 | 11481 | GTEx | DepMap | Descartes | 3.48 | 105.27 |
| CNKSR2 | -0.0006307 | 11612 | GTEx | DepMap | Descartes | 0.02 | 0.12 |
| RPH3A | -0.0006398 | 11639 | GTEx | DepMap | Descartes | 0.14 | 1.04 |
| NTRK1 | -0.0006487 | 11674 | GTEx | DepMap | Descartes | 0.07 | 1.00 |
| ISL1 | -0.0006776 | 11762 | GTEx | DepMap | Descartes | 2.03 | 51.20 |
| MAB21L1 | -0.0007329 | 11899 | GTEx | DepMap | Descartes | 2.37 | 49.03 |
| MARCH11 | -0.0008564 | 12074 | GTEx | DepMap | Descartes | 0.38 | NA |
Descartes Vascular_endothelial markers
Top 50 marker genes of Vascular_endothelial cells in the Decartes fetal adrenal single cell map (https://atlas.brotmanbaty.org/bbi/human-gene-expression-during-development/cell/vascular_endothelial/in/adrenal)
Wilcoxon ranksum test P-value for gene set overrepresentation: 1.47e-01
Mean rank of genes in gene set: 5659.97
Median rank of genes in gene set: 6098
Rank on gene expression program of top 30 genes in gene set:
| Genes | Weight | Rank | GTEx | DepMap | Descartes | Mean.Counts | Mean.TPM |
|---|---|---|---|---|---|---|---|
| ESM1 | 0.0101441 | 38 | GTEx | DepMap | Descartes | 0.20 | 6.81 |
| CDH13 | 0.0062451 | 82 | GTEx | DepMap | Descartes | 0.50 | 4.41 |
| PODXL | 0.0032614 | 257 | GTEx | DepMap | Descartes | 1.08 | 11.44 |
| SLCO2A1 | 0.0021767 | 474 | GTEx | DepMap | Descartes | 0.07 | 0.88 |
| HYAL2 | 0.0021092 | 491 | GTEx | DepMap | Descartes | 2.53 | 37.38 |
| ARHGAP29 | 0.0013800 | 836 | GTEx | DepMap | Descartes | 3.34 | 22.69 |
| EHD3 | 0.0012604 | 943 | GTEx | DepMap | Descartes | 0.78 | 9.36 |
| GALNT15 | 0.0006357 | 1831 | GTEx | DepMap | Descartes | 0.02 | NA |
| IRX3 | 0.0005861 | 1955 | GTEx | DepMap | Descartes | 0.23 | 5.36 |
| F8 | 0.0005454 | 2062 | GTEx | DepMap | Descartes | 0.08 | 0.53 |
| CALCRL | 0.0000443 | 4749 | GTEx | DepMap | Descartes | 0.02 | 0.21 |
| BTNL9 | 0.0000059 | 5148 | GTEx | DepMap | Descartes | 0.01 | 0.22 |
| KDR | -0.0000156 | 5463 | GTEx | DepMap | Descartes | 0.00 | 0.00 |
| PLVAP | -0.0000179 | 5490 | GTEx | DepMap | Descartes | 0.00 | 0.00 |
| KANK3 | -0.0000181 | 5498 | GTEx | DepMap | Descartes | 0.01 | 0.17 |
| SHE | -0.0000184 | 5502 | GTEx | DepMap | Descartes | 0.00 | 0.00 |
| ID1 | -0.0000414 | 5919 | GTEx | DepMap | Descartes | 6.99 | 338.18 |
| MMRN2 | -0.0000457 | 5989 | GTEx | DepMap | Descartes | 0.00 | 0.07 |
| CRHBP | -0.0000505 | 6079 | GTEx | DepMap | Descartes | 0.00 | 0.00 |
| PTPRB | -0.0000518 | 6117 | GTEx | DepMap | Descartes | 0.14 | 0.71 |
| ROBO4 | -0.0000573 | 6212 | GTEx | DepMap | Descartes | 0.01 | 0.06 |
| NR5A2 | -0.0000611 | 6291 | GTEx | DepMap | Descartes | 0.00 | 0.00 |
| TIE1 | -0.0000638 | 6344 | GTEx | DepMap | Descartes | 0.00 | 0.00 |
| CYP26B1 | -0.0000645 | 6355 | GTEx | DepMap | Descartes | 0.00 | 0.00 |
| RASIP1 | -0.0000663 | 6399 | GTEx | DepMap | Descartes | 0.01 | 0.23 |
| TEK | -0.0000695 | 6468 | GTEx | DepMap | Descartes | 0.00 | 0.00 |
| FLT4 | -0.0000827 | 6734 | GTEx | DepMap | Descartes | 0.00 | 0.00 |
| CEACAM1 | -0.0000912 | 6892 | GTEx | DepMap | Descartes | 0.01 | 0.19 |
| MYRIP | -0.0001917 | 8490 | GTEx | DepMap | Descartes | 0.29 | 3.45 |
| TMEM88 | -0.0002010 | 8613 | GTEx | DepMap | Descartes | 0.01 | 0.72 |
Descartes stromal markers
Top 50 marker genes of stromal cells in the Decartes fetal adrenal single cell map (https://atlas.brotmanbaty.org/bbi/human-gene-expression-during-development/cell/stromal/in/adrenal)
Wilcoxon ranksum test P-value for gene set overrepresentation: 3.10e-01
Mean rank of genes in gene set: 6004.64
Median rank of genes in gene set: 5872.5
Rank on gene expression program of top 30 genes in gene set:
| Genes | Weight | Rank | GTEx | DepMap | Descartes | Mean.Counts | Mean.TPM |
|---|---|---|---|---|---|---|---|
| POSTN | 0.0255729 | 2 | GTEx | DepMap | Descartes | 4.56 | 87.10 |
| PRRX1 | 0.0246906 | 3 | GTEx | DepMap | Descartes | 16.14 | 263.40 |
| COL1A1 | 0.0076822 | 58 | GTEx | DepMap | Descartes | 23.82 | 239.91 |
| COL3A1 | 0.0060486 | 87 | GTEx | DepMap | Descartes | 15.62 | 181.99 |
| CDH11 | 0.0052759 | 116 | GTEx | DepMap | Descartes | 2.16 | 19.69 |
| CCDC80 | 0.0048211 | 141 | GTEx | DepMap | Descartes | 5.93 | 27.58 |
| DKK2 | 0.0038333 | 197 | GTEx | DepMap | Descartes | 2.32 | 40.55 |
| ACTA2 | 0.0034071 | 235 | GTEx | DepMap | Descartes | 1.48 | 63.18 |
| PCDH18 | 0.0033241 | 250 | GTEx | DepMap | Descartes | 0.95 | 10.80 |
| PCOLCE | 0.0014239 | 809 | GTEx | DepMap | Descartes | 12.47 | 519.50 |
| ISLR | 0.0009045 | 1319 | GTEx | DepMap | Descartes | 0.12 | 3.26 |
| COL27A1 | 0.0008515 | 1403 | GTEx | DepMap | Descartes | 0.14 | 1.19 |
| PAMR1 | 0.0008428 | 1412 | GTEx | DepMap | Descartes | 0.01 | 0.26 |
| LRRC17 | 0.0005940 | 1937 | GTEx | DepMap | Descartes | 6.25 | 168.35 |
| LOX | 0.0004714 | 2295 | GTEx | DepMap | Descartes | 0.63 | 5.27 |
| ABCA6 | 0.0001578 | 3789 | GTEx | DepMap | Descartes | 0.01 | 0.04 |
| EDNRA | 0.0001064 | 4167 | GTEx | DepMap | Descartes | 0.22 | 2.99 |
| SFRP2 | 0.0000331 | 4853 | GTEx | DepMap | Descartes | 0.00 | 0.00 |
| OGN | 0.0000231 | 4949 | GTEx | DepMap | Descartes | 0.01 | 0.56 |
| CLDN11 | 0.0000119 | 5080 | GTEx | DepMap | Descartes | 0.04 | 0.73 |
| ADAMTSL3 | 0.0000004 | 5221 | GTEx | DepMap | Descartes | 0.01 | 0.04 |
| SCARA5 | -0.0000360 | 5806 | GTEx | DepMap | Descartes | 0.00 | 0.00 |
| LUM | -0.0000430 | 5939 | GTEx | DepMap | Descartes | 1.14 | 27.70 |
| BICC1 | -0.0000436 | 5956 | GTEx | DepMap | Descartes | 0.41 | 3.85 |
| LAMC3 | -0.0001049 | 7149 | GTEx | DepMap | Descartes | 0.00 | 0.02 |
| PDGFRA | -0.0001437 | 7827 | GTEx | DepMap | Descartes | 0.80 | 7.88 |
| ELN | -0.0001928 | 8504 | GTEx | DepMap | Descartes | 0.11 | 1.32 |
| ABCC9 | -0.0002209 | 8884 | GTEx | DepMap | Descartes | 0.00 | 0.03 |
| IGFBP3 | -0.0002365 | 9045 | GTEx | DepMap | Descartes | 4.13 | 59.63 |
| GLI2 | -0.0002745 | 9453 | GTEx | DepMap | Descartes | 0.12 | 0.88 |
Descartes sympathoblasts markers
Top 50 marker genes of sympathoblasts cells in the Decartes fetal adrenal single cell map (https://atlas.brotmanbaty.org/bbi/human-gene-expression-during-development/cell/sympathoblasts/in/adrenal)
Wilcoxon ranksum test P-value for gene set overrepresentation: 1.00e+00
Mean rank of genes in gene set: 8638.39
Median rank of genes in gene set: 9400
Rank on gene expression program of top 30 genes in gene set:
| Genes | Weight | Rank | GTEx | DepMap | Descartes | Mean.Counts | Mean.TPM |
|---|---|---|---|---|---|---|---|
| CDH18 | 0.0007552 | 1594 | GTEx | DepMap | Descartes | 0.12 | 1.95 |
| LAMA3 | 0.0003937 | 2555 | GTEx | DepMap | Descartes | 0.04 | 0.22 |
| KSR2 | 0.0002776 | 3051 | GTEx | DepMap | Descartes | 0.02 | 0.05 |
| ROBO1 | 0.0001684 | 3715 | GTEx | DepMap | Descartes | 0.84 | 7.12 |
| CNTN3 | 0.0001628 | 3756 | GTEx | DepMap | Descartes | 0.03 | 0.33 |
| PENK | -0.0000104 | 5379 | GTEx | DepMap | Descartes | 0.00 | 0.00 |
| UNC80 | -0.0000162 | 5469 | GTEx | DepMap | Descartes | 0.17 | 0.78 |
| SLC35F3 | -0.0000276 | 5651 | GTEx | DepMap | Descartes | 0.05 | 0.84 |
| SORCS3 | -0.0000854 | 6786 | GTEx | DepMap | Descartes | 0.00 | 0.00 |
| CDH12 | -0.0000878 | 6832 | GTEx | DepMap | Descartes | 0.00 | 0.00 |
| SLC24A2 | -0.0000884 | 6846 | GTEx | DepMap | Descartes | 0.00 | 0.00 |
| PACRG | -0.0001244 | 7520 | GTEx | DepMap | Descartes | 0.01 | 0.57 |
| TENM1 | -0.0001378 | 7736 | GTEx | DepMap | Descartes | 0.00 | NA |
| TBX20 | -0.0001505 | 7944 | GTEx | DepMap | Descartes | 0.02 | 0.58 |
| DGKK | -0.0001719 | 8239 | GTEx | DepMap | Descartes | 0.00 | 0.00 |
| AGBL4 | -0.0001727 | 8246 | GTEx | DepMap | Descartes | 0.02 | 0.22 |
| PCSK2 | -0.0001818 | 8371 | GTEx | DepMap | Descartes | 0.00 | 0.00 |
| ST18 | -0.0001900 | 8470 | GTEx | DepMap | Descartes | 0.00 | 0.00 |
| MGAT4C | -0.0002478 | 9176 | GTEx | DepMap | Descartes | 0.00 | 0.01 |
| GALNTL6 | -0.0002929 | 9624 | GTEx | DepMap | Descartes | 0.00 | 0.02 |
| SPOCK3 | -0.0002996 | 9684 | GTEx | DepMap | Descartes | 0.00 | 0.02 |
| GRID2 | -0.0003342 | 9976 | GTEx | DepMap | Descartes | 0.03 | 0.25 |
| ARC | -0.0003692 | 10256 | GTEx | DepMap | Descartes | 0.01 | 0.11 |
| CCSER1 | -0.0003861 | 10376 | GTEx | DepMap | Descartes | 0.05 | NA |
| FAM155A | -0.0003890 | 10402 | GTEx | DepMap | Descartes | 0.55 | 3.30 |
| GRM7 | -0.0004075 | 10533 | GTEx | DepMap | Descartes | 0.06 | 0.76 |
| GCH1 | -0.0004111 | 10554 | GTEx | DepMap | Descartes | 0.09 | 1.83 |
| NTNG1 | -0.0004282 | 10668 | GTEx | DepMap | Descartes | 0.06 | 0.67 |
| SLC18A1 | -0.0004457 | 10778 | GTEx | DepMap | Descartes | 0.01 | 0.33 |
| KCTD16 | -0.0004557 | 10838 | GTEx | DepMap | Descartes | 0.19 | 0.75 |
Descartes erythroblasts markers
Top 50 marker genes of erythroblasts cells in the Decartes fetal adrenal single cell map (https://atlas.brotmanbaty.org/bbi/human-gene-expression-during-development/cell/erythroblasts/in/adrenal)
Wilcoxon ranksum test P-value for gene set overrepresentation: 5.77e-01
Mean rank of genes in gene set: 6405.07
Median rank of genes in gene set: 5801
Rank on gene expression program of top 30 genes in gene set:
| Genes | Weight | Rank | GTEx | DepMap | Descartes | Mean.Counts | Mean.TPM |
|---|---|---|---|---|---|---|---|
| BLVRB | 0.0015711 | 713 | GTEx | DepMap | Descartes | 1.86 | 77.24 |
| MICAL2 | 0.0011644 | 1024 | GTEx | DepMap | Descartes | 1.05 | 9.02 |
| CPOX | 0.0007999 | 1496 | GTEx | DepMap | Descartes | 0.45 | 9.96 |
| TSPAN5 | 0.0007581 | 1590 | GTEx | DepMap | Descartes | 2.02 | 28.42 |
| FECH | 0.0005611 | 2018 | GTEx | DepMap | Descartes | 0.38 | 2.88 |
| ANK1 | 0.0002674 | 3107 | GTEx | DepMap | Descartes | 0.13 | 0.84 |
| SPECC1 | 0.0002445 | 3221 | GTEx | DepMap | Descartes | 0.91 | 5.56 |
| TRAK2 | 0.0001912 | 3541 | GTEx | DepMap | Descartes | 0.92 | 8.56 |
| SNCA | 0.0001797 | 3636 | GTEx | DepMap | Descartes | 0.64 | 12.11 |
| SLC4A1 | 0.0001035 | 4190 | GTEx | DepMap | Descartes | 0.00 | 0.04 |
| ABCB10 | 0.0000231 | 4948 | GTEx | DepMap | Descartes | 0.23 | 4.19 |
| RGS6 | -0.0000133 | 5425 | GTEx | DepMap | Descartes | 0.00 | 0.00 |
| TMCC2 | -0.0000140 | 5438 | GTEx | DepMap | Descartes | 0.05 | 0.70 |
| GYPC | -0.0000144 | 5446 | GTEx | DepMap | Descartes | 0.00 | 0.00 |
| ALAS2 | -0.0000357 | 5801 | GTEx | DepMap | Descartes | 0.00 | 0.00 |
| SPTB | -0.0001194 | 7424 | GTEx | DepMap | Descartes | 0.03 | 0.15 |
| SLC25A21 | -0.0001376 | 7731 | GTEx | DepMap | Descartes | 0.00 | 0.00 |
| RAPGEF2 | -0.0001384 | 7743 | GTEx | DepMap | Descartes | 0.61 | 4.23 |
| DENND4A | -0.0001631 | 8115 | GTEx | DepMap | Descartes | 0.33 | 2.43 |
| MARCH3 | -0.0001751 | 8278 | GTEx | DepMap | Descartes | 0.53 | NA |
| SELENBP1 | -0.0002376 | 9058 | GTEx | DepMap | Descartes | 0.02 | 0.24 |
| CAT | -0.0002499 | 9196 | GTEx | DepMap | Descartes | 0.48 | 13.13 |
| XPO7 | -0.0002853 | 9561 | GTEx | DepMap | Descartes | 0.61 | 7.52 |
| TFR2 | -0.0003535 | 10125 | GTEx | DepMap | Descartes | 0.01 | 0.17 |
| GCLC | -0.0003805 | 10328 | GTEx | DepMap | Descartes | 0.28 | 4.35 |
| SOX6 | -0.0004426 | 10766 | GTEx | DepMap | Descartes | 0.05 | 0.27 |
| RHD | -0.0006467 | 11665 | GTEx | DepMap | Descartes | 0.00 | 0.05 |
| SLC25A37 | -0.0007042 | 11846 | GTEx | DepMap | Descartes | 0.95 | 12.86 |
| EPB41 | -0.0010952 | 12317 | GTEx | DepMap | Descartes | 0.71 | 6.75 |
| NA | NA | NA | NA | NA | NA | NA | NA |
Descartes myeloid markers
Top 50 marker genes of myeloid cells in the Decartes fetal adrenal single cell map (https://atlas.brotmanbaty.org/bbi/human-gene-expression-during-development/cell/myeloid/in/adrenal)
Wilcoxon ranksum test P-value for gene set overrepresentation: 4.47e-02
Mean rank of genes in gene set: 5278.11
Median rank of genes in gene set: 5283
Rank on gene expression program of top 30 genes in gene set:
| Genes | Weight | Rank | GTEx | DepMap | Descartes | Mean.Counts | Mean.TPM |
|---|---|---|---|---|---|---|---|
| TGFBI | 0.0229178 | 5 | GTEx | DepMap | Descartes | 18.15 | 252.04 |
| FMN1 | 0.0048363 | 140 | GTEx | DepMap | Descartes | 3.01 | 14.20 |
| CTSB | 0.0030191 | 290 | GTEx | DepMap | Descartes | 4.12 | 67.65 |
| CTSD | 0.0022587 | 446 | GTEx | DepMap | Descartes | 4.10 | 115.19 |
| CTSS | 0.0019574 | 542 | GTEx | DepMap | Descartes | 0.14 | 2.60 |
| ABCA1 | 0.0019045 | 565 | GTEx | DepMap | Descartes | 0.43 | 2.56 |
| PTPRE | 0.0014422 | 794 | GTEx | DepMap | Descartes | 1.57 | 16.46 |
| HRH1 | 0.0012099 | 983 | GTEx | DepMap | Descartes | 0.45 | 5.59 |
| AXL | 0.0011946 | 991 | GTEx | DepMap | Descartes | 1.67 | 21.50 |
| CST3 | 0.0010745 | 1124 | GTEx | DepMap | Descartes | 12.35 | 198.78 |
| ADAP2 | 0.0008988 | 1332 | GTEx | DepMap | Descartes | 0.02 | 0.39 |
| CSF1R | 0.0007053 | 1681 | GTEx | DepMap | Descartes | 0.01 | 0.13 |
| RGL1 | 0.0002871 | 3010 | GTEx | DepMap | Descartes | 0.49 | 6.19 |
| LGMN | 0.0002554 | 3164 | GTEx | DepMap | Descartes | 0.56 | 16.76 |
| ITPR2 | 0.0001686 | 3711 | GTEx | DepMap | Descartes | 1.32 | 6.21 |
| SPP1 | 0.0001448 | 3889 | GTEx | DepMap | Descartes | 0.08 | 2.59 |
| WWP1 | 0.0001138 | 4118 | GTEx | DepMap | Descartes | 0.38 | 4.49 |
| FGD2 | 0.0000624 | 4583 | GTEx | DepMap | Descartes | 0.00 | 0.00 |
| HCK | 0.0000209 | 4975 | GTEx | DepMap | Descartes | 0.00 | 0.00 |
| ATP8B4 | -0.0000238 | 5591 | GTEx | DepMap | Descartes | 0.00 | 0.00 |
| SLCO2B1 | -0.0000502 | 6074 | GTEx | DepMap | Descartes | 0.00 | 0.00 |
| CD74 | -0.0000528 | 6133 | GTEx | DepMap | Descartes | 0.00 | 0.09 |
| CYBB | -0.0000639 | 6345 | GTEx | DepMap | Descartes | 0.00 | 0.00 |
| CD163 | -0.0000710 | 6491 | GTEx | DepMap | Descartes | 0.00 | 0.00 |
| SLC9A9 | -0.0000796 | 6666 | GTEx | DepMap | Descartes | 0.00 | 0.00 |
| MS4A4A | -0.0000949 | 6961 | GTEx | DepMap | Descartes | 0.00 | 0.00 |
| MSR1 | -0.0000997 | 7048 | GTEx | DepMap | Descartes | 0.00 | 0.00 |
| FGL2 | -0.0001312 | 7638 | GTEx | DepMap | Descartes | 0.00 | 0.00 |
| CD14 | -0.0001449 | 7854 | GTEx | DepMap | Descartes | 0.00 | 0.00 |
| CTSC | -0.0002781 | 9485 | GTEx | DepMap | Descartes | 2.84 | 27.36 |
Descartes Schwann markers
Top 50 marker genes of Schwann cells in the Decartes fetal adrenal single cell map (https://atlas.brotmanbaty.org/bbi/human-gene-expression-during-development/cell/schwann/in/adrenal)
Wilcoxon ranksum test P-value for gene set overrepresentation: 5.93e-01
Mean rank of genes in gene set: 6402.84
Median rank of genes in gene set: 8096.5
Rank on gene expression program of top 30 genes in gene set:
| Genes | Weight | Rank | GTEx | DepMap | Descartes | Mean.Counts | Mean.TPM |
|---|---|---|---|---|---|---|---|
| COL18A1 | 0.0089630 | 49 | GTEx | DepMap | Descartes | 3.58 | 34.65 |
| VIM | 0.0063946 | 80 | GTEx | DepMap | Descartes | 155.82 | 3283.30 |
| VCAN | 0.0044913 | 154 | GTEx | DepMap | Descartes | 7.30 | 38.27 |
| DST | 0.0044610 | 156 | GTEx | DepMap | Descartes | 14.33 | 40.47 |
| HMGA2 | 0.0030709 | 281 | GTEx | DepMap | Descartes | 3.10 | 23.60 |
| LAMC1 | 0.0028595 | 311 | GTEx | DepMap | Descartes | 3.00 | 23.14 |
| LAMB1 | 0.0022076 | 466 | GTEx | DepMap | Descartes | 4.59 | 51.38 |
| MARCKS | 0.0018935 | 571 | GTEx | DepMap | Descartes | 24.32 | 357.72 |
| IL1RAPL1 | 0.0015415 | 729 | GTEx | DepMap | Descartes | 0.29 | 4.76 |
| ADAMTS5 | 0.0015297 | 743 | GTEx | DepMap | Descartes | 0.90 | 5.70 |
| PPP2R2B | 0.0010866 | 1107 | GTEx | DepMap | Descartes | 1.96 | 10.79 |
| COL5A2 | 0.0008885 | 1351 | GTEx | DepMap | Descartes | 0.51 | 4.09 |
| OLFML2A | 0.0008467 | 1407 | GTEx | DepMap | Descartes | 0.12 | 1.01 |
| NRXN3 | 0.0003289 | 2816 | GTEx | DepMap | Descartes | 0.03 | 0.16 |
| PMP22 | 0.0001973 | 3498 | GTEx | DepMap | Descartes | 1.26 | 42.62 |
| ERBB3 | 0.0000771 | 4425 | GTEx | DepMap | Descartes | 0.03 | 0.27 |
| XKR4 | 0.0000041 | 5172 | GTEx | DepMap | Descartes | 0.00 | 0.01 |
| IL1RAPL2 | -0.0000403 | 5903 | GTEx | DepMap | Descartes | 0.00 | 0.00 |
| MPZ | -0.0000541 | 6149 | GTEx | DepMap | Descartes | 0.01 | 0.31 |
| PLP1 | -0.0000614 | 6303 | GTEx | DepMap | Descartes | 0.01 | 0.24 |
| GFRA3 | -0.0001445 | 7845 | GTEx | DepMap | Descartes | 0.01 | 0.09 |
| GAS7 | -0.0001581 | 8044 | GTEx | DepMap | Descartes | 0.01 | 0.09 |
| COL25A1 | -0.0001656 | 8149 | GTEx | DepMap | Descartes | 0.00 | 0.00 |
| SCN7A | -0.0001697 | 8208 | GTEx | DepMap | Descartes | 0.01 | 0.10 |
| MDGA2 | -0.0001779 | 8322 | GTEx | DepMap | Descartes | 0.00 | 0.00 |
| STARD13 | -0.0001826 | 8383 | GTEx | DepMap | Descartes | 0.15 | 1.35 |
| EDNRB | -0.0002069 | 8695 | GTEx | DepMap | Descartes | 0.00 | 0.00 |
| LRRTM4 | -0.0002079 | 8708 | GTEx | DepMap | Descartes | 0.01 | 0.04 |
| EGFLAM | -0.0002731 | 9442 | GTEx | DepMap | Descartes | 0.00 | 0.02 |
| ERBB4 | -0.0002797 | 9501 | GTEx | DepMap | Descartes | 0.05 | 0.25 |
Descartes Megakaryocytes markers
Top 50 marker genes of Megakaryocytes cells in the Decartes fetal adrenal single cell map (https://atlas.brotmanbaty.org/bbi/human-gene-expression-during-development/cell/megakaryocytes/in/adrenal)
Wilcoxon ranksum test P-value for gene set overrepresentation: 1.29e-04
Mean rank of genes in gene set: 4305.31
Median rank of genes in gene set: 3176
Rank on gene expression program of top 30 genes in gene set:
| Genes | Weight | Rank | GTEx | DepMap | Descartes | Mean.Counts | Mean.TPM |
|---|---|---|---|---|---|---|---|
| TMSB4X | 0.0137728 | 20 | GTEx | DepMap | Descartes | 210.92 | 7639.78 |
| MYLK | 0.0124641 | 24 | GTEx | DepMap | Descartes | 6.38 | 39.95 |
| ZYX | 0.0096659 | 41 | GTEx | DepMap | Descartes | 11.07 | 308.18 |
| LTBP1 | 0.0061756 | 84 | GTEx | DepMap | Descartes | 5.20 | 50.91 |
| MYH9 | 0.0056643 | 104 | GTEx | DepMap | Descartes | 7.54 | 61.01 |
| VCL | 0.0051734 | 122 | GTEx | DepMap | Descartes | 6.27 | 50.23 |
| ACTB | 0.0049408 | 134 | GTEx | DepMap | Descartes | 94.25 | 2564.68 |
| FLNA | 0.0047212 | 144 | GTEx | DepMap | Descartes | 9.54 | 68.33 |
| TLN1 | 0.0037049 | 210 | GTEx | DepMap | Descartes | 8.33 | 57.51 |
| GSN | 0.0033580 | 245 | GTEx | DepMap | Descartes | 1.83 | 15.10 |
| TGFB1 | 0.0033253 | 249 | GTEx | DepMap | Descartes | 2.67 | 56.80 |
| ACTN1 | 0.0029011 | 304 | GTEx | DepMap | Descartes | 5.65 | 69.96 |
| LIMS1 | 0.0024889 | 384 | GTEx | DepMap | Descartes | 4.74 | 61.90 |
| PRKAR2B | 0.0017812 | 611 | GTEx | DepMap | Descartes | 2.65 | 44.67 |
| RAB27B | 0.0010634 | 1132 | GTEx | DepMap | Descartes | 0.59 | 4.48 |
| SLC2A3 | 0.0009579 | 1251 | GTEx | DepMap | Descartes | 0.34 | 4.52 |
| TPM4 | 0.0009286 | 1290 | GTEx | DepMap | Descartes | 11.48 | 134.63 |
| PSTPIP2 | 0.0009034 | 1322 | GTEx | DepMap | Descartes | 0.28 | 5.24 |
| HIPK2 | 0.0008372 | 1418 | GTEx | DepMap | Descartes | 2.26 | 8.70 |
| UBASH3B | 0.0005541 | 2038 | GTEx | DepMap | Descartes | 0.20 | 1.70 |
| FLI1 | 0.0004915 | 2240 | GTEx | DepMap | Descartes | 0.03 | 0.28 |
| MCTP1 | 0.0003161 | 2872 | GTEx | DepMap | Descartes | 0.20 | 2.41 |
| PDE3A | 0.0002532 | 3176 | GTEx | DepMap | Descartes | 0.15 | 1.33 |
| ITGB3 | 0.0001634 | 3749 | GTEx | DepMap | Descartes | 0.02 | 0.15 |
| P2RX1 | 0.0000023 | 5191 | GTEx | DepMap | Descartes | 0.00 | 0.00 |
| STOM | 0.0000016 | 5205 | GTEx | DepMap | Descartes | 0.63 | 11.97 |
| MMRN1 | -0.0000140 | 5437 | GTEx | DepMap | Descartes | 0.00 | 0.00 |
| CD84 | -0.0000450 | 5977 | GTEx | DepMap | Descartes | 0.00 | 0.00 |
| DOK6 | -0.0000576 | 6220 | GTEx | DepMap | Descartes | 0.39 | 2.46 |
| TUBB1 | -0.0000615 | 6308 | GTEx | DepMap | Descartes | 0.00 | 0.05 |
Descartes Lyphoid markers
Top 50 marker genes of Lyphoid cells in the Decartes fetal adrenal single cell map (https://atlas.brotmanbaty.org/bbi/human-gene-expression-during-development/cell/lymphoid/in/adrenal)
Wilcoxon ranksum test P-value for gene set overrepresentation: 1.70e-01
Mean rank of genes in gene set: 5741.52
Median rank of genes in gene set: 6241
Rank on gene expression program of top 30 genes in gene set:
| Genes | Weight | Rank | GTEx | DepMap | Descartes | Mean.Counts | Mean.TPM |
|---|---|---|---|---|---|---|---|
| ARHGDIB | 0.0078971 | 54 | GTEx | DepMap | Descartes | 3.34 | 177.52 |
| CD44 | 0.0057951 | 95 | GTEx | DepMap | Descartes | 4.24 | 48.25 |
| SP100 | 0.0044072 | 158 | GTEx | DepMap | Descartes | 1.74 | 19.19 |
| TMSB10 | 0.0029665 | 293 | GTEx | DepMap | Descartes | 154.48 | 19979.03 |
| MSN | 0.0023978 | 410 | GTEx | DepMap | Descartes | 3.75 | 58.32 |
| ARID5B | 0.0021172 | 489 | GTEx | DepMap | Descartes | 2.73 | 20.89 |
| SAMD3 | 0.0020182 | 520 | GTEx | DepMap | Descartes | 0.10 | 1.70 |
| MBNL1 | 0.0017905 | 605 | GTEx | DepMap | Descartes | 2.76 | 26.04 |
| PLEKHA2 | 0.0015333 | 740 | GTEx | DepMap | Descartes | 0.77 | 8.70 |
| ETS1 | 0.0011677 | 1020 | GTEx | DepMap | Descartes | 0.78 | 9.26 |
| B2M | 0.0009956 | 1199 | GTEx | DepMap | Descartes | 19.63 | 477.14 |
| WIPF1 | 0.0009206 | 1301 | GTEx | DepMap | Descartes | 1.25 | 16.60 |
| DOCK10 | 0.0006675 | 1758 | GTEx | DepMap | Descartes | 0.49 | 4.56 |
| PITPNC1 | 0.0006362 | 1827 | GTEx | DepMap | Descartes | 0.71 | 6.86 |
| SORL1 | 0.0006335 | 1834 | GTEx | DepMap | Descartes | 0.39 | 2.34 |
| TOX | 0.0000291 | 4889 | GTEx | DepMap | Descartes | 0.50 | 8.36 |
| GNG2 | 0.0000149 | 5049 | GTEx | DepMap | Descartes | 0.73 | 12.60 |
| CCL5 | 0.0000147 | 5051 | GTEx | DepMap | Descartes | 0.01 | 0.25 |
| FOXP1 | -0.0000418 | 5926 | GTEx | DepMap | Descartes | 1.72 | 10.45 |
| ARHGAP15 | -0.0000572 | 6211 | GTEx | DepMap | Descartes | 0.00 | 0.00 |
| SKAP1 | -0.0000576 | 6218 | GTEx | DepMap | Descartes | 0.00 | 0.00 |
| RCSD1 | -0.0000594 | 6264 | GTEx | DepMap | Descartes | 0.00 | 0.05 |
| STK39 | -0.0000812 | 6701 | GTEx | DepMap | Descartes | 0.65 | 11.36 |
| IKZF1 | -0.0001038 | 7123 | GTEx | DepMap | Descartes | 0.00 | 0.00 |
| SCML4 | -0.0001150 | 7354 | GTEx | DepMap | Descartes | 0.00 | 0.00 |
| CCND3 | -0.0001429 | 7814 | GTEx | DepMap | Descartes | 0.52 | 12.44 |
| LCP1 | -0.0001638 | 8124 | GTEx | DepMap | Descartes | 0.00 | 0.00 |
| MCTP2 | -0.0001733 | 8253 | GTEx | DepMap | Descartes | 0.01 | 0.09 |
| PRKCH | -0.0001793 | 8337 | GTEx | DepMap | Descartes | 0.03 | 0.55 |
| ITPKB | -0.0001821 | 8373 | GTEx | DepMap | Descartes | 0.10 | 1.14 |
Below shows the ranks on this GEP for immune marker gene lists curated by CellTypist (https://www.celltypist.org/encyclopedia).
High ranks indicate this gene is a driver of this GEP.
These curated gene list are ranked by P-value (on this GEP) of their constituent genes.
The Mean Count column shows the mean read count in cells scoring highly (H > 50) on this gene expression program.
Mono-mac: Mono-mac (model markers)
mononuclear phagocytes including monocytes and macrophages that are involved in the regulation of innate and adaptive immunity:
Wilcoxon ranksum test P-value for gene set overrepresentation: 2.39e-02
Mean rank of genes in gene set: 2689.5
Rank on gene expression program of genes in gene set:
| Genes | Weight | Rank | GTEx | DepMap | Decartes | Mean.Counts | Mean.TPM |
|---|---|---|---|---|---|---|---|
| FTH1 | 0.0035488 | 222 | GTEx | DepMap | Descartes | 115.71 | 5442.32 |
| SAT1 | 0.0006485 | 1796 | GTEx | DepMap | Descartes | 1.32 | 65.76 |
| S100A2 | 0.0003958 | 2548 | GTEx | DepMap | Descartes | 1.09 | 69.01 |
| KLRB1 | -0.0000562 | 6192 | GTEx | DepMap | Descartes | 0.00 | 0.00 |
Monocytes: Non-classical monocytes (model markers)
CD16+ myeloid mononuclear recirculating leukocytes that are capable of differentiating into macrophages and myeloid lineage dendritic cells:
Wilcoxon ranksum test P-value for gene set overrepresentation: 3.17e-02
Mean rank of genes in gene set: 2912
Rank on gene expression program of genes in gene set:
| Genes | Weight | Rank | GTEx | DepMap | Decartes | Mean.Counts | Mean.TPM |
|---|---|---|---|---|---|---|---|
| RHOC | 0.0045348 | 152 | GTEx | DepMap | Descartes | 6.95 | 180.42 |
| ABI3 | 0.0022280 | 459 | GTEx | DepMap | Descartes | 0.04 | 1.39 |
| BAG3 | 0.0015338 | 739 | GTEx | DepMap | Descartes | 0.88 | 20.97 |
| CUX2 | -0.0003753 | 10298 | GTEx | DepMap | Descartes | 0.02 | 0.12 |
T cells: Tcm/Naive helper T cells (model markers)
CD4+ helper T lymphocytes mainly localized in secondary lymphoid tissues and sustaining the responses by proliferating and producing new effectors:
Wilcoxon ranksum test P-value for gene set overrepresentation: 3.26e-02
Mean rank of genes in gene set: 2936
Rank on gene expression program of genes in gene set:
| Genes | Weight | Rank | GTEx | DepMap | Decartes | Mean.Counts | Mean.TPM |
|---|---|---|---|---|---|---|---|
| TMSB10 | 0.0029665 | 293 | GTEx | DepMap | Descartes | 154.48 | 19979.03 |
| FCGRT | 0.0018352 | 586 | GTEx | DepMap | Descartes | 2.52 | 58.06 |
| CTSL | 0.0003070 | 2914 | GTEx | DepMap | Descartes | 1.31 | NA |
| LTB | -0.0001513 | 7951 | GTEx | DepMap | Descartes | 0.00 | 0.00 |