Program: 16. M-MDSC.
Submit a comment on this gene expression program’s interpretation: CLICK
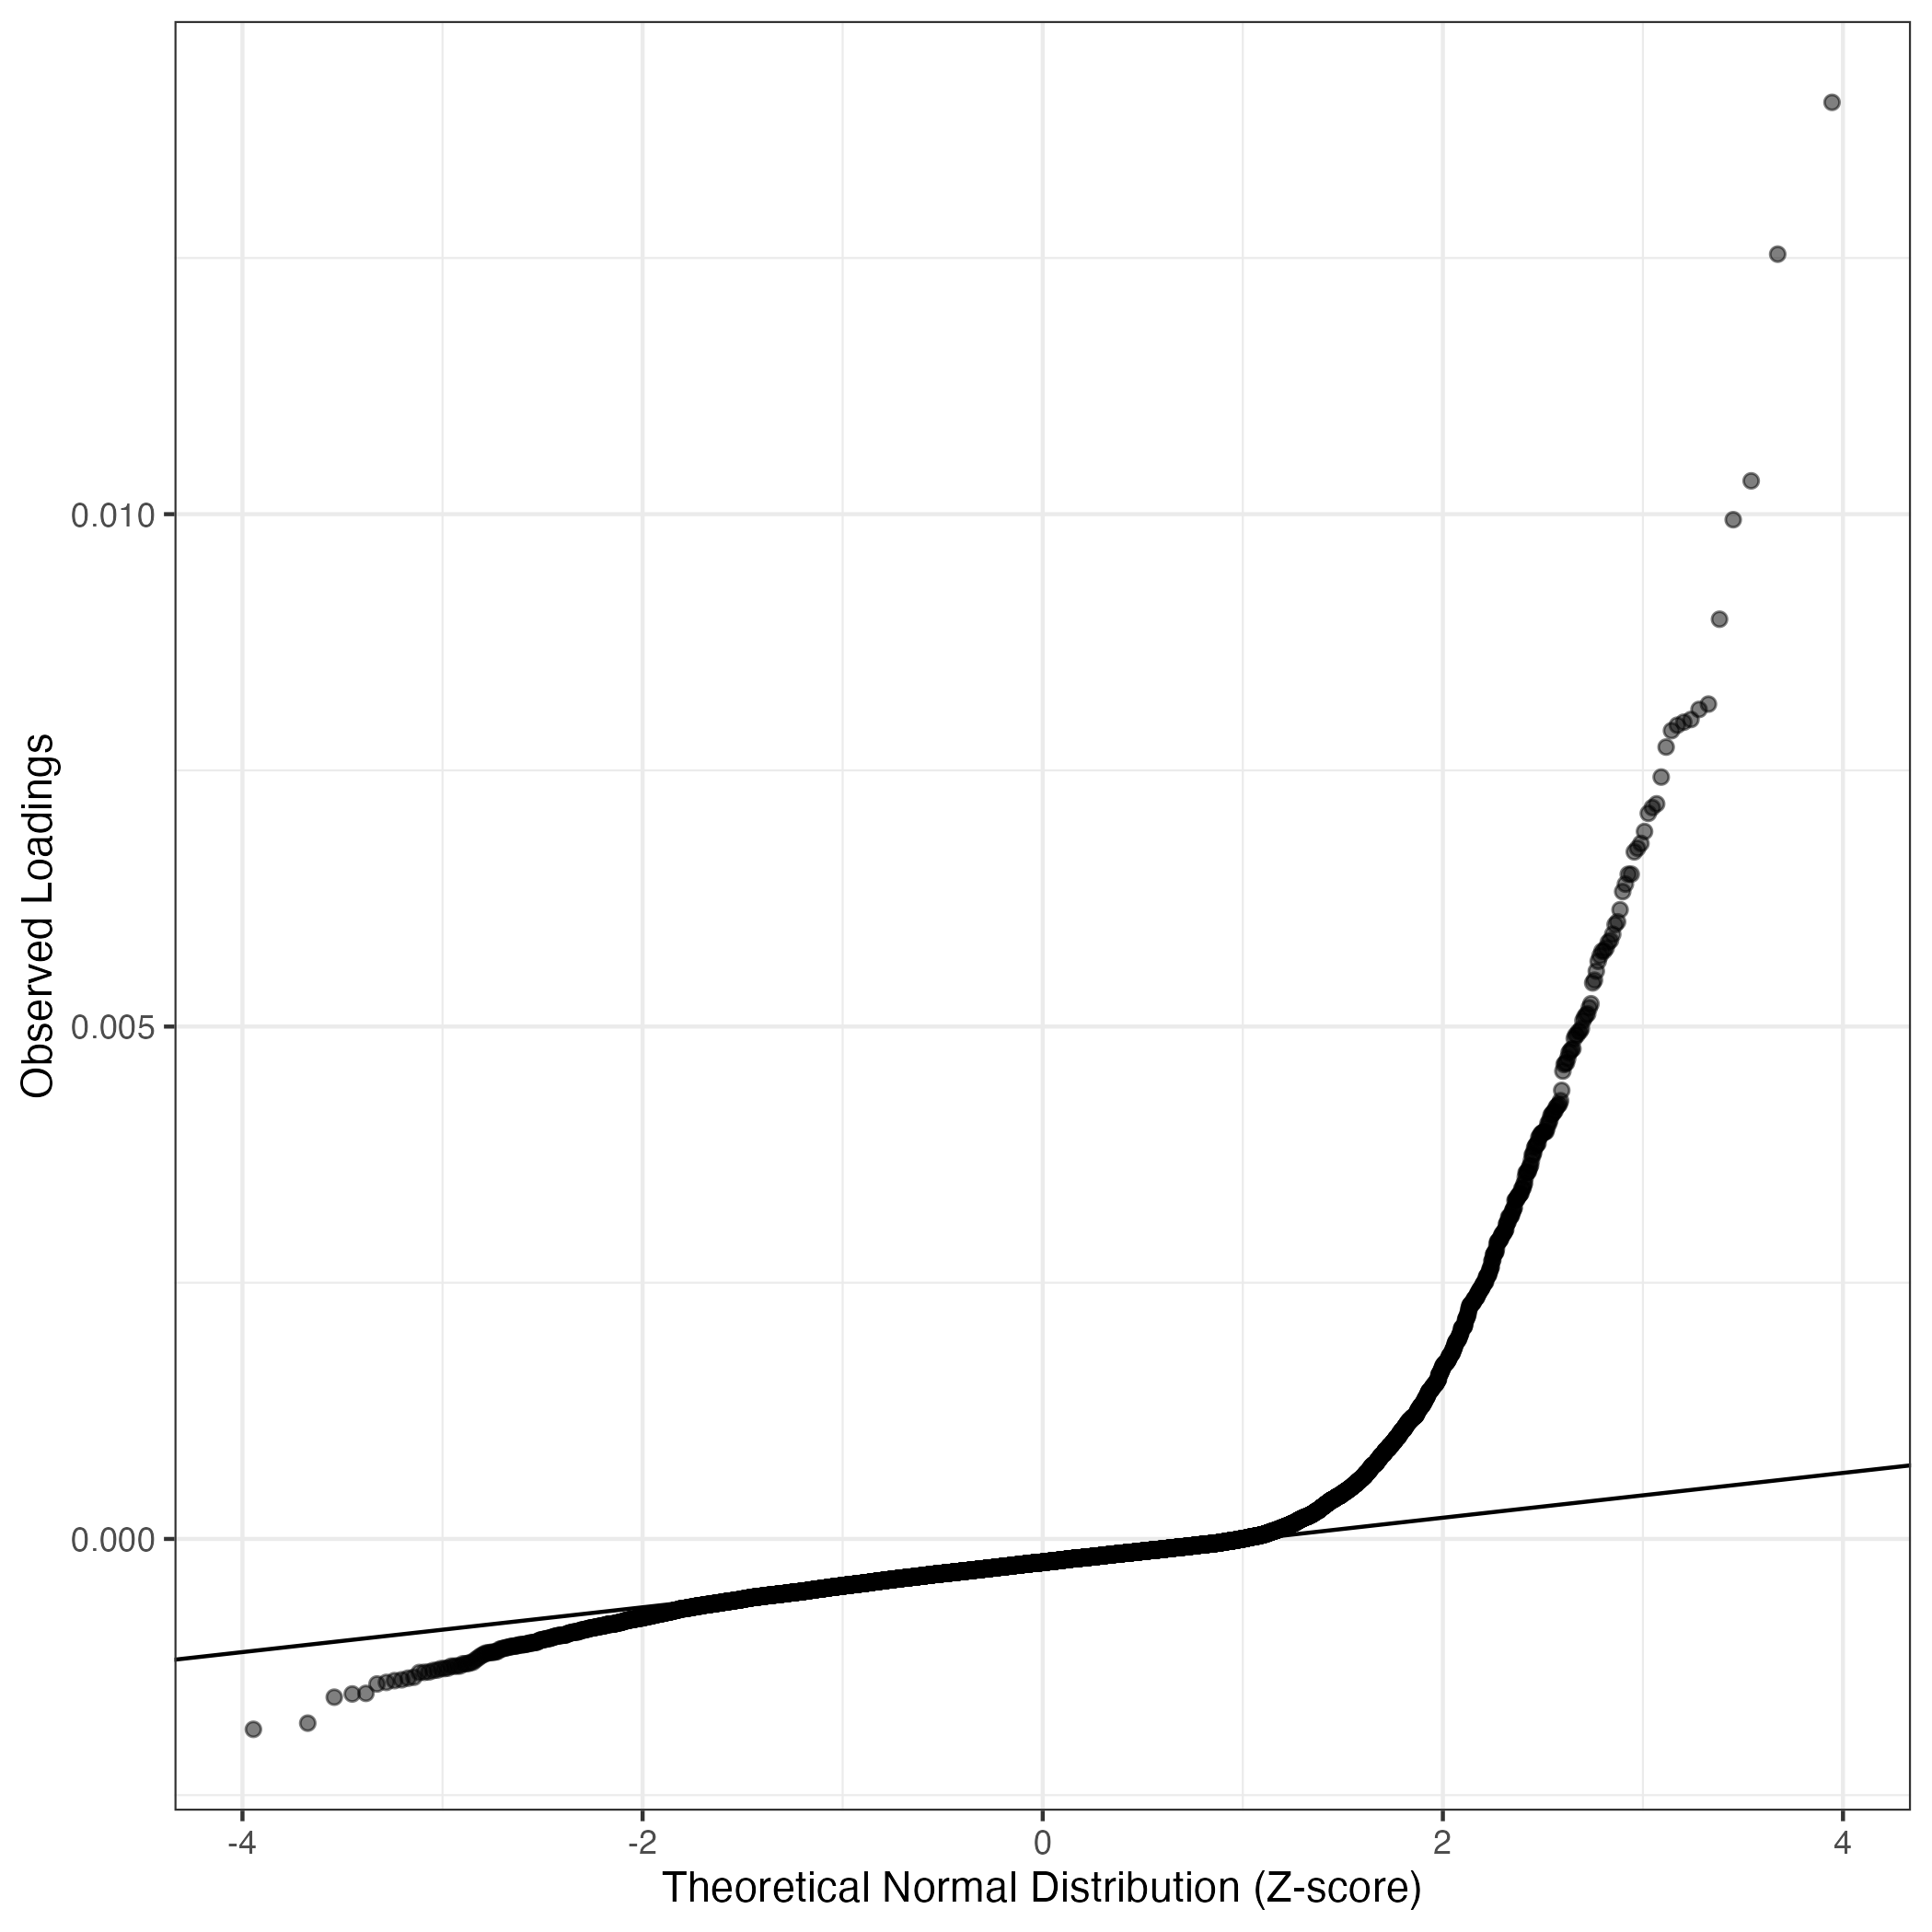
QQ-plot of gene loadings, averaged over both independent splits of the data
This plot highlights the relative contribution of each gene to the GEP
Top genes driving this program. Note: Decartes website is buggy, try refreshing. Also, Decartes fetal adrenal data have been collected at specific time points (89-122 days), all possible cell types of interest may not be represented, do not overinterpret. The Mean Count column shows the mean read count in cells scoring highly (H > 50) on this gene expression program (currently only calculated for the cells in the first 50/50 split of the data).
Note: Decartes website is buggy, try refreshing. Also, Decartes fetal adrenal data have been collected at specific time points (89-122 days), all possible cell types of interest may not be represented, do not overinterpret.
The Mean Count column shows the mean read count in cells scoring highly (H > 50) on this gene expression program.
| Gene | Loading | Gene.Name | GTEx | DepMap | Descartes | Mean.Counts | Mean.Tpm | |
|---|---|---|---|---|---|---|---|---|
| 1 | IL1B | 0.0140186 | interleukin 1 beta | GTEx | DepMap | Descartes | 78.40 | 17094.37 |
| 2 | TNF | 0.0125372 | tumor necrosis factor | GTEx | DepMap | Descartes | 10.12 | 1805.90 |
| 3 | SOD2 | 0.0103250 | superoxide dismutase 2 | GTEx | DepMap | Descartes | 50.03 | 1196.08 |
| 4 | IL10 | 0.0099461 | interleukin 10 | GTEx | DepMap | Descartes | 6.09 | 936.41 |
| 5 | PLEK | 0.0089749 | pleckstrin | GTEx | DepMap | Descartes | 9.32 | 1249.23 |
| 6 | C5AR1 | 0.0081466 | complement C5a receptor 1 | GTEx | DepMap | Descartes | 10.94 | 1656.81 |
| 7 | AMPD3 | 0.0080945 | adenosine monophosphate deaminase 3 | GTEx | DepMap | Descartes | 2.77 | 249.91 |
| 8 | CXCL3 | 0.0079966 | C-X-C motif chemokine ligand 3 | GTEx | DepMap | Descartes | 38.11 | 9407.13 |
| 9 | MIR155HG | 0.0079699 | MIR155 host gene | GTEx | DepMap | Descartes | 3.67 | 829.88 |
| 10 | ACSL1 | 0.0079404 | acyl-CoA synthetase long chain family member 1 | GTEx | DepMap | Descartes | 4.06 | 359.42 |
| 11 | PLAUR | 0.0078874 | plasminogen activator, urokinase receptor | GTEx | DepMap | Descartes | 13.26 | 3375.35 |
| 12 | FNIP2 | 0.0077274 | folliculin interacting protein 2 | GTEx | DepMap | Descartes | 9.49 | 503.45 |
| 13 | TNFAIP2 | 0.0074347 | TNF alpha induced protein 2 | GTEx | DepMap | Descartes | 10.60 | 837.23 |
| 14 | NFKBIA | 0.0071731 | NFKB inhibitor alpha | GTEx | DepMap | Descartes | 42.18 | 9595.46 |
| 15 | CXCL2 | 0.0071368 | C-X-C motif chemokine ligand 2 | GTEx | DepMap | Descartes | 44.42 | 12378.61 |
| 16 | INSIG1 | 0.0070806 | insulin induced gene 1 | GTEx | DepMap | Descartes | 9.60 | 1210.09 |
| 17 | TLR2 | 0.0069033 | toll like receptor 2 | GTEx | DepMap | Descartes | 2.46 | 223.73 |
| 18 | CTSL | 0.0067874 | cathepsin L | GTEx | DepMap | Descartes | 12.38 | NA |
| 19 | KYNU | 0.0067401 | kynureninase | GTEx | DepMap | Descartes | 3.57 | 87.76 |
| 20 | RBM47 | 0.0067046 | RNA binding motif protein 47 | GTEx | DepMap | Descartes | 3.23 | 223.17 |
| 21 | IL1RN | 0.0064871 | interleukin 1 receptor antagonist | GTEx | DepMap | Descartes | 11.67 | 2688.89 |
| 22 | DRAM1 | 0.0064859 | DNA damage regulated autophagy modulator 1 | GTEx | DepMap | Descartes | 2.31 | 255.71 |
| 23 | TNIP3 | 0.0063898 | TNFAIP3 interacting protein 3 | GTEx | DepMap | Descartes | 1.97 | 415.17 |
| 24 | TRAF1 | 0.0063171 | TNF receptor associated factor 1 | GTEx | DepMap | Descartes | 4.05 | 319.00 |
| 25 | CD44 | 0.0061398 | CD44 molecule (Indian blood group) | GTEx | DepMap | Descartes | 17.01 | 1240.01 |
| 26 | NFKB1 | 0.0060221 | nuclear factor kappa B subunit 1 | GTEx | DepMap | Descartes | 11.35 | 990.64 |
| 27 | KMO | 0.0059946 | kynurenine 3-monooxygenase | GTEx | DepMap | Descartes | 2.27 | 162.11 |
| 28 | WTAP | 0.0059007 | WT1 associated protein | GTEx | DepMap | Descartes | 6.55 | 646.14 |
| 29 | EREG | 0.0058409 | epiregulin | GTEx | DepMap | Descartes | 10.40 | 928.22 |
| 30 | IER3 | 0.0058217 | immediate early response 3 | GTEx | DepMap | Descartes | 33.31 | 7381.94 |
| 31 | ICAM1 | 0.0057661 | intercellular adhesion molecule 1 | GTEx | DepMap | Descartes | 6.72 | 814.32 |
| 32 | TNFAIP8 | 0.0057381 | TNF alpha induced protein 8 | GTEx | DepMap | Descartes | 3.99 | 192.21 |
| 33 | EHD1 | 0.0057359 | EH domain containing 1 | GTEx | DepMap | Descartes | 4.60 | 385.26 |
| 34 | TNFAIP3 | 0.0056915 | TNF alpha induced protein 3 | GTEx | DepMap | Descartes | 20.00 | 1563.84 |
| 35 | NINJ1 | 0.0056368 | ninjurin 1 | GTEx | DepMap | Descartes | 5.85 | 996.19 |
| 36 | PTGS2 | 0.0055409 | prostaglandin-endoperoxide synthase 2 | GTEx | DepMap | Descartes | 10.88 | 869.54 |
| 37 | SAT1 | 0.0054523 | spermidine/spermine N1-acetyltransferase 1 | GTEx | DepMap | Descartes | 29.57 | 9034.88 |
| 38 | DSE | 0.0054259 | dermatan sulfate epimerase | GTEx | DepMap | Descartes | 3.12 | 114.22 |
| 39 | CREG1 | 0.0052225 | cellular repressor of E1A stimulated genes 1 | GTEx | DepMap | Descartes | 3.75 | 543.74 |
| 40 | PSTPIP2 | 0.0051838 | proline-serine-threonine phosphatase interacting protein 2 | GTEx | DepMap | Descartes | 0.79 | 82.96 |
| 41 | MFSD2A | 0.0051233 | major facilitator superfamily domain containing 2A | GTEx | DepMap | Descartes | 1.43 | 205.28 |
| 42 | NAMPT | 0.0051133 | nicotinamide phosphoribosyltransferase | GTEx | DepMap | Descartes | 7.19 | 528.33 |
| 43 | LCP2 | 0.0050884 | lymphocyte cytosolic protein 2 | GTEx | DepMap | Descartes | 3.87 | 358.58 |
| 44 | ITGAX | 0.0050564 | integrin subunit alpha X | GTEx | DepMap | Descartes | 5.08 | 434.43 |
| 45 | BASP1 | 0.0049798 | brain abundant membrane attached signal protein 1 | GTEx | DepMap | Descartes | 10.22 | 2212.29 |
| 46 | IRAK2 | 0.0049537 | interleukin 1 receptor associated kinase 2 | GTEx | DepMap | Descartes | 2.00 | 186.04 |
| 47 | CFLAR | 0.0049488 | CASP8 and FADD like apoptosis regulator | GTEx | DepMap | Descartes | 9.34 | 224.83 |
| 48 | P2RX7 | 0.0049188 | purinergic receptor P2X 7 | GTEx | DepMap | Descartes | 1.67 | 141.02 |
| 49 | SIRPA | 0.0049148 | signal regulatory protein alpha | GTEx | DepMap | Descartes | 2.08 | 151.21 |
| 50 | SERPINB9 | 0.0048829 | serpin family B member 9 | GTEx | DepMap | Descartes | 8.09 | 709.30 |
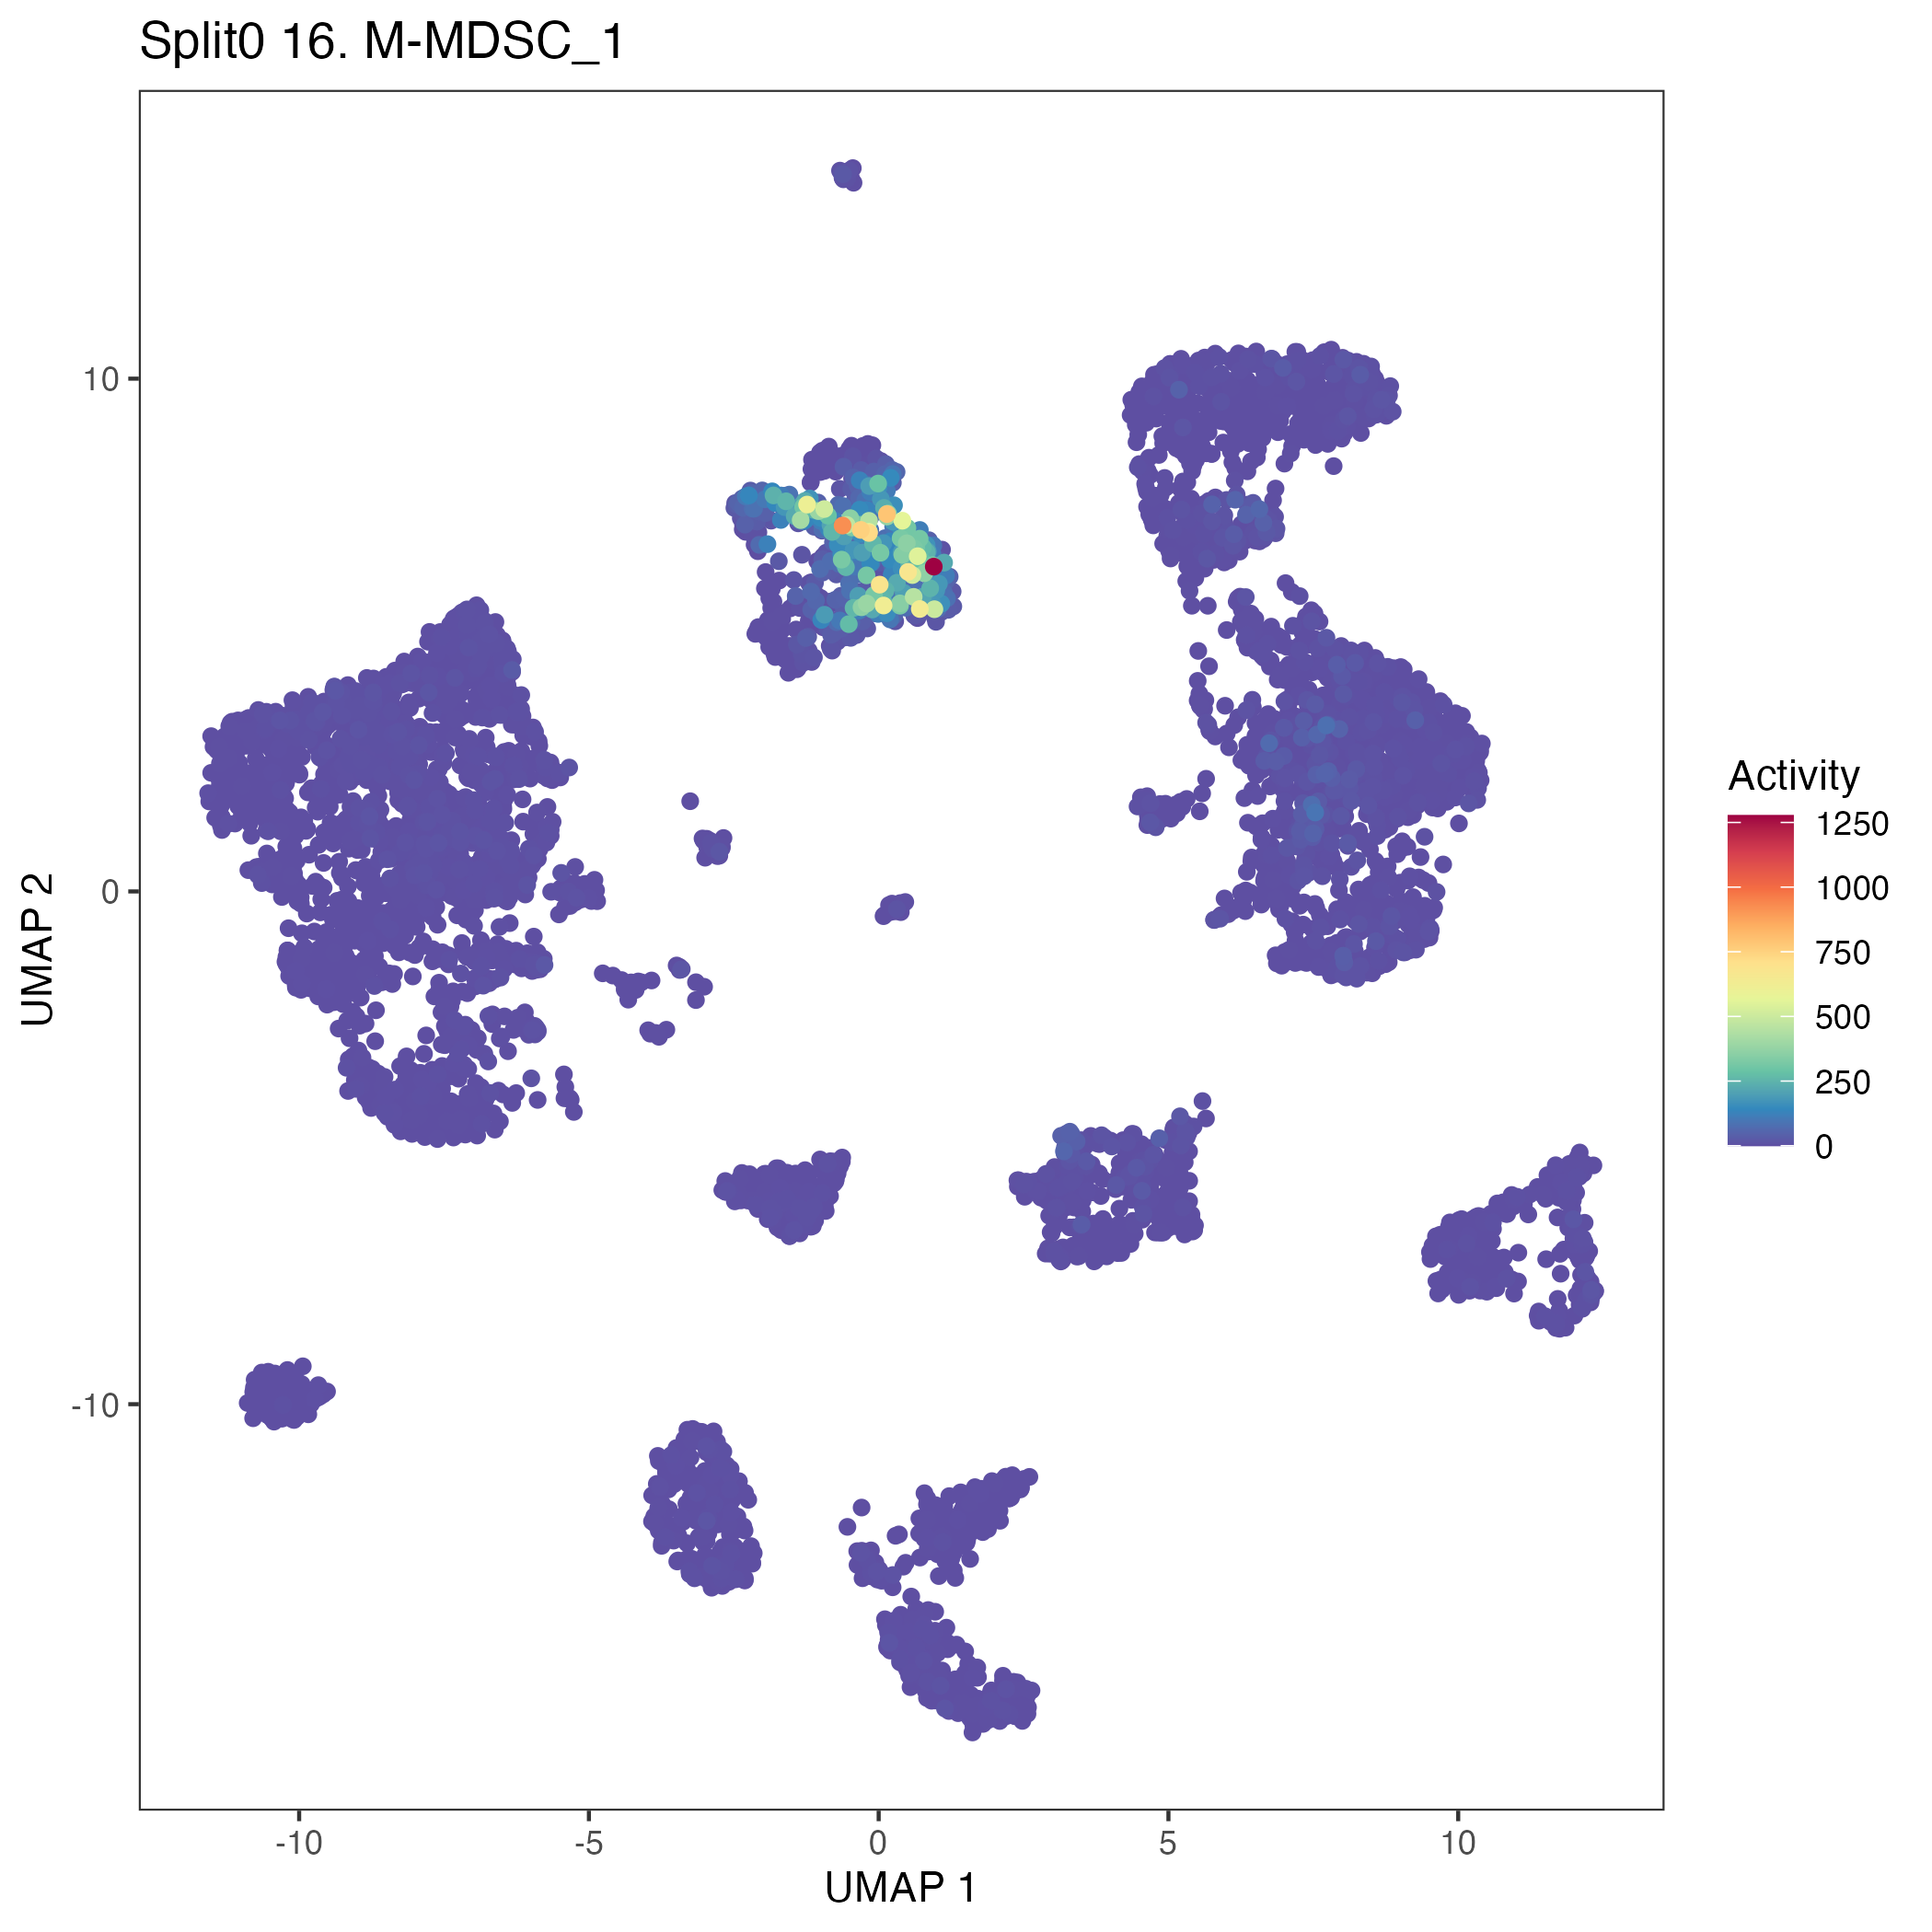
UMAP plots showing activity of gene expression program identified in community:16. M-MDSC
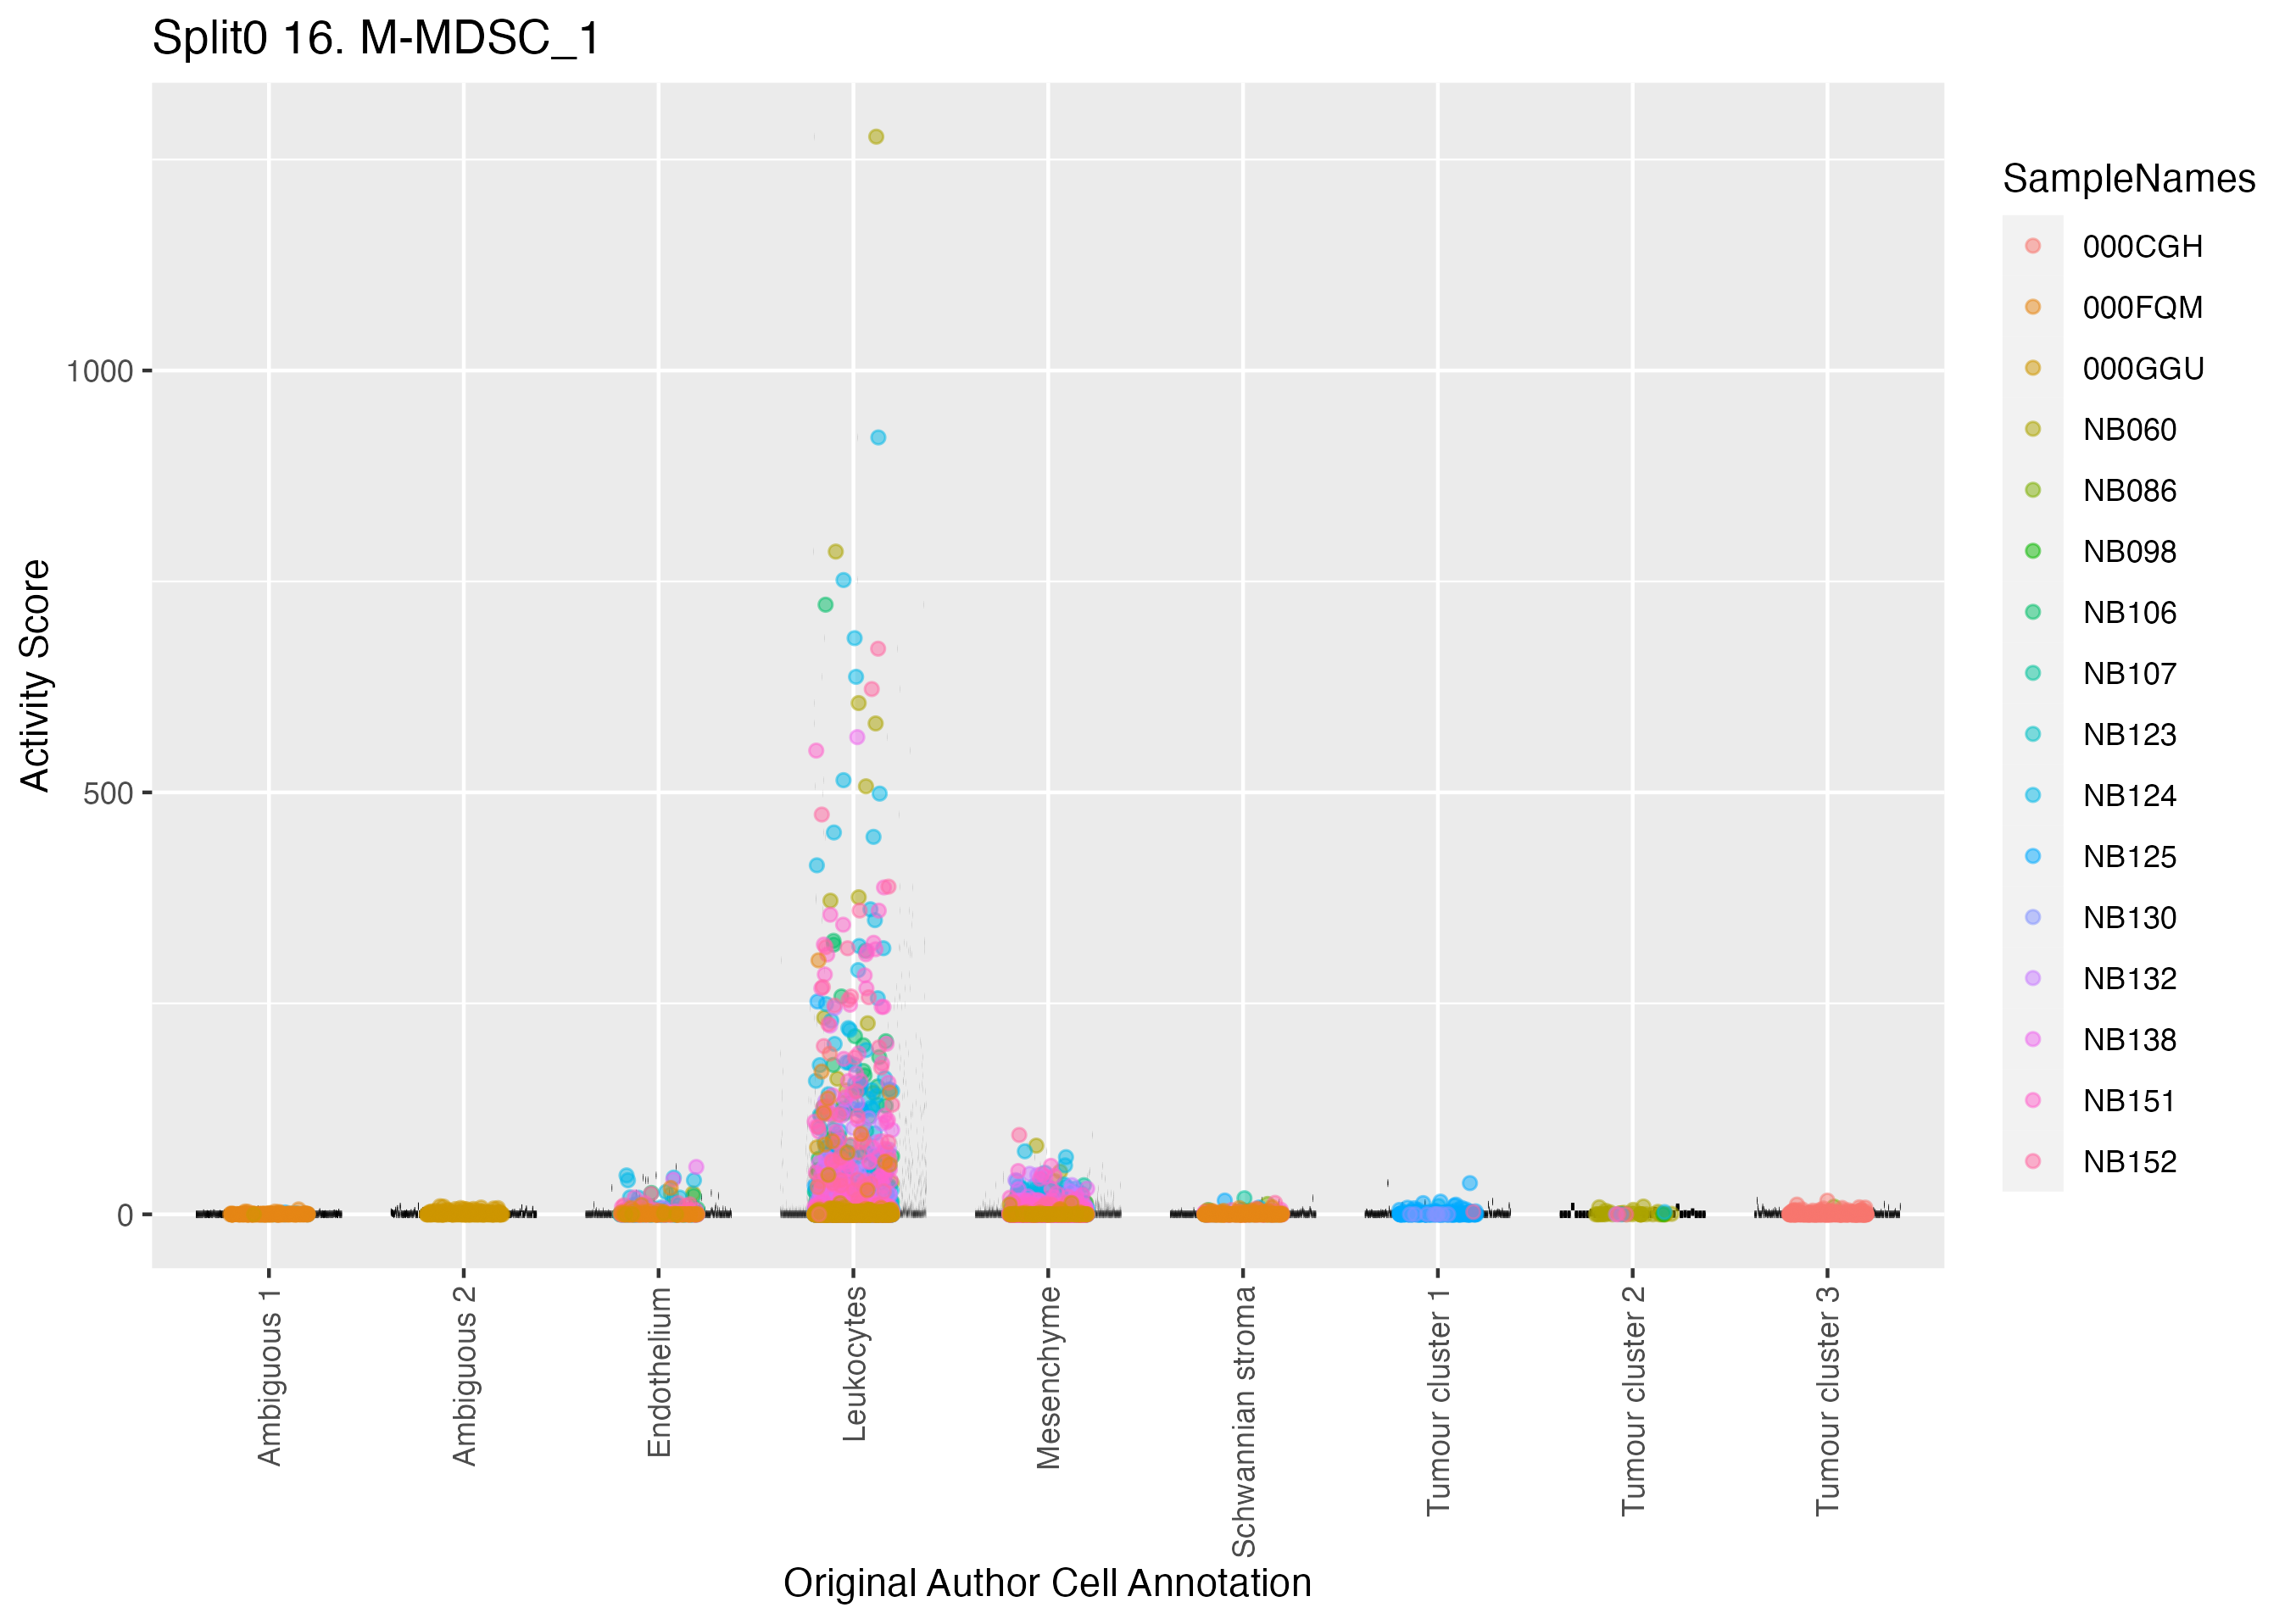
Boxlot showing activity of gene expression program identified in GEP 16. M-MDSC:
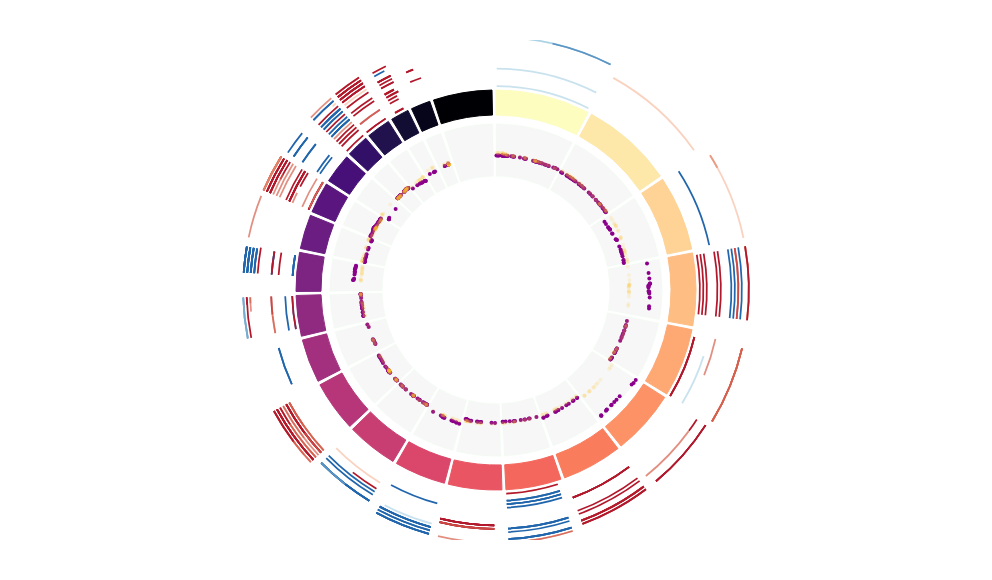
CNV Data procured from inferCNV.
Outer tracks are putative CNV regions (gains = red, losses = blue) for each patient
Inner track is expression data representing:
The top cells expressing this GEP (purple)
Random cells (n =50) from the reference set used in inferCNV (orange)
Gene set Enrichments for this program, caculated from top 50 genes
mSigDB Cell Types Gene Set:
| P-value | OR | Lower 95% CI | FDR | FWER | Genes Found | Gene Set Size | |
|---|---|---|---|---|---|---|---|
| TRAVAGLINI_LUNG_OLR1_CLASSICAL_MONOCYTE_CELL | 9.72e-50 | 134.72 | 56.94 | 6.52e-47 | 6.52e-47 | 44IL1B, SOD2, IL10, PLEK, C5AR1, AMPD3, CXCL3, ACSL1, PLAUR, FNIP2, TNFAIP2, NFKBIA, CXCL2, INSIG1, TLR2, CTSL, KYNU, RBM47, IL1RN, DRAM1, TNIP3, TRAF1, CD44, NFKB1, WTAP, EREG, IER3, ICAM1, TNFAIP8, EHD1, TNFAIP3, NINJ1, PTGS2, SAT1, DSE, PSTPIP2, NAMPT, LCP2, ITGAX, BASP1, IRAK2, CFLAR, SIRPA, SERPINB9 |
726 |
| TRAVAGLINI_LUNG_EREG_DENDRITIC_CELL | 1.56e-31 | 40.69 | 21.99 | 5.25e-29 | 1.05e-28 | 32IL1B, SOD2, IL10, PLEK, C5AR1, CXCL3, ACSL1, PLAUR, CXCL2, INSIG1, TLR2, CTSL, KYNU, RBM47, IL1RN, CD44, NFKB1, WTAP, EREG, IER3, ICAM1, TNFAIP3, NINJ1, SAT1, DSE, PSTPIP2, NAMPT, LCP2, ITGAX, BASP1, SIRPA, SERPINB9 |
579 |
| DURANTE_ADULT_OLFACTORY_NEUROEPITHELIUM_DENDRITIC_CELLS | 4.80e-16 | 42.17 | 19.96 | 5.37e-14 | 3.22e-13 | 13IL1B, SOD2, PLEK, C5AR1, PLAUR, TNFAIP2, NFKBIA, CXCL2, CD44, EREG, TNFAIP3, PTGS2, NAMPT |
117 |
| GAO_LARGE_INTESTINE_24W_C11_PANETH_LIKE_CELL | 4.77e-24 | 35.25 | 19.08 | 1.07e-21 | 3.20e-21 | 23IL1B, TNF, SOD2, IL10, PLEK, C5AR1, CXCL3, PLAUR, TNFAIP2, CXCL2, TLR2, CTSL, KYNU, IL1RN, TRAF1, ICAM1, TNFAIP3, NINJ1, PTGS2, CREG1, NAMPT, LCP2, ITGAX |
325 |
| AIZARANI_LIVER_C25_KUPFFER_CELLS_4 | 8.84e-17 | 33.68 | 16.74 | 1.19e-14 | 5.93e-14 | 15IL1B, PLEK, C5AR1, CXCL3, PLAUR, TLR2, IL1RN, EREG, IER3, SAT1, PSTPIP2, NAMPT, ITGAX, BASP1, SERPINB9 |
174 |
| FAN_OVARY_CL13_MONOCYTE_MACROPHAGE | 9.75e-21 | 24.50 | 13.30 | 1.64e-18 | 6.55e-18 | 23SOD2, PLEK, PLAUR, FNIP2, NFKBIA, CXCL2, INSIG1, CTSL, KYNU, RBM47, CD44, NFKB1, WTAP, IER3, TNFAIP8, EHD1, NINJ1, SAT1, DSE, NAMPT, BASP1, CFLAR, SERPINB9 |
458 |
| AIZARANI_LIVER_C23_KUPFFER_CELLS_3 | 3.06e-15 | 25.98 | 12.98 | 2.93e-13 | 2.05e-12 | 15IL1B, SOD2, PLEK, C5AR1, PLAUR, TNFAIP2, NFKBIA, TLR2, CD44, EREG, PTGS2, SAT1, NAMPT, ITGAX, BASP1 |
221 |
| AIZARANI_LIVER_C18_NK_NKT_CELLS_5 | 3.22e-11 | 28.12 | 12.23 | 2.16e-09 | 2.16e-08 | 10IL1B, PLEK, C5AR1, PLAUR, TNFAIP2, TLR2, IER3, SAT1, ITGAX, P2RX7 |
121 |
| TRAVAGLINI_LUNG_VEIN_CELL | 4.77e-07 | 39.59 | 11.58 | 1.33e-05 | 3.20e-04 | 5SOD2, CXCL2, ICAM1, TNFAIP3, NAMPT |
40 |
| CUI_DEVELOPING_HEART_C8_MACROPHAGE | 7.32e-14 | 20.61 | 10.32 | 6.14e-12 | 4.91e-11 | 15SOD2, PLEK, C5AR1, PLAUR, NFKBIA, TLR2, RBM47, IER3, NINJ1, CREG1, NAMPT, LCP2, ITGAX, BASP1, SIRPA |
275 |
| TRAVAGLINI_LUNG_MACROPHAGE_CELL | 2.48e-10 | 18.55 | 8.44 | 1.51e-08 | 1.67e-07 | 11IL1B, SOD2, CXCL3, ACSL1, PLAUR, TNFAIP2, CXCL2, CTSL, KYNU, IL1RN, SIRPA |
201 |
| AIZARANI_LIVER_C6_KUPFFER_CELLS_2 | 9.30e-10 | 16.25 | 7.40 | 4.16e-08 | 6.24e-07 | 11IL1B, PLEK, C5AR1, TNFAIP2, TLR2, RBM47, IER3, SAT1, CREG1, ITGAX, BASP1 |
228 |
| FAN_EMBRYONIC_CTX_MICROGLIA_2 | 5.49e-04 | 74.10 | 7.33 | 7.52e-03 | 3.69e-01 | 2IL1B, IER3 |
9 |
| AIZARANI_LIVER_C2_KUPFFER_CELLS_1 | 4.29e-09 | 16.45 | 7.22 | 1.80e-07 | 2.88e-06 | 10IL1B, PLEK, C5AR1, PLAUR, TLR2, IER3, SAT1, PSTPIP2, ITGAX, BASP1 |
200 |
| FAN_EMBRYONIC_CTX_BRAIN_MYELOID | 6.17e-08 | 18.17 | 7.22 | 2.18e-06 | 4.14e-05 | 8C5AR1, PLAUR, TNFAIP2, NFKBIA, CD44, PTGS2, NAMPT, ITGAX |
139 |
| DESCARTES_FETAL_THYMUS_ANTIGEN_PRESENTING_CELLS | 1.91e-08 | 16.83 | 7.07 | 7.53e-07 | 1.28e-05 | 9PLEK, MIR155HG, ACSL1, PLAUR, TLR2, KYNU, IL1RN, TRAF1, ITGAX |
172 |
| BUSSLINGER_GASTRIC_REG3A_POSITIVE_CELLS | 2.66e-05 | 27.14 | 6.78 | 4.69e-04 | 1.78e-02 | 4SOD2, CXCL3, CXCL2, SAT1 |
44 |
| AIZARANI_LIVER_C31_KUPFFER_CELLS_5 | 4.09e-07 | 17.99 | 6.69 | 1.19e-05 | 2.74e-04 | 7IL1B, C5AR1, PLAUR, IL1RN, SAT1, NAMPT, ITGAX |
120 |
| MANNO_MIDBRAIN_NEUROTYPES_HMGL | 1.40e-12 | 12.59 | 6.61 | 1.05e-10 | 9.42e-10 | 18IL1B, SOD2, PLEK, PLAUR, NFKBIA, CXCL2, CTSL, RBM47, DRAM1, CD44, ICAM1, TNFAIP3, NINJ1, PTGS2, SAT1, CREG1, IRAK2, SIRPA |
577 |
| HAY_BONE_MARROW_IMMATURE_NEUTROPHIL | 5.33e-08 | 14.83 | 6.24 | 1.99e-06 | 3.58e-05 | 9IL1B, TNFAIP2, NFKBIA, IER3, ICAM1, NINJ1, DSE, NAMPT, LCP2 |
194 |
Dowload full table
mSigDB Hallmark Gene Sets:
| P-value | OR | Lower 95% CI | FDR | FWER | Genes Found | Gene Set Size | |
|---|---|---|---|---|---|---|---|
| HALLMARK_TNFA_SIGNALING_VIA_NFKB | 1.50e-32 | 71.50 | 38.46 | 7.51e-31 | 7.51e-31 | 25IL1B, TNF, SOD2, PLEK, CXCL3, PLAUR, TNFAIP2, NFKBIA, CXCL2, TLR2, KYNU, DRAM1, TRAF1, CD44, NFKB1, IER3, ICAM1, TNFAIP8, EHD1, TNFAIP3, NINJ1, PTGS2, SAT1, NAMPT, CFLAR |
200 |
| HALLMARK_INFLAMMATORY_RESPONSE | 5.03e-13 | 23.47 | 11.26 | 1.26e-11 | 2.51e-11 | 13IL1B, IL10, C5AR1, PLAUR, NFKBIA, TLR2, NFKB1, EREG, ICAM1, NAMPT, LCP2, IRAK2, P2RX7 |
200 |
| HALLMARK_APOPTOSIS | 1.90e-07 | 15.56 | 6.20 | 2.38e-06 | 9.52e-06 | 8IL1B, TNF, SOD2, CD44, EREG, IER3, SAT1, CFLAR |
161 |
| HALLMARK_INTERFERON_GAMMA_RESPONSE | 6.91e-08 | 14.37 | 6.05 | 1.15e-06 | 3.45e-06 | 9SOD2, TNFAIP2, NFKBIA, NFKB1, ICAM1, TNFAIP3, PTGS2, NAMPT, LCP2 |
200 |
| HALLMARK_IL6_JAK_STAT3_SIGNALING | 2.29e-05 | 16.92 | 5.11 | 1.63e-04 | 1.14e-03 | 5IL1B, TNF, CXCL3, TLR2, CD44 |
87 |
| HALLMARK_COMPLEMENT | 1.19e-05 | 10.54 | 3.95 | 9.90e-05 | 5.94e-04 | 7PLEK, PLAUR, CTSL, KYNU, EHD1, TNFAIP3, LCP2 |
200 |
| HALLMARK_ALLOGRAFT_REJECTION | 1.19e-05 | 10.54 | 3.95 | 9.90e-05 | 5.94e-04 | 7IL1B, TNF, IL10, TLR2, EREG, ICAM1, LCP2 |
200 |
| HALLMARK_KRAS_SIGNALING_UP | 1.24e-04 | 8.78 | 3.02 | 7.73e-04 | 6.18e-03 | 6IL1B, PLAUR, TRAF1, EREG, TNFAIP3, PTGS2 |
200 |
| HALLMARK_UV_RESPONSE_UP | 3.76e-04 | 9.08 | 2.77 | 2.09e-03 | 1.88e-02 | 5SOD2, NFKBIA, CXCL2, ICAM1, CREG1 |
158 |
| HALLMARK_EPITHELIAL_MESENCHYMAL_TRANSITION | 1.08e-03 | 7.12 | 2.18 | 5.40e-03 | 5.40e-02 | 5PLAUR, CD44, TNFAIP3, SAT1, BASP1 |
200 |
| HALLMARK_ANDROGEN_RESPONSE | 7.18e-03 | 8.22 | 1.61 | 2.75e-02 | 3.59e-01 | 3INSIG1, TNFAIP8, SAT1 |
100 |
| HALLMARK_HYPOXIA | 7.71e-03 | 5.55 | 1.44 | 2.75e-02 | 3.85e-01 | 4AMPD3, PLAUR, IER3, TNFAIP3 |
200 |
| HALLMARK_APICAL_JUNCTION | 7.71e-03 | 5.55 | 1.44 | 2.75e-02 | 3.85e-01 | 4INSIG1, TRAF1, ICAM1, SIRPA |
200 |
| HALLMARK_P53_PATHWAY | 7.71e-03 | 5.55 | 1.44 | 2.75e-02 | 3.85e-01 | 4DRAM1, IER3, NINJ1, SAT1 |
200 |
| HALLMARK_IL2_STAT5_SIGNALING | 4.30e-02 | 4.07 | 0.80 | 1.43e-01 | 1.00e+00 | 3IL10, TRAF1, CD44 |
199 |
| HALLMARK_PEROXISOME | 6.35e-02 | 5.11 | 0.59 | 1.99e-01 | 1.00e+00 | 2SOD2, ACSL1 |
104 |
| HALLMARK_UV_RESPONSE_DN | 1.10e-01 | 3.67 | 0.43 | 3.24e-01 | 1.00e+00 | 2INSIG1, NFKB1 |
144 |
| HALLMARK_MTORC1_SIGNALING | 1.85e-01 | 2.63 | 0.31 | 4.20e-01 | 1.00e+00 | 2INSIG1, NAMPT |
200 |
| HALLMARK_XENOBIOTIC_METABOLISM | 1.85e-01 | 2.63 | 0.31 | 4.20e-01 | 1.00e+00 | 2KYNU, NINJ1 |
200 |
| HALLMARK_GLYCOLYSIS | 1.85e-01 | 2.63 | 0.31 | 4.20e-01 | 1.00e+00 | 2CD44, IER3 |
200 |
Dowload full table
KEGG Pathways:
| P-value | OR | Lower 95% CI | FDR | FWER | Genes Found | Gene Set Size | |
|---|---|---|---|---|---|---|---|
| KEGG_LEISHMANIA_INFECTION | 1.20e-08 | 31.26 | 11.44 | 2.23e-06 | 2.23e-06 | 7IL1B, TNF, IL10, NFKBIA, TLR2, NFKB1, PTGS2 |
72 |
| KEGG_NOD_LIKE_RECEPTOR_SIGNALING_PATHWAY | 1.48e-07 | 30.40 | 10.17 | 1.38e-05 | 2.75e-05 | 6IL1B, TNF, NFKBIA, CXCL2, NFKB1, TNFAIP3 |
62 |
| KEGG_APOPTOSIS | 1.12e-06 | 21.03 | 7.12 | 6.91e-05 | 2.07e-04 | 6IL1B, TNF, NFKBIA, NFKB1, IRAK2, CFLAR |
87 |
| KEGG_ADIPOCYTOKINE_SIGNALING_PATHWAY | 1.39e-04 | 17.24 | 4.38 | 4.32e-03 | 2.59e-02 | 4TNF, ACSL1, NFKBIA, NFKB1 |
67 |
| KEGG_TOLL_LIKE_RECEPTOR_SIGNALING_PATHWAY | 4.90e-05 | 14.31 | 4.34 | 2.28e-03 | 9.12e-03 | 5IL1B, TNF, NFKBIA, TLR2, NFKB1 |
102 |
| KEGG_T_CELL_RECEPTOR_SIGNALING_PATHWAY | 6.43e-05 | 13.47 | 4.09 | 2.39e-03 | 1.20e-02 | 5TNF, IL10, NFKBIA, NFKB1, LCP2 |
108 |
| KEGG_SMALL_CELL_LUNG_CANCER | 3.32e-04 | 13.58 | 3.47 | 8.82e-03 | 6.17e-02 | 4NFKBIA, TRAF1, NFKB1, PTGS2 |
84 |
| KEGG_CYTOSOLIC_DNA_SENSING_PATHWAY | 1.33e-03 | 15.33 | 2.96 | 3.10e-02 | 2.48e-01 | 3IL1B, NFKBIA, NFKB1 |
55 |
| KEGG_RIG_I_LIKE_RECEPTOR_SIGNALING_PATHWAY | 2.77e-03 | 11.73 | 2.28 | 5.72e-02 | 5.15e-01 | 3TNF, NFKBIA, NFKB1 |
71 |
| KEGG_ASTHMA | 6.27e-03 | 18.58 | 2.09 | 9.09e-02 | 1.00e+00 | 2TNF, IL10 |
30 |
| KEGG_HEMATOPOIETIC_CELL_LINEAGE | 4.89e-03 | 9.50 | 1.85 | 8.27e-02 | 9.10e-01 | 3IL1B, TNF, CD44 |
87 |
| KEGG_ALLOGRAFT_REJECTION | 9.43e-03 | 14.87 | 1.69 | 1.25e-01 | 1.00e+00 | 2TNF, IL10 |
37 |
| KEGG_CYTOKINE_CYTOKINE_RECEPTOR_INTERACTION | 3.61e-03 | 5.34 | 1.64 | 6.72e-02 | 6.72e-01 | 5IL1B, TNF, IL10, CXCL3, CXCL2 |
265 |
| KEGG_TRYPTOPHAN_METABOLISM | 1.10e-02 | 13.70 | 1.56 | 1.33e-01 | 1.00e+00 | 2KYNU, KMO |
40 |
| KEGG_CHEMOKINE_SIGNALING_PATHWAY | 6.35e-03 | 5.87 | 1.52 | 9.09e-02 | 1.00e+00 | 4CXCL3, NFKBIA, CXCL2, NFKB1 |
189 |
| KEGG_GRAFT_VERSUS_HOST_DISEASE | 1.15e-02 | 13.35 | 1.52 | 1.33e-01 | 1.00e+00 | 2IL1B, TNF |
41 |
| KEGG_TYPE_I_DIABETES_MELLITUS | 1.26e-02 | 12.69 | 1.45 | 1.38e-01 | 1.00e+00 | 2IL1B, TNF |
43 |
| KEGG_NEUROTROPHIN_SIGNALING_PATHWAY | 1.34e-02 | 6.49 | 1.27 | 1.38e-01 | 1.00e+00 | 3NFKBIA, NFKB1, IRAK2 |
126 |
| KEGG_NATURAL_KILLER_CELL_MEDIATED_CYTOTOXICITY | 1.67e-02 | 5.95 | 1.17 | 1.63e-01 | 1.00e+00 | 3TNF, ICAM1, LCP2 |
137 |
| KEGG_EPITHELIAL_CELL_SIGNALING_IN_HELICOBACTER_PYLORI_INFECTION | 2.97e-02 | 7.89 | 0.91 | 2.70e-01 | 1.00e+00 | 2NFKBIA, NFKB1 |
68 |
Dowload full table
CHR Positional Gene Sets:
| P-value | OR | Lower 95% CI | FDR | FWER | Genes Found | Gene Set Size | |
|---|---|---|---|---|---|---|---|
| chr2q14 | 1.23e-01 | 3.43 | 0.40 | 1.00e+00 | 1.00e+00 | 2IL1B, IL1RN |
154 |
| chr6q25 | 1.23e-01 | 3.43 | 0.40 | 1.00e+00 | 1.00e+00 | 2SOD2, WTAP |
154 |
| chr4q27 | 1.09e-01 | 9.11 | 0.22 | 1.00e+00 | 1.00e+00 | 1TNIP3 |
29 |
| chr6p21 | 7.00e-01 | 1.12 | 0.13 | 1.00e+00 | 1.00e+00 | 2TNF, IER3 |
467 |
| chr4q24 | 2.00e-01 | 4.64 | 0.11 | 1.00e+00 | 1.00e+00 | 1NFKB1 |
56 |
| chr2p14 | 2.06e-01 | 4.47 | 0.11 | 1.00e+00 | 1.00e+00 | 1PLEK |
58 |
| chr14q13 | 2.09e-01 | 4.40 | 0.11 | 1.00e+00 | 1.00e+00 | 1NFKBIA |
59 |
| chr1q43 | 2.13e-01 | 4.32 | 0.11 | 1.00e+00 | 1.00e+00 | 1KMO |
60 |
| chr4p14 | 2.25e-01 | 4.05 | 0.10 | 1.00e+00 | 1.00e+00 | 1RBM47 |
64 |
| chr2q22 | 2.37e-01 | 3.81 | 0.09 | 1.00e+00 | 1.00e+00 | 1KYNU |
68 |
| chr1q31 | 2.46e-01 | 3.64 | 0.09 | 1.00e+00 | 1.00e+00 | 1PTGS2 |
71 |
| chr6p25 | 2.78e-01 | 3.15 | 0.08 | 1.00e+00 | 1.00e+00 | 1SERPINB9 |
82 |
| chr4q35 | 3.41e-01 | 2.45 | 0.06 | 1.00e+00 | 1.00e+00 | 1ACSL1 |
105 |
| chr6q23 | 3.44e-01 | 2.43 | 0.06 | 1.00e+00 | 1.00e+00 | 1TNFAIP3 |
106 |
| chr5q23 | 3.57e-01 | 2.32 | 0.06 | 1.00e+00 | 1.00e+00 | 1TNFAIP8 |
111 |
| chr4q32 | 3.62e-01 | 2.28 | 0.06 | 1.00e+00 | 1.00e+00 | 1FNIP2 |
113 |
| chr20p13 | 3.72e-01 | 2.20 | 0.05 | 1.00e+00 | 1.00e+00 | 1SIRPA |
117 |
| chr21q21 | 3.77e-01 | 2.16 | 0.05 | 1.00e+00 | 1.00e+00 | 1MIR155HG |
119 |
| chr6q22 | 3.77e-01 | 2.16 | 0.05 | 1.00e+00 | 1.00e+00 | 1DSE |
119 |
| chr19q13 | 4.39e-01 | 0.45 | 0.05 | 1.00e+00 | 1.00e+00 | 2C5AR1, PLAUR |
1165 |
Dowload full table
Transcription Factor Targets:
| P-value | OR | Lower 95% CI | FDR | FWER | Genes Found | Gene Set Size | |
|---|---|---|---|---|---|---|---|
| ZNF597_TARGET_GENES | 3.07e-04 | 4.07 | 1.87 | 3.48e-01 | 3.48e-01 | 11TNF, SOD2, PLEK, MIR155HG, NFKBIA, NFKB1, WTAP, TNFAIP8, TNFAIP3, NINJ1, CFLAR |
877 |
| NFKB_Q6 | 3.23e-03 | 5.49 | 1.69 | 8.58e-01 | 1.00e+00 | 5NFKBIA, CXCL2, IL1RN, ICAM1, PTGS2 |
258 |
| NFKB_C | 3.79e-03 | 5.28 | 1.62 | 8.58e-01 | 1.00e+00 | 5NFKBIA, IL1RN, TNIP3, ICAM1, PTGS2 |
268 |
| FOXJ2_01 | 6.12e-03 | 5.94 | 1.54 | 9.91e-01 | 1.00e+00 | 4TNF, CXCL2, IER3, LCP2 |
187 |
| NR0B1_TARGET_GENES | 1.29e-02 | 4.75 | 1.23 | 1.00e+00 | 1.00e+00 | 4TNFAIP2, CXCL2, TNFAIP3, NAMPT |
233 |
| NFKB_Q6_01 | 1.36e-02 | 4.67 | 1.21 | 1.00e+00 | 1.00e+00 | 4NFKBIA, IL1RN, TNIP3, ICAM1 |
237 |
| GGGNNTTTCC_NFKB_Q6_01 | 1.57e-02 | 6.09 | 1.20 | 1.00e+00 | 1.00e+00 | 3NFKBIA, IL1RN, EHD1 |
134 |
| IRF_Q6 | 1.50e-02 | 4.53 | 1.17 | 1.00e+00 | 1.00e+00 | 4KYNU, EREG, EHD1, SAT1 |
244 |
| HOXC11_TARGET_GENES | 1.94e-02 | 10.01 | 1.15 | 1.00e+00 | 1.00e+00 | 2IL10, PTGS2 |
54 |
| NFKAPPAB_01 | 1.73e-02 | 4.33 | 1.12 | 1.00e+00 | 1.00e+00 | 4TNF, CXCL2, IL1RN, ICAM1 |
255 |
| CREL_01 | 1.77e-02 | 4.30 | 1.11 | 1.00e+00 | 1.00e+00 | 4NFKBIA, IER3, ICAM1, EHD1 |
257 |
| BACH2_TARGET_GENES | 2.08e-02 | 2.21 | 1.08 | 1.00e+00 | 1.00e+00 | 13PLEK, AMPD3, MIR155HG, NFKBIA, RBM47, CD44, KMO, ICAM1, TNFAIP8, EHD1, DSE, ITGAX, CFLAR |
1998 |
| MAPK3_TARGET_GENES | 2.73e-02 | 8.26 | 0.95 | 1.00e+00 | 1.00e+00 | 2SOD2, SAT1 |
65 |
| ZNF558_TARGET_GENES | 3.27e-02 | 3.53 | 0.92 | 1.00e+00 | 1.00e+00 | 4SOD2, AMPD3, NFKB1, WTAP |
312 |
| NME2_TARGET_GENES | 3.13e-02 | 7.66 | 0.88 | 1.00e+00 | 1.00e+00 | 2AMPD3, BASP1 |
70 |
| KDM5D_TARGET_GENES | 7.19e-02 | 1.93 | 0.86 | 1.00e+00 | 1.00e+00 | 10SOD2, FNIP2, CXCL2, KYNU, DRAM1, WTAP, IER3, EHD1, TNFAIP3, MFSD2A |
1628 |
| SNAI1_TARGET_GENES | 4.44e-02 | 2.76 | 0.85 | 1.00e+00 | 1.00e+00 | 5SOD2, NFKBIA, NFKB1, WTAP, EHD1 |
509 |
| HEY2_TARGET_GENES | 3.47e-02 | 7.23 | 0.84 | 1.00e+00 | 1.00e+00 | 2AMPD3, ACSL1 |
74 |
| TTANTCA_UNKNOWN | 8.80e-02 | 2.12 | 0.80 | 1.00e+00 | 1.00e+00 | 7SOD2, TNIP3, CD44, EREG, PTGS2, SAT1, MFSD2A |
967 |
| FREAC7_01 | 4.35e-02 | 4.05 | 0.80 | 1.00e+00 | 1.00e+00 | 3CXCL2, IER3, LCP2 |
200 |
Dowload full table
GO Biological Processes:
| P-value | OR | Lower 95% CI | FDR | FWER | Genes Found | Gene Set Size | |
|---|---|---|---|---|---|---|---|
| GOBP_POSITIVE_REGULATION_OF_FEVER_GENERATION | 2.06e-06 | 197.13 | 28.20 | 4.66e-04 | 1.54e-02 | 3IL1B, TNF, PTGS2 |
7 |
| GOBP_REGULATION_OF_CALCIDIOL_1_MONOOXYGENASE_ACTIVITY | 2.06e-06 | 197.13 | 28.20 | 4.66e-04 | 1.54e-02 | 3IL1B, TNF, NFKB1 |
7 |
| GOBP_REGULATION_OF_CHRONIC_INFLAMMATORY_RESPONSE | 3.28e-06 | 158.40 | 23.90 | 6.46e-04 | 2.45e-02 | 3TNF, IL10, TNFAIP3 |
8 |
| GOBP_POSITIVE_REGULATION_OF_HETEROTYPIC_CELL_CELL_ADHESION | 3.90e-07 | 90.00 | 20.43 | 1.33e-04 | 2.92e-03 | 4IL1B, TNF, IL10, CD44 |
16 |
| GOBP_REGULATION_OF_HETEROTYPIC_CELL_CELL_ADHESION | 5.00e-08 | 65.91 | 18.60 | 2.54e-05 | 3.74e-04 | 5IL1B, TNF, IL10, IL1RN, CD44 |
26 |
| GOBP_FEVER_GENERATION | 6.99e-06 | 112.93 | 18.36 | 1.09e-03 | 5.23e-02 | 3IL1B, TNF, PTGS2 |
10 |
| GOBP_POSITIVE_REGULATION_OF_HEAT_GENERATION | 6.99e-06 | 112.93 | 18.36 | 1.09e-03 | 5.23e-02 | 3IL1B, TNF, PTGS2 |
10 |
| GOBP_QUINOLINATE_METABOLIC_PROCESS | 1.54e-04 | 172.68 | 14.09 | 1.08e-02 | 1.00e+00 | 2KYNU, KMO |
5 |
| GOBP_MONOCYTE_AGGREGATION | 1.54e-04 | 172.68 | 14.09 | 1.08e-02 | 1.00e+00 | 2IL1B, CD44 |
5 |
| GOBP_HETEROTYPIC_CELL_CELL_ADHESION | 3.28e-09 | 38.30 | 13.91 | 2.45e-06 | 2.45e-05 | 7IL1B, TNF, IL10, IL1RN, CD44, ITGAX, SIRPA |
60 |
| GOBP_REGULATION_OF_HEAT_GENERATION | 1.65e-05 | 79.36 | 13.63 | 2.20e-03 | 1.23e-01 | 3IL1B, TNF, PTGS2 |
13 |
| GOBP_CELLULAR_RESPONSE_TO_MOLECULE_OF_BACTERIAL_ORIGIN | 3.61e-14 | 24.91 | 12.21 | 2.70e-10 | 2.70e-10 | 14IL1B, TNF, IL10, CXCL3, NFKBIA, CXCL2, TLR2, TNIP3, NFKB1, KMO, ICAM1, TNFAIP3, IRAK2, SIRPA |
209 |
| GOBP_NUCLEOTIDE_BINDING_OLIGOMERIZATION_DOMAIN_CONTAINING_1_SIGNALING_PATHWAY | 2.31e-04 | 129.66 | 11.45 | 1.45e-02 | 1.00e+00 | 2NFKBIA, TNFAIP3 |
6 |
| GOBP_LIPOPOLYSACCHARIDE_MEDIATED_SIGNALING_PATHWAY | 9.88e-08 | 32.73 | 10.92 | 4.35e-05 | 7.39e-04 | 6IL1B, TNF, NFKBIA, TLR2, TNFAIP3, IRAK2 |
58 |
| GOBP_CELLULAR_RESPONSE_TO_BIOTIC_STIMULUS | 1.59e-13 | 22.19 | 10.90 | 3.96e-10 | 1.19e-09 | 14IL1B, TNF, IL10, CXCL3, NFKBIA, CXCL2, TLR2, TNIP3, NFKB1, KMO, ICAM1, TNFAIP3, IRAK2, SIRPA |
233 |
| GOBP_HEAT_GENERATION | 3.20e-05 | 61.17 | 10.83 | 3.52e-03 | 2.40e-01 | 3IL1B, TNF, PTGS2 |
16 |
| GOBP_NAD_BIOSYNTHETIC_PROCESS | 4.88e-06 | 43.39 | 10.55 | 8.29e-04 | 3.65e-02 | 4KYNU, KMO, PTGS2, NAMPT |
29 |
| GOBP_REACTIVE_NITROGEN_SPECIES_METABOLIC_PROCESS | 2.11e-08 | 28.63 | 10.51 | 1.31e-05 | 1.58e-04 | 7IL1B, TNF, IL10, TLR2, ICAM1, PTGS2, SIRPA |
78 |
| GOBP_REGULATION_OF_NITRIC_OXIDE_METABOLIC_PROCESS | 1.34e-07 | 30.95 | 10.35 | 5.28e-05 | 1.00e-03 | 6IL1B, TNF, IL10, ICAM1, PTGS2, SIRPA |
61 |
| GOBP_REGULATION_OF_REACTIVE_OXYGEN_SPECIES_BIOSYNTHETIC_PROCESS | 4.33e-09 | 26.12 | 10.30 | 2.95e-06 | 3.24e-05 | 8IL1B, TNF, SOD2, IL10, ICAM1, PTGS2, CFLAR, SIRPA |
99 |
Dowload full table
Immunological Gene Sets:
| P-value | OR | Lower 95% CI | FDR | FWER | Genes Found | Gene Set Size | |
|---|---|---|---|---|---|---|---|
| GSE9988_ANTI_TREM1_VS_ANTI_TREM1_AND_LPS_MONOCYTE_DN | 1.22e-36 | 87.24 | 47.12 | 5.93e-33 | 5.93e-33 | 27IL1B, TNF, SOD2, IL10, PLEK, CXCL3, MIR155HG, ACSL1, PLAUR, TNFAIP2, NFKBIA, CXCL2, DRAM1, TNIP3, TRAF1, KMO, WTAP, IER3, ICAM1, TNFAIP8, EHD1, TNFAIP3, NINJ1, PTGS2, MFSD2A, IRAK2, CFLAR |
195 |
| GSE2706_UNSTIM_VS_2H_R848_DC_DN | 4.25e-31 | 68.33 | 36.71 | 1.04e-27 | 2.07e-27 | 24IL1B, PLEK, CXCL3, MIR155HG, ACSL1, PLAUR, TNFAIP2, NFKBIA, CXCL2, INSIG1, DRAM1, TRAF1, NFKB1, ICAM1, TNFAIP8, EHD1, TNFAIP3, NINJ1, PTGS2, MFSD2A, IRAK2, CFLAR, P2RX7, SERPINB9 |
193 |
| GSE2706_UNSTIM_VS_2H_LPS_DC_DN | 3.15e-29 | 62.18 | 33.38 | 4.89e-26 | 1.54e-25 | 23SOD2, IL10, CXCL3, MIR155HG, ACSL1, PLAUR, TNFAIP2, NFKBIA, CXCL2, INSIG1, TNIP3, TRAF1, NFKB1, ICAM1, TNFAIP8, EHD1, TNFAIP3, NINJ1, MFSD2A, NAMPT, IRAK2, CFLAR, P2RX7 |
194 |
| GSE9988_LOW_LPS_VS_VEHICLE_TREATED_MONOCYTE_UP | 4.02e-29 | 61.48 | 32.96 | 4.89e-26 | 1.96e-25 | 23IL1B, TNF, SOD2, IL10, PLEK, CXCL3, MIR155HG, ACSL1, PLAUR, FNIP2, TNFAIP2, NFKBIA, CXCL2, DRAM1, TNIP3, NFKB1, EREG, IER3, ICAM1, TNFAIP3, PTGS2, MFSD2A, CFLAR |
196 |
| GSE9988_LPS_VS_VEHICLE_TREATED_MONOCYTE_UP | 2.38e-27 | 56.46 | 30.10 | 2.32e-24 | 1.16e-23 | 22IL1B, TNF, SOD2, IL10, PLEK, CXCL3, MIR155HG, ACSL1, PLAUR, FNIP2, TNFAIP2, NFKBIA, CXCL2, DRAM1, TNIP3, NFKB1, IER3, ICAM1, TNFAIP3, PTGS2, MFSD2A, CFLAR |
196 |
| GSE9988_ANTI_TREM1_VS_LOW_LPS_MONOCYTE_DN | 2.99e-27 | 55.77 | 29.76 | 2.43e-24 | 1.46e-23 | 22IL1B, TNF, SOD2, IL10, CXCL3, MIR155HG, ACSL1, TNFAIP2, NFKBIA, CXCL2, DRAM1, TNIP3, TRAF1, NFKB1, IER3, ICAM1, TNFAIP8, EHD1, TNFAIP3, PTGS2, IRAK2, CFLAR |
198 |
| GSE9988_LOW_LPS_VS_CTRL_TREATED_MONOCYTE_UP | 1.29e-25 | 51.66 | 27.43 | 9.00e-23 | 6.30e-22 | 21IL1B, TNF, SOD2, IL10, PLEK, CXCL3, MIR155HG, ACSL1, PLAUR, NFKBIA, CXCL2, TNIP3, NFKB1, WTAP, EREG, IER3, ICAM1, TNFAIP3, PTGS2, MFSD2A, CFLAR |
196 |
| GSE9988_ANTI_TREM1_VS_LPS_MONOCYTE_DN | 1.61e-25 | 51.06 | 27.16 | 9.78e-23 | 7.83e-22 | 21IL1B, TNF, SOD2, IL10, ACSL1, TNFAIP2, NFKBIA, CXCL2, DRAM1, TNIP3, TRAF1, NFKB1, IER3, ICAM1, TNFAIP8, EHD1, TNFAIP3, PTGS2, NAMPT, IRAK2, CFLAR |
198 |
| GSE2706_UNSTIM_VS_2H_LPS_AND_R848_DC_DN | 3.82e-24 | 48.77 | 25.66 | 2.07e-21 | 1.86e-20 | 20CXCL3, MIR155HG, ACSL1, PLAUR, TNFAIP2, NFKBIA, CXCL2, INSIG1, DRAM1, TRAF1, NFKB1, ICAM1, TNFAIP8, EHD1, TNFAIP3, PTGS2, MFSD2A, NAMPT, CFLAR, P2RX7 |
191 |
| GSE9988_LPS_VS_CTRL_TREATED_MONOCYTE_UP | 6.45e-24 | 47.33 | 24.95 | 3.14e-21 | 3.14e-20 | 20IL1B, TNF, SOD2, IL10, PLEK, CXCL3, MIR155HG, ACSL1, PLAUR, NFKBIA, CXCL2, DRAM1, TNIP3, WTAP, IER3, ICAM1, TNFAIP3, PTGS2, MFSD2A, CFLAR |
196 |
| GSE41176_UNSTIM_VS_ANTI_IGM_STIM_BCELL_1H_UP | 7.15e-24 | 47.06 | 24.81 | 3.17e-21 | 3.48e-20 | 20IL1B, SOD2, AMPD3, CXCL3, ACSL1, PLAUR, NFKBIA, CXCL2, TLR2, TNIP3, TRAF1, NFKB1, WTAP, IER3, ICAM1, TNFAIP8, EHD1, NINJ1, PTGS2, NAMPT |
197 |
| GSE41176_UNSTIM_VS_ANTI_IGM_STIM_BCELL_3H_UP | 8.78e-24 | 46.53 | 24.55 | 3.56e-21 | 4.28e-20 | 20IL1B, TNF, SOD2, IL10, AMPD3, CXCL3, ACSL1, PLAUR, CXCL2, TNIP3, TRAF1, WTAP, EREG, IER3, EHD1, TNFAIP3, NINJ1, PTGS2, NAMPT, CFLAR |
199 |
| GSE8515_CTRL_VS_IL1_4H_STIM_MAC_DN | 1.35e-20 | 39.26 | 20.35 | 5.07e-18 | 6.59e-17 | 18TNF, PLEK, AMPD3, CXCL3, ACSL1, TNFAIP2, NFKBIA, CXCL2, TNIP3, TRAF1, NFKB1, WTAP, IER3, ICAM1, EHD1, TNFAIP3, LCP2, P2RX7 |
197 |
| GSE8515_IL1_VS_IL6_4H_STIM_MAC_UP | 1.78e-20 | 38.62 | 20.01 | 5.77e-18 | 8.66e-17 | 18IL1B, TNF, PLEK, AMPD3, CXCL3, ACSL1, NFKBIA, CXCL2, TRAF1, NFKB1, WTAP, IER3, ICAM1, EHD1, TNFAIP3, PTGS2, P2RX7, SERPINB9 |
200 |
| GSE32986_CURDLAN_HIGHDOSE_VS_GMCSF_AND_CURDLAN_HIGHDOSE_STIM_DC_DN | 1.78e-20 | 38.62 | 20.01 | 5.77e-18 | 8.66e-17 | 18IL1B, TNF, SOD2, CXCL3, TNFAIP2, NFKBIA, TLR2, TRAF1, NFKB1, ICAM1, EHD1, TNFAIP3, PTGS2, PSTPIP2, LCP2, IRAK2, CFLAR, SERPINB9 |
200 |
| GSE21360_SECONDARY_VS_QUATERNARY_MEMORY_CD8_TCELL_UP | 1.33e-19 | 39.01 | 19.95 | 4.06e-17 | 6.49e-16 | 17IL1B, TNF, SOD2, IL10, PLEK, AMPD3, CXCL3, TNFAIP2, NFKBIA, CXCL2, IL1RN, TNIP3, NFKB1, TNFAIP3, PTGS2, BASP1, CFLAR |
182 |
| GSE30971_CTRL_VS_LPS_STIM_MACROPHAGE_WBP7_HET_2H_UP | 4.32e-19 | 36.16 | 18.54 | 1.24e-16 | 2.11e-15 | 17IL1B, TNF, SOD2, AMPD3, MIR155HG, ACSL1, PLAUR, NFKBIA, CXCL2, CTSL, TNIP3, NFKB1, WTAP, IER3, EHD1, PTGS2, MFSD2A |
195 |
| GSE22886_DAY1_VS_DAY7_MONOCYTE_IN_CULTURE_UP | 5.60e-19 | 35.56 | 18.24 | 1.52e-16 | 2.73e-15 | 17SOD2, IL10, NFKBIA, TNIP3, TRAF1, IER3, ICAM1, TNFAIP8, EHD1, TNFAIP3, NINJ1, PTGS2, NAMPT, LCP2, BASP1, CFLAR, SERPINB9 |
198 |
| GSE36888_UNTREATED_VS_IL2_TREATED_STAT5_AB_KNOCKIN_TCELL_2H_UP | 6.65e-19 | 35.18 | 18.04 | 1.70e-16 | 3.24e-15 | 17IL1B, TNF, SOD2, AMPD3, CXCL3, PLAUR, CXCL2, TLR2, KYNU, TNIP3, TRAF1, ICAM1, TNFAIP8, TNFAIP3, PSTPIP2, MFSD2A, IRAK2 |
200 |
| GSE9988_ANTI_TREM1_AND_LPS_VS_VEHICLE_TREATED_MONOCYTES_UP | 1.52e-17 | 32.84 | 16.61 | 3.69e-15 | 7.38e-14 | 16IL1B, TNF, IL10, PLEK, CXCL3, MIR155HG, PLAUR, FNIP2, CXCL2, INSIG1, CTSL, TNIP3, IER3, PTGS2, MFSD2A, CFLAR |
195 |
Top Ranked Transcription Factors for this Gene Expression Program:
| Gene Symbol | TF Rank | DNA Binding Domain | Motif Status | IUPAC PWM | GTEx | DepMap | Decartes |
|---|---|---|---|---|---|---|---|
| IL1B | 1 | No | Unlikely to be sequence specific TF | Not a DNA binding protein | No motif | None | None |
| TNF | 2 | No | Unlikely to be sequence specific TF | Not a DNA binding protein | No motif | None | The protein is a secreted cytokine and operates far upstream in the signaling cascade |
| IL10 | 4 | No | Unlikely to be sequence specific TF | Not a DNA binding protein | No motif | None | None |
| PLEK | 5 | No | Unlikely to be sequence specific TF | Not a DNA binding protein | No motif | None | The DEP-domain is a winged helix-turn-helix protein domain, and thus it is related to ETS, RFX, and FOX domains. However, there is no evidence for DNA-binding activity and it has been shown to operate in G-protein signalling upstream of TFs |
| NFKBIA | 14 | No | Unlikely to be sequence specific TF | Not a DNA binding protein | No motif | None | This is I kappa B alpha, which interacts with NFkappaB. No DBD, and evidence indicates that it is not a TF. |
| TLR2 | 17 | No | Unlikely to be sequence specific TF | Not a DNA binding protein | No motif | None | Upstream of NFKB and not involved in DNA-binding |
| TRAF1 | 24 | No | Unlikely to be sequence specific TF | Not a DNA binding protein | No motif | None | TRAF1 is an NF-kappaB interactor (PMID: 10692572), and is unlikely to have DNA-binding activity |
| NFKB1 | 26 | Yes | Known motif | Monomer or homomultimer | High-throughput in vitro | None | None |
| ICAM1 | 31 | No | Unlikely to be sequence specific TF | Not a DNA binding protein | No motif | None | None |
| TNFAIP3 | 34 | No | Unlikely to be sequence specific TF | Not a DNA binding protein | No motif | None | Inhibits NFKB-activation. No evidence for direct binding to DNA |
| CREG1 | 39 | No | Unlikely to be sequence specific TF | Not a DNA binding protein | No motif | None | Regulates transcription in tethering assays (PMID: 9710587). Unlikely to be a TF, based on the lack of a canonical DBD |
| IRAK2 | 46 | No | Unlikely to be sequence specific TF | Not a DNA binding protein | No motif | None | None |
| CFLAR | 47 | No | Unlikely to be sequence specific TF | Not a DNA binding protein | No motif | None | None |
| HCK | 75 | No | Unlikely to be sequence specific TF | Not a DNA binding protein | No motif | None | Inhibits TP73-mediated transcription activation (PMID: 17535448) |
| ETS2 | 80 | Yes | Known motif | Monomer or homomultimer | High-throughput in vitro | None | None |
| HIF1A | 84 | Yes | Known motif | Obligate heteromer | In vivo/Misc source | Only known motifs are from Transfac or HocoMoco - origin is uncertain | Binds as obligate heteromer with ARNT (PMID: 9027737). |
| NFKB2 | 101 | Yes | Known motif | Monomer or homomultimer | High-throughput in vitro | None | None |
| CD40 | 103 | No | Unlikely to be sequence specific TF | Not a DNA binding protein | No motif | None | Cell surface receptor of TNF-family |
| KLF6 | 106 | Yes | Known motif | Monomer or homomultimer | High-throughput in vitro | None | None |
| NOTCH2 | 109 | No | Unlikely to be sequence specific TF | Not a DNA binding protein | No motif | None | Transmembrane receptor protein that operates far upstream in the signaling cascade |
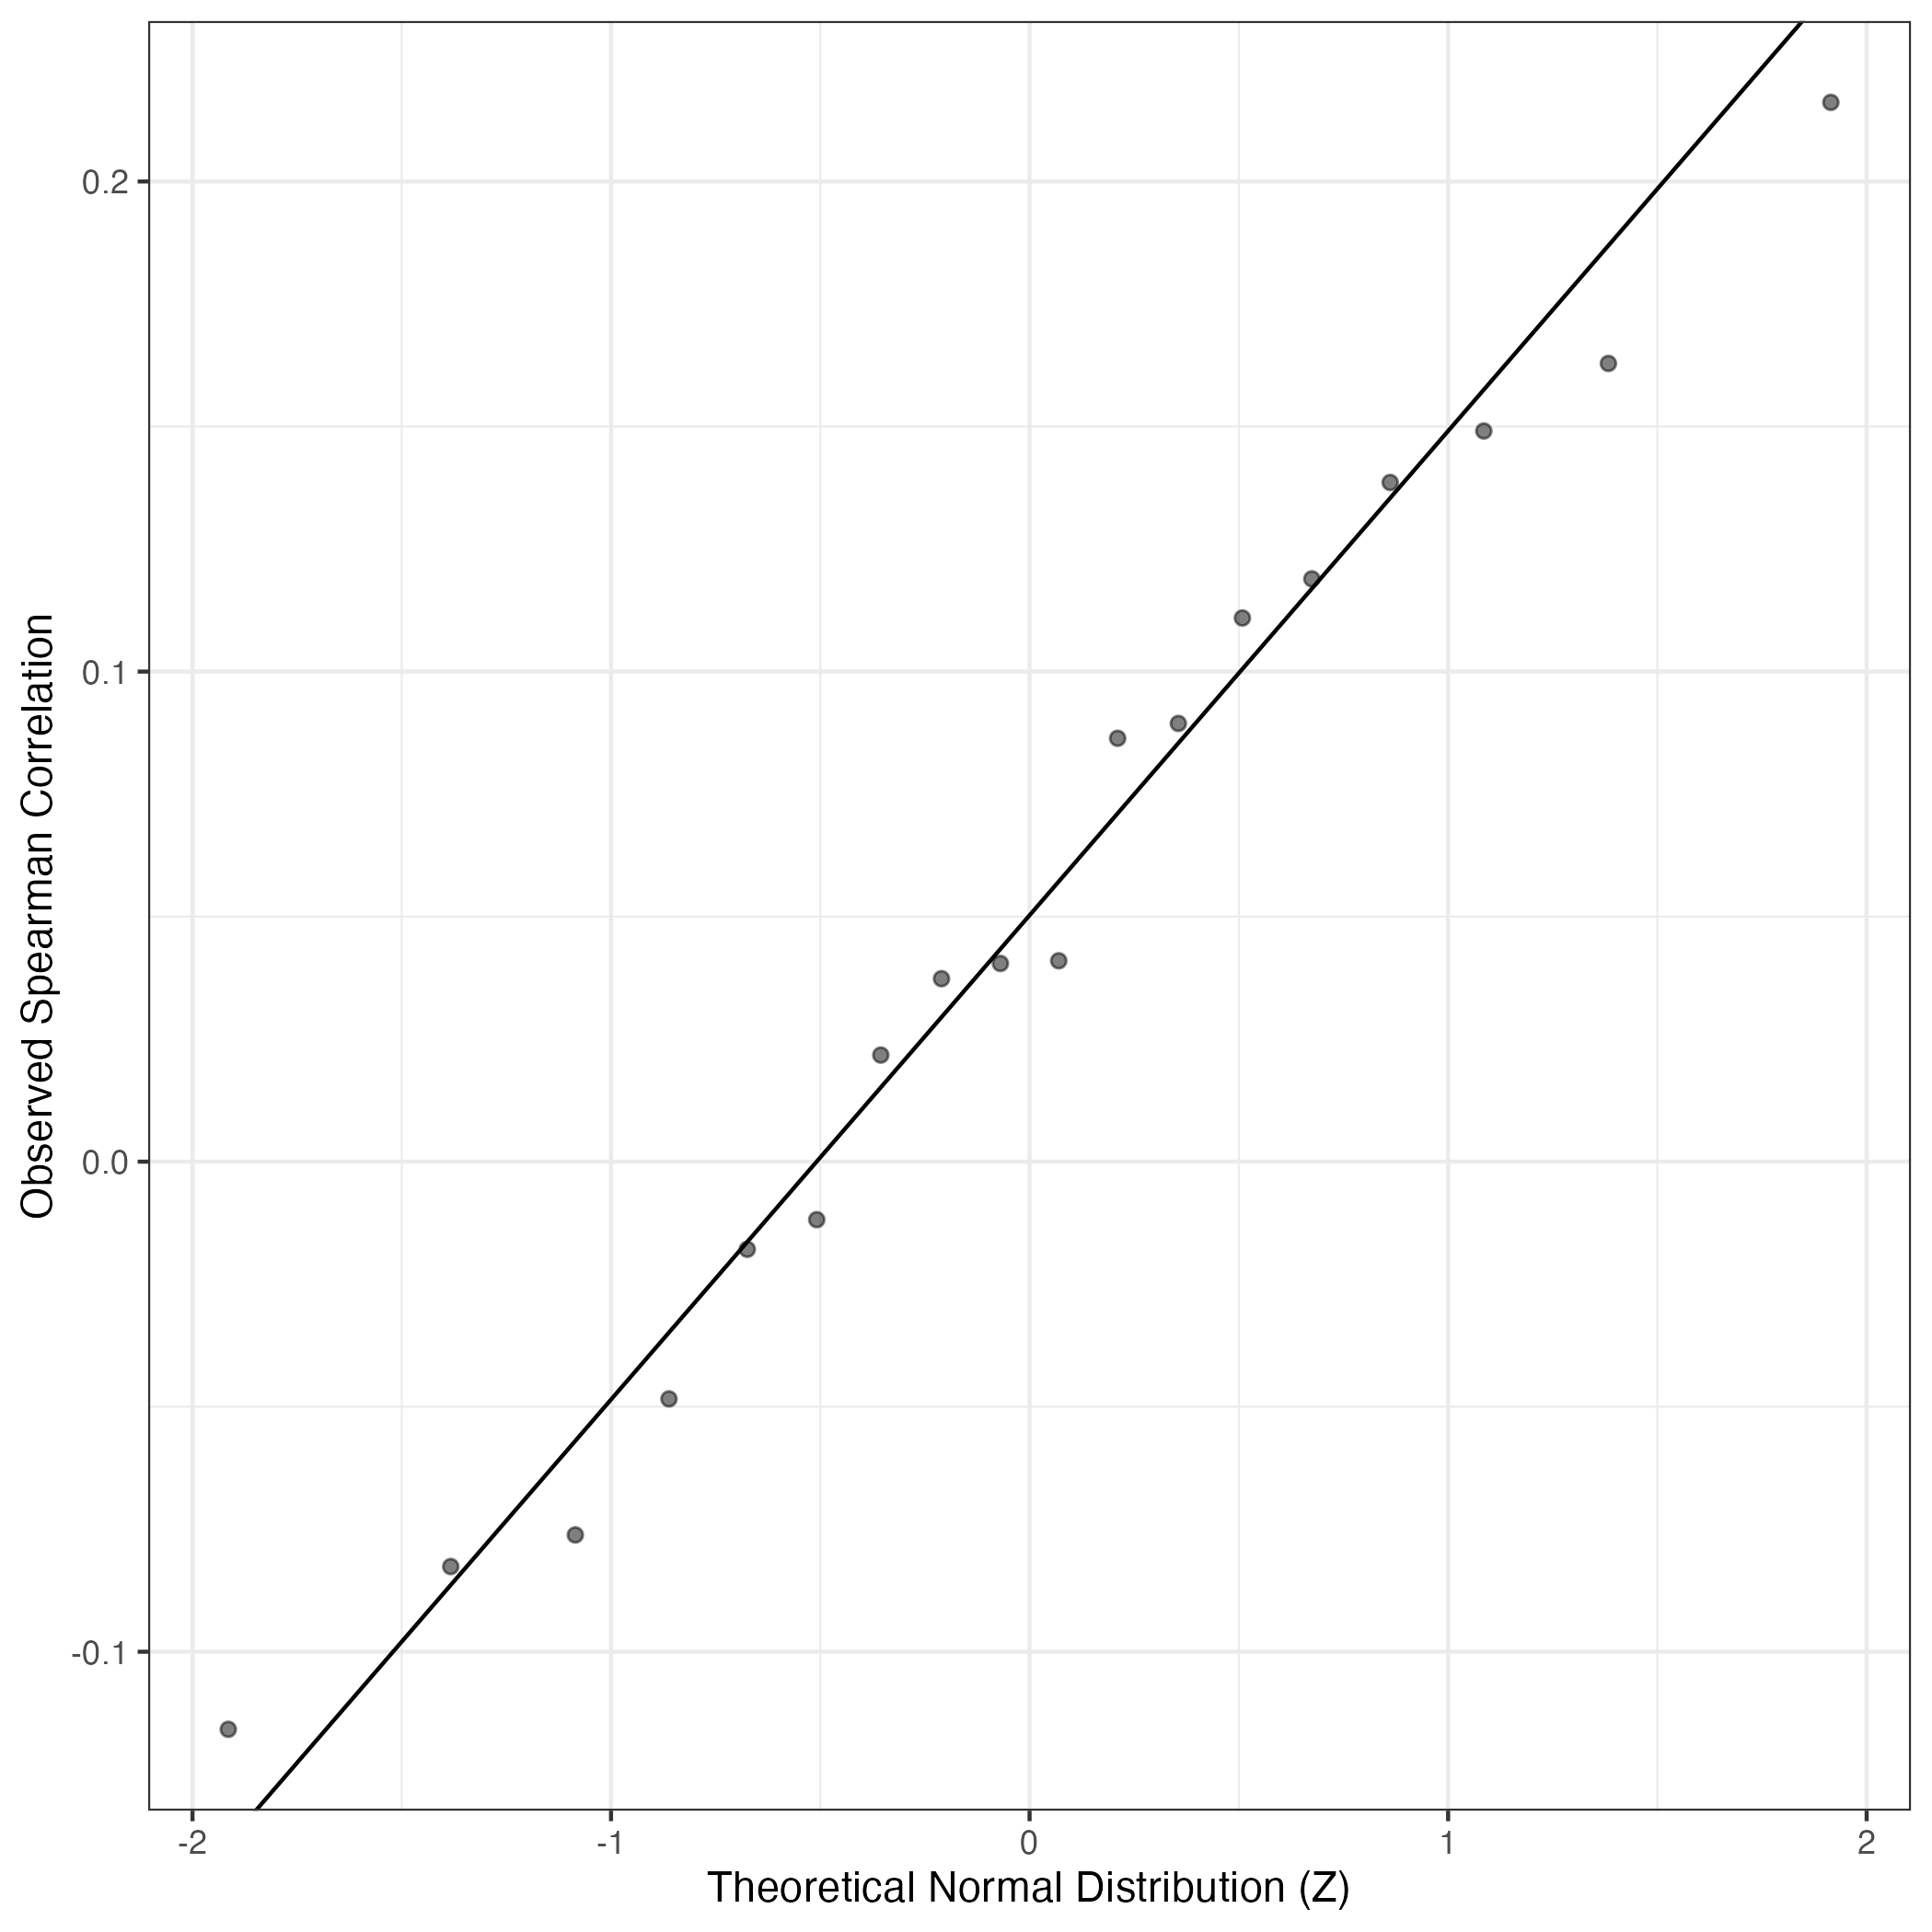
QQ Plot showing correlations with other GEPs in this dataset, calculated by Spearman correlation:
Interactive QQ-plot of gene loadings:
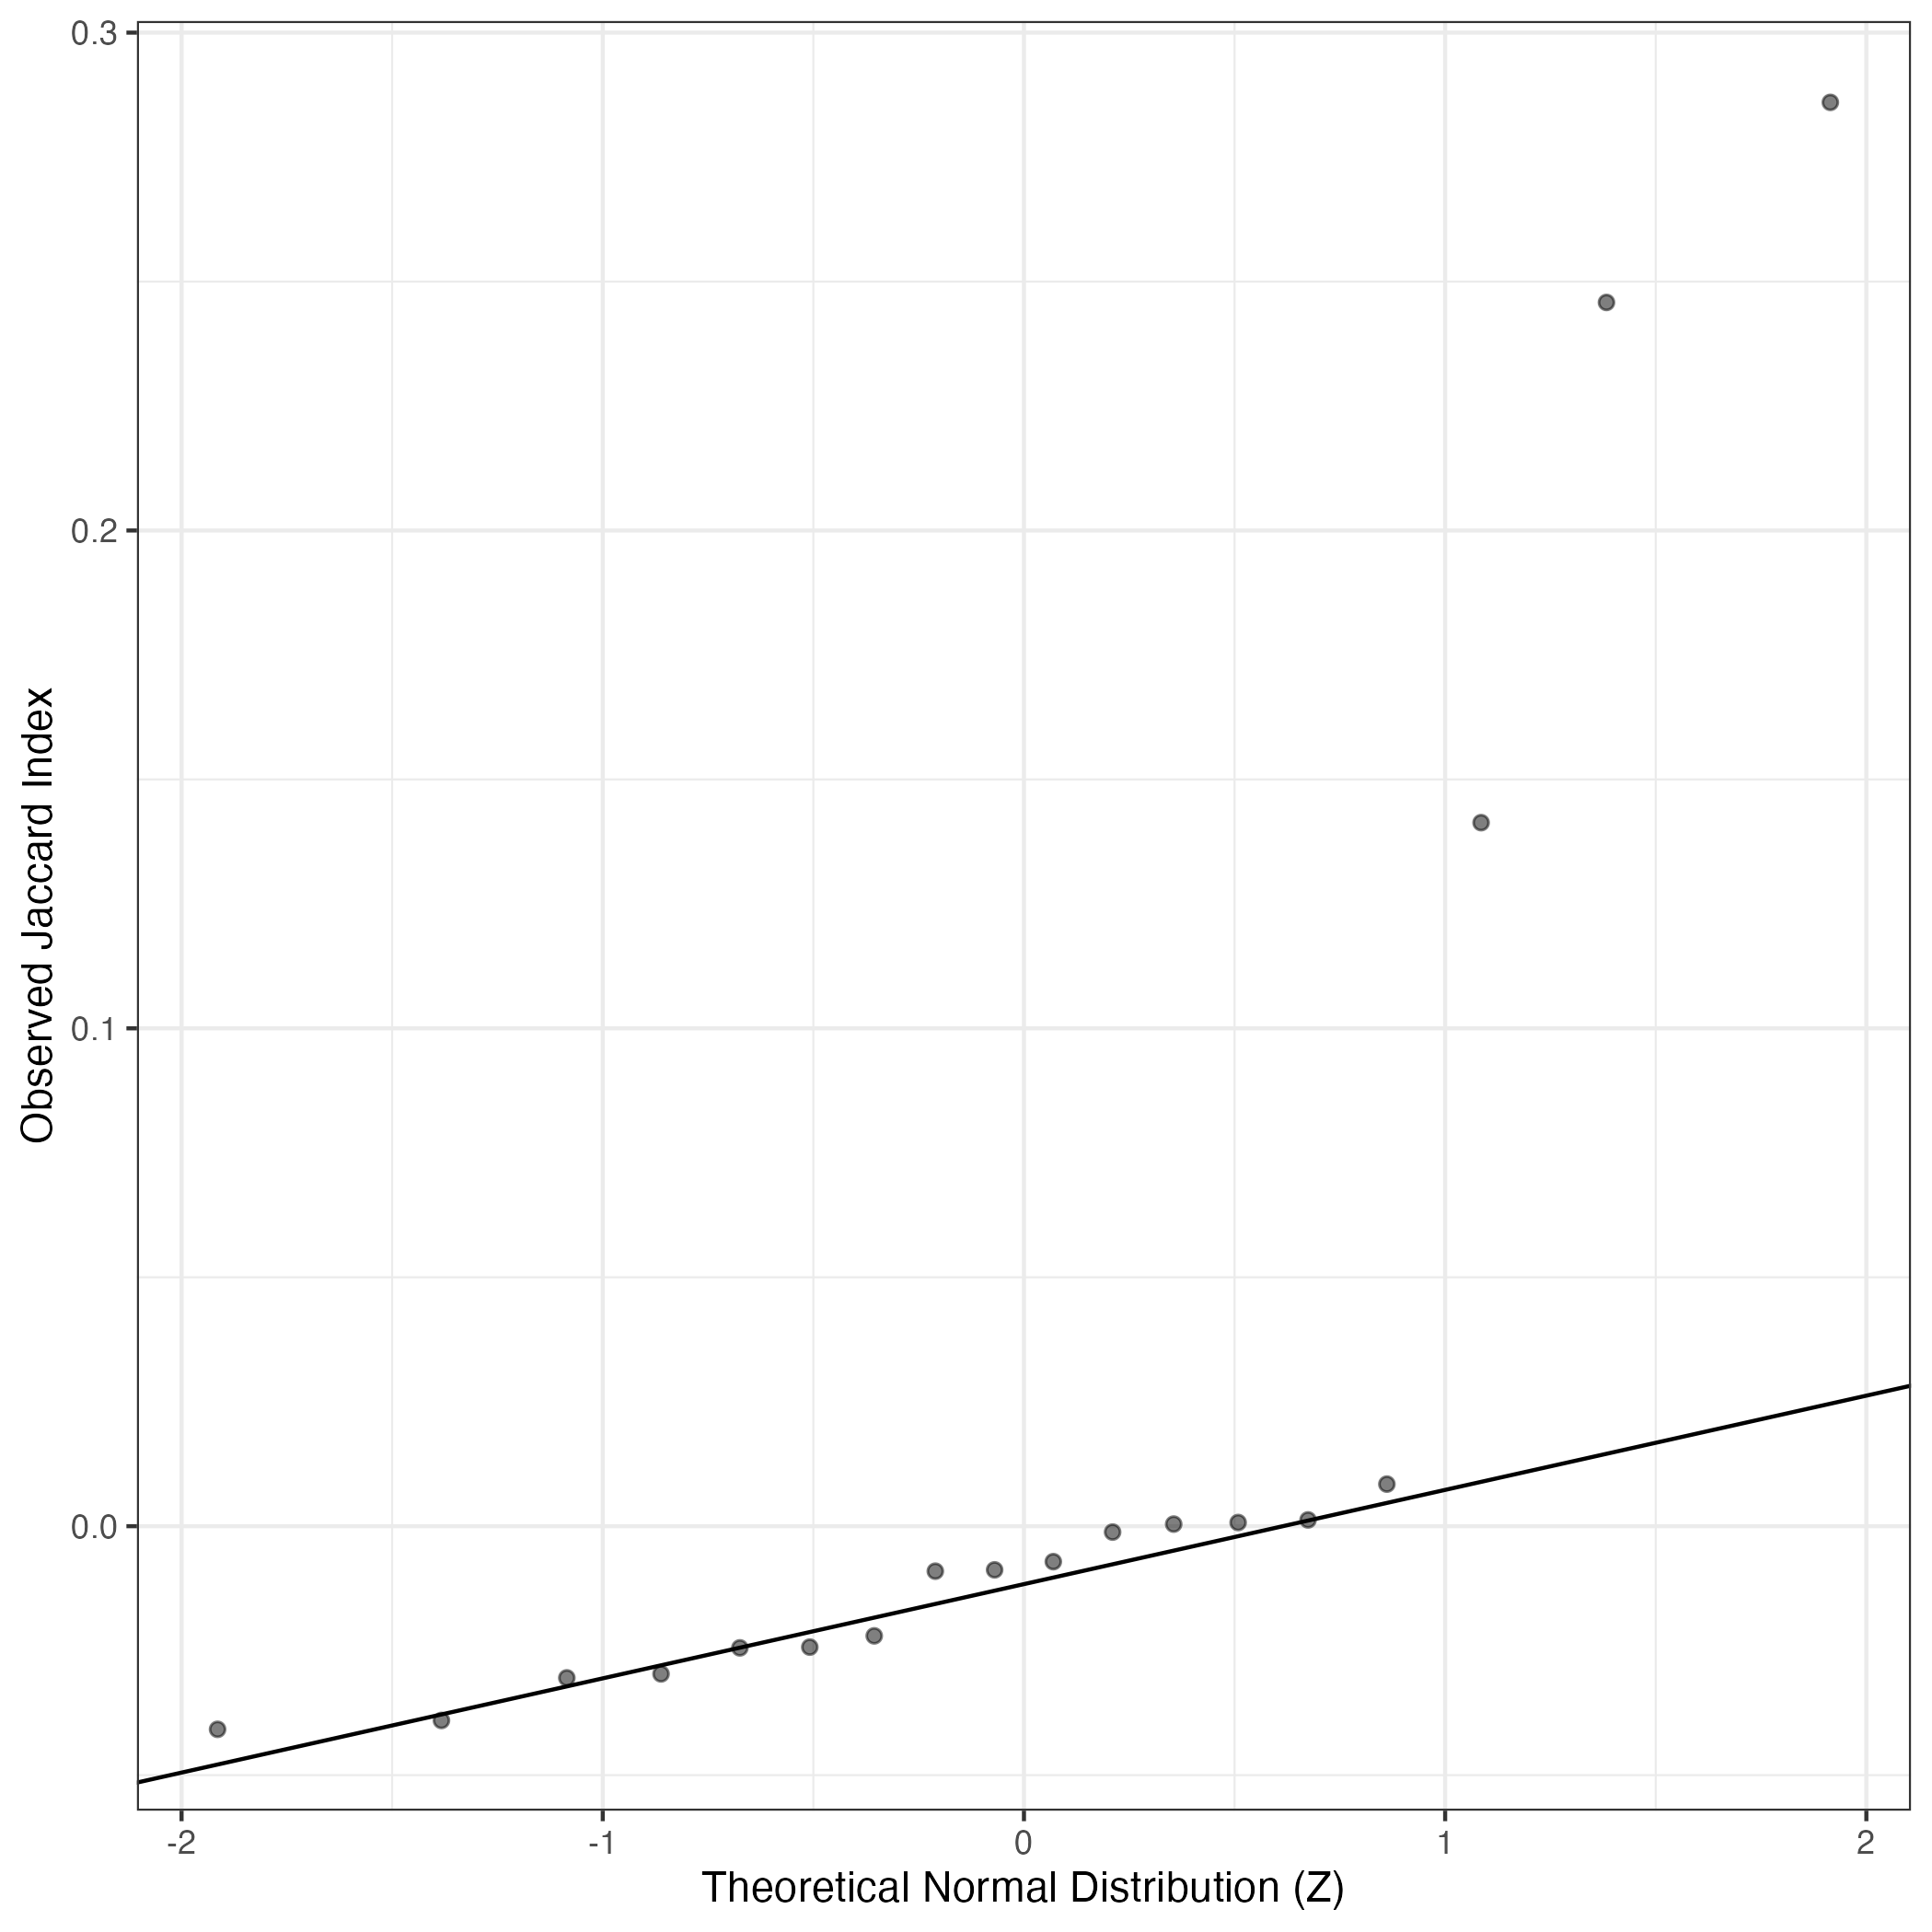
A similar QQ-plot as above, but only for instances where the H value is e.g. > 25, i.e. we are confident that the expression program is active above noise. Agreemenet between these binary vectors is tested using the Jaccard Index, with the P-values calculated by an exact test:
Interactive QQ-plot:
Singler cell type annotations for the top 50 cells on this program.
| Cell ID | Singler label | Singler Delta | Activity Score | Top Singler Raw Scores |
|---|---|---|---|---|
| TM37-F12 | DC:monocyte-derived:antiCD40/VAF347 | 0.17 | 1277.10 | Raw ScoresMacrophage:monocyte-derived:M-CSF/Pam3Cys: 0.45, DC:monocyte-derived:antiCD40/VAF347: 0.44, Macrophage:monocyte-derived:M-CSF/IFNg/Pam3Cys: 0.43, Monocyte:S._typhimurium_flagellin: 0.43, DC:monocyte-derived:A._fumigatus_germ_tubes_6h: 0.43, Macrophage:monocyte-derived:S._aureus: 0.42, DC:monocyte-derived:CD40L: 0.42, Macrophage:Alveolar:B._anthacis_spores: 0.42, DC:monocyte-derived:LPS: 0.42, DC:monocyte-derived:Schuler_treatment: 0.42 |
| WK032-H13 | Macrophage:monocyte-derived:M-CSF/Pam3Cys | 0.20 | 920.65 | Raw ScoresMacrophage:monocyte-derived:M-CSF/Pam3Cys: 0.54, Macrophage:monocyte-derived:M-CSF/IFNg/Pam3Cys: 0.52, DC:monocyte-derived:antiCD40/VAF347: 0.52, Macrophage:monocyte-derived:S._aureus: 0.51, DC:monocyte-derived:A._fumigatus_germ_tubes_6h: 0.5, DC:monocyte-derived:LPS: 0.5, DC:monocyte-derived:Galectin-1: 0.5, Monocyte:S._typhimurium_flagellin: 0.5, Macrophage:monocyte-derived:IFNa: 0.5, DC:monocyte-derived:CD40L: 0.49 |
| TM36-N15 | Macrophage:monocyte-derived:M-CSF/Pam3Cys | 0.22 | 785.39 | Raw ScoresMacrophage:monocyte-derived:M-CSF/Pam3Cys: 0.47, Monocyte:S._typhimurium_flagellin: 0.47, Macrophage:monocyte-derived:M-CSF/IFNg/Pam3Cys: 0.47, Monocyte:F._tularensis_novicida: 0.46, DC:monocyte-derived:antiCD40/VAF347: 0.46, Macrophage:monocyte-derived:S._aureus: 0.44, DC:monocyte-derived:A._fumigatus_germ_tubes_6h: 0.44, DC:monocyte-derived:Galectin-1: 0.44, DC:monocyte-derived:LPS: 0.44, DC:monocyte-derived:Schuler_treatment: 0.43 |
| WK032-J1 | Macrophage:monocyte-derived:M-CSF/Pam3Cys | 0.21 | 751.65 | Raw ScoresMacrophage:monocyte-derived:M-CSF/Pam3Cys: 0.51, DC:monocyte-derived:antiCD40/VAF347: 0.5, Macrophage:monocyte-derived:M-CSF/IFNg/Pam3Cys: 0.49, DC:monocyte-derived:A._fumigatus_germ_tubes_6h: 0.49, Monocyte:S._typhimurium_flagellin: 0.49, DC:monocyte-derived:Schuler_treatment: 0.48, DC:monocyte-derived:LPS: 0.48, Macrophage:monocyte-derived:S._aureus: 0.48, DC:monocyte-derived:Galectin-1: 0.47, DC:monocyte-derived:CD40L: 0.47 |
| WMK004-J12 | Macrophage:monocyte-derived:S._aureus | 0.16 | 722.45 | Raw ScoresMonocyte:S._typhimurium_flagellin: 0.44, DC:monocyte-derived:antiCD40/VAF347: 0.44, Macrophage:monocyte-derived:M-CSF/Pam3Cys: 0.44, Macrophage:monocyte-derived:M-CSF/IFNg/Pam3Cys: 0.43, DC:monocyte-derived:A._fumigatus_germ_tubes_6h: 0.43, Macrophage:monocyte-derived:S._aureus: 0.43, DC:monocyte-derived:LPS: 0.42, DC:monocyte-derived:Galectin-1: 0.42, DC:monocyte-derived:Schuler_treatment: 0.42, Monocyte:F._tularensis_novicida: 0.41 |
| WK014-J11 | DC:monocyte-derived:antiCD40/VAF347 | 0.21 | 682.81 | Raw ScoresMacrophage:monocyte-derived:M-CSF/Pam3Cys: 0.5, DC:monocyte-derived:antiCD40/VAF347: 0.5, DC:monocyte-derived:A._fumigatus_germ_tubes_6h: 0.5, Macrophage:monocyte-derived:M-CSF/IFNg/Pam3Cys: 0.49, DC:monocyte-derived:Galectin-1: 0.49, Macrophage:monocyte-derived:S._aureus: 0.49, DC:monocyte-derived:LPS: 0.49, DC:monocyte-derived:Schuler_treatment: 0.48, DC:monocyte-derived:CD40L: 0.48, Macrophage:Alveolar:B._anthacis_spores: 0.48 |
| WK067-P10 | DC:monocyte-derived:antiCD40/VAF347 | 0.18 | 670.33 | Raw ScoresDC:monocyte-derived:antiCD40/VAF347: 0.45, DC:monocyte-derived:A._fumigatus_germ_tubes_6h: 0.45, Macrophage:monocyte-derived:M-CSF/Pam3Cys: 0.45, Macrophage:monocyte-derived:M-CSF/IFNg/Pam3Cys: 0.45, Monocyte:S._typhimurium_flagellin: 0.44, Macrophage:monocyte-derived:S._aureus: 0.44, DC:monocyte-derived:Schuler_treatment: 0.43, DC:monocyte-derived:LPS: 0.43, DC:monocyte-derived:Galectin-1: 0.43, DC:monocyte-derived:CD40L: 0.43 |
| WK012-C9 | Macrophage:monocyte-derived:M-CSF/Pam3Cys | 0.19 | 636.99 | Raw ScoresDC:monocyte-derived:antiCD40/VAF347: 0.46, DC:monocyte-derived:A._fumigatus_germ_tubes_6h: 0.46, Macrophage:monocyte-derived:M-CSF/Pam3Cys: 0.46, Monocyte:S._typhimurium_flagellin: 0.45, DC:monocyte-derived:anti-DC-SIGN_2h: 0.44, Macrophage:monocyte-derived:S._aureus: 0.44, Macrophage:monocyte-derived:M-CSF/IFNg/Pam3Cys: 0.44, Macrophage:monocyte-derived:M-CSF: 0.44, Monocyte:anti-FcgRIIB: 0.43, DC:monocyte-derived:Galectin-1: 0.43 |
| WK073-P9 | Macrophage:monocyte-derived:M-CSF | 0.16 | 622.49 | Raw ScoresDC:monocyte-derived:A._fumigatus_germ_tubes_6h: 0.43, Macrophage:monocyte-derived:M-CSF/IFNg/Pam3Cys: 0.43, Macrophage:monocyte-derived:M-CSF: 0.43, Macrophage:monocyte-derived:M-CSF/Pam3Cys: 0.43, DC:monocyte-derived:antiCD40/VAF347: 0.43, Macrophage:monocyte-derived:IL-4/Dex/TGFb: 0.42, Monocyte:anti-FcgRIIB: 0.42, DC:monocyte-derived:anti-DC-SIGN_2h: 0.42, Macrophage:monocyte-derived:IL-4/Dex/cntrl: 0.42, Monocyte:S._typhimurium_flagellin: 0.42 |
| TM37-H12 | Monocyte:S._typhimurium_flagellin | 0.20 | 605.88 | Raw ScoresMonocyte:S._typhimurium_flagellin: 0.41, Macrophage:monocyte-derived:M-CSF/Pam3Cys: 0.41, Macrophage:monocyte-derived:M-CSF/IFNg/Pam3Cys: 0.4, DC:monocyte-derived:antiCD40/VAF347: 0.39, Monocyte:F._tularensis_novicida: 0.38, Macrophage:Alveolar:B._anthacis_spores: 0.37, Macrophage:monocyte-derived:S._aureus: 0.37, DC:monocyte-derived:A._fumigatus_germ_tubes_6h: 0.37, Monocyte:anti-FcgRIIB: 0.37, DC:monocyte-derived:LPS: 0.37 |
| TM37-D13 | Monocyte:S._typhimurium_flagellin | 0.20 | 581.72 | Raw ScoresMonocyte:S._typhimurium_flagellin: 0.45, Macrophage:monocyte-derived:M-CSF/Pam3Cys: 0.43, DC:monocyte-derived:antiCD40/VAF347: 0.42, Macrophage:monocyte-derived:M-CSF/IFNg/Pam3Cys: 0.42, DC:monocyte-derived:A._fumigatus_germ_tubes_6h: 0.42, Monocyte:F._tularensis_novicida: 0.41, Macrophage:Alveolar:B._anthacis_spores: 0.41, Macrophage:monocyte-derived:S._aureus: 0.4, Monocyte:anti-FcgRIIB: 0.4, DC:monocyte-derived:Schuler_treatment: 0.4 |
| WK050-H16 | Monocyte:S._typhimurium_flagellin | 0.18 | 565.51 | Raw ScoresMonocyte:S._typhimurium_flagellin: 0.41, Macrophage:monocyte-derived:M-CSF/Pam3Cys: 0.41, DC:monocyte-derived:A._fumigatus_germ_tubes_6h: 0.41, DC:monocyte-derived:antiCD40/VAF347: 0.4, Macrophage:monocyte-derived:M-CSF/IFNg/Pam3Cys: 0.39, Monocyte:F._tularensis_novicida: 0.39, DC:monocyte-derived:LPS: 0.39, DC:monocyte-derived:Schuler_treatment: 0.38, DC:monocyte-derived:CD40L: 0.38, Macrophage:monocyte-derived:S._aureus: 0.38 |
| WK100-M5 | DC:monocyte-derived:antiCD40/VAF347 | 0.18 | 549.56 | Raw ScoresMacrophage:monocyte-derived:S._aureus: 0.49, Macrophage:monocyte-derived:M-CSF/IFNg/Pam3Cys: 0.49, Macrophage:monocyte-derived:M-CSF/Pam3Cys: 0.48, DC:monocyte-derived:antiCD40/VAF347: 0.48, Macrophage:monocyte-derived:IFNa: 0.48, DC:monocyte-derived:LPS: 0.48, DC:monocyte-derived:A._fumigatus_germ_tubes_6h: 0.48, DC:monocyte-derived:Galectin-1: 0.48, DC:monocyte-derived:CD40L: 0.47, DC:monocyte-derived:Poly(IC): 0.47 |
| WK014-D7 | DC:monocyte-derived:antiCD40/VAF347 | 0.18 | 514.49 | Raw ScoresMonocyte:S._typhimurium_flagellin: 0.41, DC:monocyte-derived:antiCD40/VAF347: 0.41, Macrophage:monocyte-derived:M-CSF/Pam3Cys: 0.41, DC:monocyte-derived:A._fumigatus_germ_tubes_6h: 0.4, Macrophage:monocyte-derived:M-CSF/IFNg/Pam3Cys: 0.39, Macrophage:monocyte-derived:S._aureus: 0.39, DC:monocyte-derived:LPS: 0.38, DC:monocyte-derived:Schuler_treatment: 0.38, Macrophage:Alveolar:B._anthacis_spores: 0.38, Monocyte:anti-FcgRIIB: 0.37 |
| TM38-B12 | Monocyte:S._typhimurium_flagellin | 0.20 | 507.23 | Raw ScoresMonocyte:S._typhimurium_flagellin: 0.4, Macrophage:monocyte-derived:M-CSF/Pam3Cys: 0.39, Monocyte:F._tularensis_novicida: 0.38, Macrophage:monocyte-derived:M-CSF/IFNg/Pam3Cys: 0.38, DC:monocyte-derived:antiCD40/VAF347: 0.38, DC:monocyte-derived:A._fumigatus_germ_tubes_6h: 0.36, Macrophage:monocyte-derived:S._aureus: 0.36, Macrophage:Alveolar:B._anthacis_spores: 0.35, DC:monocyte-derived:LPS: 0.35, Monocyte:anti-FcgRIIB: 0.35 |
| WK012-P5 | DC:monocyte-derived:antiCD40/VAF347 | 0.15 | 498.59 | Raw ScoresDC:monocyte-derived:antiCD40/VAF347: 0.41, Macrophage:monocyte-derived:M-CSF/Pam3Cys: 0.41, DC:monocyte-derived:A._fumigatus_germ_tubes_6h: 0.41, Macrophage:monocyte-derived:M-CSF/IFNg/Pam3Cys: 0.39, Monocyte:S._typhimurium_flagellin: 0.39, Macrophage:monocyte-derived:S._aureus: 0.39, Monocyte:anti-FcgRIIB: 0.38, DC:monocyte-derived:Galectin-1: 0.38, Macrophage:Alveolar:B._anthacis_spores: 0.38, DC:monocyte-derived:CD40L: 0.38 |
| WK073-D7 | Macrophage:monocyte-derived:M-CSF/IFNg/Pam3Cys | 0.21 | 473.78 | Raw ScoresMacrophage:monocyte-derived:M-CSF/IFNg/Pam3Cys: 0.47, Macrophage:monocyte-derived:M-CSF/Pam3Cys: 0.47, Monocyte:S._typhimurium_flagellin: 0.46, DC:monocyte-derived:antiCD40/VAF347: 0.45, DC:monocyte-derived:LPS: 0.45, Monocyte:F._tularensis_novicida: 0.45, Macrophage:monocyte-derived:S._aureus: 0.44, DC:monocyte-derived:mature: 0.44, DC:monocyte-derived:Galectin-1: 0.44, DC:monocyte-derived:A._fumigatus_germ_tubes_6h: 0.44 |
| WK014-D13 | DC:monocyte-derived:antiCD40/VAF347 | 0.18 | 452.52 | Raw ScoresDC:monocyte-derived:antiCD40/VAF347: 0.46, DC:monocyte-derived:A._fumigatus_germ_tubes_6h: 0.45, Macrophage:monocyte-derived:M-CSF/Pam3Cys: 0.45, Macrophage:monocyte-derived:M-CSF/IFNg/Pam3Cys: 0.44, Monocyte:S._typhimurium_flagellin: 0.44, Macrophage:monocyte-derived:S._aureus: 0.44, DC:monocyte-derived:Galectin-1: 0.44, Macrophage:Alveolar:B._anthacis_spores: 0.43, DC:monocyte-derived:LPS: 0.43, DC:monocyte-derived:anti-DC-SIGN_2h: 0.43 |
| WK014-P16 | Macrophage:monocyte-derived:M-CSF/Pam3Cys | 0.20 | 447.34 | Raw ScoresMacrophage:monocyte-derived:M-CSF/Pam3Cys: 0.43, Monocyte:S._typhimurium_flagellin: 0.43, Macrophage:monocyte-derived:M-CSF/IFNg/Pam3Cys: 0.43, DC:monocyte-derived:antiCD40/VAF347: 0.42, DC:monocyte-derived:A._fumigatus_germ_tubes_6h: 0.42, Monocyte:F._tularensis_novicida: 0.41, Macrophage:monocyte-derived:S._aureus: 0.41, DC:monocyte-derived:LPS: 0.4, Monocyte:anti-FcgRIIB: 0.4, DC:monocyte-derived:Schuler_treatment: 0.4 |
| WK012-I16 | Macrophage:monocyte-derived:M-CSF/Pam3Cys | 0.23 | 413.59 | Raw ScoresMacrophage:monocyte-derived:M-CSF/Pam3Cys: 0.49, Monocyte:S._typhimurium_flagellin: 0.49, Macrophage:monocyte-derived:M-CSF/IFNg/Pam3Cys: 0.48, DC:monocyte-derived:antiCD40/VAF347: 0.47, Monocyte:F._tularensis_novicida: 0.46, Macrophage:monocyte-derived:S._aureus: 0.45, Monocyte:anti-FcgRIIB: 0.45, DC:monocyte-derived:LPS: 0.45, DC:monocyte-derived:Galectin-1: 0.45, Macrophage:Alveolar:B._anthacis_spores: 0.45 |
| WK074-E23 | Macrophage:monocyte-derived:S._aureus | 0.15 | 388.33 | Raw ScoresDC:monocyte-derived:A._fumigatus_germ_tubes_6h: 0.46, DC:monocyte-derived:antiCD40/VAF347: 0.45, Macrophage:monocyte-derived:M-CSF/Pam3Cys: 0.45, Macrophage:monocyte-derived:S._aureus: 0.45, Macrophage:monocyte-derived:M-CSF/IFNg/Pam3Cys: 0.44, DC:monocyte-derived:Galectin-1: 0.44, DC:monocyte-derived:LPS: 0.44, Macrophage:Alveolar:B._anthacis_spores: 0.43, DC:monocyte-derived: 0.43, DC:monocyte-derived:Schuler_treatment: 0.43 |
| WK101-M16 | Monocyte:S._typhimurium_flagellin | 0.22 | 387.39 | Raw ScoresMonocyte:S._typhimurium_flagellin: 0.45, Macrophage:monocyte-derived:M-CSF/Pam3Cys: 0.43, Macrophage:monocyte-derived:M-CSF/IFNg/Pam3Cys: 0.43, DC:monocyte-derived:antiCD40/VAF347: 0.42, Monocyte:F._tularensis_novicida: 0.42, DC:monocyte-derived:A._fumigatus_germ_tubes_6h: 0.41, Macrophage:monocyte-derived:S._aureus: 0.41, DC:monocyte-derived:LPS: 0.41, DC:monocyte-derived:Schuler_treatment: 0.4, DC:monocyte-derived:Galectin-1: 0.4 |
| TM38-E6 | DC:monocyte-derived:antiCD40/VAF347 | 0.18 | 375.73 | Raw ScoresMacrophage:monocyte-derived:M-CSF/Pam3Cys: 0.44, Monocyte:S._typhimurium_flagellin: 0.43, DC:monocyte-derived:antiCD40/VAF347: 0.43, Macrophage:monocyte-derived:M-CSF/IFNg/Pam3Cys: 0.43, DC:monocyte-derived:A._fumigatus_germ_tubes_6h: 0.42, Monocyte:F._tularensis_novicida: 0.41, DC:monocyte-derived:CD40L: 0.41, DC:monocyte-derived:LPS: 0.41, Macrophage:monocyte-derived:S._aureus: 0.41, DC:monocyte-derived:Schuler_treatment: 0.41 |
| TM38-D21 | DC:monocyte-derived:antiCD40/VAF347 | 0.20 | 371.67 | Raw ScoresMacrophage:monocyte-derived:M-CSF/Pam3Cys: 0.46, DC:monocyte-derived:antiCD40/VAF347: 0.46, Macrophage:monocyte-derived:M-CSF/IFNg/Pam3Cys: 0.45, DC:monocyte-derived:A._fumigatus_germ_tubes_6h: 0.45, Monocyte:S._typhimurium_flagellin: 0.45, DC:monocyte-derived:LPS: 0.44, Monocyte:F._tularensis_novicida: 0.43, DC:monocyte-derived:Galectin-1: 0.43, Macrophage:monocyte-derived:S._aureus: 0.43, DC:monocyte-derived:Schuler_treatment: 0.43 |
| WK012-N21 | DC:monocyte-derived:antiCD40/VAF347 | 0.16 | 361.48 | Raw ScoresDC:monocyte-derived:A._fumigatus_germ_tubes_6h: 0.43, Macrophage:monocyte-derived:M-CSF/Pam3Cys: 0.43, Monocyte:S._typhimurium_flagellin: 0.43, DC:monocyte-derived:antiCD40/VAF347: 0.42, DC:monocyte-derived:Schuler_treatment: 0.41, Macrophage:monocyte-derived:M-CSF/IFNg/Pam3Cys: 0.41, DC:monocyte-derived:CD40L: 0.41, Macrophage:monocyte-derived:S._aureus: 0.4, DC:monocyte-derived:anti-DC-SIGN_2h: 0.4, DC:monocyte-derived:LPS: 0.4 |
| WK073-O22 | Macrophage:monocyte-derived:M-CSF/IFNg/Pam3Cys | 0.20 | 360.03 | Raw ScoresMacrophage:monocyte-derived:M-CSF/IFNg/Pam3Cys: 0.51, Macrophage:monocyte-derived:M-CSF/Pam3Cys: 0.5, DC:monocyte-derived:A._fumigatus_germ_tubes_6h: 0.49, DC:monocyte-derived:antiCD40/VAF347: 0.49, Macrophage:monocyte-derived:M-CSF/IFNg: 0.49, Macrophage:monocyte-derived:S._aureus: 0.49, Macrophage:monocyte-derived:M-CSF: 0.49, DC:monocyte-derived:LPS: 0.49, DC:monocyte-derived:Galectin-1: 0.49, Macrophage:Alveolar:B._anthacis_spores: 0.49 |
| WK100-H16 | Macrophage:monocyte-derived:M-CSF/Pam3Cys | 0.19 | 359.92 | Raw ScoresMacrophage:monocyte-derived:M-CSF/Pam3Cys: 0.46, Macrophage:monocyte-derived:M-CSF/IFNg/Pam3Cys: 0.46, DC:monocyte-derived:antiCD40/VAF347: 0.45, Monocyte:S._typhimurium_flagellin: 0.45, DC:monocyte-derived:A._fumigatus_germ_tubes_6h: 0.44, DC:monocyte-derived:LPS: 0.44, DC:monocyte-derived:Galectin-1: 0.44, DC:monocyte-derived:CD40L: 0.43, DC:monocyte-derived:Schuler_treatment: 0.43, Macrophage:monocyte-derived:S._aureus: 0.43 |
| WK101-N20 | Macrophage:monocyte-derived:M-CSF/Pam3Cys | 0.19 | 355.12 | Raw ScoresMacrophage:monocyte-derived:M-CSF/Pam3Cys: 0.41, Monocyte:S._typhimurium_flagellin: 0.41, Macrophage:monocyte-derived:M-CSF/IFNg/Pam3Cys: 0.4, DC:monocyte-derived:antiCD40/VAF347: 0.4, DC:monocyte-derived:A._fumigatus_germ_tubes_6h: 0.39, Monocyte:F._tularensis_novicida: 0.39, DC:monocyte-derived:LPS: 0.39, Macrophage:monocyte-derived:S._aureus: 0.39, DC:monocyte-derived:Schuler_treatment: 0.38, DC:monocyte-derived:mature: 0.38 |
| WK012-K21 | DC:monocyte-derived:antiCD40/VAF347 | 0.19 | 348.61 | Raw ScoresDC:monocyte-derived:A._fumigatus_germ_tubes_6h: 0.45, DC:monocyte-derived:antiCD40/VAF347: 0.45, Macrophage:monocyte-derived:M-CSF/Pam3Cys: 0.44, DC:monocyte-derived:CD40L: 0.43, DC:monocyte-derived:Schuler_treatment: 0.43, Macrophage:monocyte-derived:M-CSF/IFNg/Pam3Cys: 0.43, DC:monocyte-derived:Galectin-1: 0.43, DC:monocyte-derived:LPS: 0.43, Macrophage:monocyte-derived:S._aureus: 0.43, DC:monocyte-derived: 0.43 |
| WK101-H18 | Monocyte:S._typhimurium_flagellin | 0.16 | 343.24 | Raw ScoresMacrophage:monocyte-derived:M-CSF/Pam3Cys: 0.46, Macrophage:monocyte-derived:M-CSF/IFNg/Pam3Cys: 0.46, DC:monocyte-derived:antiCD40/VAF347: 0.46, Macrophage:monocyte-derived:S._aureus: 0.45, Monocyte:S._typhimurium_flagellin: 0.45, DC:monocyte-derived:A._fumigatus_germ_tubes_6h: 0.45, DC:monocyte-derived:LPS: 0.45, DC:monocyte-derived:Galectin-1: 0.45, Monocyte:anti-FcgRIIB: 0.44, DC:monocyte-derived:CD40L: 0.44 |
| WMK004-L15 | Monocyte:S._typhimurium_flagellin | 0.19 | 324.09 | Raw ScoresMacrophage:monocyte-derived:M-CSF/Pam3Cys: 0.44, Monocyte:S._typhimurium_flagellin: 0.43, DC:monocyte-derived:antiCD40/VAF347: 0.43, Macrophage:monocyte-derived:M-CSF/IFNg/Pam3Cys: 0.43, Monocyte:F._tularensis_novicida: 0.42, DC:monocyte-derived:A._fumigatus_germ_tubes_6h: 0.42, DC:monocyte-derived:LPS: 0.42, Macrophage:monocyte-derived:S._aureus: 0.42, DC:monocyte-derived:Galectin-1: 0.41, DC:monocyte-derived:Schuler_treatment: 0.41 |
| WK097-I21 | DC:monocyte-derived:antiCD40/VAF347 | 0.16 | 321.82 | Raw ScoresDC:monocyte-derived:antiCD40/VAF347: 0.39, DC:monocyte-derived:A._fumigatus_germ_tubes_6h: 0.39, Monocyte:S._typhimurium_flagellin: 0.39, Macrophage:monocyte-derived:M-CSF/Pam3Cys: 0.39, Macrophage:monocyte-derived:M-CSF/IFNg/Pam3Cys: 0.38, Macrophage:monocyte-derived:S._aureus: 0.38, Monocyte:F._tularensis_novicida: 0.38, DC:monocyte-derived:LPS: 0.37, DC:monocyte-derived:Galectin-1: 0.37, DC:monocyte-derived:Schuler_treatment: 0.37 |
| WK099-J5 | Macrophage:monocyte-derived:M-CSF/IFNg/Pam3Cys | 0.18 | 319.72 | Raw ScoresMacrophage:monocyte-derived:M-CSF/IFNg/Pam3Cys: 0.41, DC:monocyte-derived:A._fumigatus_germ_tubes_6h: 0.41, Monocyte:S._typhimurium_flagellin: 0.41, Macrophage:monocyte-derived:M-CSF/Pam3Cys: 0.41, DC:monocyte-derived:antiCD40/VAF347: 0.4, Macrophage:monocyte-derived:S._aureus: 0.39, DC:monocyte-derived:LPS: 0.39, Monocyte:leukotriene_D4: 0.39, DC:monocyte-derived:Galectin-1: 0.39, Monocyte:anti-FcgRIIB: 0.39 |
| WMK004-N13 | Macrophage:monocyte-derived:M-CSF/IFNg/Pam3Cys | 0.21 | 319.62 | Raw ScoresMacrophage:monocyte-derived:M-CSF/IFNg/Pam3Cys: 0.51, Macrophage:monocyte-derived:M-CSF/Pam3Cys: 0.5, DC:monocyte-derived:antiCD40/VAF347: 0.5, Monocyte:S._typhimurium_flagellin: 0.49, DC:monocyte-derived:LPS: 0.49, DC:monocyte-derived:Schuler_treatment: 0.49, DC:monocyte-derived:Galectin-1: 0.49, DC:monocyte-derived:A._fumigatus_germ_tubes_6h: 0.49, Macrophage:monocyte-derived:S._aureus: 0.48, DC:monocyte-derived:CD40L: 0.48 |
| WK012-C10 | DC:monocyte-derived:antiCD40/VAF347 | 0.19 | 317.99 | Raw ScoresDC:monocyte-derived:antiCD40/VAF347: 0.43, Macrophage:monocyte-derived:M-CSF/Pam3Cys: 0.43, DC:monocyte-derived:A._fumigatus_germ_tubes_6h: 0.43, Macrophage:monocyte-derived:M-CSF/IFNg/Pam3Cys: 0.42, DC:monocyte-derived:anti-DC-SIGN_2h: 0.42, Monocyte:S._typhimurium_flagellin: 0.42, Macrophage:monocyte-derived:M-CSF: 0.41, Macrophage:monocyte-derived:IL-4/Dex/TGFb: 0.41, DC:monocyte-derived:Galectin-1: 0.41, DC:monocyte-derived:LPS: 0.41 |
| WK073-I2 | Monocyte:S._typhimurium_flagellin | 0.20 | 316.67 | Raw ScoresMonocyte:S._typhimurium_flagellin: 0.42, Macrophage:monocyte-derived:M-CSF/Pam3Cys: 0.42, Macrophage:monocyte-derived:M-CSF/IFNg/Pam3Cys: 0.42, Monocyte:F._tularensis_novicida: 0.41, DC:monocyte-derived:antiCD40/VAF347: 0.41, DC:monocyte-derived:A._fumigatus_germ_tubes_6h: 0.4, DC:monocyte-derived:LPS: 0.4, Macrophage:monocyte-derived:S._aureus: 0.39, DC:monocyte-derived:mature: 0.39, DC:monocyte-derived:Schuler_treatment: 0.39 |
| WK014-M22 | Macrophage:monocyte-derived:M-CSF/Pam3Cys | 0.18 | 315.34 | Raw ScoresDC:monocyte-derived:A._fumigatus_germ_tubes_6h: 0.45, Macrophage:monocyte-derived:M-CSF/Pam3Cys: 0.45, DC:monocyte-derived:antiCD40/VAF347: 0.45, Monocyte:S._typhimurium_flagellin: 0.44, Macrophage:monocyte-derived:M-CSF/IFNg/Pam3Cys: 0.44, Macrophage:monocyte-derived:S._aureus: 0.44, DC:monocyte-derived:LPS: 0.43, DC:monocyte-derived:Galectin-1: 0.43, Macrophage:Alveolar:B._anthacis_spores: 0.42, Macrophage:monocyte-derived:IFNa: 0.42 |
| WK074-C18 | DC:monocyte-derived:antiCD40/VAF347 | 0.19 | 315.30 | Raw ScoresDC:monocyte-derived:antiCD40/VAF347: 0.46, DC:monocyte-derived:A._fumigatus_germ_tubes_6h: 0.46, Macrophage:monocyte-derived:M-CSF/Pam3Cys: 0.46, Macrophage:monocyte-derived:M-CSF/IFNg/Pam3Cys: 0.46, Monocyte:S._typhimurium_flagellin: 0.45, Macrophage:monocyte-derived:S._aureus: 0.44, DC:monocyte-derived:Galectin-1: 0.44, DC:monocyte-derived:LPS: 0.44, DC:monocyte-derived:Schuler_treatment: 0.44, DC:monocyte-derived:CD40L: 0.44 |
| WK100-K7 | DC:monocyte-derived:antiCD40/VAF347 | 0.15 | 314.13 | Raw ScoresDC:monocyte-derived:antiCD40/VAF347: 0.37, Macrophage:monocyte-derived:M-CSF/Pam3Cys: 0.37, Monocyte:S._typhimurium_flagellin: 0.36, DC:monocyte-derived:A._fumigatus_germ_tubes_6h: 0.36, Macrophage:monocyte-derived:M-CSF/IFNg/Pam3Cys: 0.36, Macrophage:monocyte-derived:S._aureus: 0.36, DC:monocyte-derived:LPS: 0.35, DC:monocyte-derived:Galectin-1: 0.35, DC:monocyte-derived:CD40L: 0.35, Macrophage:Alveolar:B._anthacis_spores: 0.35 |
| WMK004-N3 | DC:monocyte-derived:antiCD40/VAF347 | 0.21 | 312.34 | Raw ScoresDC:monocyte-derived:antiCD40/VAF347: 0.47, Monocyte:S._typhimurium_flagellin: 0.47, Macrophage:monocyte-derived:M-CSF/Pam3Cys: 0.47, DC:monocyte-derived:A._fumigatus_germ_tubes_6h: 0.46, Macrophage:monocyte-derived:M-CSF/IFNg/Pam3Cys: 0.46, Macrophage:monocyte-derived:S._aureus: 0.45, DC:monocyte-derived:Galectin-1: 0.45, DC:monocyte-derived:LPS: 0.45, Monocyte:anti-FcgRIIB: 0.44, DC:monocyte-derived:anti-DC-SIGN_2h: 0.44 |
| WK100-D16 | DC:monocyte-derived:antiCD40/VAF347 | 0.17 | 312.03 | Raw ScoresMacrophage:monocyte-derived:M-CSF/Pam3Cys: 0.41, Monocyte:S._typhimurium_flagellin: 0.4, DC:monocyte-derived:antiCD40/VAF347: 0.4, Macrophage:monocyte-derived:M-CSF/IFNg/Pam3Cys: 0.4, DC:monocyte-derived:A._fumigatus_germ_tubes_6h: 0.39, DC:monocyte-derived:Schuler_treatment: 0.39, DC:monocyte-derived:LPS: 0.39, Macrophage:monocyte-derived:S._aureus: 0.39, DC:monocyte-derived:CD40L: 0.39, DC:monocyte-derived:Galectin-1: 0.38 |
| WK100-K1 | DC:monocyte-derived:antiCD40/VAF347 | 0.18 | 308.19 | Raw ScoresMacrophage:monocyte-derived:M-CSF/Pam3Cys: 0.39, DC:monocyte-derived:antiCD40/VAF347: 0.38, Monocyte:S._typhimurium_flagellin: 0.38, Macrophage:monocyte-derived:M-CSF/IFNg/Pam3Cys: 0.38, DC:monocyte-derived:A._fumigatus_germ_tubes_6h: 0.37, DC:monocyte-derived:Galectin-1: 0.37, DC:monocyte-derived:LPS: 0.37, Macrophage:monocyte-derived:S._aureus: 0.36, Monocyte:F._tularensis_novicida: 0.36, DC:monocyte-derived:Schuler_treatment: 0.36 |
| WK101-F18 | DC:monocyte-derived:antiCD40/VAF347 | 0.17 | 307.91 | Raw ScoresMacrophage:monocyte-derived:M-CSF/Pam3Cys: 0.4, Macrophage:monocyte-derived:M-CSF/IFNg/Pam3Cys: 0.39, DC:monocyte-derived:antiCD40/VAF347: 0.39, Monocyte:S._typhimurium_flagellin: 0.39, DC:monocyte-derived:A._fumigatus_germ_tubes_6h: 0.39, Macrophage:monocyte-derived:S._aureus: 0.39, DC:monocyte-derived:LPS: 0.39, DC:monocyte-derived:Galectin-1: 0.38, Macrophage:monocyte-derived:IFNa: 0.38, Monocyte:F._tularensis_novicida: 0.38 |
| KK051-H13 | Monocyte:S._typhimurium_flagellin | 0.18 | 301.01 | Raw ScoresMonocyte:S._typhimurium_flagellin: 0.41, Macrophage:monocyte-derived:M-CSF/Pam3Cys: 0.39, Macrophage:monocyte-derived:M-CSF/IFNg/Pam3Cys: 0.39, Monocyte:F._tularensis_novicida: 0.39, DC:monocyte-derived:antiCD40/VAF347: 0.38, Neutrophil:LPS: 0.37, Macrophage:monocyte-derived:S._aureus: 0.37, DC:monocyte-derived:LPS: 0.37, DC:monocyte-derived:A._fumigatus_germ_tubes_6h: 0.37, Macrophage:Alveolar:B._anthacis_spores: 0.37 |
| WK014-M14 | DC:monocyte-derived:antiCD40/VAF347 | 0.19 | 289.43 | Raw ScoresMonocyte:S._typhimurium_flagellin: 0.48, DC:monocyte-derived:antiCD40/VAF347: 0.47, Macrophage:monocyte-derived:M-CSF/Pam3Cys: 0.47, DC:monocyte-derived:Schuler_treatment: 0.47, DC:monocyte-derived:A._fumigatus_germ_tubes_6h: 0.47, Macrophage:monocyte-derived:M-CSF/IFNg/Pam3Cys: 0.46, DC:monocyte-derived:LPS: 0.45, DC:monocyte-derived:CD40L: 0.45, Monocyte:F._tularensis_novicida: 0.44, Macrophage:monocyte-derived:S._aureus: 0.44 |
| WK100-G23 | Monocyte:S._typhimurium_flagellin | 0.20 | 284.32 | Raw ScoresMacrophage:monocyte-derived:M-CSF/IFNg/Pam3Cys: 0.43, Monocyte:S._typhimurium_flagellin: 0.43, Macrophage:monocyte-derived:M-CSF/Pam3Cys: 0.43, DC:monocyte-derived:antiCD40/VAF347: 0.42, Monocyte:anti-FcgRIIB: 0.41, DC:monocyte-derived:A._fumigatus_germ_tubes_6h: 0.41, Monocyte: 0.41, DC:monocyte-derived:LPS: 0.41, Monocyte:F._tularensis_novicida: 0.41, Monocyte:leukotriene_D4: 0.41 |
| WK096-I2 | DC:monocyte-derived:antiCD40/VAF347 | 0.16 | 283.24 | Raw ScoresMacrophage:monocyte-derived:M-CSF/Pam3Cys: 0.4, DC:monocyte-derived:antiCD40/VAF347: 0.4, DC:monocyte-derived:A._fumigatus_germ_tubes_6h: 0.4, Monocyte:S._typhimurium_flagellin: 0.4, Macrophage:monocyte-derived:M-CSF/IFNg/Pam3Cys: 0.39, Macrophage:monocyte-derived:S._aureus: 0.39, DC:monocyte-derived:Galectin-1: 0.38, DC:monocyte-derived:Schuler_treatment: 0.38, DC:monocyte-derived:LPS: 0.38, DC:monocyte-derived:CD40L: 0.38 |
| WK067-G18 | Macrophage:monocyte-derived:M-CSF | 0.20 | 269.40 | Raw ScoresMacrophage:monocyte-derived:M-CSF: 0.5, DC:monocyte-derived:anti-DC-SIGN_2h: 0.5, Macrophage:monocyte-derived:IL-4/Dex/TGFb: 0.49, DC:monocyte-derived:A._fumigatus_germ_tubes_6h: 0.49, Macrophage:monocyte-derived:IL-4/Dex/cntrl: 0.49, Macrophage:monocyte-derived:M-CSF/IFNg: 0.49, Monocyte:leukotriene_D4: 0.49, DC:monocyte-derived:antiCD40/VAF347: 0.48, DC:monocyte-derived: 0.48, Macrophage:monocyte-derived:M-CSF/IFNg/Pam3Cys: 0.48 |
| WK100-L15 | Monocyte:S._typhimurium_flagellin | 0.20 | 267.85 | Raw ScoresMonocyte:S._typhimurium_flagellin: 0.41, Macrophage:monocyte-derived:M-CSF/Pam3Cys: 0.39, DC:monocyte-derived:antiCD40/VAF347: 0.38, Macrophage:monocyte-derived:M-CSF/IFNg/Pam3Cys: 0.38, Monocyte:F._tularensis_novicida: 0.38, Macrophage:monocyte-derived:S._aureus: 0.37, Neutrophil:LPS: 0.37, DC:monocyte-derived:A._fumigatus_germ_tubes_6h: 0.36, DC:monocyte-derived:LPS: 0.36, DC:monocyte-derived:Galectin-1: 0.36 |
| WK097-O4 | DC:monocyte-derived:antiCD40/VAF347 | 0.15 | 267.84 | Raw ScoresDC:monocyte-derived:A._fumigatus_germ_tubes_6h: 0.36, DC:monocyte-derived:antiCD40/VAF347: 0.36, Macrophage:monocyte-derived:M-CSF/Pam3Cys: 0.36, Monocyte:S._typhimurium_flagellin: 0.36, Macrophage:monocyte-derived:M-CSF/IFNg/Pam3Cys: 0.35, Macrophage:monocyte-derived:S._aureus: 0.35, DC:monocyte-derived:LPS: 0.35, DC:monocyte-derived:Schuler_treatment: 0.34, Monocyte:F._tularensis_novicida: 0.34, DC:monocyte-derived:CD40L: 0.34 |
Below shows the significant enrichments of this GEP for literature curated gene lists
This data was procured from existing single cell RNA-seq maps of neuroblastoma or related relevant data.
High ranks indicate this gene is a driver of this GEP.
These curated gene list are ranked by the P-value (on this GEP) of their constituent genes.
The Mean Count column shows the mean read count in cells scoring highly (H > 50) on this gene expression program.
M-MDSC
These marker genes were curated for MDSC subtypes as reviewed in Veglia et. al. (PMID 33526920):
Wilcoxon ranksum test P-value for gene set overrepresentation: 4.51e-06
Mean rank of genes in gene set: 2124.73
Rank on gene expression program of genes in gene set:
| Genes | Weight | Rank | GTEx | DepMap | Decartes | Mean.Counts | Mean.TPM |
|---|---|---|---|---|---|---|---|
| IL1B | 0.0140186 | 1 | GTEx | DepMap | Descartes | 78.40 | 17094.37 |
| TNF | 0.0125372 | 2 | GTEx | DepMap | Descartes | 10.12 | 1805.90 |
| IL10 | 0.0099461 | 4 | GTEx | DepMap | Descartes | 6.09 | 936.41 |
| HIF1A | 0.0038582 | 84 | GTEx | DepMap | Descartes | 4.80 | 446.53 |
| CD274 | 0.0023534 | 191 | GTEx | DepMap | Descartes | 0.58 | 56.94 |
| CD84 | 0.0018195 | 255 | GTEx | DepMap | Descartes | 1.72 | 73.77 |
| VEGFA | 0.0014389 | 335 | GTEx | DepMap | Descartes | 3.69 | 103.15 |
| TNFRSF10B | 0.0003837 | 927 | GTEx | DepMap | Descartes | 0.85 | 65.27 |
| CD14 | 0.0001723 | 1276 | GTEx | DepMap | Descartes | 2.21 | 428.82 |
| STAT3 | 0.0000143 | 1894 | GTEx | DepMap | Descartes | 2.56 | 200.93 |
| ARG1 | -0.0000772 | 3021 | GTEx | DepMap | Descartes | 0.00 | 0.00 |
| NOS2 | -0.0000803 | 3088 | GTEx | DepMap | Descartes | 0.00 | 0.00 |
| CD36 | -0.0002195 | 6096 | GTEx | DepMap | Descartes | 0.18 | 8.43 |
| TGFB1 | -0.0002304 | 6337 | GTEx | DepMap | Descartes | 0.68 | 87.39 |
| ARG2 | -0.0003223 | 8360 | GTEx | DepMap | Descartes | 0.02 | 6.21 |
M1 Macrophage
These genes were collated from multiple sources:
Wilcoxon ranksum test P-value for gene set overrepresentation: 4.68e-05
Mean rank of genes in gene set: 2009.82
Rank on gene expression program of genes in gene set:
| Genes | Weight | Rank | GTEx | DepMap | Decartes | Mean.Counts | Mean.TPM |
|---|---|---|---|---|---|---|---|
| IL1B | 0.0140186 | 1 | GTEx | DepMap | Descartes | 78.40 | 17094.37 |
| TNF | 0.0125372 | 2 | GTEx | DepMap | Descartes | 10.12 | 1805.90 |
| ITGAX | 0.0050564 | 44 | GTEx | DepMap | Descartes | 5.08 | 434.43 |
| IL18 | 0.0029904 | 133 | GTEx | DepMap | Descartes | 1.12 | 206.26 |
| CD80 | 0.0025397 | 168 | GTEx | DepMap | Descartes | 0.36 | 43.73 |
| CXCL16 | 0.0020850 | 220 | GTEx | DepMap | Descartes | 1.84 | 261.55 |
| TLR4 | 0.0009418 | 501 | GTEx | DepMap | Descartes | 0.44 | 9.64 |
| CCL2 | 0.0004754 | 801 | GTEx | DepMap | Descartes | 12.04 | 2735.73 |
| CD14 | 0.0001723 | 1276 | GTEx | DepMap | Descartes | 2.21 | 428.82 |
| IL33 | -0.0003153 | 8217 | GTEx | DepMap | Descartes | 0.25 | 14.80 |
| CCL5 | -0.0004734 | 10745 | GTEx | DepMap | Descartes | 0.66 | 139.12 |
M2 Macrophage
These genes were collated from multiple sources:
Wilcoxon ranksum test P-value for gene set overrepresentation: 9.02e-04
Mean rank of genes in gene set: 2003
Rank on gene expression program of genes in gene set:
| Genes | Weight | Rank | GTEx | DepMap | Decartes | Mean.Counts | Mean.TPM |
|---|---|---|---|---|---|---|---|
| IL10 | 0.0099461 | 4 | GTEx | DepMap | Descartes | 6.09 | 936.41 |
| CD163 | 0.0024781 | 175 | GTEx | DepMap | Descartes | 2.32 | 131.59 |
| VEGFA | 0.0014389 | 335 | GTEx | DepMap | Descartes | 3.69 | 103.15 |
| CD14 | 0.0001723 | 1276 | GTEx | DepMap | Descartes | 2.21 | 428.82 |
| IL13 | -0.0000685 | 2873 | GTEx | DepMap | Descartes | 0.00 | 0.00 |
| ARG1 | -0.0000772 | 3021 | GTEx | DepMap | Descartes | 0.00 | 0.00 |
| TGFB1 | -0.0002304 | 6337 | GTEx | DepMap | Descartes | 0.68 | 87.39 |
Below shows ranks on this GEP for literature curated gene lists for large gene sets
These include those reported as mesenchymal/adrenergic by Van Groningen et al.
High ranks indicate this gene is a driver of this GEP (note these results are not ordered).
The Mean Count column shows the mean read count in cells scoring highly (H > 50) on this gene expression program.
VanGroningen Adrenergic Genes
Adrenergic marker genes from Supplementary Table 2 of Van Groningen et al. Nature Genetics 2017. These genes were identified by differential expression analysis of mesenchymal-like and adrenergic-like neuroblastoma cell lines.
Wilcoxon ranksum test P-value for gene set overrepresentation: 1.00e+00
Mean rank of genes in gene set: 7768.08
Median rank of genes in gene set: 8505
Rank on gene expression program of top 30 genes in gene set:
| Genes | Weight | Rank | GTEx | DepMap | Descartes | Mean.Counts | Mean.TPM |
|---|---|---|---|---|---|---|---|
| ATP6V1B2 | 0.0039228 | 82 | GTEx | DepMap | Descartes | 4.32 | 201.94 |
| LYN | 0.0030906 | 127 | GTEx | DepMap | Descartes | 2.18 | 129.43 |
| DAPK1 | 0.0029103 | 142 | GTEx | DepMap | Descartes | 0.86 | 44.76 |
| ST3GAL6 | 0.0026191 | 160 | GTEx | DepMap | Descartes | 0.96 | 105.17 |
| GLRX | 0.0024347 | 180 | GTEx | DepMap | Descartes | 1.24 | 109.51 |
| RALGDS | 0.0022405 | 209 | GTEx | DepMap | Descartes | 1.46 | 83.31 |
| CDC42EP3 | 0.0020655 | 224 | GTEx | DepMap | Descartes | 2.56 | 162.11 |
| GCH1 | 0.0018391 | 254 | GTEx | DepMap | Descartes | 1.40 | 168.38 |
| CHML | 0.0012073 | 391 | GTEx | DepMap | Descartes | 0.56 | 27.44 |
| FAM107B | 0.0011266 | 428 | GTEx | DepMap | Descartes | 1.85 | 173.03 |
| EIF1B | 0.0009572 | 493 | GTEx | DepMap | Descartes | 1.22 | 436.63 |
| TIAM1 | 0.0009200 | 510 | GTEx | DepMap | Descartes | 0.72 | 39.56 |
| NCS1 | 0.0009065 | 520 | GTEx | DepMap | Descartes | 0.50 | 36.02 |
| AP1S2 | 0.0008846 | 527 | GTEx | DepMap | Descartes | 1.21 | 113.33 |
| RBBP8 | 0.0007210 | 617 | GTEx | DepMap | Descartes | 0.36 | 35.57 |
| HK2 | 0.0007083 | 625 | GTEx | DepMap | Descartes | 0.24 | 17.31 |
| FOXO3 | 0.0006409 | 664 | GTEx | DepMap | Descartes | 2.34 | 110.79 |
| ARL6IP1 | 0.0006341 | 668 | GTEx | DepMap | Descartes | 2.00 | 286.46 |
| TBC1D30 | 0.0005715 | 714 | GTEx | DepMap | Descartes | 0.08 | 4.41 |
| RAB33A | 0.0004941 | 780 | GTEx | DepMap | Descartes | 0.22 | 43.85 |
| DUSP4 | 0.0004060 | 892 | GTEx | DepMap | Descartes | 1.37 | 88.58 |
| PBX3 | 0.0003521 | 964 | GTEx | DepMap | Descartes | 0.44 | 57.32 |
| SHC3 | 0.0003074 | 1023 | GTEx | DepMap | Descartes | 0.02 | 0.65 |
| TUBB4B | 0.0001750 | 1272 | GTEx | DepMap | Descartes | 1.65 | 249.88 |
| PPP2R3C | 0.0001247 | 1400 | GTEx | DepMap | Descartes | 0.21 | 28.63 |
| RTN2 | 0.0000810 | 1542 | GTEx | DepMap | Descartes | 0.06 | 6.77 |
| ASRGL1 | 0.0000716 | 1582 | GTEx | DepMap | Descartes | 0.10 | 13.51 |
| NFIL3 | 0.0000555 | 1642 | GTEx | DepMap | Descartes | 0.85 | 118.51 |
| CAMSAP1 | 0.0000389 | 1717 | GTEx | DepMap | Descartes | 0.18 | 6.73 |
| CADM1 | 0.0000354 | 1739 | GTEx | DepMap | Descartes | 0.33 | 14.77 |
VanGroningen Mesenchymal Genes
Mesenchymal marker genes from Supplementary Table 2 of Van Groningen et al. Nature Genetics 2017. These genes were identified by differential expression analysis of mesenchymal-like and adrenergic-like neuroblastoma cell lines.
Wilcoxon ranksum test P-value for gene set overrepresentation: 1.00e+00
Mean rank of genes in gene set: 7718.42
Median rank of genes in gene set: 9253
Rank on gene expression program of top 30 genes in gene set:
| Genes | Weight | Rank | GTEx | DepMap | Descartes | Mean.Counts | Mean.TPM |
|---|---|---|---|---|---|---|---|
| INSIG1 | 0.0070806 | 16 | GTEx | DepMap | Descartes | 9.60 | 1210.09 |
| CD44 | 0.0061398 | 25 | GTEx | DepMap | Descartes | 17.01 | 1240.01 |
| DSE | 0.0054259 | 38 | GTEx | DepMap | Descartes | 3.12 | 114.22 |
| CREG1 | 0.0052225 | 39 | GTEx | DepMap | Descartes | 3.75 | 543.74 |
| LITAF | 0.0047607 | 53 | GTEx | DepMap | Descartes | 16.32 | 2128.41 |
| SDCBP | 0.0046294 | 58 | GTEx | DepMap | Descartes | 7.70 | 762.28 |
| ANXA5 | 0.0041464 | 69 | GTEx | DepMap | Descartes | 11.98 | 2354.26 |
| ATP2B1 | 0.0040106 | 74 | GTEx | DepMap | Descartes | 4.85 | 301.58 |
| DUSP6 | 0.0037471 | 91 | GTEx | DepMap | Descartes | 4.53 | 447.08 |
| OGFRL1 | 0.0036335 | 94 | GTEx | DepMap | Descartes | 2.01 | 81.21 |
| KLF6 | 0.0033764 | 106 | GTEx | DepMap | Descartes | 22.29 | 1756.23 |
| NOTCH2 | 0.0033507 | 109 | GTEx | DepMap | Descartes | 1.75 | 53.75 |
| CTSB | 0.0031743 | 120 | GTEx | DepMap | Descartes | 13.95 | 1080.85 |
| SQSTM1 | 0.0026123 | 161 | GTEx | DepMap | Descartes | 10.08 | 1092.22 |
| FNDC3B | 0.0025582 | 167 | GTEx | DepMap | Descartes | 2.60 | 119.30 |
| SGK1 | 0.0025071 | 170 | GTEx | DepMap | Descartes | 5.67 | 306.16 |
| CMTM6 | 0.0024522 | 177 | GTEx | DepMap | Descartes | 3.89 | 449.84 |
| PTGER4 | 0.0019537 | 237 | GTEx | DepMap | Descartes | 2.24 | 211.86 |
| THBS1 | 0.0018922 | 248 | GTEx | DepMap | Descartes | 15.75 | 810.73 |
| EDEM1 | 0.0018463 | 253 | GTEx | DepMap | Descartes | 1.35 | 79.16 |
| RIT1 | 0.0017197 | 275 | GTEx | DepMap | Descartes | 0.73 | 73.57 |
| HLX | 0.0015002 | 317 | GTEx | DepMap | Descartes | 0.38 | 25.26 |
| NPC2 | 0.0014868 | 321 | GTEx | DepMap | Descartes | 3.84 | 804.56 |
| GNS | 0.0014478 | 332 | GTEx | DepMap | Descartes | 2.07 | 136.80 |
| ATP1B1 | 0.0013477 | 354 | GTEx | DepMap | Descartes | 2.45 | 296.12 |
| ASPH | 0.0012785 | 373 | GTEx | DepMap | Descartes | 0.93 | 63.31 |
| SDC4 | 0.0012751 | 374 | GTEx | DepMap | Descartes | 1.10 | 146.90 |
| ANXA2 | 0.0011586 | 417 | GTEx | DepMap | Descartes | 5.99 | 541.91 |
| VIM | 0.0011524 | 420 | GTEx | DepMap | Descartes | 26.39 | 3235.77 |
| GPR137B | 0.0011012 | 436 | GTEx | DepMap | Descartes | 0.79 | 108.86 |
Descartes adrenocortical markers
Top 50 marker genes of adrenocortical cells in the Decartes fetal adrenal single cell map (https://atlas.brotmanbaty.org/bbi/human-gene-expression-during-development/cell/adrenocortical/in/adrenal)
Wilcoxon ranksum test P-value for gene set overrepresentation: 1.83e-01
Mean rank of genes in gene set: 5729.53
Median rank of genes in gene set: 5649.5
Rank on gene expression program of top 30 genes in gene set:
| Genes | Weight | Rank | GTEx | DepMap | Descartes | Mean.Counts | Mean.TPM |
|---|---|---|---|---|---|---|---|
| SH3BP5 | 0.0012287 | 386 | GTEx | DepMap | Descartes | 1.40 | 147.26 |
| NPC1 | 0.0011484 | 422 | GTEx | DepMap | Descartes | 0.67 | 44.58 |
| ERN1 | 0.0008354 | 552 | GTEx | DepMap | Descartes | 0.74 | 33.97 |
| SH3PXD2B | 0.0006369 | 667 | GTEx | DepMap | Descartes | 0.20 | 10.01 |
| POR | 0.0005232 | 753 | GTEx | DepMap | Descartes | 0.66 | 80.28 |
| PAPSS2 | 0.0003821 | 928 | GTEx | DepMap | Descartes | 0.57 | 40.49 |
| GRAMD1B | 0.0001462 | 1338 | GTEx | DepMap | Descartes | 0.27 | 11.20 |
| BAIAP2L1 | 0.0000935 | 1499 | GTEx | DepMap | Descartes | 0.00 | 0.29 |
| INHA | 0.0000842 | 1536 | GTEx | DepMap | Descartes | 0.00 | 0.00 |
| FREM2 | 0.0000382 | 1723 | GTEx | DepMap | Descartes | 0.01 | 0.19 |
| STAR | -0.0000651 | 2813 | GTEx | DepMap | Descartes | 0.00 | 0.00 |
| SGCZ | -0.0000762 | 2999 | GTEx | DepMap | Descartes | 0.00 | 0.00 |
| FDX1 | -0.0001449 | 4408 | GTEx | DepMap | Descartes | 0.21 | 21.03 |
| DNER | -0.0001698 | 4951 | GTEx | DepMap | Descartes | 0.01 | 0.64 |
| SLC16A9 | -0.0001732 | 5030 | GTEx | DepMap | Descartes | 0.01 | 0.72 |
| JAKMIP2 | -0.0001922 | 5512 | GTEx | DepMap | Descartes | 0.04 | 0.99 |
| SCARB1 | -0.0001932 | 5534 | GTEx | DepMap | Descartes | 0.16 | 7.24 |
| FDXR | -0.0001967 | 5606 | GTEx | DepMap | Descartes | 0.01 | 0.30 |
| FRMD5 | -0.0002010 | 5693 | GTEx | DepMap | Descartes | 0.01 | 0.50 |
| TM7SF2 | -0.0002096 | 5878 | GTEx | DepMap | Descartes | 0.01 | 1.01 |
| PDE10A | -0.0002691 | 7220 | GTEx | DepMap | Descartes | 0.03 | 1.35 |
| DHCR7 | -0.0002776 | 7406 | GTEx | DepMap | Descartes | 0.04 | 6.26 |
| SLC1A2 | -0.0002828 | 7519 | GTEx | DepMap | Descartes | 0.03 | 0.67 |
| DHCR24 | -0.0002898 | 7677 | GTEx | DepMap | Descartes | 0.09 | 2.13 |
| LDLR | -0.0003102 | 8107 | GTEx | DepMap | Descartes | 0.57 | 38.53 |
| SCAP | -0.0003115 | 8138 | GTEx | DepMap | Descartes | 0.06 | 3.51 |
| MSMO1 | -0.0003276 | 8476 | GTEx | DepMap | Descartes | 0.13 | 13.43 |
| APOC1 | -0.0003294 | 8523 | GTEx | DepMap | Descartes | 3.01 | 935.50 |
| HMGCS1 | -0.0003696 | 9262 | GTEx | DepMap | Descartes | 0.30 | 18.06 |
| FDPS | -0.0004031 | 9831 | GTEx | DepMap | Descartes | 0.22 | 30.22 |
Descartes chromaffin markers
Top 50 marker genes of chromaffin cells in the Decartes fetal adrenal single cell map (https://atlas.brotmanbaty.org/bbi/human-gene-expression-during-development/cell/chromaffin/in/adrenal)
Wilcoxon ranksum test P-value for gene set overrepresentation: 9.40e-01
Mean rank of genes in gene set: 7151.2
Median rank of genes in gene set: 6914
Rank on gene expression program of top 30 genes in gene set:
| Genes | Weight | Rank | GTEx | DepMap | Descartes | Mean.Counts | Mean.TPM |
|---|---|---|---|---|---|---|---|
| BASP1 | 0.0049798 | 45 | GTEx | DepMap | Descartes | 10.22 | 2212.29 |
| EYA4 | 0.0001500 | 1330 | GTEx | DepMap | Descartes | 0.03 | 2.97 |
| EPHA6 | -0.0000080 | 2066 | GTEx | DepMap | Descartes | 0.01 | 1.20 |
| ALK | -0.0000670 | 2839 | GTEx | DepMap | Descartes | 0.01 | 0.10 |
| TMEFF2 | -0.0000743 | 2964 | GTEx | DepMap | Descartes | 0.01 | 0.86 |
| ANKFN1 | -0.0001047 | 3550 | GTEx | DepMap | Descartes | 0.01 | 0.79 |
| KCNB2 | -0.0001202 | 3870 | GTEx | DepMap | Descartes | 0.00 | 0.00 |
| GAL | -0.0001203 | 3871 | GTEx | DepMap | Descartes | 0.02 | 4.03 |
| NTRK1 | -0.0001277 | 4035 | GTEx | DepMap | Descartes | 0.00 | 0.31 |
| RPH3A | -0.0001355 | 4204 | GTEx | DepMap | Descartes | 0.00 | 0.10 |
| SLC44A5 | -0.0001639 | 4836 | GTEx | DepMap | Descartes | 0.00 | 0.00 |
| IL7 | -0.0001723 | 5013 | GTEx | DepMap | Descartes | 0.01 | 2.22 |
| FAT3 | -0.0001864 | 5355 | GTEx | DepMap | Descartes | 0.01 | 0.06 |
| EYA1 | -0.0001890 | 5437 | GTEx | DepMap | Descartes | 0.00 | 0.00 |
| GREM1 | -0.0002223 | 6156 | GTEx | DepMap | Descartes | 0.63 | 4.77 |
| HS3ST5 | -0.0002243 | 6202 | GTEx | DepMap | Descartes | 0.00 | 0.28 |
| MARCH11 | -0.0002395 | 6570 | GTEx | DepMap | Descartes | 0.00 | NA |
| CNTFR | -0.0002428 | 6644 | GTEx | DepMap | Descartes | 0.00 | 0.25 |
| SLC6A2 | -0.0002522 | 6855 | GTEx | DepMap | Descartes | 0.01 | 1.76 |
| SYNPO2 | -0.0002530 | 6874 | GTEx | DepMap | Descartes | 0.23 | 4.56 |
| TMEM132C | -0.0002549 | 6914 | GTEx | DepMap | Descartes | 0.00 | 0.00 |
| RBFOX1 | -0.0002840 | 7550 | GTEx | DepMap | Descartes | 0.00 | 0.00 |
| PTCHD1 | -0.0002966 | 7813 | GTEx | DepMap | Descartes | 0.01 | 0.31 |
| PLXNA4 | -0.0002996 | 7885 | GTEx | DepMap | Descartes | 0.01 | 0.16 |
| ELAVL2 | -0.0003068 | 8025 | GTEx | DepMap | Descartes | 0.00 | 0.00 |
| MAB21L2 | -0.0003110 | 8127 | GTEx | DepMap | Descartes | 0.03 | 3.22 |
| CNKSR2 | -0.0003209 | 8326 | GTEx | DepMap | Descartes | 0.01 | 0.21 |
| NPY | -0.0003249 | 8420 | GTEx | DepMap | Descartes | 0.07 | 50.54 |
| MAB21L1 | -0.0003434 | 8808 | GTEx | DepMap | Descartes | 0.01 | 2.21 |
| CCND1 | -0.0003769 | 9398 | GTEx | DepMap | Descartes | 0.48 | 38.53 |
Descartes Vascular_endothelial markers
Top 50 marker genes of Vascular_endothelial cells in the Decartes fetal adrenal single cell map (https://atlas.brotmanbaty.org/bbi/human-gene-expression-during-development/cell/vascular_endothelial/in/adrenal)
Wilcoxon ranksum test P-value for gene set overrepresentation: 9.90e-01
Mean rank of genes in gene set: 7649.45
Median rank of genes in gene set: 8376.5
Rank on gene expression program of top 30 genes in gene set:
| Genes | Weight | Rank | GTEx | DepMap | Descartes | Mean.Counts | Mean.TPM |
|---|---|---|---|---|---|---|---|
| TMEM88 | 0.0009383 | 504 | GTEx | DepMap | Descartes | 0.35 | 136.87 |
| RASIP1 | 0.0000813 | 1540 | GTEx | DepMap | Descartes | 0.04 | 4.65 |
| NR5A2 | -0.0000001 | 2001 | GTEx | DepMap | Descartes | 0.01 | 0.32 |
| EHD3 | -0.0001216 | 3905 | GTEx | DepMap | Descartes | 0.02 | 1.58 |
| CRHBP | -0.0001304 | 4091 | GTEx | DepMap | Descartes | 0.04 | 7.05 |
| ESM1 | -0.0001601 | 4749 | GTEx | DepMap | Descartes | 0.01 | 0.26 |
| F8 | -0.0001648 | 4849 | GTEx | DepMap | Descartes | 0.07 | 2.02 |
| CEACAM1 | -0.0001827 | 5269 | GTEx | DepMap | Descartes | 0.03 | 2.59 |
| GALNT15 | -0.0001932 | 5536 | GTEx | DepMap | Descartes | 0.01 | NA |
| BTNL9 | -0.0001995 | 5663 | GTEx | DepMap | Descartes | 0.00 | 0.45 |
| NPR1 | -0.0002130 | 5942 | GTEx | DepMap | Descartes | 0.01 | 0.23 |
| CHRM3 | -0.0002145 | 5982 | GTEx | DepMap | Descartes | 0.00 | 0.00 |
| MYRIP | -0.0002417 | 6616 | GTEx | DepMap | Descartes | 0.01 | 0.48 |
| CDH13 | -0.0002534 | 6885 | GTEx | DepMap | Descartes | 0.02 | 1.11 |
| FLT4 | -0.0002629 | 7086 | GTEx | DepMap | Descartes | 0.03 | 1.65 |
| IRX3 | -0.0002643 | 7116 | GTEx | DepMap | Descartes | 0.01 | 1.23 |
| CLDN5 | -0.0002747 | 7348 | GTEx | DepMap | Descartes | 0.04 | 4.55 |
| NOTCH4 | -0.0003050 | 7991 | GTEx | DepMap | Descartes | 0.04 | 1.59 |
| ROBO4 | -0.0003225 | 8369 | GTEx | DepMap | Descartes | 0.04 | 3.00 |
| TEK | -0.0003233 | 8384 | GTEx | DepMap | Descartes | 0.01 | 0.37 |
| KANK3 | -0.0003329 | 8588 | GTEx | DepMap | Descartes | 0.01 | 1.21 |
| SLCO2A1 | -0.0003420 | 8770 | GTEx | DepMap | Descartes | 0.02 | 2.75 |
| KDR | -0.0003610 | 9125 | GTEx | DepMap | Descartes | 0.01 | 1.44 |
| CDH5 | -0.0003647 | 9187 | GTEx | DepMap | Descartes | 0.02 | 1.70 |
| HYAL2 | -0.0003763 | 9388 | GTEx | DepMap | Descartes | 0.05 | 2.61 |
| SHE | -0.0003766 | 9395 | GTEx | DepMap | Descartes | 0.04 | 2.40 |
| PODXL | -0.0003771 | 9401 | GTEx | DepMap | Descartes | 0.01 | 0.31 |
| PTPRB | -0.0003795 | 9452 | GTEx | DepMap | Descartes | 0.05 | 1.65 |
| SHANK3 | -0.0003946 | 9703 | GTEx | DepMap | Descartes | 0.04 | 0.93 |
| TIE1 | -0.0003951 | 9711 | GTEx | DepMap | Descartes | 0.07 | 4.35 |
Descartes stromal markers
Top 50 marker genes of stromal cells in the Decartes fetal adrenal single cell map (https://atlas.brotmanbaty.org/bbi/human-gene-expression-during-development/cell/stromal/in/adrenal)
Wilcoxon ranksum test P-value for gene set overrepresentation: 1.00e+00
Mean rank of genes in gene set: 9509.8
Median rank of genes in gene set: 10132
Rank on gene expression program of top 30 genes in gene set:
| Genes | Weight | Rank | GTEx | DepMap | Descartes | Mean.Counts | Mean.TPM |
|---|---|---|---|---|---|---|---|
| GAS2 | -0.0000680 | 2859 | GTEx | DepMap | Descartes | 0.00 | 0.00 |
| LAMC3 | -0.0001028 | 3499 | GTEx | DepMap | Descartes | 0.01 | 0.39 |
| DKK2 | -0.0001070 | 3593 | GTEx | DepMap | Descartes | 0.02 | 0.79 |
| HHIP | -0.0001480 | 4487 | GTEx | DepMap | Descartes | 0.00 | 0.00 |
| LRRC17 | -0.0001963 | 5593 | GTEx | DepMap | Descartes | 0.02 | 1.13 |
| RSPO3 | -0.0002316 | 6367 | GTEx | DepMap | Descartes | 0.00 | NA |
| POSTN | -0.0002533 | 6882 | GTEx | DepMap | Descartes | 0.20 | 14.22 |
| ITGA11 | -0.0002560 | 6940 | GTEx | DepMap | Descartes | 0.04 | 0.99 |
| ADAMTSL3 | -0.0002573 | 6971 | GTEx | DepMap | Descartes | 0.03 | 1.41 |
| GLI2 | -0.0002822 | 7504 | GTEx | DepMap | Descartes | 0.01 | 0.31 |
| FREM1 | -0.0002931 | 7742 | GTEx | DepMap | Descartes | 0.01 | 0.16 |
| COL27A1 | -0.0002967 | 7814 | GTEx | DepMap | Descartes | 0.07 | 2.08 |
| ABCC9 | -0.0003160 | 8233 | GTEx | DepMap | Descartes | 0.04 | 1.21 |
| CLDN11 | -0.0003231 | 8382 | GTEx | DepMap | Descartes | 0.02 | 2.77 |
| ABCA6 | -0.0003555 | 9030 | GTEx | DepMap | Descartes | 0.06 | 3.12 |
| IGFBP3 | -0.0003666 | 9214 | GTEx | DepMap | Descartes | 0.72 | 45.34 |
| ADAMTS2 | -0.0003788 | 9440 | GTEx | DepMap | Descartes | 0.13 | 4.93 |
| PCDH18 | -0.0003830 | 9518 | GTEx | DepMap | Descartes | 0.03 | 0.85 |
| ACTA2 | -0.0003842 | 9542 | GTEx | DepMap | Descartes | 0.45 | 78.68 |
| EDNRA | -0.0003845 | 9547 | GTEx | DepMap | Descartes | 0.07 | 3.18 |
| PRICKLE1 | -0.0003988 | 9763 | GTEx | DepMap | Descartes | 0.02 | 0.86 |
| BICC1 | -0.0004237 | 10112 | GTEx | DepMap | Descartes | 0.07 | 3.00 |
| PAMR1 | -0.0004272 | 10152 | GTEx | DepMap | Descartes | 0.11 | 5.61 |
| C7 | -0.0004304 | 10187 | GTEx | DepMap | Descartes | 2.47 | 84.04 |
| CD248 | -0.0004461 | 10414 | GTEx | DepMap | Descartes | 0.05 | 3.37 |
| PDGFRA | -0.0004493 | 10469 | GTEx | DepMap | Descartes | 0.17 | 5.72 |
| LOX | -0.0004537 | 10512 | GTEx | DepMap | Descartes | 0.11 | 4.78 |
| SCARA5 | -0.0005195 | 11184 | GTEx | DepMap | Descartes | 0.02 | 1.82 |
| SFRP2 | -0.0005242 | 11237 | GTEx | DepMap | Descartes | 0.44 | 45.59 |
| ELN | -0.0005289 | 11271 | GTEx | DepMap | Descartes | 0.26 | 15.02 |
Descartes sympathoblasts markers
Top 50 marker genes of sympathoblasts cells in the Decartes fetal adrenal single cell map (https://atlas.brotmanbaty.org/bbi/human-gene-expression-during-development/cell/sympathoblasts/in/adrenal)
Wilcoxon ranksum test P-value for gene set overrepresentation: 8.01e-02
Mean rank of genes in gene set: 5450.76
Median rank of genes in gene set: 5687
Rank on gene expression program of top 30 genes in gene set:
| Genes | Weight | Rank | GTEx | DepMap | Descartes | Mean.Counts | Mean.TPM |
|---|---|---|---|---|---|---|---|
| GCH1 | 0.0018391 | 254 | GTEx | DepMap | Descartes | 1.40 | 168.38 |
| TIAM1 | 0.0009200 | 510 | GTEx | DepMap | Descartes | 0.72 | 39.56 |
| ST18 | 0.0009095 | 516 | GTEx | DepMap | Descartes | 0.08 | 5.89 |
| TBX20 | 0.0000731 | 1574 | GTEx | DepMap | Descartes | 0.00 | 0.00 |
| SORCS3 | 0.0000326 | 1753 | GTEx | DepMap | Descartes | 0.00 | 0.26 |
| SPOCK3 | -0.0000022 | 2023 | GTEx | DepMap | Descartes | 0.00 | 0.25 |
| PACRG | -0.0000196 | 2186 | GTEx | DepMap | Descartes | 0.00 | 0.00 |
| SLC24A2 | -0.0000259 | 2250 | GTEx | DepMap | Descartes | 0.00 | 0.05 |
| CCSER1 | -0.0000668 | 2836 | GTEx | DepMap | Descartes | 0.03 | NA |
| CDH18 | -0.0000823 | 3129 | GTEx | DepMap | Descartes | 0.00 | 0.00 |
| AGBL4 | -0.0000980 | 3416 | GTEx | DepMap | Descartes | 0.00 | 0.00 |
| PENK | -0.0001079 | 3612 | GTEx | DepMap | Descartes | 0.01 | 14.17 |
| GALNTL6 | -0.0001098 | 3652 | GTEx | DepMap | Descartes | 0.00 | 0.00 |
| CDH12 | -0.0001182 | 3832 | GTEx | DepMap | Descartes | 0.00 | 0.00 |
| GRM7 | -0.0001217 | 3912 | GTEx | DepMap | Descartes | 0.00 | 0.26 |
| PCSK2 | -0.0001255 | 3990 | GTEx | DepMap | Descartes | 0.01 | 1.07 |
| SLC35F3 | -0.0001289 | 4061 | GTEx | DepMap | Descartes | 0.00 | 0.00 |
| GRID2 | -0.0001358 | 4217 | GTEx | DepMap | Descartes | 0.00 | 0.06 |
| DGKK | -0.0001992 | 5656 | GTEx | DepMap | Descartes | 0.00 | 0.00 |
| CNTN3 | -0.0002022 | 5718 | GTEx | DepMap | Descartes | 0.00 | 0.00 |
| LAMA3 | -0.0002125 | 5931 | GTEx | DepMap | Descartes | 0.01 | 0.33 |
| KSR2 | -0.0002159 | 6010 | GTEx | DepMap | Descartes | 0.00 | 0.13 |
| MGAT4C | -0.0002170 | 6045 | GTEx | DepMap | Descartes | 0.01 | 0.07 |
| NTNG1 | -0.0002301 | 6333 | GTEx | DepMap | Descartes | 0.00 | 0.20 |
| SLC18A1 | -0.0002391 | 6566 | GTEx | DepMap | Descartes | 0.00 | 0.11 |
| UNC80 | -0.0002406 | 6593 | GTEx | DepMap | Descartes | 0.04 | 0.91 |
| FGF14 | -0.0002415 | 6612 | GTEx | DepMap | Descartes | 0.00 | 0.05 |
| EML6 | -0.0002487 | 6780 | GTEx | DepMap | Descartes | 0.00 | 0.17 |
| KCTD16 | -0.0002730 | 7312 | GTEx | DepMap | Descartes | 0.00 | 0.00 |
| CHGB | -0.0003291 | 8505 | GTEx | DepMap | Descartes | 0.12 | 18.32 |
Descartes erythroblasts markers
Top 50 marker genes of erythroblasts cells in the Decartes fetal adrenal single cell map (https://atlas.brotmanbaty.org/bbi/human-gene-expression-during-development/cell/erythroblasts/in/adrenal)
Wilcoxon ranksum test P-value for gene set overrepresentation: 5.75e-02
Mean rank of genes in gene set: 5216.21
Median rank of genes in gene set: 5318
Rank on gene expression program of top 30 genes in gene set:
| Genes | Weight | Rank | GTEx | DepMap | Descartes | Mean.Counts | Mean.TPM |
|---|---|---|---|---|---|---|---|
| RAPGEF2 | 0.0029553 | 138 | GTEx | DepMap | Descartes | 1.86 | 89.80 |
| SLC25A37 | 0.0008823 | 530 | GTEx | DepMap | Descartes | 1.26 | 127.58 |
| BLVRB | 0.0006109 | 680 | GTEx | DepMap | Descartes | 0.60 | 125.44 |
| GYPC | 0.0005112 | 764 | GTEx | DepMap | Descartes | 0.68 | 113.58 |
| DENND4A | 0.0004120 | 885 | GTEx | DepMap | Descartes | 1.16 | 44.26 |
| GCLC | 0.0001996 | 1221 | GTEx | DepMap | Descartes | 0.36 | 31.20 |
| SNCA | 0.0001702 | 1281 | GTEx | DepMap | Descartes | 0.08 | 6.86 |
| ALAS2 | -0.0000596 | 2731 | GTEx | DepMap | Descartes | 0.00 | 0.00 |
| TMCC2 | -0.0000734 | 2948 | GTEx | DepMap | Descartes | 0.03 | 1.77 |
| SLC4A1 | -0.0000742 | 2962 | GTEx | DepMap | Descartes | 0.00 | 0.00 |
| SLC25A21 | -0.0000957 | 3374 | GTEx | DepMap | Descartes | 0.00 | 0.00 |
| TFR2 | -0.0001010 | 3458 | GTEx | DepMap | Descartes | 0.00 | 0.35 |
| RHD | -0.0001185 | 3836 | GTEx | DepMap | Descartes | 0.00 | 0.00 |
| SPECC1 | -0.0001298 | 4078 | GTEx | DepMap | Descartes | 0.12 | 5.36 |
| MARCH3 | -0.0001850 | 5318 | GTEx | DepMap | Descartes | 0.14 | NA |
| SPTB | -0.0002072 | 5834 | GTEx | DepMap | Descartes | 0.01 | 0.23 |
| RGS6 | -0.0002226 | 6164 | GTEx | DepMap | Descartes | 0.00 | 0.00 |
| SELENBP1 | -0.0002262 | 6247 | GTEx | DepMap | Descartes | 0.04 | 3.87 |
| TRAK2 | -0.0002363 | 6497 | GTEx | DepMap | Descartes | 0.12 | 7.40 |
| ANK1 | -0.0002778 | 7411 | GTEx | DepMap | Descartes | 0.01 | 0.13 |
| CAT | -0.0003062 | 8014 | GTEx | DepMap | Descartes | 0.35 | 51.62 |
| MICAL2 | -0.0003204 | 8321 | GTEx | DepMap | Descartes | 0.29 | 10.27 |
| CPOX | -0.0003230 | 8377 | GTEx | DepMap | Descartes | 0.04 | 3.55 |
| SOX6 | -0.0003632 | 9166 | GTEx | DepMap | Descartes | 0.01 | 0.64 |
| FECH | -0.0003641 | 9181 | GTEx | DepMap | Descartes | 0.02 | 1.14 |
| ABCB10 | -0.0003802 | 9466 | GTEx | DepMap | Descartes | 0.04 | 1.90 |
| XPO7 | -0.0004221 | 10088 | GTEx | DepMap | Descartes | 0.06 | 3.90 |
| EPB41 | -0.0005145 | 11138 | GTEx | DepMap | Descartes | 0.09 | 3.86 |
| TSPAN5 | -0.0005174 | 11162 | GTEx | DepMap | Descartes | 0.04 | 3.74 |
| NA | NA | NA | NA | NA | NA | NA | NA |
Descartes myeloid markers
Top 50 marker genes of myeloid cells in the Decartes fetal adrenal single cell map (https://atlas.brotmanbaty.org/bbi/human-gene-expression-during-development/cell/myeloid/in/adrenal)
Wilcoxon ranksum test P-value for gene set overrepresentation: 1.86e-06
Mean rank of genes in gene set: 3560.47
Median rank of genes in gene set: 692.5
Rank on gene expression program of top 30 genes in gene set:
| Genes | Weight | Rank | GTEx | DepMap | Descartes | Mean.Counts | Mean.TPM |
|---|---|---|---|---|---|---|---|
| MSR1 | 0.0040565 | 73 | GTEx | DepMap | Descartes | 1.56 | 156.66 |
| HCK | 0.0039768 | 75 | GTEx | DepMap | Descartes | 2.37 | 345.64 |
| SLC1A3 | 0.0032254 | 117 | GTEx | DepMap | Descartes | 0.91 | 71.22 |
| CTSB | 0.0031743 | 120 | GTEx | DepMap | Descartes | 13.95 | 1080.85 |
| CD163 | 0.0024781 | 175 | GTEx | DepMap | Descartes | 2.32 | 131.59 |
| ABCA1 | 0.0022921 | 203 | GTEx | DepMap | Descartes | 2.61 | 90.71 |
| CD74 | 0.0021026 | 219 | GTEx | DepMap | Descartes | 101.44 | 10140.78 |
| ATP8B4 | 0.0019893 | 233 | GTEx | DepMap | Descartes | 0.41 | 23.98 |
| CTSS | 0.0017062 | 280 | GTEx | DepMap | Descartes | 5.69 | 465.08 |
| MS4A4A | 0.0016281 | 293 | GTEx | DepMap | Descartes | 1.26 | 215.22 |
| CSF1R | 0.0014094 | 341 | GTEx | DepMap | Descartes | 1.57 | 113.69 |
| LGMN | 0.0013869 | 345 | GTEx | DepMap | Descartes | 3.38 | 419.20 |
| CYBB | 0.0013072 | 363 | GTEx | DepMap | Descartes | 1.82 | 140.86 |
| CTSD | 0.0011955 | 399 | GTEx | DepMap | Descartes | 9.98 | 1160.70 |
| TGFBI | 0.0011600 | 416 | GTEx | DepMap | Descartes | 3.31 | 242.49 |
| FGL2 | 0.0008604 | 545 | GTEx | DepMap | Descartes | 3.18 | 225.03 |
| SLC9A9 | 0.0007776 | 585 | GTEx | DepMap | Descartes | 0.34 | 24.64 |
| SPP1 | 0.0007428 | 600 | GTEx | DepMap | Descartes | 0.60 | 138.41 |
| FMN1 | 0.0006971 | 633 | GTEx | DepMap | Descartes | 0.31 | 8.14 |
| SLCO2B1 | 0.0005232 | 752 | GTEx | DepMap | Descartes | 0.99 | 50.87 |
| ITPR2 | 0.0004151 | 880 | GTEx | DepMap | Descartes | 0.62 | 19.17 |
| RGL1 | 0.0003578 | 959 | GTEx | DepMap | Descartes | 0.59 | 44.42 |
| CD14 | 0.0001723 | 1276 | GTEx | DepMap | Descartes | 2.21 | 428.82 |
| CPVL | 0.0000570 | 1636 | GTEx | DepMap | Descartes | 1.75 | 220.62 |
| PTPRE | 0.0000229 | 1829 | GTEx | DepMap | Descartes | 1.07 | 71.16 |
| MARCH1 | -0.0000954 | 3368 | GTEx | DepMap | Descartes | 0.33 | NA |
| CST3 | -0.0001791 | 5181 | GTEx | DepMap | Descartes | 11.53 | 1024.94 |
| AXL | -0.0002276 | 6270 | GTEx | DepMap | Descartes | 1.00 | 65.52 |
| HRH1 | -0.0002514 | 6838 | GTEx | DepMap | Descartes | 0.09 | 3.73 |
| SFMBT2 | -0.0002739 | 7331 | GTEx | DepMap | Descartes | 0.32 | 15.17 |
Descartes Schwann markers
Top 50 marker genes of Schwann cells in the Decartes fetal adrenal single cell map (https://atlas.brotmanbaty.org/bbi/human-gene-expression-during-development/cell/schwann/in/adrenal)
Wilcoxon ranksum test P-value for gene set overrepresentation: 9.88e-01
Mean rank of genes in gene set: 7505.89
Median rank of genes in gene set: 7567.5
Rank on gene expression program of top 30 genes in gene set:
| Genes | Weight | Rank | GTEx | DepMap | Descartes | Mean.Counts | Mean.TPM |
|---|---|---|---|---|---|---|---|
| MARCKS | 0.0047773 | 52 | GTEx | DepMap | Descartes | 12.39 | 1080.08 |
| VIM | 0.0011524 | 420 | GTEx | DepMap | Descartes | 26.39 | 3235.77 |
| KCTD12 | 0.0007446 | 599 | GTEx | DepMap | Descartes | 1.76 | 84.13 |
| LRRTM4 | -0.0000528 | 2602 | GTEx | DepMap | Descartes | 0.00 | 0.00 |
| IL1RAPL2 | -0.0000573 | 2684 | GTEx | DepMap | Descartes | 0.00 | 0.00 |
| ERBB4 | -0.0000778 | 3040 | GTEx | DepMap | Descartes | 0.01 | 0.13 |
| MPZ | -0.0001084 | 3622 | GTEx | DepMap | Descartes | 0.03 | 7.45 |
| PAG1 | -0.0001212 | 3896 | GTEx | DepMap | Descartes | 0.90 | 27.90 |
| PMP22 | -0.0001356 | 4213 | GTEx | DepMap | Descartes | 0.57 | 109.24 |
| TRPM3 | -0.0001537 | 4620 | GTEx | DepMap | Descartes | 0.01 | 0.10 |
| MDGA2 | -0.0001681 | 4920 | GTEx | DepMap | Descartes | 0.00 | 0.00 |
| IL1RAPL1 | -0.0001986 | 5641 | GTEx | DepMap | Descartes | 0.00 | 0.00 |
| XKR4 | -0.0002034 | 5755 | GTEx | DepMap | Descartes | 0.03 | 0.48 |
| GRIK3 | -0.0002080 | 5849 | GTEx | DepMap | Descartes | 0.01 | 0.46 |
| HMGA2 | -0.0002093 | 5874 | GTEx | DepMap | Descartes | 0.01 | 0.50 |
| PTN | -0.0002267 | 6254 | GTEx | DepMap | Descartes | 0.04 | 4.94 |
| COL25A1 | -0.0002484 | 6772 | GTEx | DepMap | Descartes | 0.00 | 0.00 |
| SLC35F1 | -0.0002506 | 6816 | GTEx | DepMap | Descartes | 0.01 | 0.73 |
| GAS7 | -0.0002647 | 7123 | GTEx | DepMap | Descartes | 0.59 | 25.99 |
| PLCE1 | -0.0002679 | 7200 | GTEx | DepMap | Descartes | 0.02 | 0.32 |
| SOX5 | -0.0002785 | 7430 | GTEx | DepMap | Descartes | 0.00 | 0.00 |
| PTPRZ1 | -0.0002791 | 7441 | GTEx | DepMap | Descartes | 0.01 | 0.15 |
| EGFLAM | -0.0002905 | 7694 | GTEx | DepMap | Descartes | 0.06 | 2.35 |
| ADAMTS5 | -0.0002911 | 7701 | GTEx | DepMap | Descartes | 0.00 | 0.22 |
| FIGN | -0.0003128 | 8165 | GTEx | DepMap | Descartes | 0.02 | 0.42 |
| GFRA3 | -0.0003268 | 8463 | GTEx | DepMap | Descartes | 0.03 | 5.87 |
| ERBB3 | -0.0003539 | 9004 | GTEx | DepMap | Descartes | 0.02 | 1.87 |
| STARD13 | -0.0003609 | 9124 | GTEx | DepMap | Descartes | 0.12 | 6.01 |
| NRXN3 | -0.0003639 | 9177 | GTEx | DepMap | Descartes | 0.01 | 0.16 |
| EDNRB | -0.0003814 | 9489 | GTEx | DepMap | Descartes | 0.08 | 5.78 |
Descartes Megakaryocytes markers
Top 50 marker genes of Megakaryocytes cells in the Decartes fetal adrenal single cell map (https://atlas.brotmanbaty.org/bbi/human-gene-expression-during-development/cell/megakaryocytes/in/adrenal)
Wilcoxon ranksum test P-value for gene set overrepresentation: 9.10e-02
Mean rank of genes in gene set: 5555.42
Median rank of genes in gene set: 4476
Rank on gene expression program of top 30 genes in gene set:
| Genes | Weight | Rank | GTEx | DepMap | Descartes | Mean.Counts | Mean.TPM |
|---|---|---|---|---|---|---|---|
| PLEK | 0.0089749 | 5 | GTEx | DepMap | Descartes | 9.32 | 1249.23 |
| PSTPIP2 | 0.0051838 | 40 | GTEx | DepMap | Descartes | 0.79 | 82.96 |
| LIMS1 | 0.0023059 | 199 | GTEx | DepMap | Descartes | 3.48 | 288.44 |
| THBS1 | 0.0018922 | 248 | GTEx | DepMap | Descartes | 15.75 | 810.73 |
| CD84 | 0.0018195 | 255 | GTEx | DepMap | Descartes | 1.72 | 73.77 |
| FERMT3 | 0.0015561 | 302 | GTEx | DepMap | Descartes | 0.90 | 145.12 |
| FLNA | 0.0008746 | 534 | GTEx | DepMap | Descartes | 4.27 | 179.91 |
| MCTP1 | 0.0005852 | 700 | GTEx | DepMap | Descartes | 0.61 | 36.43 |
| RAP1B | 0.0005392 | 737 | GTEx | DepMap | Descartes | 1.34 | 38.26 |
| STOM | 0.0001454 | 1341 | GTEx | DepMap | Descartes | 1.54 | 161.74 |
| CD9 | 0.0001063 | 1457 | GTEx | DepMap | Descartes | 0.87 | 132.39 |
| UBASH3B | 0.0000286 | 1783 | GTEx | DepMap | Descartes | 0.38 | 14.08 |
| ACTN1 | -0.0000223 | 2219 | GTEx | DepMap | Descartes | 1.74 | 131.96 |
| GP1BA | -0.0000341 | 2338 | GTEx | DepMap | Descartes | 0.02 | 2.26 |
| HIPK2 | -0.0000424 | 2442 | GTEx | DepMap | Descartes | 0.78 | 17.37 |
| P2RX1 | -0.0000635 | 2790 | GTEx | DepMap | Descartes | 0.06 | 9.91 |
| TUBB1 | -0.0000780 | 3042 | GTEx | DepMap | Descartes | 0.02 | 3.10 |
| ITGB3 | -0.0000803 | 3089 | GTEx | DepMap | Descartes | 0.00 | 0.28 |
| ITGA2B | -0.0001025 | 3495 | GTEx | DepMap | Descartes | 0.01 | 0.35 |
| TPM4 | -0.0001108 | 3678 | GTEx | DepMap | Descartes | 2.02 | 125.65 |
| TRPC6 | -0.0001120 | 3704 | GTEx | DepMap | Descartes | 0.00 | 0.17 |
| ARHGAP6 | -0.0001145 | 3760 | GTEx | DepMap | Descartes | 0.00 | 0.07 |
| MED12L | -0.0001477 | 4476 | GTEx | DepMap | Descartes | 0.01 | 0.43 |
| ANGPT1 | -0.0001649 | 4852 | GTEx | DepMap | Descartes | 0.02 | 1.74 |
| TLN1 | -0.0001798 | 5197 | GTEx | DepMap | Descartes | 1.78 | 61.34 |
| DOK6 | -0.0002115 | 5913 | GTEx | DepMap | Descartes | 0.01 | 0.23 |
| RAB27B | -0.0002187 | 6079 | GTEx | DepMap | Descartes | 0.00 | 0.11 |
| TGFB1 | -0.0002304 | 6337 | GTEx | DepMap | Descartes | 0.68 | 87.39 |
| MMRN1 | -0.0002557 | 6933 | GTEx | DepMap | Descartes | 0.00 | 0.05 |
| SLC24A3 | -0.0002760 | 7373 | GTEx | DepMap | Descartes | 0.00 | 0.00 |
Descartes Lyphoid markers
Top 50 marker genes of Lyphoid cells in the Decartes fetal adrenal single cell map (https://atlas.brotmanbaty.org/bbi/human-gene-expression-during-development/cell/lymphoid/in/adrenal)
Wilcoxon ranksum test P-value for gene set overrepresentation: 1.00e+00
Mean rank of genes in gene set: 9306.98
Median rank of genes in gene set: 11078
Rank on gene expression program of top 30 genes in gene set:
| Genes | Weight | Rank | GTEx | DepMap | Descartes | Mean.Counts | Mean.TPM |
|---|---|---|---|---|---|---|---|
| CD44 | 0.0061398 | 25 | GTEx | DepMap | Descartes | 17.01 | 1240.01 |
| RCSD1 | 0.0017536 | 268 | GTEx | DepMap | Descartes | 0.68 | 43.86 |
| SORL1 | 0.0010132 | 471 | GTEx | DepMap | Descartes | 1.38 | 41.94 |
| BCL2 | 0.0008274 | 559 | GTEx | DepMap | Descartes | 0.85 | 35.23 |
| ITPKB | 0.0005902 | 696 | GTEx | DepMap | Descartes | 1.04 | 57.35 |
| MSN | 0.0004064 | 891 | GTEx | DepMap | Descartes | 2.12 | 186.17 |
| LCP1 | -0.0000872 | 3216 | GTEx | DepMap | Descartes | 3.63 | 308.96 |
| MCTP2 | -0.0001076 | 3607 | GTEx | DepMap | Descartes | 0.09 | 6.92 |
| NCALD | -0.0003417 | 8763 | GTEx | DepMap | Descartes | 0.02 | 1.73 |
| DOCK10 | -0.0003562 | 9039 | GTEx | DepMap | Descartes | 0.35 | 15.69 |
| ARHGAP15 | -0.0003587 | 9080 | GTEx | DepMap | Descartes | 0.18 | 22.68 |
| SCML4 | -0.0003598 | 9103 | GTEx | DepMap | Descartes | 0.00 | 0.00 |
| SAMD3 | -0.0003712 | 9297 | GTEx | DepMap | Descartes | 0.00 | 0.46 |
| TOX | -0.0004079 | 9900 | GTEx | DepMap | Descartes | 0.00 | 0.41 |
| PITPNC1 | -0.0004147 | 9983 | GTEx | DepMap | Descartes | 0.26 | 18.73 |
| SKAP1 | -0.0004365 | 10281 | GTEx | DepMap | Descartes | 0.00 | 0.49 |
| PRKCH | -0.0004656 | 10655 | GTEx | DepMap | Descartes | 0.20 | 19.55 |
| PLEKHA2 | -0.0004687 | 10694 | GTEx | DepMap | Descartes | 0.64 | 40.37 |
| CCL5 | -0.0004734 | 10745 | GTEx | DepMap | Descartes | 0.66 | 139.12 |
| B2M | -0.0004787 | 10799 | GTEx | DepMap | Descartes | 39.38 | 5274.18 |
| RAP1GAP2 | -0.0004926 | 10938 | GTEx | DepMap | Descartes | 0.04 | 2.90 |
| STK39 | -0.0005219 | 11218 | GTEx | DepMap | Descartes | 0.04 | 2.83 |
| BACH2 | -0.0005254 | 11248 | GTEx | DepMap | Descartes | 0.05 | 1.83 |
| IKZF1 | -0.0005348 | 11326 | GTEx | DepMap | Descartes | 0.35 | 19.12 |
| GNG2 | -0.0005351 | 11330 | GTEx | DepMap | Descartes | 0.33 | 28.76 |
| WIPF1 | -0.0005552 | 11510 | GTEx | DepMap | Descartes | 0.87 | 67.07 |
| PDE3B | -0.0005570 | 11520 | GTEx | DepMap | Descartes | 0.07 | 3.09 |
| ANKRD44 | -0.0005697 | 11620 | GTEx | DepMap | Descartes | 0.16 | 9.27 |
| LEF1 | -0.0005963 | 11748 | GTEx | DepMap | Descartes | 0.03 | 3.93 |
| CCND3 | -0.0006352 | 11937 | GTEx | DepMap | Descartes | 0.08 | 10.66 |
Below shows the ranks on this GEP for immune marker gene lists curated by CellTypist (https://www.celltypist.org/encyclopedia).
High ranks indicate this gene is a driver of this GEP.
These curated gene list are ranked by P-value (on this GEP) of their constituent genes.
The Mean Count column shows the mean read count in cells scoring highly (H > 50) on this gene expression program.
Monocytes: Monocytes (model markers)
myeloid mononuclear recirculating leukocytes that are capable of differentiating into macrophages and myeloid lineage dendritic cells:
Wilcoxon ranksum test P-value for gene set overrepresentation: 1.67e-03
Mean rank of genes in gene set: 139
Rank on gene expression program of genes in gene set:
| Genes | Weight | Rank | GTEx | DepMap | Decartes | Mean.Counts | Mean.TPM |
|---|---|---|---|---|---|---|---|
| SAT1 | 0.0054523 | 37 | GTEx | DepMap | Descartes | 29.57 | 9034.88 |
| NEAT1 | 0.0029588 | 137 | GTEx | DepMap | Descartes | 50.15 | 935.15 |
| TYROBP | 0.0019281 | 243 | GTEx | DepMap | Descartes | 9.44 | 5094.91 |
ILC precursor: ILC precursor (curated markers)
innate lymphoid cell precursors which give rise to innate lymphoid cells and lack the characteristics of their mature progenies:
Wilcoxon ranksum test P-value for gene set overrepresentation: 2.92e-03
Mean rank of genes in gene set: 509.67
Rank on gene expression program of genes in gene set:
| Genes | Weight | Rank | GTEx | DepMap | Decartes | Mean.Counts | Mean.TPM |
|---|---|---|---|---|---|---|---|
| SCN1B | 0.0020413 | 229 | GTEx | DepMap | Descartes | 0.43 | 25.37 |
| HPN | 0.0009864 | 484 | GTEx | DepMap | Descartes | 0.05 | 6.64 |
| LST1 | 0.0004643 | 816 | GTEx | DepMap | Descartes | 1.01 | 179.26 |
T cells: T(agonist) (curated markers)
unconventional T cell subpopulation in the thymus which expresses MIR155HG and shares some signatures with differentiating regulatory T cells:
Wilcoxon ranksum test P-value for gene set overrepresentation: 5.04e-03
Mean rank of genes in gene set: 894.33
Rank on gene expression program of genes in gene set:
| Genes | Weight | Rank | GTEx | DepMap | Decartes | Mean.Counts | Mean.TPM |
|---|---|---|---|---|---|---|---|
| MIR155HG | 0.0079699 | 9 | GTEx | DepMap | Descartes | 3.67 | 829.88 |
| SMS | 0.0021501 | 216 | GTEx | DepMap | Descartes | 1.21 | 225.83 |
| BIRC3 | -0.0000438 | 2458 | GTEx | DepMap | Descartes | 4.48 | 242.23 |