Program: 6. Cancer Associated Fibroblast: Intermediate [Inf:AP].
Program description and justification of annotation: 6.
Submit a comment on this gene expression program’s interpretation: CLICK
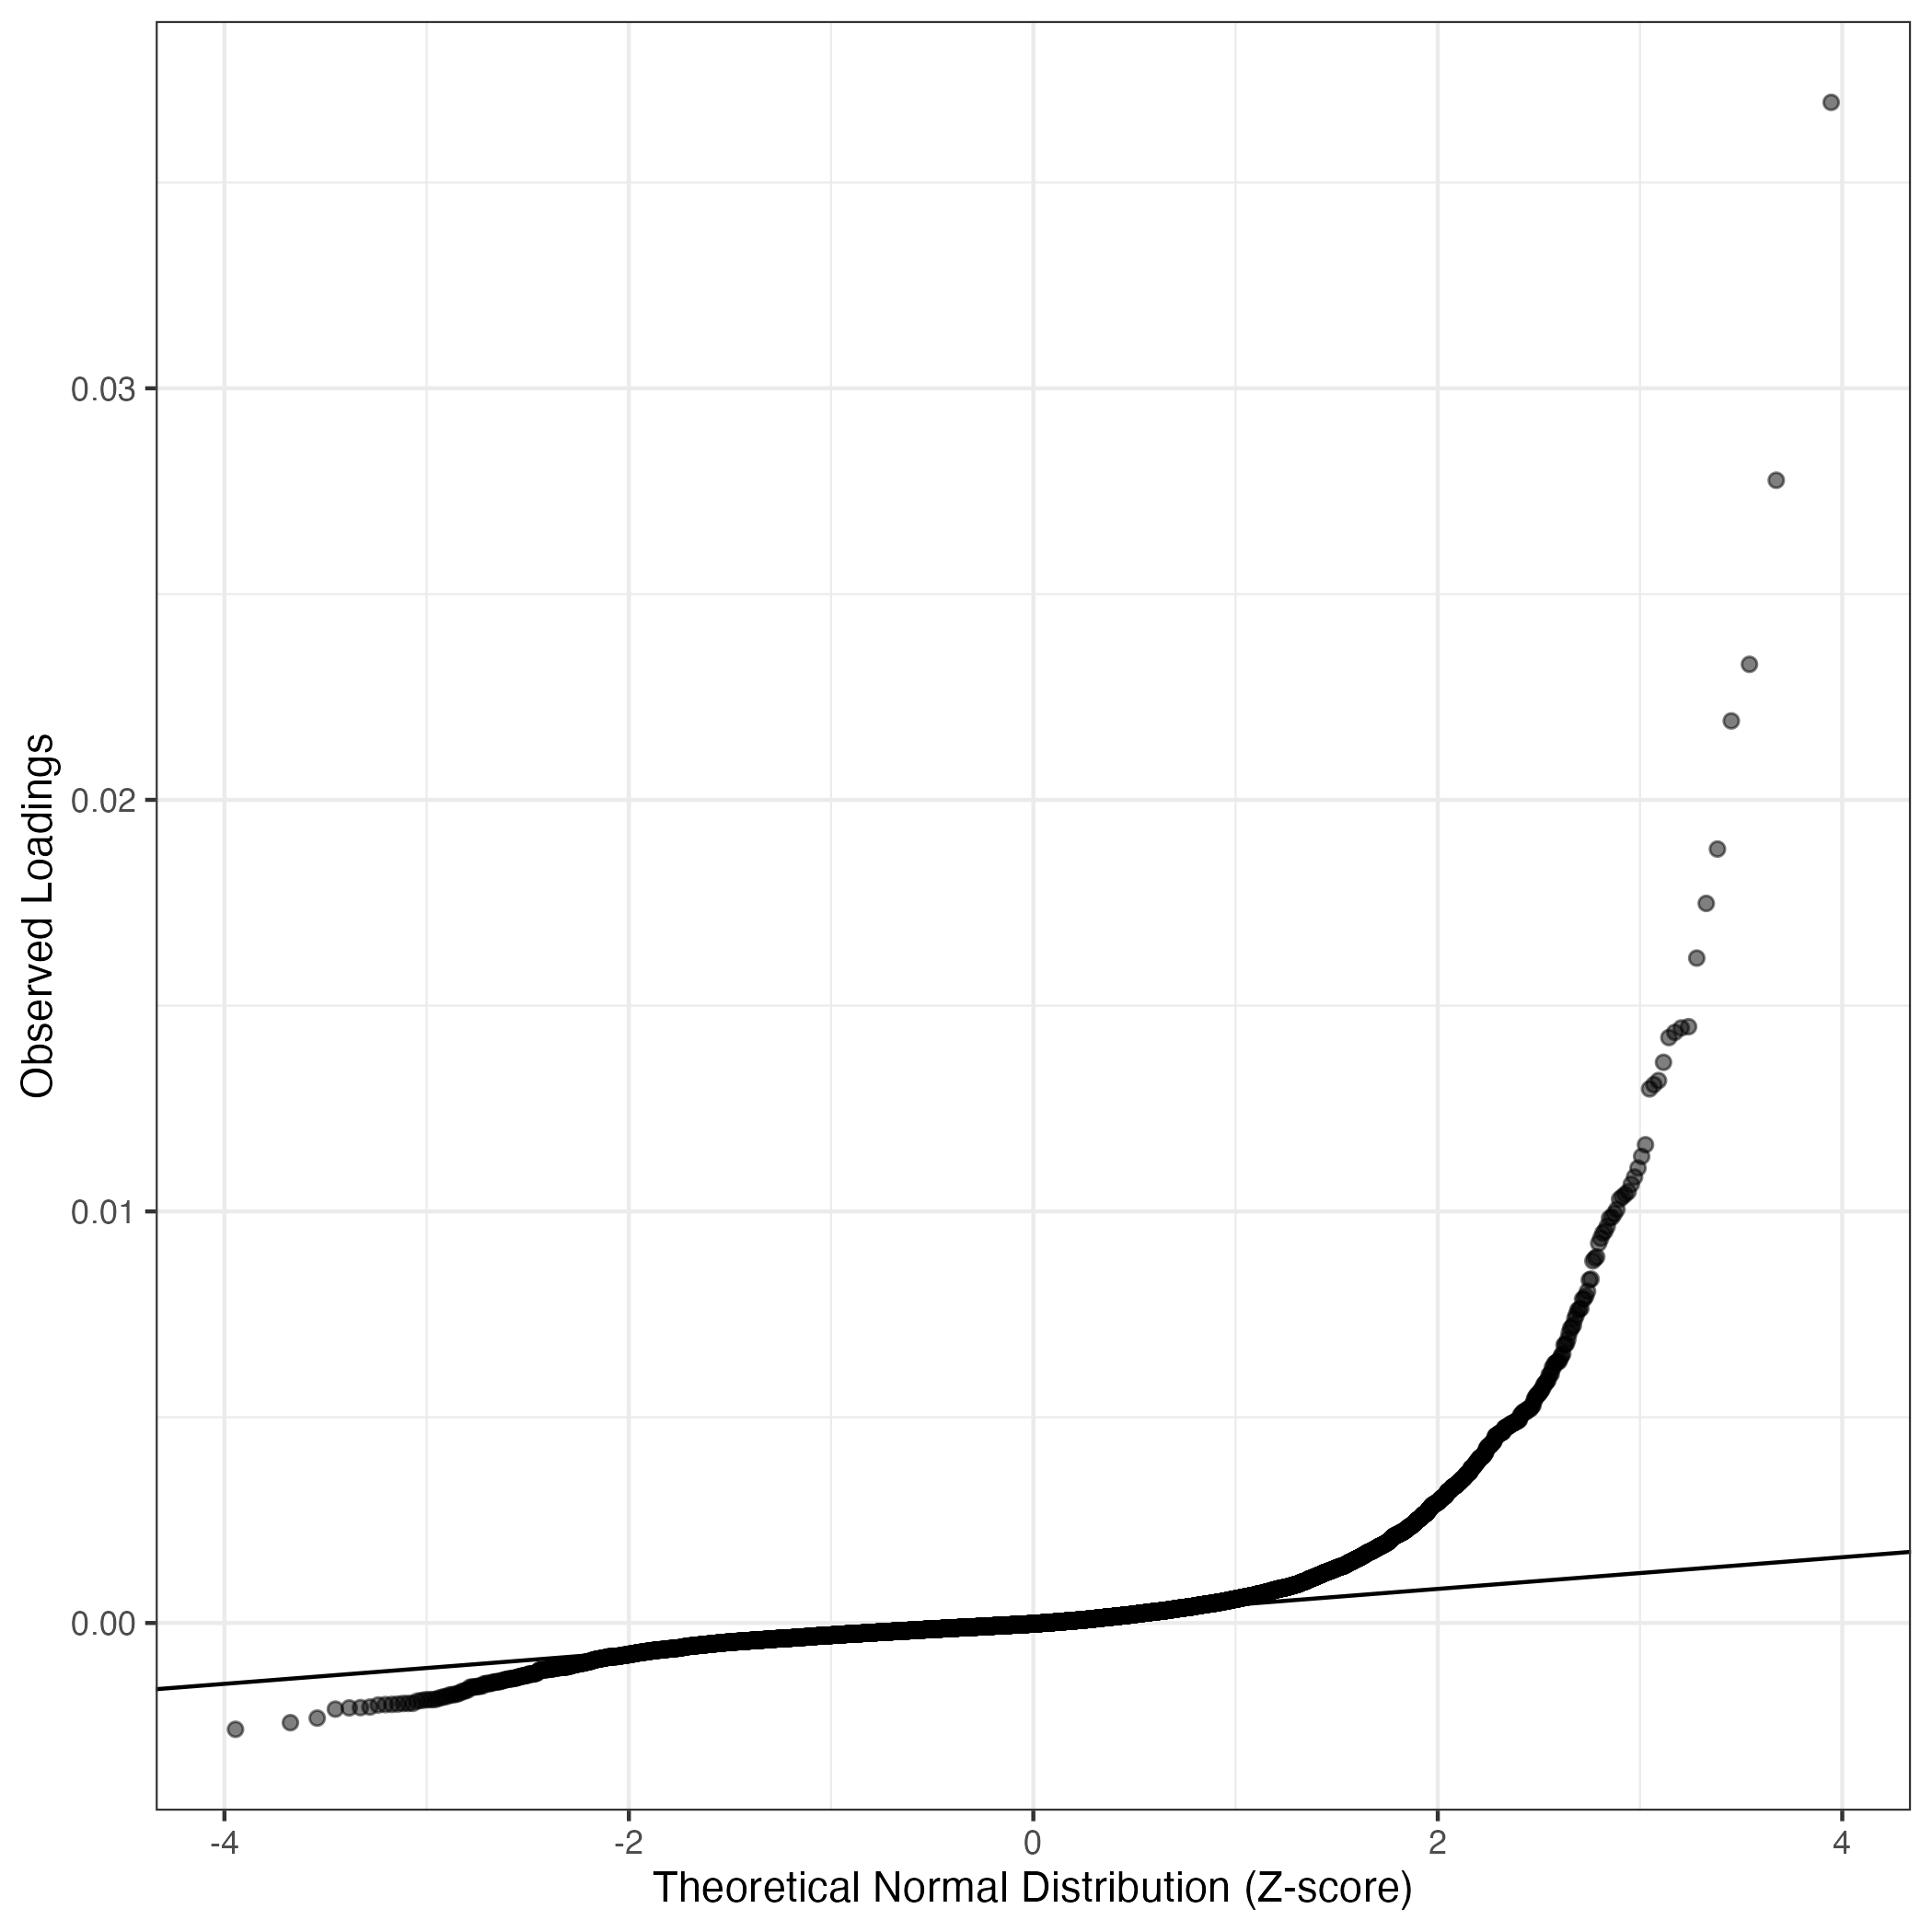
QQ-plot of gene loadings, averaged over both independent splits of the data
This plot highlights the relative contribution of each gene to the GEP
Top genes driving this program.
Note: Decartes website is buggy, try refreshing. Also, Decartes fetal adrenal data have been collected at specific time points (89-122 days), all possible cell types of interest may not be represented, do not overinterpret.
The Mean Count column shows the mean read count in cells scoring highly (H > 50) on this gene expression program.
| Gene | Loading | Gene.Name | GTEx | DepMap | Descartes | Mean.Counts | Mean.Tpm | |
|---|---|---|---|---|---|---|---|---|
| 1 | BICC1 | 0.0369479 | BicC family RNA binding protein 1 | GTEx | DepMap | Descartes | 4.36 | 3517.55 |
| 2 | PKHD1 | 0.0277657 | PKHD1 ciliary IPT domain containing fibrocystin/polyductin | GTEx | DepMap | Descartes | 1.27 | 379.69 |
| 3 | ANKRD1 | 0.0232933 | ankyrin repeat domain 1 | GTEx | DepMap | Descartes | 0.38 | 1078.91 |
| 4 | ELF3 | 0.0219177 | E74 like ETS transcription factor 3 | GTEx | DepMap | Descartes | 0.73 | 723.61 |
| 5 | SDR42E1 | 0.0188045 | short chain dehydrogenase/reductase family 42E, member 1 | GTEx | DepMap | Descartes | 0.00 | 0.00 |
| 6 | KRT18 | 0.0174844 | keratin 18 | GTEx | DepMap | Descartes | 0.88 | 1669.47 |
| 7 | CXCL2 | 0.0161554 | C-X-C motif chemokine ligand 2 | GTEx | DepMap | Descartes | 0.42 | 1476.53 |
| 8 | GLIS3 | 0.0144890 | GLIS family zinc finger 3 | GTEx | DepMap | Descartes | 1.03 | 562.11 |
| 9 | C3 | 0.0144585 | complement C3 | GTEx | DepMap | Descartes | 2.28 | 1947.58 |
| 10 | DEFB1 | 0.0143510 | defensin beta 1 | GTEx | DepMap | Descartes | 0.26 | 2705.81 |
| 11 | ABCC3 | 0.0142238 | ATP binding cassette subfamily C member 3 | GTEx | DepMap | Descartes | 0.78 | 622.07 |
| 12 | TM4SF4 | 0.0136228 | transmembrane 4 L six family member 4 | GTEx | DepMap | Descartes | 0.57 | 1388.98 |
| 13 | RASEF | 0.0131801 | RAS and EF-hand domain containing | GTEx | DepMap | Descartes | 0.18 | 130.50 |
| 14 | KRT8 | 0.0130800 | keratin 8 | GTEx | DepMap | Descartes | 0.56 | 791.55 |
| 15 | ACSM3 | 0.0129766 | acyl-CoA synthetase medium chain family member 3 | GTEx | DepMap | Descartes | 0.32 | 465.25 |
| 16 | HNF1B | 0.0116198 | HNF1 homeobox B | GTEx | DepMap | Descartes | 0.12 | 143.96 |
| 17 | CLDN1 | 0.0113368 | claudin 1 | GTEx | DepMap | Descartes | 0.30 | 339.41 |
| 18 | DOCK5 | 0.0110541 | dedicator of cytokinesis 5 | GTEx | DepMap | Descartes | 0.52 | 225.31 |
| 19 | KRT7 | 0.0108366 | keratin 7 | GTEx | DepMap | Descartes | 0.11 | 277.66 |
| 20 | IL1RAP | 0.0106606 | interleukin 1 receptor accessory protein | GTEx | DepMap | Descartes | 0.27 | 190.33 |
| 21 | KIFC3 | 0.0104793 | kinesin family member C3 | GTEx | DepMap | Descartes | 0.36 | 533.68 |
| 22 | NNMT | 0.0104140 | nicotinamide N-methyltransferase | GTEx | DepMap | Descartes | 0.73 | 1529.76 |
| 23 | SAMD12 | 0.0103534 | sterile alpha motif domain containing 12 | GTEx | DepMap | Descartes | 0.24 | 110.35 |
| 24 | COL27A1 | 0.0102972 | collagen type XXVII alpha 1 chain | GTEx | DepMap | Descartes | 0.33 | 175.13 |
| 25 | ANXA4 | 0.0100495 | annexin A4 | GTEx | DepMap | Descartes | 0.43 | 390.31 |
| 26 | DMKN | 0.0099492 | dermokine | GTEx | DepMap | Descartes | 0.06 | 116.16 |
| 27 | RBPMS | 0.0098590 | RNA binding protein, mRNA processing factor | GTEx | DepMap | Descartes | 0.65 | 810.27 |
| 28 | SLC4A4 | 0.0098357 | solute carrier family 4 member 4 | GTEx | DepMap | Descartes | 0.20 | 120.86 |
| 29 | VTCN1 | 0.0096389 | V-set domain containing T cell activation inhibitor 1 | GTEx | DepMap | Descartes | 0.12 | 229.22 |
| 30 | WWC1 | 0.0095233 | WW and C2 domain containing 1 | GTEx | DepMap | Descartes | 0.65 | 387.85 |
| 31 | LCN2 | 0.0094710 | lipocalin 2 | GTEx | DepMap | Descartes | 0.15 | 1058.30 |
| 32 | AGT | 0.0093476 | angiotensinogen | GTEx | DepMap | Descartes | 0.14 | 227.33 |
| 33 | GRB7 | 0.0092268 | growth factor receptor bound protein 7 | GTEx | DepMap | Descartes | 0.07 | 159.46 |
| 34 | NR5A2 | 0.0088952 | nuclear receptor subfamily 5 group A member 2 | GTEx | DepMap | Descartes | 0.35 | 235.02 |
| 35 | LAD1 | 0.0088560 | ladinin 1 | GTEx | DepMap | Descartes | 0.12 | 249.12 |
| 36 | BCO2 | 0.0087978 | beta-carotene oxygenase 2 | GTEx | DepMap | Descartes | 0.22 | 284.39 |
| 37 | NEAT1 | 0.0083548 | nuclear paraspeckle assembly transcript 1 | GTEx | DepMap | Descartes | 6.53 | 1096.73 |
| 38 | RRAD | 0.0083341 | RRAD, Ras related glycolysis inhibitor and calcium channel regulator | GTEx | DepMap | Descartes | 0.14 | 597.14 |
| 39 | BAIAP2L1 | 0.0080607 | BAR/IMD domain containing adaptor protein 2 like 1 | GTEx | DepMap | Descartes | 0.26 | 276.16 |
| 40 | LIF | 0.0079466 | LIF interleukin 6 family cytokine | GTEx | DepMap | Descartes | 0.19 | 225.14 |
| 41 | SLC44A3 | 0.0078792 | solute carrier family 44 member 3 | GTEx | DepMap | Descartes | 0.14 | 221.45 |
| 42 | FGFR3 | 0.0078669 | fibroblast growth factor receptor 3 | GTEx | DepMap | Descartes | 0.12 | 151.30 |
| 43 | BACE2 | 0.0076422 | beta-secretase 2 | GTEx | DepMap | Descartes | 0.24 | NA |
| 44 | NFKBIZ | 0.0076255 | NFKB inhibitor zeta | GTEx | DepMap | Descartes | 0.29 | 323.74 |
| 45 | DSG2 | 0.0076003 | desmoglein 2 | GTEx | DepMap | Descartes | 0.06 | 29.88 |
| 46 | TMC5 | 0.0074894 | transmembrane channel like 5 | GTEx | DepMap | Descartes | 0.14 | 125.79 |
| 47 | SLC12A2 | 0.0073958 | solute carrier family 12 member 2 | GTEx | DepMap | Descartes | 0.41 | 303.61 |
| 48 | YBX3 | 0.0072406 | Y-box binding protein 3 | GTEx | DepMap | Descartes | 0.27 | NA |
| 49 | COL18A1 | 0.0071853 | collagen type XVIII alpha 1 chain | GTEx | DepMap | Descartes | 0.69 | 464.95 |
| 50 | TNFAIP2 | 0.0071589 | TNF alpha induced protein 2 | GTEx | DepMap | Descartes | 0.24 | 290.82 |
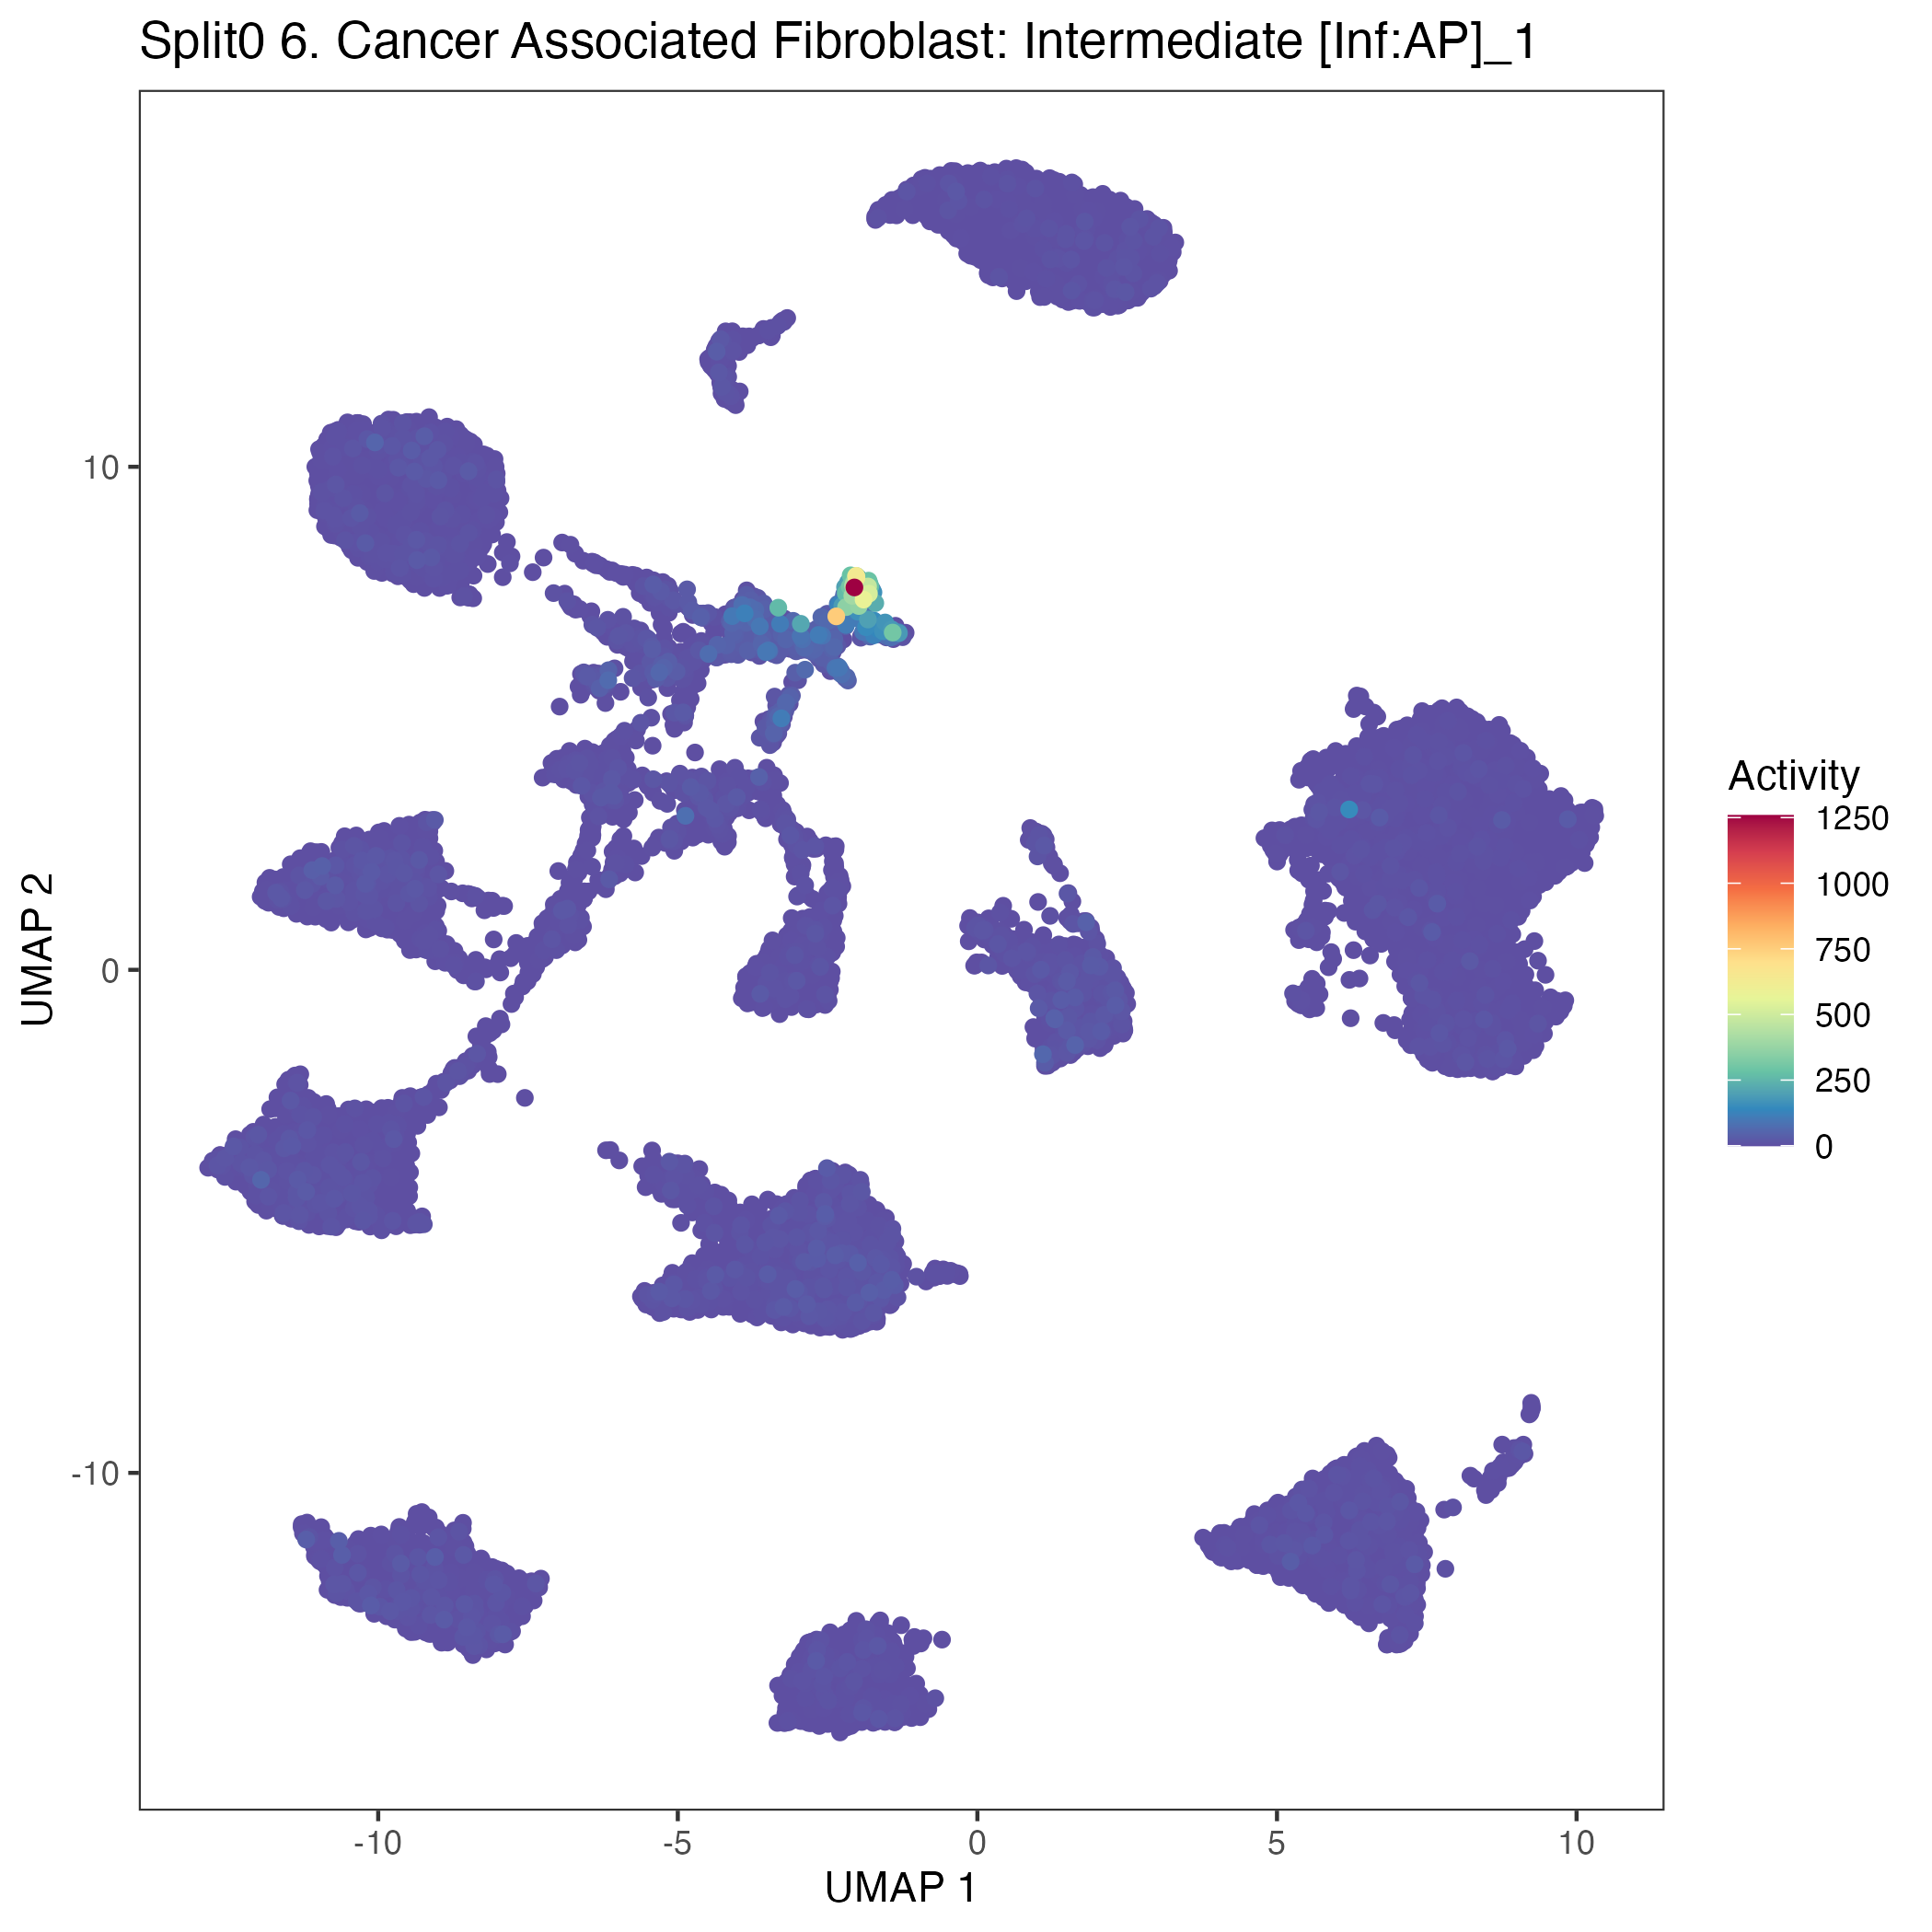
UMAP plots showing activity of gene expression program identified in community:6. Cancer Associated Fibroblast: Intermediate [Inf:AP]
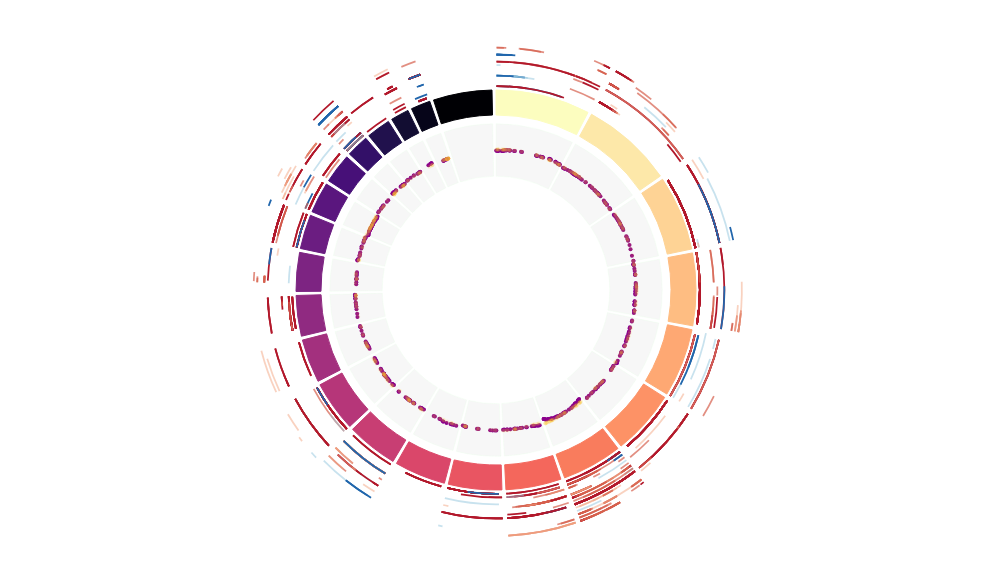
CNV Data procured from inferCNV.
Outer tracks are putative CNV regions (gains = red, losses = blue) for each patient
Inner track is expression data representing:
The top cells expressing this GEP (purple)
Random cells (n =50) from the reference set used in inferCNV (orange)
Gene set Enrichments for this program, caculated from top 50 genes
mSigDB Cell Types Gene Set:
| P-value | OR | Lower 95% CI | FDR | FWER | Genes Found | Gene Set Size | |
|---|---|---|---|---|---|---|---|
| AIZARANI_LIVER_C7_EPCAM_POS_BILE_DUCT_CELLS_2 | 1.55e-31 | 64.40 | 34.82 | 1.04e-28 | 1.04e-28 | 25BICC1, PKHD1, ANKRD1, ELF3, KRT18, GLIS3, DEFB1, ABCC3, TM4SF4, KRT8, CLDN1, KRT7, KIFC3, COL27A1, ANXA4, RBPMS, SLC4A4, WWC1, AGT, LAD1, LIF, FGFR3, BACE2, DSG2, SLC12A2 |
219 |
| AIZARANI_LIVER_C4_EPCAM_POS_BILE_DUCT_CELLS_1 | 7.43e-26 | 53.20 | 28.25 | 1.66e-23 | 4.99e-23 | 21BICC1, PKHD1, ELF3, KRT18, GLIS3, C3, DEFB1, ABCC3, TM4SF4, KRT8, CLDN1, KRT7, COL27A1, ANXA4, RBPMS, SLC4A4, AGT, LAD1, FGFR3, BACE2, SLC12A2 |
191 |
| AIZARANI_LIVER_C24_EPCAM_POS_BILE_DUCT_CELLS_3 | 1.76e-19 | 38.31 | 19.60 | 2.96e-17 | 1.18e-16 | 17ELF3, KRT18, DEFB1, TM4SF4, KRT8, CLDN1, KRT7, ANXA4, SLC4A4, VTCN1, LCN2, LAD1, BACE2, DSG2, TMC5, SLC12A2, TNFAIP2 |
185 |
| AIZARANI_LIVER_C39_EPCAM_POS_BILE_DUCT_CELLS_4 | 6.00e-18 | 35.00 | 17.69 | 8.05e-16 | 4.03e-15 | 16BICC1, PKHD1, ANKRD1, ELF3, KRT18, DEFB1, TM4SF4, KRT8, CLDN1, KRT7, ANXA4, LAD1, LIF, DSG2, SLC12A2, TNFAIP2 |
184 |
| MURARO_PANCREAS_DUCTAL_CELL | 3.44e-28 | 28.78 | 14.91 | 1.16e-25 | 2.31e-25 | 37BICC1, PKHD1, ANKRD1, ELF3, KRT18, CXCL2, GLIS3, C3, DEFB1, ABCC3, RASEF, KRT8, HNF1B, CLDN1, KRT7, SAMD12, ANXA4, RBPMS, SLC4A4, VTCN1, WWC1, LCN2, AGT, NR5A2, LAD1, NEAT1, BAIAP2L1, LIF, FGFR3, BACE2, NFKBIZ, DSG2, TMC5, SLC12A2, YBX3, COL18A1, TNFAIP2 |
1276 |
| CUI_DEVELOPING_HEART_C6_EPICARDIAL_CELL | 8.57e-12 | 21.58 | 10.09 | 8.21e-10 | 5.75e-09 | 12BICC1, KRT18, C3, KRT8, CLDN1, KRT7, NNMT, ANXA4, SLC4A4, WWC1, BCO2, NFKBIZ |
195 |
| DESCARTES_FETAL_PANCREAS_DUCTAL_CELLS | 1.45e-09 | 23.05 | 9.63 | 1.18e-07 | 9.74e-07 | 9PKHD1, ELF3, DEFB1, ACSM3, ANXA4, SLC4A4, VTCN1, LAD1, FGFR3 |
128 |
| LAKE_ADULT_KIDNEY_C17_COLLECTING_SYSTEM_PCS_STRESSED_DISSOC_SUBSET | 1.58e-09 | 15.40 | 7.02 | 1.18e-07 | 1.06e-06 | 11ELF3, GLIS3, DEFB1, SAMD12, RBPMS, WWC1, NEAT1, BACE2, NFKBIZ, YBX3, COL18A1 |
240 |
| MURARO_PANCREAS_ACINAR_CELL | 4.02e-14 | 12.76 | 6.88 | 4.49e-12 | 2.70e-11 | 21ELF3, KRT18, CXCL2, C3, ABCC3, RASEF, KRT8, CLDN1, KRT7, ANXA4, RBPMS, LCN2, NR5A2, LAD1, NEAT1, BAIAP2L1, BACE2, NFKBIZ, TMC5, SLC12A2, YBX3 |
731 |
| TRAVAGLINI_LUNG_MUCOUS_CELL | 5.39e-07 | 17.23 | 6.41 | 2.78e-05 | 3.61e-04 | 7C3, SLC4A4, LCN2, LIF, BACE2, TMC5, TNFAIP2 |
125 |
| DURANTE_ADULT_OLFACTORY_NEUROEPITHELIUM_SUSTENTACULAR_CELLS | 3.46e-05 | 25.26 | 6.32 | 1.22e-03 | 2.32e-02 | 4ELF3, KRT18, KRT8, LCN2 |
47 |
| DURANTE_ADULT_OLFACTORY_NEUROEPITHELIUM_RESPIRATORY_COLUMNAR_CELLS | 1.81e-04 | 31.85 | 5.95 | 5.05e-03 | 1.21e-01 | 3ELF3, KRT18, KRT8 |
28 |
| LAKE_ADULT_KIDNEY_C4_PROXIMAL_TUBULE_EPITHELIAL_CELLS_S2 | 3.74e-07 | 14.17 | 5.66 | 2.09e-05 | 2.51e-04 | 8BICC1, PKHD1, GLIS3, ACSM3, RBPMS, WWC1, NEAT1, COL18A1 |
176 |
| DURANTE_ADULT_OLFACTORY_NEUROEPITHELIUM_OLFACTORY_MICROVILLAR_CELLS | 5.56e-05 | 22.15 | 5.58 | 1.78e-03 | 3.73e-02 | 4KRT18, KRT8, KRT7, ANXA4 |
53 |
| TRAVAGLINI_LUNG_GOBLET_CELL | 1.67e-06 | 14.43 | 5.38 | 7.98e-05 | 1.12e-03 | 7C3, KRT7, SLC4A4, VTCN1, LCN2, BACE2, SLC12A2 |
148 |
| DURANTE_ADULT_OLFACTORY_NEUROEPITHELIUM_RESPIRATORY_HORIZONTAL_BASAL_CELLS | 2.96e-04 | 26.56 | 5.01 | 7.65e-03 | 1.99e-01 | 3ELF3, KRT18, KRT8 |
33 |
| DESCARTES_FETAL_EYE_CORNEAL_AND_CONJUNCTIVAL_EPITHELIAL_CELLS | 3.53e-07 | 11.73 | 4.95 | 2.09e-05 | 2.37e-04 | 9ELF3, KRT18, KRT8, ACSM3, CLDN1, KRT7, VTCN1, LCN2, TMC5 |
243 |
| HU_FETAL_RETINA_RPE | 1.46e-07 | 11.08 | 4.89 | 9.78e-06 | 9.78e-05 | 10KRT18, KRT8, COL27A1, SLC4A4, WWC1, NEAT1, FGFR3, BACE2, DSG2, COL18A1 |
292 |
| DESCARTES_FETAL_PLACENTA_PAEP_MECOM_POSITIVE_CELLS | 3.99e-06 | 12.56 | 4.70 | 1.78e-04 | 2.68e-03 | 7PKHD1, DEFB1, NNMT, SAMD12, VTCN1, LCN2, LIF |
169 |
| DESCARTES_FETAL_SPLEEN_MESOTHELIAL_CELLS | 1.01e-05 | 10.82 | 4.05 | 3.98e-04 | 6.77e-03 | 7KRT18, KRT8, KRT7, SLC4A4, WWC1, RRAD, DSG2 |
195 |
Dowload full table
mSigDB Hallmark Gene Sets:
| P-value | OR | Lower 95% CI | FDR | FWER | Genes Found | Gene Set Size | |
|---|---|---|---|---|---|---|---|
| HALLMARK_ESTROGEN_RESPONSE_EARLY | 1.08e-03 | 7.12 | 2.18 | 5.40e-02 | 5.40e-02 | 5ELF3, KRT18, KRT8, WWC1, LAD1 |
200 |
| HALLMARK_IL2_STAT5_SIGNALING | 4.30e-02 | 4.07 | 0.80 | 7.25e-01 | 1.00e+00 | 3ANXA4, LIF, NFKBIZ |
199 |
| HALLMARK_TNFA_SIGNALING_VIA_NFKB | 4.35e-02 | 4.05 | 0.80 | 7.25e-01 | 1.00e+00 | 3CXCL2, LIF, TNFAIP2 |
200 |
| HALLMARK_UV_RESPONSE_DN | 1.10e-01 | 3.67 | 0.43 | 9.77e-01 | 1.00e+00 | 2ANXA4, RBPMS |
144 |
| HALLMARK_UV_RESPONSE_UP | 1.28e-01 | 3.34 | 0.39 | 9.77e-01 | 1.00e+00 | 2CXCL2, RRAD |
158 |
| HALLMARK_INFLAMMATORY_RESPONSE | 1.85e-01 | 2.63 | 0.31 | 9.77e-01 | 1.00e+00 | 2SLC4A4, LIF |
200 |
| HALLMARK_P53_PATHWAY | 1.85e-01 | 2.63 | 0.31 | 9.77e-01 | 1.00e+00 | 2RRAD, LIF |
200 |
| HALLMARK_APICAL_SURFACE | 1.61e-01 | 5.93 | 0.14 | 9.77e-01 | 1.00e+00 | 1PKHD1 |
44 |
| HALLMARK_PROTEIN_SECRETION | 3.17e-01 | 2.68 | 0.07 | 9.77e-01 | 1.00e+00 | 1KRT18 |
96 |
| HALLMARK_ANDROGEN_RESPONSE | 3.28e-01 | 2.58 | 0.06 | 9.77e-01 | 1.00e+00 | 1KRT8 |
100 |
| HALLMARK_SPERMATOGENESIS | 4.15e-01 | 1.90 | 0.05 | 9.77e-01 | 1.00e+00 | 1SLC12A2 |
135 |
| HALLMARK_COAGULATION | 4.22e-01 | 1.86 | 0.05 | 9.77e-01 | 1.00e+00 | 1C3 |
138 |
| HALLMARK_FATTY_ACID_METABOLISM | 4.66e-01 | 1.62 | 0.04 | 9.77e-01 | 1.00e+00 | 1ACSM3 |
158 |
| HALLMARK_APOPTOSIS | 4.72e-01 | 1.59 | 0.04 | 9.77e-01 | 1.00e+00 | 1KRT18 |
161 |
| HALLMARK_G2M_CHECKPOINT | 5.47e-01 | 1.28 | 0.03 | 9.77e-01 | 1.00e+00 | 1SLC12A2 |
200 |
| HALLMARK_ADIPOGENESIS | 5.47e-01 | 1.28 | 0.03 | 9.77e-01 | 1.00e+00 | 1C3 |
200 |
| HALLMARK_ESTROGEN_RESPONSE_LATE | 5.47e-01 | 1.28 | 0.03 | 9.77e-01 | 1.00e+00 | 1FGFR3 |
200 |
| HALLMARK_MYOGENESIS | 5.47e-01 | 1.28 | 0.03 | 9.77e-01 | 1.00e+00 | 1KIFC3 |
200 |
| HALLMARK_INTERFERON_GAMMA_RESPONSE | 5.47e-01 | 1.28 | 0.03 | 9.77e-01 | 1.00e+00 | 1TNFAIP2 |
200 |
| HALLMARK_APICAL_JUNCTION | 5.47e-01 | 1.28 | 0.03 | 9.77e-01 | 1.00e+00 | 1GRB7 |
200 |
Dowload full table
KEGG Pathways:
| P-value | OR | Lower 95% CI | FDR | FWER | Genes Found | Gene Set Size | |
|---|---|---|---|---|---|---|---|
| KEGG_MATURITY_ONSET_DIABETES_OF_THE_YOUNG | 4.39e-03 | 22.60 | 2.52 | 8.16e-01 | 8.16e-01 | 2HNF1B, NR5A2 |
25 |
| KEGG_PATHOGENIC_ESCHERICHIA_COLI_INFECTION | 2.07e-02 | 9.64 | 1.11 | 1.00e+00 | 1.00e+00 | 2KRT18, CLDN1 |
56 |
| KEGG_CYTOKINE_CYTOKINE_RECEPTOR_INTERACTION | 8.44e-02 | 3.05 | 0.60 | 1.00e+00 | 1.00e+00 | 3CXCL2, IL1RAP, LIF |
265 |
| KEGG_TIGHT_JUNCTION | 9.54e-02 | 4.01 | 0.47 | 1.00e+00 | 1.00e+00 | 2CLDN1, YBX3 |
132 |
| KEGG_RENIN_ANGIOTENSIN_SYSTEM | 6.56e-02 | 15.93 | 0.37 | 1.00e+00 | 1.00e+00 | 1AGT |
17 |
| KEGG_PROXIMAL_TUBULE_BICARBONATE_RECLAMATION | 8.77e-02 | 11.59 | 0.28 | 1.00e+00 | 1.00e+00 | 1SLC4A4 |
23 |
| KEGG_NICOTINATE_AND_NICOTINAMIDE_METABOLISM | 9.13e-02 | 11.08 | 0.26 | 1.00e+00 | 1.00e+00 | 1NNMT |
24 |
| KEGG_BUTANOATE_METABOLISM | 1.27e-01 | 7.73 | 0.19 | 1.00e+00 | 1.00e+00 | 1ACSM3 |
34 |
| KEGG_BLADDER_CANCER | 1.54e-01 | 6.22 | 0.15 | 1.00e+00 | 1.00e+00 | 1FGFR3 |
42 |
| KEGG_ABC_TRANSPORTERS | 1.61e-01 | 5.93 | 0.14 | 1.00e+00 | 1.00e+00 | 1ABCC3 |
44 |
| KEGG_VIBRIO_CHOLERAE_INFECTION | 1.94e-01 | 4.81 | 0.12 | 1.00e+00 | 1.00e+00 | 1SLC12A2 |
54 |
| KEGG_NOD_LIKE_RECEPTOR_SIGNALING_PATHWAY | 2.19e-01 | 4.18 | 0.10 | 1.00e+00 | 1.00e+00 | 1CXCL2 |
62 |
| KEGG_COMPLEMENT_AND_COAGULATION_CASCADES | 2.40e-01 | 3.75 | 0.09 | 1.00e+00 | 1.00e+00 | 1C3 |
69 |
| KEGG_LEISHMANIA_INFECTION | 2.49e-01 | 3.59 | 0.09 | 1.00e+00 | 1.00e+00 | 1C3 |
72 |
| KEGG_ARRHYTHMOGENIC_RIGHT_VENTRICULAR_CARDIOMYOPATHY_ARVC | 2.55e-01 | 3.49 | 0.09 | 1.00e+00 | 1.00e+00 | 1DSG2 |
74 |
| KEGG_APOPTOSIS | 2.93e-01 | 2.97 | 0.07 | 1.00e+00 | 1.00e+00 | 1IL1RAP |
87 |
| KEGG_LEUKOCYTE_TRANSENDOTHELIAL_MIGRATION | 3.69e-01 | 2.22 | 0.05 | 1.00e+00 | 1.00e+00 | 1CLDN1 |
116 |
| KEGG_CELL_ADHESION_MOLECULES_CAMS | 4.10e-01 | 1.93 | 0.05 | 1.00e+00 | 1.00e+00 | 1CLDN1 |
133 |
| KEGG_SYSTEMIC_LUPUS_ERYTHEMATOSUS | 4.24e-01 | 1.85 | 0.05 | 1.00e+00 | 1.00e+00 | 1C3 |
139 |
| KEGG_JAK_STAT_SIGNALING_PATHWAY | 4.59e-01 | 1.66 | 0.04 | 1.00e+00 | 1.00e+00 | 1LIF |
155 |
Dowload full table
CHR Positional Gene Sets:
| P-value | OR | Lower 95% CI | FDR | FWER | Genes Found | Gene Set Size | |
|---|---|---|---|---|---|---|---|
| chr3q28 | 6.27e-03 | 18.58 | 2.09 | 1.00e+00 | 1.00e+00 | 2CLDN1, IL1RAP |
30 |
| chr1q32 | 8.51e-02 | 3.03 | 0.60 | 1.00e+00 | 1.00e+00 | 3ELF3, NR5A2, LAD1 |
266 |
| chr17q12 | 1.09e-01 | 3.69 | 0.43 | 1.00e+00 | 1.00e+00 | 2HNF1B, GRB7 |
143 |
| chr12q13 | 2.07e-01 | 1.98 | 0.39 | 1.00e+00 | 1.00e+00 | 3KRT18, KRT8, KRT7 |
407 |
| chr16p12 | 1.36e-01 | 3.21 | 0.38 | 1.00e+00 | 1.00e+00 | 2ACSM3, TMC5 |
164 |
| chr11q23 | 1.92e-01 | 2.57 | 0.30 | 1.00e+00 | 1.00e+00 | 2NNMT, BCO2 |
205 |
| chr21q22 | 3.99e-01 | 1.48 | 0.17 | 1.00e+00 | 1.00e+00 | 2BACE2, COL18A1 |
353 |
| chr5q34 | 1.41e-01 | 6.89 | 0.17 | 1.00e+00 | 1.00e+00 | 1WWC1 |
38 |
| chr3q12 | 1.67e-01 | 5.67 | 0.14 | 1.00e+00 | 1.00e+00 | 1NFKBIZ |
46 |
| chr9q32 | 1.71e-01 | 5.54 | 0.13 | 1.00e+00 | 1.00e+00 | 1COL27A1 |
47 |
| chr1p12 | 1.77e-01 | 5.31 | 0.13 | 1.00e+00 | 1.00e+00 | 1VTCN1 |
49 |
| chr8p12 | 2.34e-01 | 3.86 | 0.09 | 1.00e+00 | 1.00e+00 | 1RBPMS |
67 |
| chr16q21 | 2.55e-01 | 3.49 | 0.09 | 1.00e+00 | 1.00e+00 | 1KIFC3 |
74 |
| chr18q12 | 3.17e-01 | 2.68 | 0.07 | 1.00e+00 | 1.00e+00 | 1DSG2 |
96 |
| chr1p21 | 3.25e-01 | 2.60 | 0.06 | 1.00e+00 | 1.00e+00 | 1SLC44A3 |
99 |
| chr9p24 | 3.31e-01 | 2.55 | 0.06 | 1.00e+00 | 1.00e+00 | 1GLIS3 |
101 |
| chr16q23 | 3.39e-01 | 2.48 | 0.06 | 1.00e+00 | 1.00e+00 | 1SDR42E1 |
104 |
| chr5q23 | 3.57e-01 | 2.32 | 0.06 | 1.00e+00 | 1.00e+00 | 1SLC12A2 |
111 |
| chr10q21 | 3.69e-01 | 2.22 | 0.05 | 1.00e+00 | 1.00e+00 | 1BICC1 |
116 |
| chr8p21 | 3.99e-01 | 2.01 | 0.05 | 1.00e+00 | 1.00e+00 | 1DOCK5 |
128 |
Dowload full table
Transcription Factor Targets:
| P-value | OR | Lower 95% CI | FDR | FWER | Genes Found | Gene Set Size | |
|---|---|---|---|---|---|---|---|
| RGTTAMWNATT_HNF1_01 | 1.04e-05 | 20.11 | 6.05 | 1.18e-02 | 1.18e-02 | 5HNF1B, AGT, GRB7, NR5A2, SLC12A2 |
74 |
| HNF1_Q6 | 4.58e-04 | 6.82 | 2.35 | 1.73e-01 | 5.19e-01 | 6PKHD1, TM4SF4, HNF1B, SLC4A4, SLC44A3, SLC12A2 |
256 |
| HNF1_01 | 2.64e-03 | 5.76 | 1.77 | 4.84e-01 | 1.00e+00 | 5PKHD1, TM4SF4, HNF1B, SLC4A4, NR5A2 |
246 |
| HES2_TARGET_GENES | 3.28e-04 | 3.46 | 1.72 | 1.73e-01 | 3.72e-01 | 14ANKRD1, CXCL2, C3, ABCC3, TM4SF4, KRT8, KRT7, IL1RAP, KIFC3, NNMT, LCN2, BCO2, NEAT1, NFKBIZ |
1420 |
| ZNF318_TARGET_GENES | 2.64e-03 | 4.17 | 1.57 | 4.84e-01 | 1.00e+00 | 7ANKRD1, KRT18, ABCC3, KRT8, KIFC3, NEAT1, YBX3 |
495 |
| TBX1_TARGET_GENES | 6.24e-03 | 5.91 | 1.53 | 7.85e-01 | 1.00e+00 | 4C3, KRT7, IL1RAP, LCN2 |
188 |
| MED25_TARGET_GENES | 9.53e-03 | 7.39 | 1.45 | 9.00e-01 | 1.00e+00 | 3KRT8, KRT7, NEAT1 |
111 |
| HNF1_C | 1.60e-02 | 4.44 | 1.15 | 1.00e+00 | 1.00e+00 | 4PKHD1, HNF1B, BACE2, SLC12A2 |
249 |
| E12_Q6 | 1.96e-02 | 4.16 | 1.08 | 1.00e+00 | 1.00e+00 | 4KRT8, HNF1B, WWC1, GRB7 |
265 |
| HNF4_Q6 | 2.10e-02 | 4.07 | 1.06 | 1.00e+00 | 1.00e+00 | 4KIFC3, GRB7, NR5A2, LAD1 |
271 |
| AREB6_01 | 2.18e-02 | 4.03 | 1.05 | 1.00e+00 | 1.00e+00 | 4ANKRD1, KRT8, SAMD12, RRAD |
274 |
| HMG20B_TARGET_GENES | 3.48e-02 | 2.07 | 0.98 | 1.00e+00 | 1.00e+00 | 12ANKRD1, C3, KRT8, ACSM3, KIFC3, COL27A1, ANXA4, AGT, GRB7, BCO2, NEAT1, NFKBIZ |
1922 |
| NR1H4_TARGET_GENES | 3.36e-02 | 3.50 | 0.91 | 1.00e+00 | 1.00e+00 | 4ELF3, C3, TM4SF4, AGT |
315 |
| ZNF85_TARGET_GENES | 3.77e-02 | 3.37 | 0.87 | 1.00e+00 | 1.00e+00 | 4ACSM3, DOCK5, BCO2, NFKBIZ |
327 |
| LHX2_TARGET_GENES | 7.22e-02 | 2.04 | 0.82 | 1.00e+00 | 1.00e+00 | 8CXCL2, ABCC3, TM4SF4, KRT8, DMKN, NR5A2, LAD1, NEAT1 |
1177 |
| STAT5A_04 | 5.12e-02 | 3.78 | 0.75 | 1.00e+00 | 1.00e+00 | 3ANKRD1, GRB7, NR5A2 |
214 |
| TATAAA_TATA_01 | 1.40e-01 | 1.82 | 0.74 | 1.00e+00 | 1.00e+00 | 8GLIS3, DEFB1, TM4SF4, KRT8, AGT, NR5A2, BCO2, LIF |
1317 |
| TGACCTY_ERR1_Q2 | 1.09e-01 | 1.93 | 0.73 | 1.00e+00 | 1.00e+00 | 7ELF3, HNF1B, RBPMS, WWC1, LCN2, NR5A2, FGFR3 |
1064 |
| TEF1_Q6 | 5.90e-02 | 3.56 | 0.70 | 1.00e+00 | 1.00e+00 | 3ANKRD1, ELF3, NNMT |
227 |
| GCM_Q2 | 7.05e-02 | 3.30 | 0.65 | 1.00e+00 | 1.00e+00 | 3ANKRD1, WWC1, GRB7 |
245 |
Dowload full table
GO Biological Processes:
| P-value | OR | Lower 95% CI | FDR | FWER | Genes Found | Gene Set Size | |
|---|---|---|---|---|---|---|---|
| GOBP_RESPONSE_TO_HYDROSTATIC_PRESSURE | 2.31e-04 | 129.66 | 11.45 | 4.32e-01 | 1.00e+00 | 2KRT8, COL18A1 |
6 |
| GOBP_HYPEROSMOTIC_RESPONSE | 1.44e-04 | 34.58 | 6.44 | 3.60e-01 | 1.00e+00 | 3CLDN1, SLC12A2, YBX3 |
26 |
| GOBP_RESPONSE_TO_WATER | 1.37e-03 | 43.30 | 4.59 | 1.00e+00 | 1.00e+00 | 2KRT8, COL18A1 |
14 |
| GOBP_HEPATOCYTE_APOPTOTIC_PROCESS | 1.37e-03 | 43.30 | 4.59 | 1.00e+00 | 1.00e+00 | 2KRT18, KRT8 |
14 |
| GOBP_HEPATOCYTE_DIFFERENTIATION | 1.80e-03 | 37.11 | 3.99 | 1.00e+00 | 1.00e+00 | 2KRT18, HNF1B |
16 |
| GOBP_CELL_DIFFERENTIATION_INVOLVED_IN_EMBRYONIC_PLACENTA_DEVELOPMENT | 3.72e-03 | 24.78 | 2.74 | 1.00e+00 | 1.00e+00 | 2KRT8, LIF |
23 |
| GOBP_CORNIFICATION | 1.01e-03 | 9.97 | 2.56 | 1.00e+00 | 1.00e+00 | 4KRT18, KRT8, KRT7, DSG2 |
113 |
| GOBP_EPITHELIAL_CELL_DIFFERENTIATION | 2.15e-05 | 5.18 | 2.45 | 1.61e-01 | 1.61e-01 | 12PKHD1, ELF3, KRT18, KRT8, HNF1B, CLDN1, KRT7, ANXA4, NR5A2, LIF, DSG2, COL18A1 |
775 |
| GOBP_BONE_GROWTH | 4.74e-03 | 21.66 | 2.42 | 1.00e+00 | 1.00e+00 | 2COL27A1, FGFR3 |
26 |
| GOBP_POSITIVE_REGULATION_OF_INFLAMMATORY_RESPONSE | 1.83e-03 | 8.43 | 2.17 | 1.00e+00 | 1.00e+00 | 4C3, AGT, NEAT1, NFKBIZ |
133 |
| GOBP_CELL_CELL_JUNCTION_ORGANIZATION | 1.31e-03 | 6.81 | 2.09 | 1.00e+00 | 1.00e+00 | 5PKHD1, CLDN1, KIFC3, AGT, DSG2 |
209 |
| GOBP_EPITHELIAL_CELL_MORPHOGENESIS | 6.69e-03 | 17.94 | 2.02 | 1.00e+00 | 1.00e+00 | 2PKHD1, COL18A1 |
31 |
| GOBP_RESPONSE_TO_OSMOTIC_STRESS | 4.15e-03 | 10.09 | 1.97 | 1.00e+00 | 1.00e+00 | 3CLDN1, SLC12A2, YBX3 |
82 |
| GOBP_CELL_JUNCTION_MAINTENANCE | 7.12e-03 | 17.34 | 1.95 | 1.00e+00 | 1.00e+00 | 2CLDN1, KIFC3 |
32 |
| GOBP_EPITHELIUM_DEVELOPMENT | 1.17e-04 | 3.86 | 1.92 | 3.60e-01 | 8.79e-01 | 14PKHD1, ELF3, KRT18, C3, KRT8, HNF1B, CLDN1, KRT7, ANXA4, AGT, NR5A2, LIF, DSG2, COL18A1 |
1275 |
| GOBP_MAINTENANCE_OF_BLOOD_BRAIN_BARRIER | 7.55e-03 | 16.78 | 1.89 | 1.00e+00 | 1.00e+00 | 2CLDN1, SLC12A2 |
33 |
| GOBP_POSITIVE_REGULATION_OF_MORPHOGENESIS_OF_AN_EPITHELIUM | 7.55e-03 | 16.78 | 1.89 | 1.00e+00 | 1.00e+00 | 2AGT, LIF |
33 |
| GOBP_VASCULAR_TRANSPORT | 5.05e-03 | 9.38 | 1.83 | 1.00e+00 | 1.00e+00 | 3ABCC3, SLC4A4, SLC12A2 |
88 |
| GOBP_KIDNEY_MORPHOGENESIS | 5.05e-03 | 9.38 | 1.83 | 1.00e+00 | 1.00e+00 | 3HNF1B, AGT, LIF |
88 |
| GOBP_RENAL_TUBULE_DEVELOPMENT | 5.37e-03 | 9.17 | 1.79 | 1.00e+00 | 1.00e+00 | 3HNF1B, AGT, LIF |
90 |
Dowload full table
Immunological Gene Sets:
| P-value | OR | Lower 95% CI | FDR | FWER | Genes Found | Gene Set Size | |
|---|---|---|---|---|---|---|---|
| GSE20715_0H_VS_24H_OZONE_LUNG_DN | 1.19e-05 | 10.54 | 3.95 | 1.45e-02 | 5.79e-02 | 7ELF3, KRT18, C3, ABCC3, KRT8, DOCK5, LCN2 |
200 |
| GSE21774_CD62L_POS_CD56_BRIGHT_VS_CD62L_NEG_CD56_DIM_NK_CELL_UP | 1.19e-05 | 10.54 | 3.95 | 1.45e-02 | 5.79e-02 | 7GLIS3, C3, KIFC3, DMKN, LCN2, BAIAP2L1, SLC44A3 |
200 |
| GSE21379_WT_VS_SAP_KO_TFH_CD4_TCELL_UP | 1.19e-05 | 10.54 | 3.95 | 1.45e-02 | 5.79e-02 | 7KRT18, C3, ABCC3, DOCK5, DMKN, LCN2, DSG2 |
200 |
| GSE27670_CTRL_VS_BLIMP1_TRANSDUCED_GC_BCELL_DN | 1.19e-05 | 10.54 | 3.95 | 1.45e-02 | 5.79e-02 | 7PKHD1, CXCL2, SLC4A4, WWC1, BAIAP2L1, NFKBIZ, DSG2 |
200 |
| GSE21360_SECONDARY_VS_QUATERNARY_MEMORY_CD8_TCELL_UP | 7.41e-05 | 9.68 | 3.33 | 7.22e-02 | 3.61e-01 | 6CXCL2, DMKN, RBPMS, LCN2, NFKBIZ, TNFAIP2 |
182 |
| GSE34179_THPOK_KO_VS_WT_VA14I_NKTCELL_DN | 1.20e-04 | 8.83 | 3.04 | 8.61e-02 | 5.86e-01 | 6C3, TM4SF4, ANXA4, WWC1, LAD1, LIF |
199 |
| GSE20715_0H_VS_48H_OZONE_TLR4_KO_LUNG_DN | 1.24e-04 | 8.78 | 3.02 | 8.61e-02 | 6.03e-01 | 6ELF3, KRT18, CXCL2, KRT8, DMKN, LCN2 |
200 |
| GSE1112_HY_CD8AB_VS_HY_CD8AA_THYMOCYTE_RTOC_CULTURE_DN | 9.02e-04 | 7.43 | 2.27 | 3.29e-01 | 1.00e+00 | 5CXCL2, GLIS3, C3, DEFB1, NFKBIZ |
192 |
| GSE9509_LPS_VS_LPS_AND_IL10_STIM_IL10_KO_MACROPHAGE_20MIN_UP | 9.44e-04 | 7.35 | 2.25 | 3.29e-01 | 1.00e+00 | 5C3, RBPMS, NEAT1, BACE2, NFKBIZ |
194 |
| GSE19888_ADENOSINE_A3R_ACT_VS_TCELL_MEMBRANES_ACT_AND_A3R_INH_PRETREAT_IN_MAST_CELL_DN | 1.03e-03 | 7.19 | 2.20 | 3.29e-01 | 1.00e+00 | 5GRB7, LAD1, NEAT1, BAIAP2L1, FGFR3 |
198 |
| GSE20715_0H_VS_24H_OZONE_TLR4_KO_LUNG_DN | 1.08e-03 | 7.12 | 2.18 | 3.29e-01 | 1.00e+00 | 5ELF3, KRT18, CXCL2, IL1RAP, LCN2 |
200 |
| GSE3982_NEUTROPHIL_VS_CENT_MEMORY_CD4_TCELL_UP | 1.08e-03 | 7.12 | 2.18 | 3.29e-01 | 1.00e+00 | 5DOCK5, IL1RAP, LCN2, YBX3, TNFAIP2 |
200 |
| GSE9316_IL6_KO_VS_IFNG_KO_INVIVO_EXPANDED_CD4_TCELL_DN | 1.08e-03 | 7.12 | 2.18 | 3.29e-01 | 1.00e+00 | 5CXCL2, NNMT, LIF, NFKBIZ, TNFAIP2 |
200 |
| GSE12392_IFNAR_KO_VS_IFNB_KO_CD8_NEG_SPLEEN_DC_DN | 1.08e-03 | 7.12 | 2.18 | 3.29e-01 | 1.00e+00 | 5ELF3, CXCL2, RRAD, FGFR3, NFKBIZ |
200 |
| GSE22443_NAIVE_VS_ACT_AND_IL2_TREATED_CD8_TCELL_DN | 1.08e-03 | 7.12 | 2.18 | 3.29e-01 | 1.00e+00 | 5ANKRD1, ELF3, KRT18, C3, COL18A1 |
200 |
| GSE46606_UNSTIM_VS_CD40L_IL2_IL5_1DAY_STIMULATED_IRF4HIGH_SORTED_BCELL_DN | 1.08e-03 | 7.12 | 2.18 | 3.29e-01 | 1.00e+00 | 5RASEF, RRAD, LIF, NFKBIZ, TNFAIP2 |
200 |
| GSE36891_UNSTIM_VS_POLYIC_TLR3_STIM_PERITONEAL_MACROPHAGE_UP | 2.76e-03 | 7.50 | 1.93 | 6.06e-01 | 1.00e+00 | 4CXCL2, LIF, NFKBIZ, TNFAIP2 |
149 |
| GSE4590_SMALL_VS_LARGE_PRE_BCELL_DN | 3.55e-03 | 6.97 | 1.80 | 6.06e-01 | 1.00e+00 | 4ELF3, DOCK5, RBPMS, GRB7 |
160 |
| GSE32255_WT_UNSTIM_VS_JMJD2D_KNOCKDOWN_4H_LPS_STIM_DC_DN | 4.67e-03 | 6.43 | 1.66 | 6.06e-01 | 1.00e+00 | 4SAMD12, ANXA4, BCO2, BACE2 |
173 |
| GSE21360_TERTIARY_VS_QUATERNARY_MEMORY_CD8_TCELL_DN | 5.06e-03 | 6.28 | 1.62 | 6.06e-01 | 1.00e+00 | 4C3, RBPMS, LCN2, LAD1 |
177 |
Top Ranked Transcription Factors for this Gene Expression Program:
| Gene Symbol | TF Rank | DNA Binding Domain | Motif Status | IUPAC PWM | GTEx | DepMap | Decartes |
|---|---|---|---|---|---|---|---|
| PKHD1 | 2 | No | Unlikely to be sequence specific TF | Not a DNA binding protein | No motif | None | The TIG domain is potentially DNA-binding but there is no literature evidence to suggest that PKHD1 is a TF. Membrane protein that operates upstream in the signaling cascade leading to NFKB (PMID: 21300060) |
| ELF3 | 4 | Yes | Known motif | Monomer or homomultimer | High-throughput in vitro | None | None |
| GLIS3 | 8 | Yes | Known motif | Monomer or homomultimer | High-throughput in vitro | None | None |
| HNF1B | 16 | Yes | Known motif | Monomer or homomultimer | High-throughput in vitro | None | None |
| IL1RAP | 20 | No | Unlikely to be sequence specific TF | Not a DNA binding protein | No motif | None | None |
| ANXA4 | 25 | No | Unlikely to be sequence specific TF | Not a DNA binding protein | No motif | None | None |
| AGT | 32 | No | Unlikely to be sequence specific TF | Not a DNA binding protein | No motif | None | None |
| NR5A2 | 34 | Yes | Known motif | Monomer or homomultimer | High-throughput in vitro | None | None |
| NFKBIZ | 44 | No | Unlikely to be sequence specific TF | Not a DNA binding protein | No motif | None | None |
| YBX3 | 48 | Yes | Known motif | Monomer or homomultimer | 100 perc ID - in vitro | None | Identical DBD to YBX1. Might also bind RNA. |
| MYRF | 64 | Yes | Known motif | Monomer or homomultimer | High-throughput in vitro | None | Mouse ortholog binds a highly similar motif. |
| ANXA3 | 72 | No | Unlikely to be sequence specific TF | Not a DNA binding protein | No motif | None | Protein operates far upstream on the signaling cascade. |
| PLXNB1 | 81 | No | Unlikely to be sequence specific TF | Not a DNA binding protein | No motif | None | Protein is a semaphorin receptor that operates far upstream on the signaling cascade. |
| BHLHE40 | 96 | Yes | Known motif | Monomer or homomultimer | High-throughput in vitro | None | None |
| SMAD3 | 99 | Yes | Known motif | Monomer or homomultimer | High-throughput in vitro | None | None |
| ZFP36 | 100 | No | ssDNA/RNA binding | Not a DNA binding protein | No motif | None | RNA binding protein (PMID: 10330172). |
| MLXIPL | 102 | Yes | Known motif | Monomer or homomultimer | High-throughput in vitro | None | None |
| ATF3 | 103 | Yes | Known motif | Monomer or homomultimer | High-throughput in vitro | None | None |
| MET | 117 | No | Unlikely to be sequence specific TF | Not a DNA binding protein | No motif | None | Its a cell surface receptor and kinase - included only because Vasquerizas 2009 included it with an x. |
| RUNX1 | 118 | Yes | Known motif | Monomer or homomultimer | In vivo/Misc source | Only known motifs are from Transfac or HocoMoco - origin is uncertain | None |
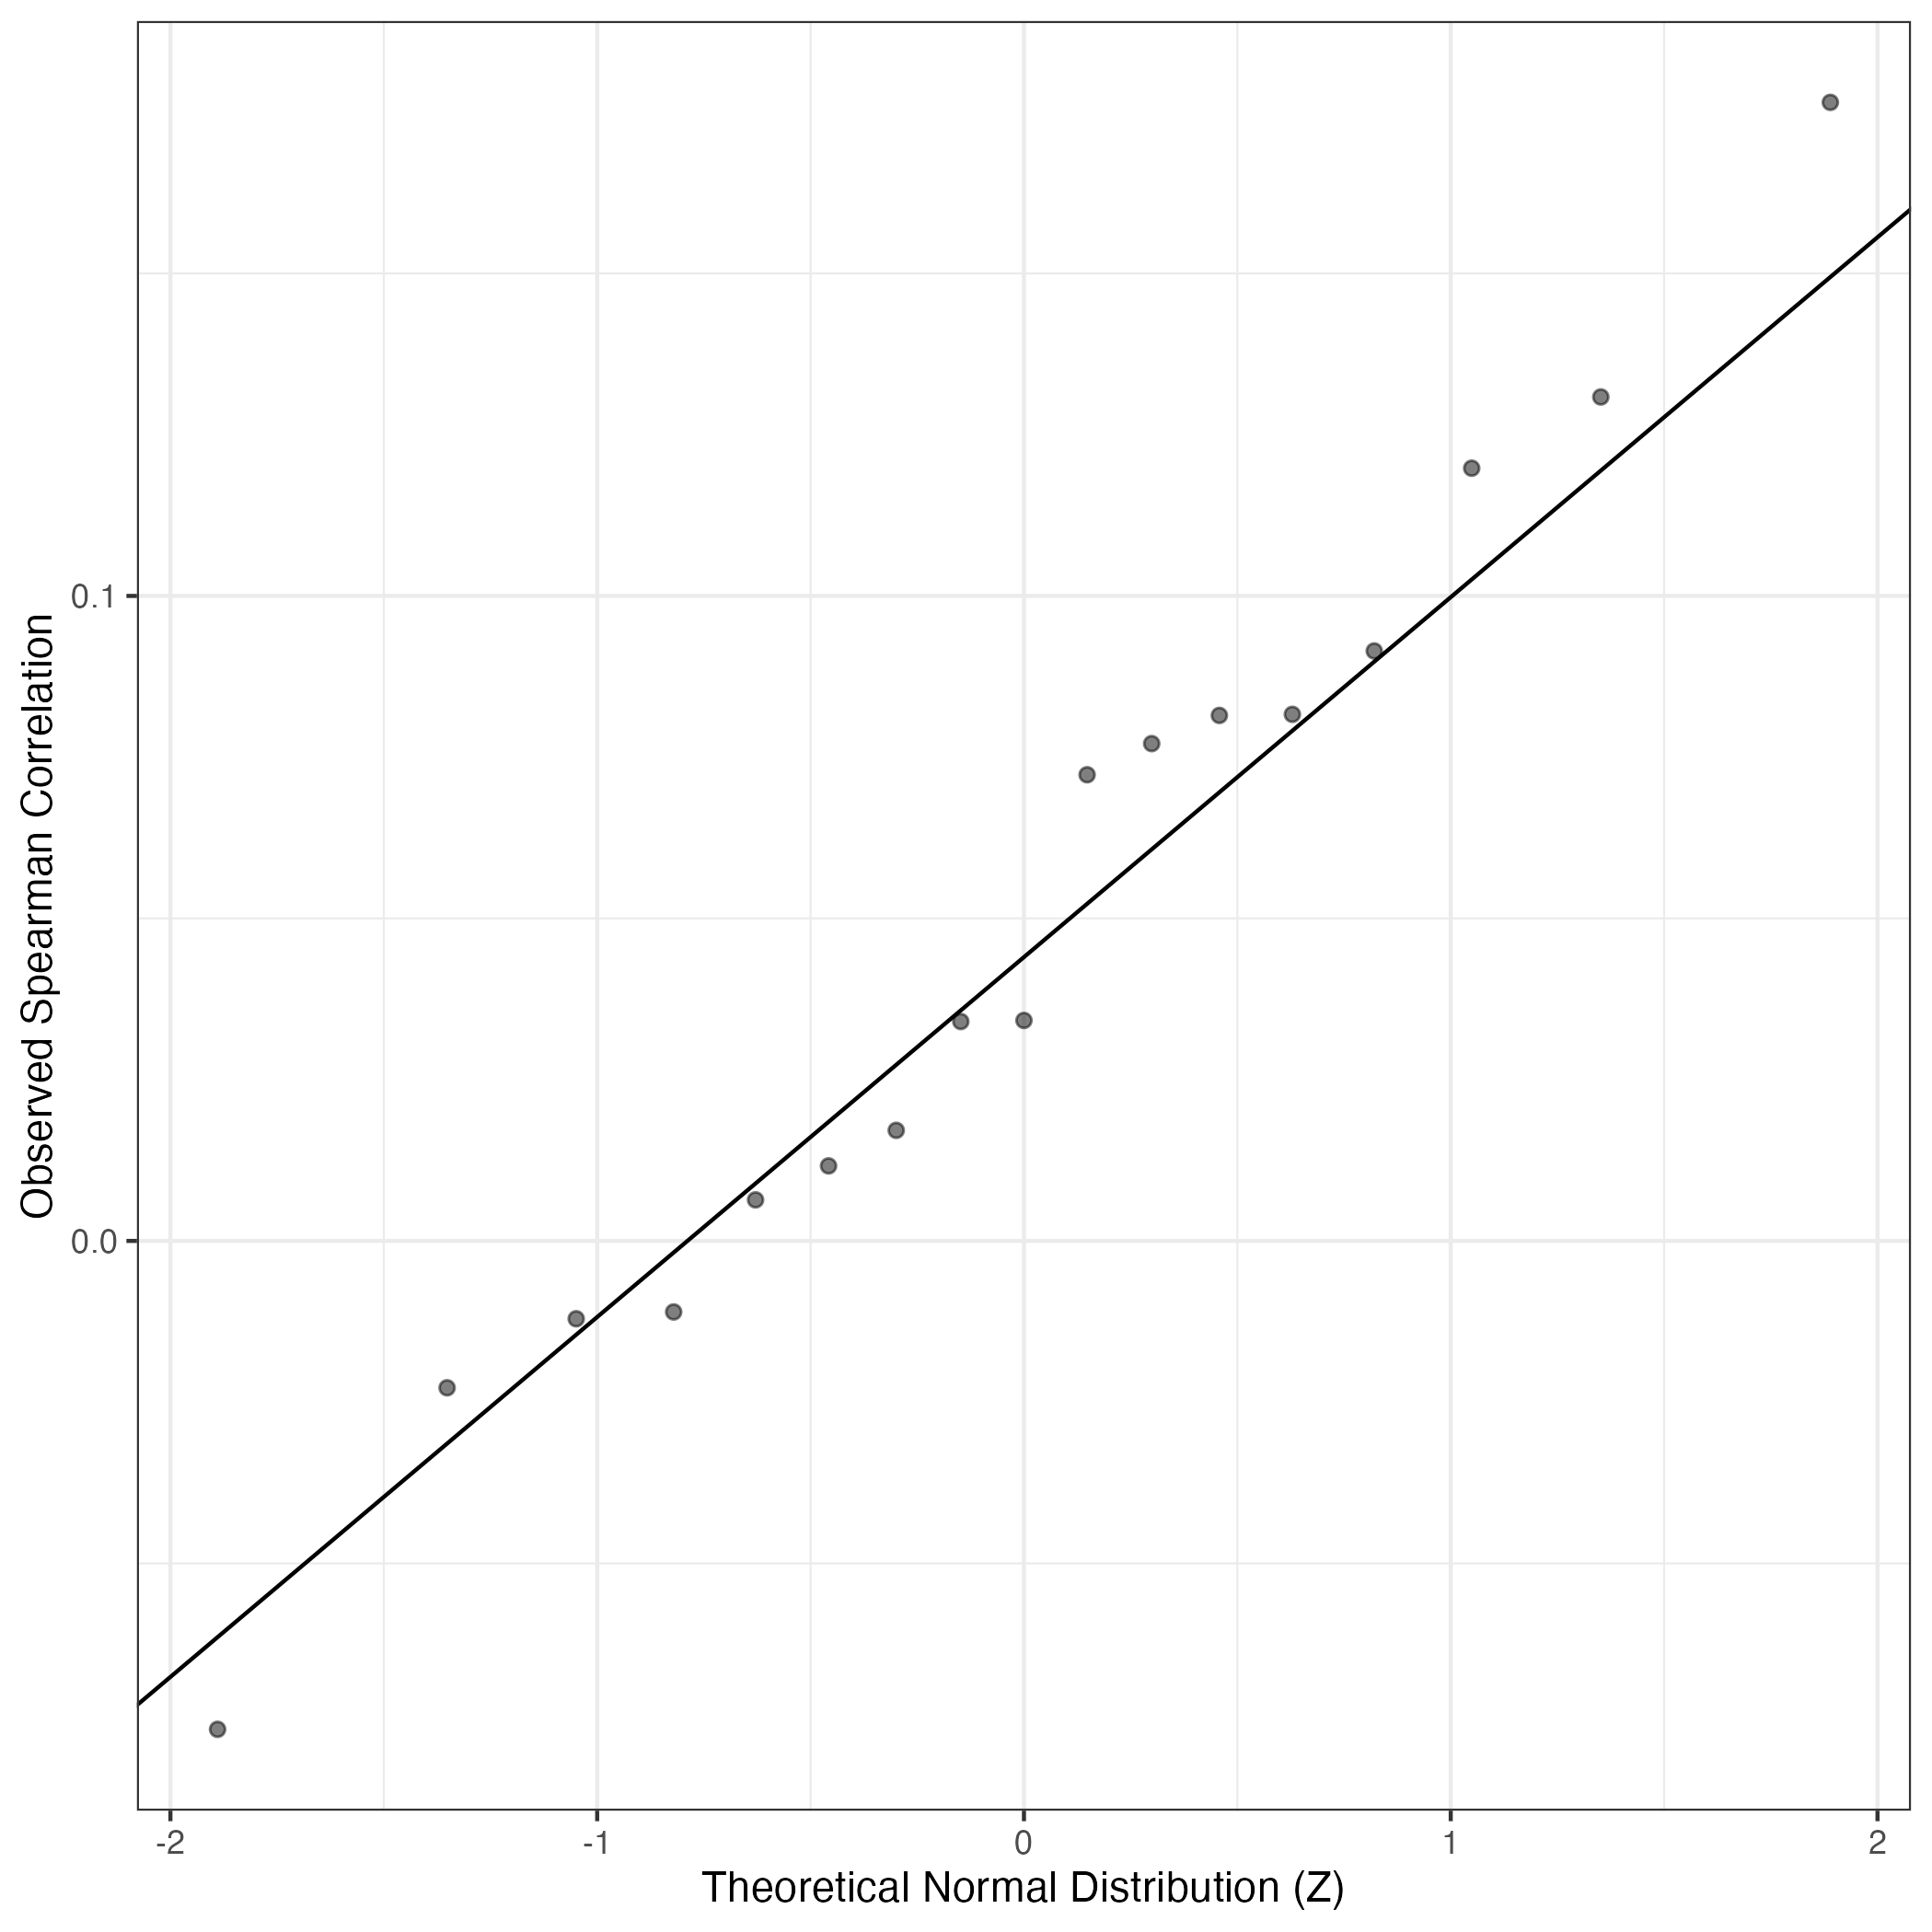
QQ Plot showing correlations with other Gene Expression Programs in this dataset, calculated by Spearman correlation:
Interactive QQ-plot of gene loadings:
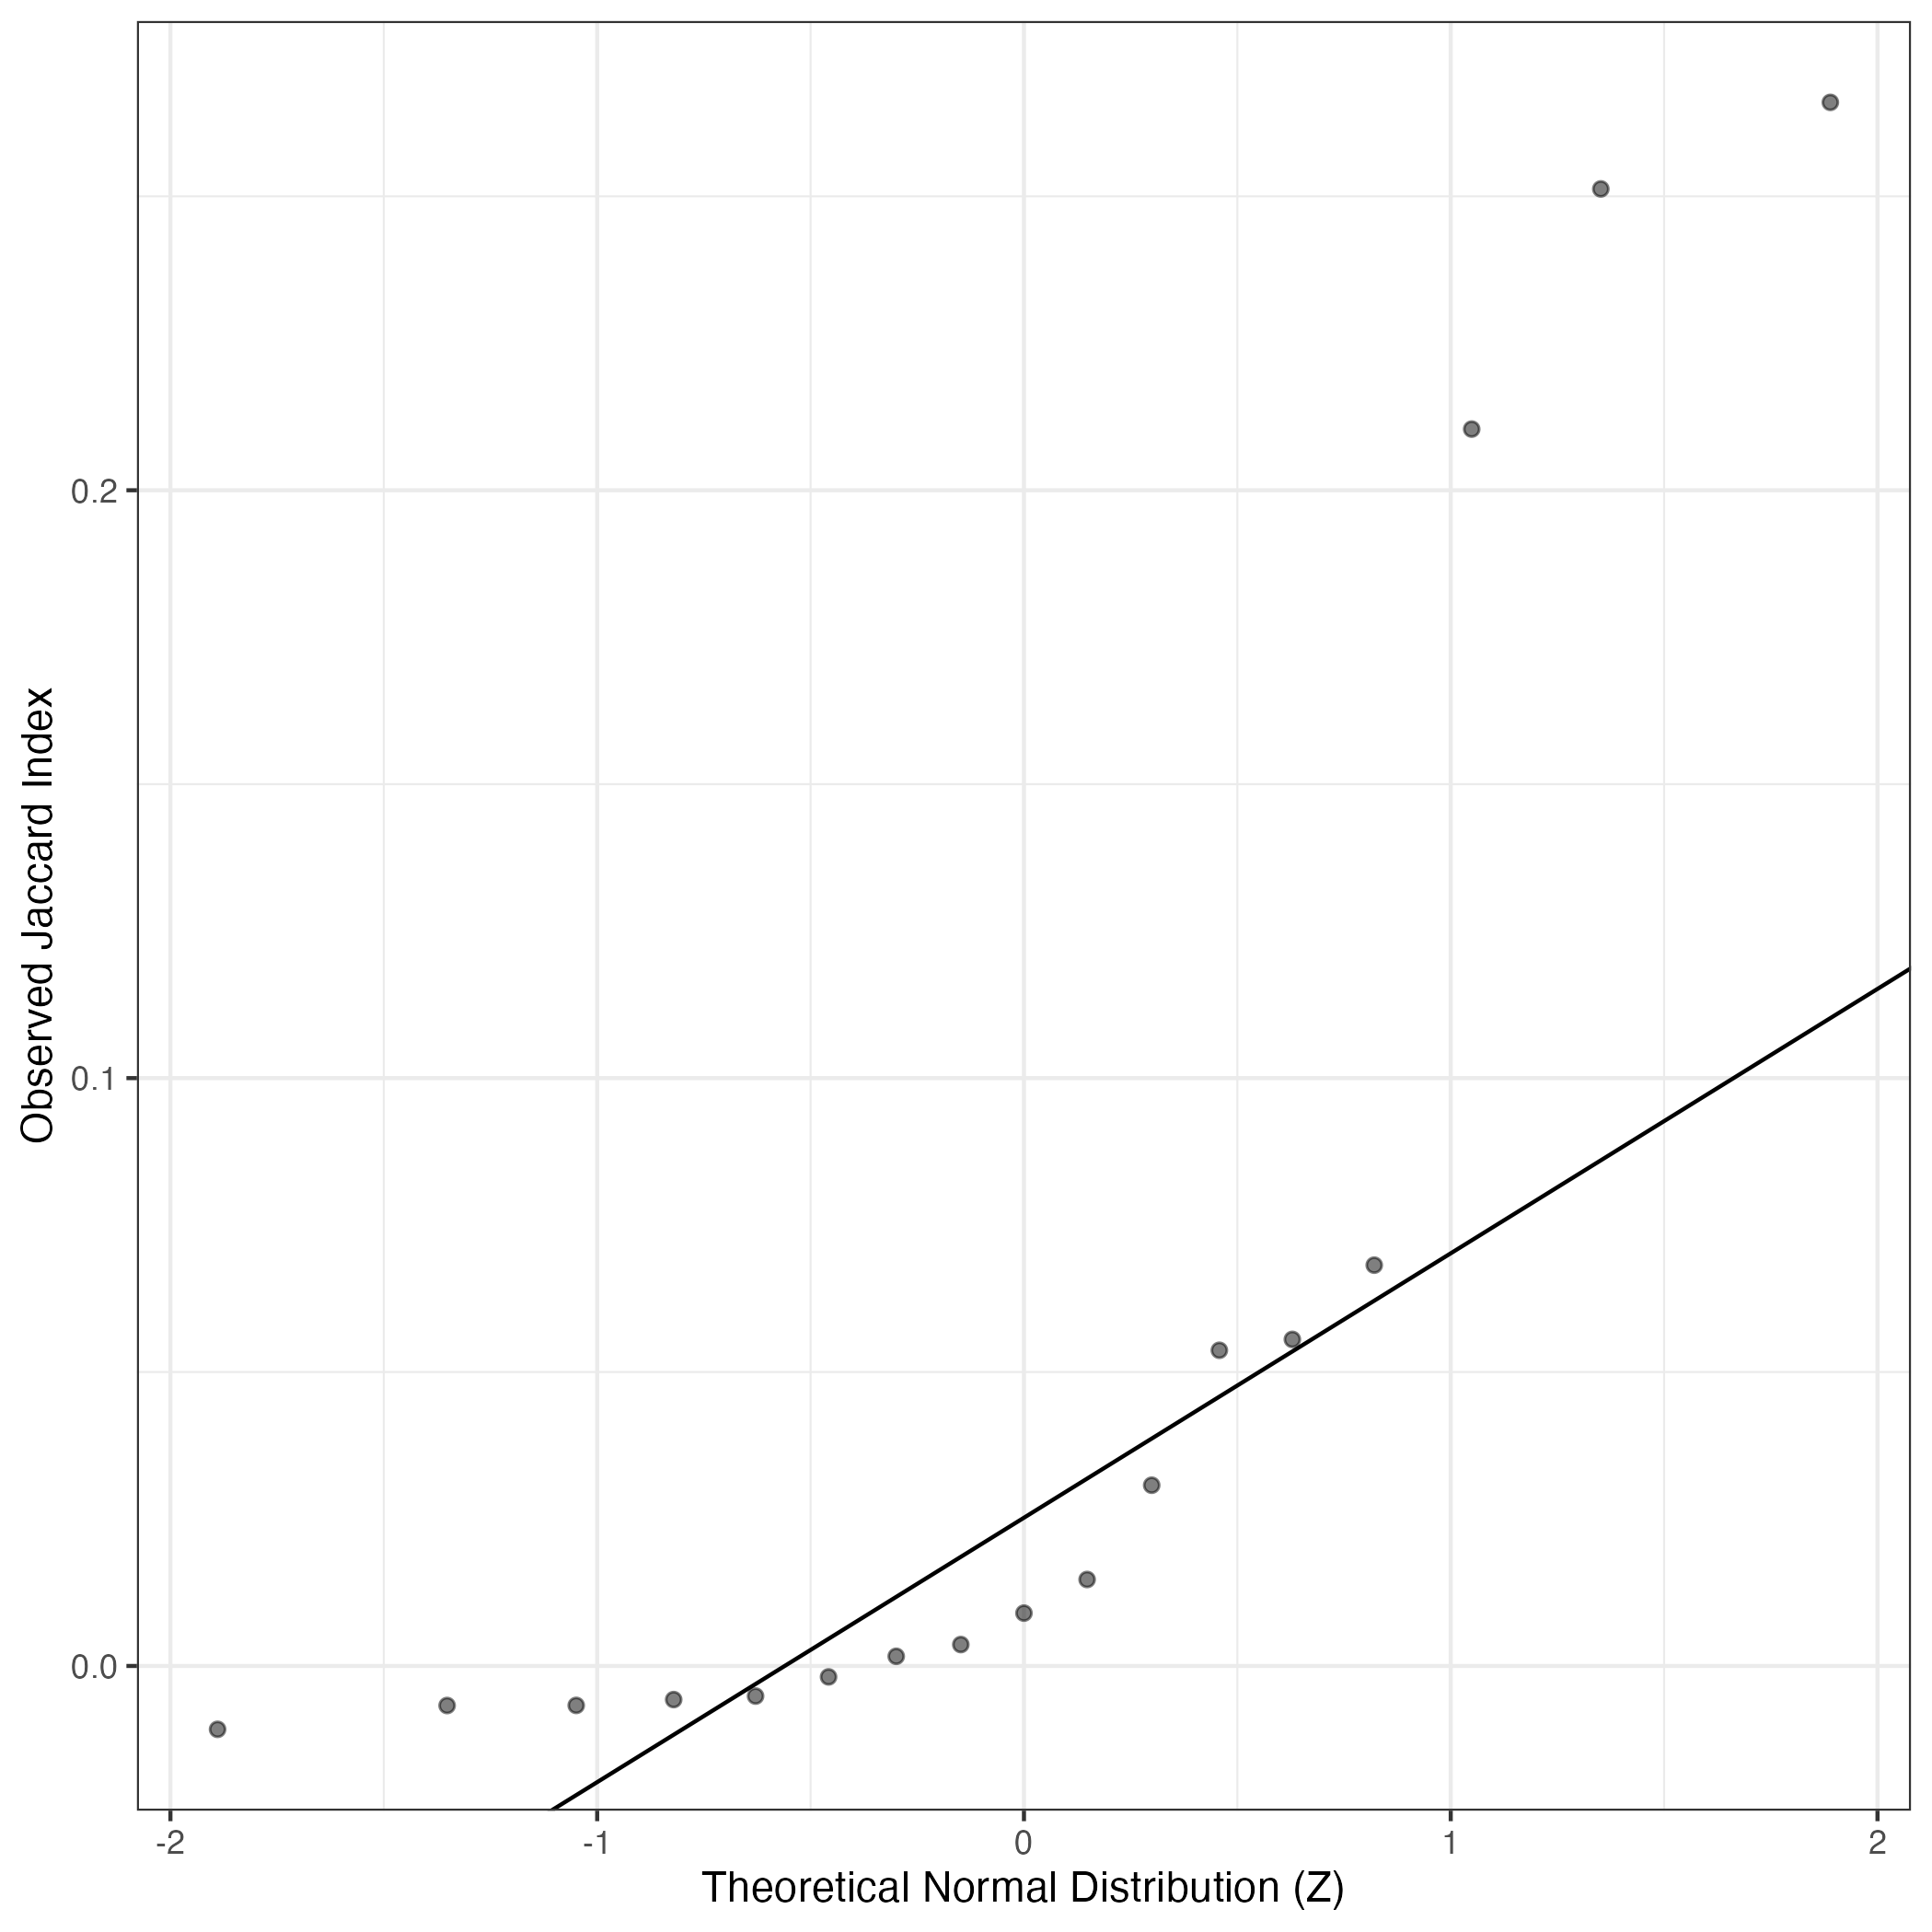
A similar QQ-plot as above, but only for instances where the H value is e.g. > 25, i.e. we are confident that the expression program is active above noise. Agreemenet between these binary vectors is tested using the Jaccard Index, with the P-values calculated by an exact test:
Interactive QQ-plot:
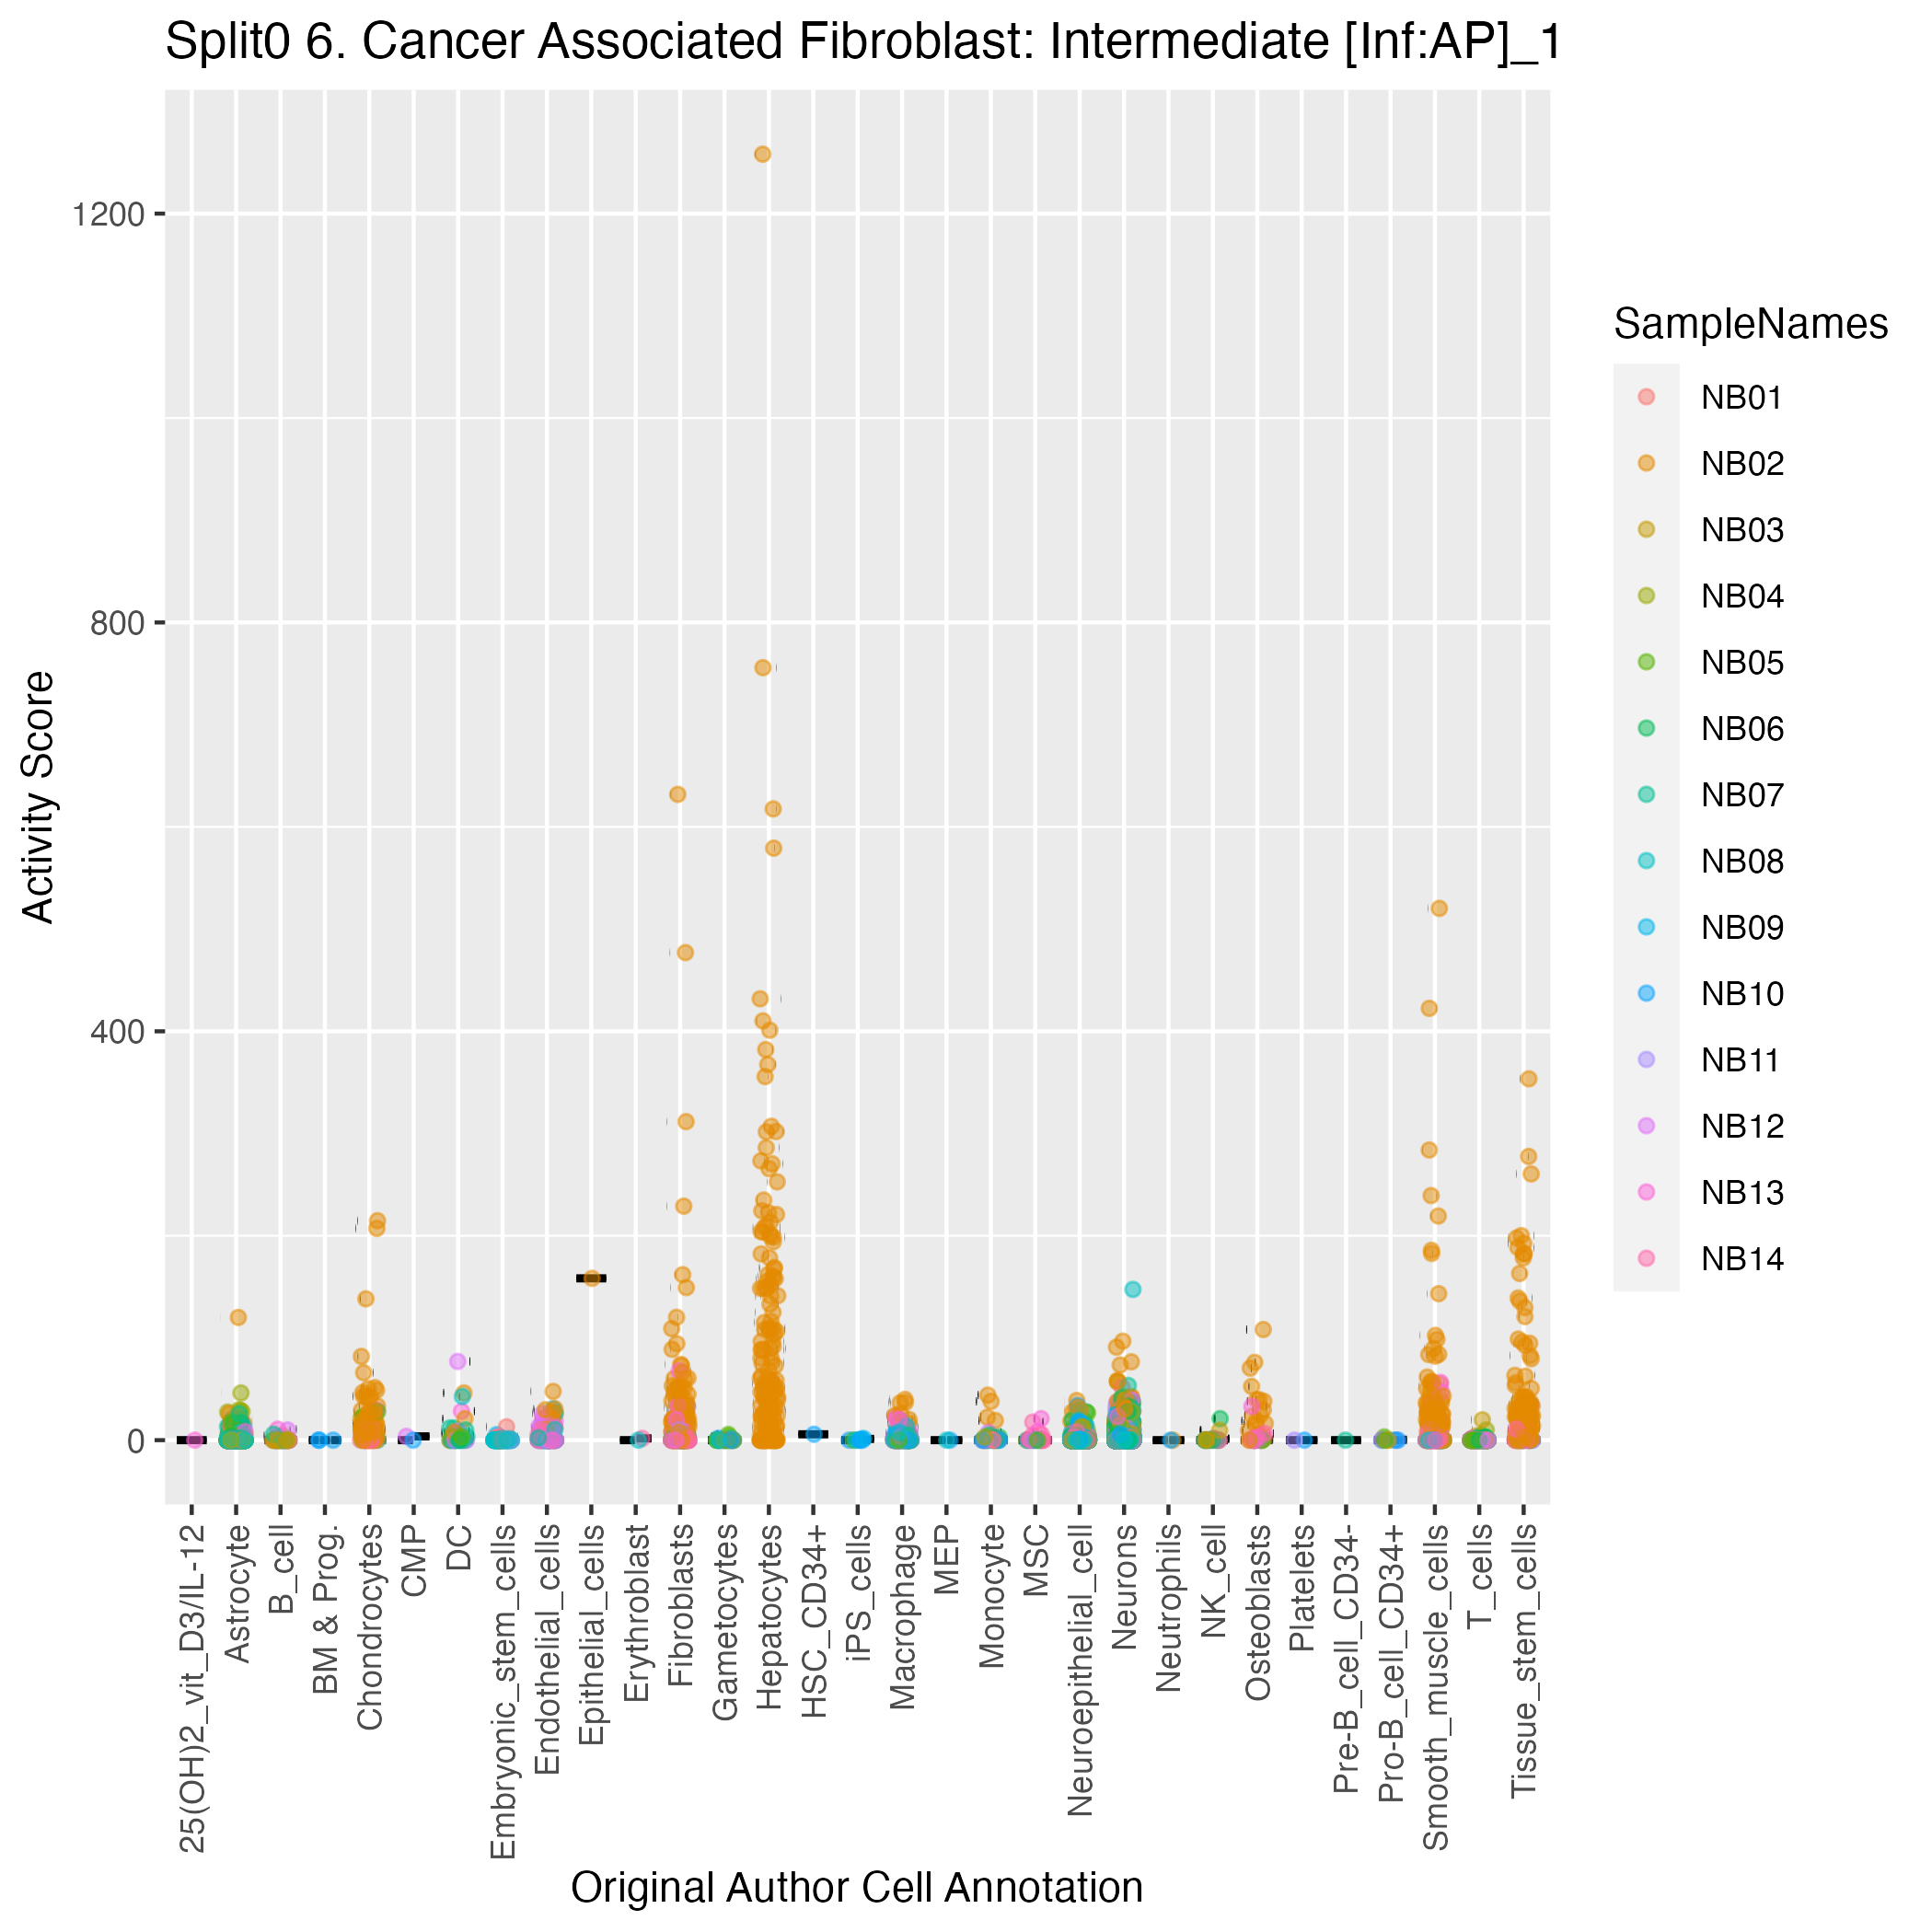
Singler cell type annotations for the top 50 cells on this program.
| Cell ID | Singler label | Singler Delta | Activity Score | Top Singler Raw Scores |
|---|---|---|---|---|
| NB02_ACGATGTGTGCCTGCA-1 | Hepatocytes | 0.12 | 1258.14 | Raw ScoresHepatocytes: 0.26, iPS_cells:CRL2097_foreskin-derived:d20_hepatic_diff: 0.2, Epithelial_cells:bronchial: 0.2, Smooth_muscle_cells:vascular: 0.2, Smooth_muscle_cells:vascular:IL-17: 0.2, Chondrocytes:MSC-derived: 0.2, Fibroblasts:breast: 0.19, Tissue_stem_cells:BM_MSC:TGFb3: 0.19, Endothelial_cells:lymphatic:TNFa_48h: 0.19, Endothelial_cells:lymphatic: 0.19 |
| NB02_GTCAAGTAGAATTGTG-1 | iPS_cells:CRL2097_foreskin-derived:d20_hepatic_diff | 0.07 | 755.74 | Raw ScoresTissue_stem_cells:BM_MSC:TGFb3: 0.25, Smooth_muscle_cells:vascular:IL-17: 0.25, Smooth_muscle_cells:vascular: 0.25, Osteoblasts: 0.24, Tissue_stem_cells:BM_MSC:BMP2: 0.24, Fibroblasts:breast: 0.24, Tissue_stem_cells:BM_MSC: 0.24, iPS_cells:adipose_stem_cells: 0.24, Tissue_stem_cells:BM_MSC:osteogenic: 0.24, Chondrocytes:MSC-derived: 0.24 |
| NB02_CGAGAAGGTCGCATAT-1 | iPS_cells:CRL2097_foreskin-derived:d20_hepatic_diff | 0.05 | 631.81 | Raw ScoresiPS_cells:CRL2097_foreskin: 0.15, Fibroblasts:breast: 0.14, Smooth_muscle_cells:vascular: 0.14, Smooth_muscle_cells:vascular:IL-17: 0.14, Tissue_stem_cells:BM_MSC:TGFb3: 0.14, Osteoblasts: 0.14, Tissue_stem_cells:BM_MSC: 0.13, Osteoblasts:BMP2: 0.13, iPS_cells:adipose_stem_cells: 0.13, Smooth_muscle_cells:bronchial: 0.13 |
| NB02_GTACTTTGTATTCTCT-1 | iPS_cells:CRL2097_foreskin-derived:d20_hepatic_diff | 0.06 | 617.59 | Raw ScoresHepatocytes: 0.16, Fibroblasts:breast: 0.16, iPS_cells:adipose_stem_cells: 0.15, Smooth_muscle_cells:vascular: 0.15, Osteoblasts: 0.15, Osteoblasts:BMP2: 0.15, iPS_cells:CRL2097_foreskin: 0.15, Smooth_muscle_cells:vascular:IL-17: 0.14, iPS_cells:skin_fibroblast: 0.14, Smooth_muscle_cells:bronchial: 0.14 |
| NB02_GGACAGACACAACGTT-1 | Hepatocytes | 0.11 | 579.18 | Raw ScoresHepatocytes: 0.24, Smooth_muscle_cells:vascular:IL-17: 0.2, Fibroblasts:breast: 0.2, Smooth_muscle_cells:vascular: 0.2, Tissue_stem_cells:BM_MSC:TGFb3: 0.2, Osteoblasts: 0.2, Smooth_muscle_cells:bronchial: 0.2, Osteoblasts:BMP2: 0.2, Smooth_muscle_cells:bronchial:vit_D: 0.19, Tissue_stem_cells:BM_MSC: 0.19 |
| NB02_CTTAGGACAAGTCTGT-1 | Smooth_muscle_cells:vascular:IL-17 | 0.06 | 520.28 | Raw ScoresHepatocytes: 0.15, Fibroblasts:breast: 0.15, iPS_cells:adipose_stem_cells: 0.15, Smooth_muscle_cells:vascular:IL-17: 0.14, Chondrocytes:MSC-derived: 0.14, Tissue_stem_cells:BM_MSC:TGFb3: 0.14, Smooth_muscle_cells:vascular: 0.14, iPS_cells:CRL2097_foreskin: 0.14, iPS_cells:skin_fibroblast: 0.14, Smooth_muscle_cells:bronchial: 0.14 |
| NB02_CGAATGTCATGGTCAT-1 | Fibroblasts:breast | 0.06 | 477.00 | Raw ScoresFibroblasts:breast: 0.13, Smooth_muscle_cells:vascular: 0.13, Smooth_muscle_cells:bronchial: 0.13, Smooth_muscle_cells:bronchial:vit_D: 0.13, Tissue_stem_cells:iliac_MSC: 0.13, iPS_cells:CRL2097_foreskin: 0.13, Tissue_stem_cells:BM_MSC:TGFb3: 0.13, Osteoblasts: 0.13, Tissue_stem_cells:BM_MSC:BMP2: 0.12, Smooth_muscle_cells:vascular:IL-17: 0.12 |
| NB02_TCAGCAACAGCTTAAC-1 | iPS_cells:CRL2097_foreskin-derived:d20_hepatic_diff | 0.03 | 431.82 | Raw ScoresHepatocytes: 0.11, iPS_cells:CRL2097_foreskin-derived:d20_hepatic_diff: 0.1, Osteoblasts:BMP2: 0.09, Chondrocytes:MSC-derived: 0.09, Epithelial_cells:bladder: 0.09, Osteoblasts: 0.09, Tissue_stem_cells:BM_MSC:TGFb3: 0.09, iPS_cells:CRL2097_foreskin: 0.09, Fibroblasts:breast: 0.09, Smooth_muscle_cells:vascular: 0.09 |
| NB02_TTGGAACCAAGTCTAC-1 | Neurons:Schwann_cell | 0.06 | 422.45 | Raw ScoresSmooth_muscle_cells:vascular: 0.16, Smooth_muscle_cells:vascular:IL-17: 0.16, Fibroblasts:breast: 0.15, Osteoblasts:BMP2: 0.15, Hepatocytes: 0.15, iPS_cells:CRL2097_foreskin: 0.15, Osteoblasts: 0.15, Smooth_muscle_cells:bronchial: 0.15, Tissue_stem_cells:BM_MSC: 0.14, Smooth_muscle_cells:bronchial:vit_D: 0.14 |
| NB02_ACTGTCCCATGTCGAT-1 | iPS_cells:CRL2097_foreskin-derived:d20_hepatic_diff | 0.04 | 410.20 | Raw ScoresOsteoblasts: 0.12, Hepatocytes: 0.12, Smooth_muscle_cells:vascular: 0.12, Smooth_muscle_cells:vascular:IL-17: 0.11, Fibroblasts:breast: 0.11, Endothelial_cells:lymphatic:TNFa_48h: 0.11, Osteoblasts:BMP2: 0.11, Chondrocytes:MSC-derived: 0.11, Tissue_stem_cells:BM_MSC:TGFb3: 0.11, Tissue_stem_cells:iliac_MSC: 0.11 |
| NB02_GGGTCTGCAAGTAATG-1 | Hepatocytes | 0.09 | 401.06 | Raw ScoresHepatocytes: 0.17, Smooth_muscle_cells:vascular: 0.14, Osteoblasts:BMP2: 0.14, Osteoblasts: 0.13, Smooth_muscle_cells:vascular:IL-17: 0.13, Smooth_muscle_cells:bronchial: 0.13, Fibroblasts:breast: 0.13, Smooth_muscle_cells:bronchial:vit_D: 0.13, Tissue_stem_cells:iliac_MSC: 0.13, iPS_cells:CRL2097_foreskin: 0.13 |
| NB02_GCATGCGTCACTCCTG-1 | Tissue_stem_cells:BM_MSC:osteogenic | 0.04 | 382.13 | Raw ScoresHepatocytes: 0.13, Smooth_muscle_cells:vascular:IL-17: 0.13, Chondrocytes:MSC-derived: 0.13, Smooth_muscle_cells:vascular: 0.13, Osteoblasts:BMP2: 0.12, Tissue_stem_cells:BM_MSC:osteogenic: 0.12, Endothelial_cells:lymphatic:TNFa_48h: 0.12, Tissue_stem_cells:BM_MSC:BMP2: 0.12, Osteoblasts: 0.12, Smooth_muscle_cells:bronchial: 0.12 |
| NB02_GGTGAAGAGGCATGGT-1 | Hepatocytes | 0.11 | 367.52 | Raw ScoresHepatocytes: 0.21, Smooth_muscle_cells:vascular: 0.17, Smooth_muscle_cells:vascular:IL-17: 0.16, Tissue_stem_cells:BM_MSC:TGFb3: 0.16, Tissue_stem_cells:BM_MSC:BMP2: 0.16, Fibroblasts:breast: 0.15, Smooth_muscle_cells:bronchial: 0.15, Smooth_muscle_cells:bronchial:vit_D: 0.15, Osteoblasts: 0.15, Chondrocytes:MSC-derived: 0.15 |
| NB02_CTCGAGGAGGAACTGC-1 | iPS_cells:CRL2097_foreskin-derived:d20_hepatic_diff | 0.04 | 355.70 | Raw ScoresHepatocytes: 0.13, Fibroblasts:breast: 0.13, Smooth_muscle_cells:bronchial: 0.13, iPS_cells:CRL2097_foreskin: 0.13, Smooth_muscle_cells:bronchial:vit_D: 0.12, Chondrocytes:MSC-derived: 0.12, Osteoblasts:BMP2: 0.12, Osteoblasts: 0.12, Smooth_muscle_cells:vascular:IL-17: 0.12, Smooth_muscle_cells:vascular: 0.12 |
| NB02_CGAGAAGTCAGCATGT-1 | Chondrocytes:MSC-derived | 0.11 | 353.52 | Raw ScoresChondrocytes:MSC-derived: 0.2, Fibroblasts:breast: 0.2, Osteoblasts: 0.2, Tissue_stem_cells:BM_MSC:TGFb3: 0.19, Tissue_stem_cells:BM_MSC: 0.19, Tissue_stem_cells:BM_MSC:BMP2: 0.19, Tissue_stem_cells:BM_MSC:osteogenic: 0.19, Smooth_muscle_cells:vascular:IL-17: 0.19, iPS_cells:adipose_stem_cells: 0.19, Smooth_muscle_cells:vascular: 0.18 |
| NB02_ATGGGAGTCACGAAGG-1 | Fibroblasts:breast | 0.06 | 311.61 | Raw ScoresFibroblasts:breast: 0.14, Smooth_muscle_cells:vascular: 0.13, Tissue_stem_cells:BM_MSC:TGFb3: 0.13, Tissue_stem_cells:BM_MSC:BMP2: 0.13, Smooth_muscle_cells:vascular:IL-17: 0.13, Osteoblasts: 0.13, Tissue_stem_cells:BM_MSC: 0.13, iPS_cells:adipose_stem_cells: 0.12, Tissue_stem_cells:BM_MSC:osteogenic: 0.12, Chondrocytes:MSC-derived: 0.12 |
| NB02_CCGTTCAAGACTGTAA-1 | Hepatocytes | 0.05 | 307.08 | Raw ScoresHepatocytes: 0.13, Tissue_stem_cells:BM_MSC:TGFb3: 0.11, Endothelial_cells:lymphatic:TNFa_48h: 0.11, Tissue_stem_cells:BM_MSC:BMP2: 0.11, Endothelial_cells:lymphatic: 0.11, Chondrocytes:MSC-derived: 0.11, Smooth_muscle_cells:bronchial: 0.11, iPS_cells:CRL2097_foreskin: 0.1, Smooth_muscle_cells:bronchial:vit_D: 0.1, Osteoblasts: 0.1 |
| NB02_TGGCCAGTCTTGCAAG-1 | Hepatocytes | 0.08 | 301.88 | Raw ScoresHepatocytes: 0.18, Tissue_stem_cells:BM_MSC:TGFb3: 0.15, Smooth_muscle_cells:vascular:IL-17: 0.15, Osteoblasts: 0.15, Smooth_muscle_cells:vascular: 0.15, Chondrocytes:MSC-derived: 0.15, Osteoblasts:BMP2: 0.15, Smooth_muscle_cells:bronchial: 0.14, Tissue_stem_cells:BM_MSC: 0.14, Smooth_muscle_cells:bronchial:vit_D: 0.14 |
| NB02_GCGAGAATCTTCGGTC-1 | iPS_cells:CRL2097_foreskin-derived:d20_hepatic_diff | 0.04 | 301.64 | Raw ScoresHepatocytes: 0.13, Tissue_stem_cells:BM_MSC:TGFb3: 0.12, Tissue_stem_cells:BM_MSC:BMP2: 0.12, Tissue_stem_cells:BM_MSC: 0.12, Osteoblasts:BMP2: 0.12, Osteoblasts: 0.11, Smooth_muscle_cells:vascular:IL-17: 0.11, Tissue_stem_cells:BM_MSC:osteogenic: 0.11, Smooth_muscle_cells:bronchial: 0.11, Smooth_muscle_cells:vascular: 0.11 |
| NB02_TACTCGCTCTGATACG-1 | iPS_cells:CRL2097_foreskin-derived:d20_hepatic_diff | 0.04 | 286.11 | Raw ScoresEndothelial_cells:lymphatic:TNFa_48h: 0.13, Smooth_muscle_cells:vascular: 0.13, Hepatocytes: 0.13, Smooth_muscle_cells:vascular:IL-17: 0.13, Tissue_stem_cells:BM_MSC: 0.13, Fibroblasts:breast: 0.12, Endothelial_cells:HUVEC:VEGF: 0.12, Endothelial_cells:lymphatic: 0.12, Tissue_stem_cells:BM_MSC:BMP2: 0.12, Osteoblasts: 0.12 |
| NB02_ATGCGATGTCCTGCTT-1 | Hepatocytes | 0.05 | 283.88 | Raw ScoresSmooth_muscle_cells:vascular: 0.12, Smooth_muscle_cells:vascular:IL-17: 0.12, Chondrocytes:MSC-derived: 0.12, Osteoblasts:BMP2: 0.12, Osteoblasts: 0.12, Tissue_stem_cells:BM_MSC: 0.12, Fibroblasts:breast: 0.11, iPS_cells:CRL2097_foreskin: 0.11, Tissue_stem_cells:BM_MSC:osteogenic: 0.11, Hepatocytes: 0.11 |
| NB02_GTCTTCGTCTTAACCT-1 | iPS_cells:CRL2097_foreskin-derived:d20_hepatic_diff | 0.05 | 277.56 | Raw ScoresiPS_cells:CRL2097_foreskin-derived:d20_hepatic_diff: 0.11, Hepatocytes: 0.1, Tissue_stem_cells:BM_MSC:TGFb3: 0.1, Smooth_muscle_cells:vascular:IL-17: 0.1, Tissue_stem_cells:BM_MSC:BMP2: 0.1, Osteoblasts: 0.1, Chondrocytes:MSC-derived: 0.1, Smooth_muscle_cells:vascular: 0.1, iPS_cells:adipose_stem_cells: 0.1, Osteoblasts:BMP2: 0.09 |
| NB02_CCGGTAGCATGATCCA-1 | Smooth_muscle_cells:vascular:IL-17 | 0.05 | 273.24 | Raw ScoresTissue_stem_cells:BM_MSC:TGFb3: 0.14, Smooth_muscle_cells:vascular: 0.14, Smooth_muscle_cells:vascular:IL-17: 0.13, Tissue_stem_cells:BM_MSC:BMP2: 0.13, Fibroblasts:breast: 0.13, Smooth_muscle_cells:bronchial: 0.13, Osteoblasts:BMP2: 0.13, Endothelial_cells:lymphatic:TNFa_48h: 0.13, Tissue_stem_cells:BM_MSC: 0.13, Smooth_muscle_cells:bronchial:vit_D: 0.13 |
| NB02_TGAGGGACAGCTGCTG-1 | iPS_cells:CRL2097_foreskin-derived:d20_hepatic_diff | 0.07 | 270.43 | Raw ScoresHepatocytes: 0.15, Fibroblasts:breast: 0.15, Smooth_muscle_cells:vascular: 0.15, Smooth_muscle_cells:bronchial: 0.15, Smooth_muscle_cells:vascular:IL-17: 0.14, Osteoblasts: 0.14, iPS_cells:CRL2097_foreskin: 0.14, iPS_cells:CRL2097_foreskin-derived:d20_hepatic_diff: 0.14, Smooth_muscle_cells:bronchial:vit_D: 0.14, Osteoblasts:BMP2: 0.14 |
| NB02_CGTCAGGTCAACACAC-1 | Hepatocytes | 0.04 | 265.57 | Raw ScoresOsteoblasts: 0.1, Osteoblasts:BMP2: 0.1, Tissue_stem_cells:BM_MSC:TGFb3: 0.1, Fibroblasts:breast: 0.1, Neurons:Schwann_cell: 0.1, Smooth_muscle_cells:vascular:IL-17: 0.1, Tissue_stem_cells:BM_MSC:BMP2: 0.1, iPS_cells:CRL2097_foreskin-derived:d20_hepatic_diff: 0.1, Smooth_muscle_cells:vascular: 0.1, iPS_cells:CRL2097_foreskin: 0.1 |
| NB02_ATTCTACCAAACTGTC-1 | Tissue_stem_cells:BM_MSC | 0.13 | 260.47 | Raw ScoresFibroblasts:breast: 0.2, Chondrocytes:MSC-derived: 0.19, Tissue_stem_cells:BM_MSC: 0.19, Smooth_muscle_cells:vascular:IL-17: 0.19, iPS_cells:adipose_stem_cells: 0.19, Smooth_muscle_cells:vascular: 0.19, Osteoblasts: 0.19, Tissue_stem_cells:BM_MSC:osteogenic: 0.19, Tissue_stem_cells:BM_MSC:BMP2: 0.19, Tissue_stem_cells:BM_MSC:TGFb3: 0.18 |
| NB02_CGTGTAACATCACAAC-1 | Hepatocytes | 0.07 | 252.71 | Raw ScoresHepatocytes: 0.11, Fibroblasts:breast: 0.11, Smooth_muscle_cells:vascular:IL-17: 0.11, Smooth_muscle_cells:vascular: 0.11, Osteoblasts:BMP2: 0.1, iPS_cells:CRL2097_foreskin: 0.1, Epithelial_cells:bladder: 0.1, iPS_cells:adipose_stem_cells: 0.1, Smooth_muscle_cells:bronchial: 0.1, Osteoblasts: 0.1 |
| NB02_TTCTTAGCAATCACAC-1 | Smooth_muscle_cells:vascular:IL-17 | 0.08 | 239.27 | Raw ScoresSmooth_muscle_cells:vascular: 0.13, Smooth_muscle_cells:bronchial: 0.13, Osteoblasts: 0.13, Smooth_muscle_cells:vascular:IL-17: 0.13, Smooth_muscle_cells:bronchial:vit_D: 0.13, Fibroblasts:breast: 0.13, iPS_cells:CRL2097_foreskin: 0.13, Chondrocytes:MSC-derived: 0.12, Tissue_stem_cells:BM_MSC:TGFb3: 0.12, Tissue_stem_cells:BM_MSC: 0.12 |
| NB02_AGATCTGCATTATCTC-1 | iPS_cells:CRL2097_foreskin-derived:d20_hepatic_diff | 0.04 | 234.93 | Raw ScoresSmooth_muscle_cells:vascular: 0.1, Smooth_muscle_cells:vascular:IL-17: 0.1, Smooth_muscle_cells:bronchial: 0.1, Fibroblasts:breast: 0.1, Tissue_stem_cells:BM_MSC:TGFb3: 0.1, Smooth_muscle_cells:bronchial:vit_D: 0.09, Hepatocytes: 0.09, Osteoblasts: 0.09, Osteoblasts:BMP2: 0.09, Chondrocytes:MSC-derived: 0.09 |
| NB02_ATAAGAGAGATTACCC-1 | Smooth_muscle_cells:vascular:IL-17 | 0.07 | 228.95 | Raw ScoresHepatocytes: 0.14, Smooth_muscle_cells:vascular:IL-17: 0.14, Tissue_stem_cells:BM_MSC:BMP2: 0.14, Smooth_muscle_cells:vascular: 0.14, iPS_cells:adipose_stem_cells: 0.13, Osteoblasts:BMP2: 0.13, Fibroblasts:breast: 0.13, Tissue_stem_cells:BM_MSC:TGFb3: 0.13, Tissue_stem_cells:BM_MSC:osteogenic: 0.13, Smooth_muscle_cells:bronchial:vit_D: 0.13 |
| NB02_CACATTTTCAAGCCTA-1 | Tissue_stem_cells:BM_MSC:TGFb3 | 0.04 | 224.38 | Raw ScoresHepatocytes: 0.11, Smooth_muscle_cells:vascular: 0.11, Fibroblasts:breast: 0.11, Tissue_stem_cells:BM_MSC:TGFb3: 0.1, Smooth_muscle_cells:vascular:IL-17: 0.1, Endothelial_cells:lymphatic:TNFa_48h: 0.1, Tissue_stem_cells:BM_MSC:BMP2: 0.1, Neuroepithelial_cell:ESC-derived: 0.1, Epithelial_cells:bronchial: 0.1, Tissue_stem_cells:BM_MSC: 0.09 |
| NB02_GATCGCGAGGACGAAA-1 | Tissue_stem_cells:BM_MSC:osteogenic | 0.05 | 222.47 | Raw ScoresOsteoblasts: 0.09, Tissue_stem_cells:BM_MSC: 0.09, Tissue_stem_cells:BM_MSC:osteogenic: 0.09, Fibroblasts:breast: 0.09, Chondrocytes:MSC-derived: 0.09, Osteoblasts:BMP2: 0.09, Smooth_muscle_cells:vascular: 0.09, Smooth_muscle_cells:vascular:IL-17: 0.09, Tissue_stem_cells:BM_MSC:BMP2: 0.09, iPS_cells:adipose_stem_cells: 0.08 |
| NB02_CTAAGACTCTATGTGG-1 | Fibroblasts:breast | 0.07 | 220.76 | Raw ScoresFibroblasts:breast: 0.13, Tissue_stem_cells:BM_MSC:TGFb3: 0.12, Chondrocytes:MSC-derived: 0.12, iPS_cells:adipose_stem_cells: 0.12, Osteoblasts: 0.12, Tissue_stem_cells:BM_MSC:BMP2: 0.12, iPS_cells:CRL2097_foreskin: 0.12, Osteoblasts:BMP2: 0.12, Tissue_stem_cells:iliac_MSC: 0.11, Smooth_muscle_cells:vascular: 0.11 |
| NB02_GCGCAACGTTGGTAAA-1 | iPS_cells:adipose_stem_cells | 0.04 | 219.28 | Raw ScoresSmooth_muscle_cells:vascular:IL-17: 0.11, Epithelial_cells:bladder: 0.11, Osteoblasts:BMP2: 0.11, Smooth_muscle_cells:vascular: 0.11, Tissue_stem_cells:BM_MSC: 0.11, iPS_cells:adipose_stem_cells: 0.1, Osteoblasts: 0.1, Tissue_stem_cells:BM_MSC:TGFb3: 0.1, iPS_cells:PDB_fibroblasts: 0.1, Fibroblasts:breast: 0.1 |
| NB02_ATCTGCCAGCTAACTC-1 | Tissue_stem_cells:BM_MSC | 0.07 | 214.69 | Raw ScoresOsteoblasts: 0.12, Osteoblasts:BMP2: 0.12, Tissue_stem_cells:BM_MSC: 0.12, Smooth_muscle_cells:vascular:IL-17: 0.12, Tissue_stem_cells:BM_MSC:TGFb3: 0.12, Chondrocytes:MSC-derived: 0.12, Fibroblasts:breast: 0.12, Smooth_muscle_cells:vascular: 0.12, iPS_cells:adipose_stem_cells: 0.12, iPS_cells:CRL2097_foreskin: 0.12 |
| NB02_GATCGCGCAATGGACG-1 | Hepatocytes | 0.05 | 213.39 | Raw ScoresOsteoblasts: 0.09, Smooth_muscle_cells:bronchial: 0.09, Smooth_muscle_cells:vascular:IL-17: 0.08, Tissue_stem_cells:BM_MSC:osteogenic: 0.08, Tissue_stem_cells:BM_MSC:BMP2: 0.08, Hepatocytes: 0.08, Chondrocytes:MSC-derived: 0.08, Tissue_stem_cells:BM_MSC: 0.08, Smooth_muscle_cells:vascular: 0.08, Smooth_muscle_cells:bronchial:vit_D: 0.08 |
| NB02_TCACGAAGTAGCACGA-1 | iPS_cells:adipose_stem_cells | 0.07 | 209.37 | Raw ScoresSmooth_muscle_cells:vascular:IL-17: 0.15, Fibroblasts:breast: 0.14, Tissue_stem_cells:BM_MSC:TGFb3: 0.14, Smooth_muscle_cells:vascular: 0.14, iPS_cells:adipose_stem_cells: 0.14, Tissue_stem_cells:BM_MSC:BMP2: 0.14, Smooth_muscle_cells:bronchial: 0.14, Chondrocytes:MSC-derived: 0.14, Smooth_muscle_cells:bronchial:vit_D: 0.14, Hepatocytes: 0.13 |
| NB02_AATCCAGGTTTACTCT-1 | Hepatocytes | 0.07 | 207.98 | Raw ScoresHepatocytes: 0.11, iPS_cells:CRL2097_foreskin-derived:d20_hepatic_diff: 0.09, Smooth_muscle_cells:vascular: 0.09, Tissue_stem_cells:BM_MSC:BMP2: 0.09, Tissue_stem_cells:BM_MSC:TGFb3: 0.09, Smooth_muscle_cells:vascular:IL-17: 0.09, Tissue_stem_cells:BM_MSC: 0.08, Tissue_stem_cells:iliac_MSC: 0.08, Chondrocytes:MSC-derived: 0.08, Fibroblasts:breast: 0.08 |
| NB02_AGCGGTCAGCTCCTTC-1 | iPS_cells:adipose_stem_cells | 0.05 | 207.16 | Raw ScoresSmooth_muscle_cells:bronchial: 0.13, Smooth_muscle_cells:bronchial:vit_D: 0.13, Fibroblasts:breast: 0.13, iPS_cells:CRL2097_foreskin: 0.12, Osteoblasts: 0.12, Tissue_stem_cells:iliac_MSC: 0.12, iPS_cells:adipose_stem_cells: 0.12, Chondrocytes:MSC-derived: 0.12, Hepatocytes: 0.12, iPS_cells:CRL2097_foreskin-derived:d20_hepatic_diff: 0.12 |
| NB02_TAGTGGTCAGGGAGAG-1 | Hepatocytes | 0.05 | 204.01 | Raw ScoresHepatocytes: 0.11, Neurons:Schwann_cell: 0.1, Fibroblasts:breast: 0.1, Astrocyte:Embryonic_stem_cell-derived: 0.1, Osteoblasts:BMP2: 0.09, Smooth_muscle_cells:vascular: 0.09, Neuroepithelial_cell:ESC-derived: 0.09, Epithelial_cells:bladder: 0.09, iPS_cells:adipose_stem_cells: 0.09, Smooth_muscle_cells:vascular:IL-17: 0.09 |
| NB02_ACGAGCCCAGACACTT-1 | Hepatocytes | 0.03 | 203.74 | Raw ScoresSmooth_muscle_cells:bronchial:vit_D: 0.08, Hepatocytes: 0.07, Smooth_muscle_cells:bronchial: 0.07, iPS_cells:CRL2097_foreskin-derived:d20_hepatic_diff: 0.07, Neurons:Schwann_cell: 0.07, Smooth_muscle_cells:vascular:IL-17: 0.07, Smooth_muscle_cells:vascular: 0.07, Embryonic_stem_cells: 0.07, Tissue_stem_cells:BM_MSC:BMP2: 0.07, Tissue_stem_cells:BM_MSC: 0.07 |
| NB02_ACGCAGCCATCTCGCT-1 | iPS_cells:CRL2097_foreskin-derived:d20_hepatic_diff | 0.04 | 201.45 | Raw ScoresSmooth_muscle_cells:vascular: 0.12, Smooth_muscle_cells:vascular:IL-17: 0.12, Fibroblasts:breast: 0.11, iPS_cells:adipose_stem_cells: 0.1, Smooth_muscle_cells:bronchial: 0.1, Smooth_muscle_cells:bronchial:vit_D: 0.1, Hepatocytes: 0.1, iPS_cells:CRL2097_foreskin: 0.1, Chondrocytes:MSC-derived: 0.1, Tissue_stem_cells:BM_MSC:TGFb3: 0.1 |
| NB02_TGTTCCGAGATCCTGT-1 | Tissue_stem_cells:BM_MSC:BMP2 | 0.05 | 200.11 | Raw ScoresOsteoblasts: 0.1, Tissue_stem_cells:BM_MSC:BMP2: 0.1, Chondrocytes:MSC-derived: 0.1, Smooth_muscle_cells:bronchial: 0.1, Tissue_stem_cells:BM_MSC: 0.1, Tissue_stem_cells:BM_MSC:TGFb3: 0.1, Tissue_stem_cells:BM_MSC:osteogenic: 0.1, Smooth_muscle_cells:bronchial:vit_D: 0.1, iPS_cells:CRL2097_foreskin: 0.09, Smooth_muscle_cells:vascular: 0.09 |
| NB02_CATATGGCAGGGTATG-1 | iPS_cells:CRL2097_foreskin-derived:d20_hepatic_diff | 0.03 | 199.39 | Raw ScoresHepatocytes: 0.1, iPS_cells:CRL2097_foreskin-derived:d20_hepatic_diff: 0.1, Tissue_stem_cells:BM_MSC:TGFb3: 0.1, Epithelial_cells:bladder: 0.1, Fibroblasts:breast: 0.1, Tissue_stem_cells:BM_MSC:BMP2: 0.1, Chondrocytes:MSC-derived: 0.09, Smooth_muscle_cells:vascular:IL-17: 0.09, Smooth_muscle_cells:bronchial: 0.09, Smooth_muscle_cells:vascular: 0.09 |
| NB02_TTGCGTCAGATGTCGG-1 | Hepatocytes | 0.15 | 198.60 | Raw ScoresHepatocytes: 0.24, Smooth_muscle_cells:vascular: 0.17, Osteoblasts: 0.16, Smooth_muscle_cells:vascular:IL-17: 0.16, Fibroblasts:breast: 0.16, Tissue_stem_cells:iliac_MSC: 0.16, iPS_cells:CRL2097_foreskin-derived:d20_hepatic_diff: 0.16, Tissue_stem_cells:BM_MSC:TGFb3: 0.16, Osteoblasts:BMP2: 0.16, Tissue_stem_cells:BM_MSC:BMP2: 0.16 |
| NB02_AATCCAGAGATATGGT-1 | Tissue_stem_cells:BM_MSC:BMP2 | 0.05 | 197.81 | Raw ScoresSmooth_muscle_cells:vascular:IL-17: 0.11, Tissue_stem_cells:BM_MSC:TGFb3: 0.11, Fibroblasts:breast: 0.11, Tissue_stem_cells:BM_MSC:BMP2: 0.1, Smooth_muscle_cells:vascular: 0.1, Osteoblasts: 0.1, Tissue_stem_cells:BM_MSC: 0.1, iPS_cells:adipose_stem_cells: 0.1, Tissue_stem_cells:BM_MSC:osteogenic: 0.1, Osteoblasts:BMP2: 0.1 |
| NB02_GCATGTAGTAGCGATG-1 | Hepatocytes | 0.04 | 194.07 | Raw ScoresHepatocytes: 0.08, Epithelial_cells:bladder: 0.07, Fibroblasts:breast: 0.07, Osteoblasts: 0.07, Smooth_muscle_cells:vascular:IL-17: 0.07, Tissue_stem_cells:iliac_MSC: 0.07, Tissue_stem_cells:BM_MSC:TGFb3: 0.07, Smooth_muscle_cells:bronchial: 0.07, Tissue_stem_cells:BM_MSC:BMP2: 0.07, Endothelial_cells:lymphatic:TNFa_48h: 0.07 |
| NB02_AACTTTCAGATGAGAG-1 | Tissue_stem_cells:BM_MSC:BMP2 | 0.03 | 192.43 | Raw ScoresTissue_stem_cells:BM_MSC:BMP2: 0.1, Tissue_stem_cells:BM_MSC:TGFb3: 0.1, Tissue_stem_cells:BM_MSC:osteogenic: 0.09, Osteoblasts: 0.09, Tissue_stem_cells:iliac_MSC: 0.09, Smooth_muscle_cells:vascular:IL-17: 0.09, Fibroblasts:breast: 0.09, Tissue_stem_cells:BM_MSC: 0.09, Endothelial_cells:HUVEC:IL-1b: 0.09, Monocyte:F._tularensis_novicida: 0.09 |
| NB02_TGTTCCGCATACGCTA-1 | Tissue_stem_cells:BM_MSC:BMP2 | 0.07 | 188.47 | Raw ScoresTissue_stem_cells:BM_MSC:TGFb3: 0.12, Tissue_stem_cells:BM_MSC:BMP2: 0.12, Fibroblasts:breast: 0.12, Smooth_muscle_cells:vascular: 0.12, Tissue_stem_cells:iliac_MSC: 0.12, Osteoblasts: 0.12, Chondrocytes:MSC-derived: 0.12, Smooth_muscle_cells:vascular:IL-17: 0.12, Smooth_muscle_cells:bronchial:vit_D: 0.11, Smooth_muscle_cells:bronchial: 0.11 |
| NB02_CATGGCGTCGCTTGTC-1 | Fibroblasts:breast | 0.07 | 185.74 | Raw ScoresSmooth_muscle_cells:vascular:IL-17: 0.13, Fibroblasts:breast: 0.13, Smooth_muscle_cells:vascular: 0.12, Osteoblasts:BMP2: 0.12, Smooth_muscle_cells:bronchial:vit_D: 0.12, Smooth_muscle_cells:bronchial: 0.12, Osteoblasts: 0.12, Tissue_stem_cells:BM_MSC: 0.12, Chondrocytes:MSC-derived: 0.12, Tissue_stem_cells:BM_MSC:TGFb3: 0.12 |
Below shows the significant enrichments of this GEP for literature curated gene lists
This data was procured from existing single cell RNA-seq maps of neuroblastoma or related relevant data.
High ranks indicate this gene is a driver of this GEP.
These curated gene list are ranked by the P-value (on this GEP) of their constituent genes.
The Mean Count column shows the mean read count in cells scoring highly (H > 50) on this gene expression program.
Myofibroblastic CAF
These marker genes were curated across cancer subtypes in multiple organ systems as reviewed in Lavie et. al. (PMID 35883004) and contain myofibroblastic specific CAF genes:
Wilcoxon ranksum test P-value for gene set overrepresentation: 1.75e-10
Mean rank of genes in gene set: 3033.73
Rank on gene expression program of genes in gene set:
| Genes | Weight | Rank | GTEx | DepMap | Decartes | Mean.Counts | Mean.TPM |
|---|---|---|---|---|---|---|---|
| TGFB2 | 0.0048325 | 115 | GTEx | DepMap | Descartes | 0.12 | 77.17 |
| BGN | 0.0034096 | 223 | GTEx | DepMap | Descartes | 0.31 | 671.94 |
| THBS1 | 0.0033280 | 233 | GTEx | DepMap | Descartes | 0.61 | 339.33 |
| COL1A2 | 0.0028187 | 309 | GTEx | DepMap | Descartes | 1.78 | 1420.98 |
| VEGFA | 0.0027814 | 313 | GTEx | DepMap | Descartes | 0.30 | 111.29 |
| FN1 | 0.0025784 | 345 | GTEx | DepMap | Descartes | 0.99 | 480.80 |
| MMP2 | 0.0025679 | 348 | GTEx | DepMap | Descartes | 0.24 | 330.82 |
| TPM1 | 0.0025006 | 362 | GTEx | DepMap | Descartes | 0.39 | 397.38 |
| COL3A1 | 0.0019599 | 503 | GTEx | DepMap | Descartes | 0.94 | 729.03 |
| COL5A1 | 0.0018619 | 543 | GTEx | DepMap | Descartes | 0.22 | 97.43 |
| TPM2 | 0.0018465 | 551 | GTEx | DepMap | Descartes | 0.26 | 638.33 |
| TGFBR2 | 0.0018162 | 563 | GTEx | DepMap | Descartes | 0.13 | 82.51 |
| COL5A2 | 0.0017802 | 580 | GTEx | DepMap | Descartes | 0.43 | 243.54 |
| VCAN | 0.0017611 | 587 | GTEx | DepMap | Descartes | 0.39 | 136.25 |
| COL4A1 | 0.0017567 | 590 | GTEx | DepMap | Descartes | 0.25 | 195.24 |
| MYL9 | 0.0016481 | 641 | GTEx | DepMap | Descartes | 0.12 | 198.70 |
| DCN | 0.0013891 | 785 | GTEx | DepMap | Descartes | 0.11 | 62.79 |
| MYLK | 0.0013139 | 854 | GTEx | DepMap | Descartes | 0.05 | 29.71 |
| CNN2 | 0.0012835 | 875 | GTEx | DepMap | Descartes | 0.06 | 137.73 |
| LUM | 0.0012420 | 919 | GTEx | DepMap | Descartes | 0.12 | 191.85 |
| CNN3 | 0.0012062 | 953 | GTEx | DepMap | Descartes | 0.21 | 432.64 |
| COL13A1 | 0.0011573 | 992 | GTEx | DepMap | Descartes | 0.01 | 14.53 |
| COL1A1 | 0.0011264 | 1019 | GTEx | DepMap | Descartes | 0.90 | 662.84 |
| TNC | 0.0010420 | 1096 | GTEx | DepMap | Descartes | 0.18 | 60.36 |
| COL8A1 | 0.0010307 | 1107 | GTEx | DepMap | Descartes | 0.17 | 165.26 |
| TAGLN | 0.0009342 | 1216 | GTEx | DepMap | Descartes | 0.14 | 162.21 |
| IGFBP7 | 0.0009300 | 1222 | GTEx | DepMap | Descartes | 0.27 | 799.59 |
| THY1 | 0.0008955 | 1275 | GTEx | DepMap | Descartes | 0.12 | 141.55 |
| COL12A1 | 0.0008790 | 1301 | GTEx | DepMap | Descartes | 0.06 | 22.31 |
| THBS2 | 0.0006857 | 1697 | GTEx | DepMap | Descartes | 0.27 | 211.22 |
| MMP11 | 0.0005423 | 2112 | GTEx | DepMap | Descartes | 0.03 | 39.60 |
| COL14A1 | 0.0005129 | 2209 | GTEx | DepMap | Descartes | 0.12 | 63.82 |
| TGFB1 | 0.0004587 | 2442 | GTEx | DepMap | Descartes | 0.10 | 99.90 |
| IGFBP3 | 0.0004329 | 2565 | GTEx | DepMap | Descartes | 0.05 | 71.02 |
| ACTA2 | 0.0003921 | 2733 | GTEx | DepMap | Descartes | 0.09 | 289.91 |
| WNT5A | 0.0003087 | 3192 | GTEx | DepMap | Descartes | 0.01 | 4.11 |
| HOPX | 0.0002189 | 3822 | GTEx | DepMap | Descartes | 0.01 | 12.31 |
| ACTG2 | 0.0001640 | 4252 | GTEx | DepMap | Descartes | 0.00 | 0.00 |
| TGFBR1 | 0.0000399 | 5484 | GTEx | DepMap | Descartes | 0.06 | 38.50 |
| COL10A1 | -0.0000337 | 6517 | GTEx | DepMap | Descartes | 0.00 | 0.00 |
| ITGA7 | -0.0000692 | 7184 | GTEx | DepMap | Descartes | 0.02 | 10.50 |
| COL15A1 | -0.0001736 | 9010 | GTEx | DepMap | Descartes | 0.01 | 13.30 |
| TMEM119 | -0.0001816 | 9138 | GTEx | DepMap | Descartes | 0.01 | 10.55 |
| PGF | -0.0001970 | 9362 | GTEx | DepMap | Descartes | 0.01 | 6.74 |
| MYH11 | -0.0002218 | 9710 | GTEx | DepMap | Descartes | 0.01 | 3.29 |
| MEF2C | -0.0003029 | 10618 | GTEx | DepMap | Descartes | 0.02 | 15.20 |
| COL11A1 | -0.0004516 | 11645 | GTEx | DepMap | Descartes | 0.10 | 23.36 |
| POSTN | -0.0006491 | 12131 | GTEx | DepMap | Descartes | 0.16 | 141.78 |
| RGS5 | -0.0010384 | 12410 | GTEx | DepMap | Descartes | 0.07 | 21.91 |
Mesenchymal Fig 1D (Olsen)
Selected mesenchymal marker genes shown in Fig. 1D of Olsen et al. https://www.biorxiv.org/content/10.1101/2020.05.04.077057v1 - these are highly expressed in their mesenchymal cluster on their UMAP.:
Wilcoxon ranksum test P-value for gene set overrepresentation: 2.44e-08
Mean rank of genes in gene set: 796.38
Rank on gene expression program of genes in gene set:
| Genes | Weight | Rank | GTEx | DepMap | Decartes | Mean.Counts | Mean.TPM |
|---|---|---|---|---|---|---|---|
| BGN | 0.0034096 | 223 | GTEx | DepMap | Descartes | 0.31 | 671.94 |
| COL1A2 | 0.0028187 | 309 | GTEx | DepMap | Descartes | 1.78 | 1420.98 |
| SPARC | 0.0022476 | 416 | GTEx | DepMap | Descartes | 0.60 | 805.70 |
| COL3A1 | 0.0019599 | 503 | GTEx | DepMap | Descartes | 0.94 | 729.03 |
| CALD1 | 0.0016992 | 618 | GTEx | DepMap | Descartes | 1.04 | 829.41 |
| MGP | 0.0015521 | 692 | GTEx | DepMap | Descartes | 0.21 | 547.57 |
| DCN | 0.0013891 | 785 | GTEx | DepMap | Descartes | 0.11 | 62.79 |
| LEPR | 0.0013694 | 803 | GTEx | DepMap | Descartes | 0.09 | 43.28 |
| COL6A2 | 0.0013346 | 837 | GTEx | DepMap | Descartes | 0.36 | 425.35 |
| LUM | 0.0012420 | 919 | GTEx | DepMap | Descartes | 0.12 | 191.85 |
| COL1A1 | 0.0011264 | 1019 | GTEx | DepMap | Descartes | 0.90 | 662.84 |
| PRRX1 | 0.0010039 | 1134 | GTEx | DepMap | Descartes | 0.07 | 67.89 |
| PDGFRA | 0.0005471 | 2095 | GTEx | DepMap | Descartes | 0.03 | 12.91 |
Inflammatory CAF
These marker genes were curated across cancer subtypes in multiple organ systems as reviewed in Lavie et. al. (PMID 35883004) and contain inflammatory specific CAF genes:
Wilcoxon ranksum test P-value for gene set overrepresentation: 3.37e-07
Mean rank of genes in gene set: 2678.44
Rank on gene expression program of genes in gene set:
| Genes | Weight | Rank | GTEx | DepMap | Decartes | Mean.Counts | Mean.TPM |
|---|---|---|---|---|---|---|---|
| CXCL2 | 0.0161554 | 7 | GTEx | DepMap | Descartes | 0.42 | 1476.53 |
| C3 | 0.0144585 | 9 | GTEx | DepMap | Descartes | 2.28 | 1947.58 |
| LIF | 0.0079466 | 40 | GTEx | DepMap | Descartes | 0.19 | 225.14 |
| CCL2 | 0.0064337 | 58 | GTEx | DepMap | Descartes | 0.28 | 1153.43 |
| SERPING1 | 0.0059012 | 69 | GTEx | DepMap | Descartes | 0.39 | 687.85 |
| SOD2 | 0.0034501 | 217 | GTEx | DepMap | Descartes | 0.53 | 155.02 |
| CFB | 0.0033713 | 228 | GTEx | DepMap | Descartes | 0.11 | 209.93 |
| IL1R1 | 0.0029962 | 278 | GTEx | DepMap | Descartes | 0.23 | 184.56 |
| PDGFD | 0.0024281 | 374 | GTEx | DepMap | Descartes | 0.12 | 159.26 |
| C7 | 0.0016964 | 621 | GTEx | DepMap | Descartes | 0.12 | 99.80 |
| CXCL12 | 0.0013094 | 858 | GTEx | DepMap | Descartes | 0.08 | 127.46 |
| GPX3 | 0.0009484 | 1191 | GTEx | DepMap | Descartes | 0.08 | 156.77 |
| RGMA | 0.0009165 | 1243 | GTEx | DepMap | Descartes | 0.01 | 6.72 |
| PDGFRB | 0.0005663 | 2037 | GTEx | DepMap | Descartes | 0.07 | 59.83 |
| PDGFRA | 0.0005471 | 2095 | GTEx | DepMap | Descartes | 0.03 | 12.91 |
| IGF1 | 0.0004678 | 2390 | GTEx | DepMap | Descartes | 0.11 | 86.86 |
| IL33 | 0.0003286 | 3087 | GTEx | DepMap | Descartes | 0.03 | 40.42 |
| HGF | 0.0003154 | 3160 | GTEx | DepMap | Descartes | 0.02 | 14.04 |
| IGFBP6 | 0.0002349 | 3709 | GTEx | DepMap | Descartes | 0.04 | 136.08 |
| IL10 | -0.0000359 | 6571 | GTEx | DepMap | Descartes | 0.00 | 0.00 |
| SCARA3 | -0.0000404 | 6651 | GTEx | DepMap | Descartes | 0.00 | 0.00 |
| CXCL14 | -0.0000426 | 6684 | GTEx | DepMap | Descartes | 0.01 | 21.83 |
| SCARA5 | -0.0000465 | 6766 | GTEx | DepMap | Descartes | 0.00 | 0.00 |
| PDPN | -0.0001913 | 9286 | GTEx | DepMap | Descartes | 0.03 | 33.58 |
| CFD | -0.0001945 | 9332 | GTEx | DepMap | Descartes | 0.00 | 0.00 |
Below shows ranks on this GEP for literature curated gene lists for large gene sets
These include those reported as mesenchymal/adrenergic by Van Groningen et al.
High ranks indicate this gene is a driver of this GEP (note these results are not ordered).
The Mean Count column shows the mean read count in cells scoring highly (H > 50) on this gene expression program.
VanGroningen Adrenergic Genes
Adrenergic marker genes from Supplementary Table 2 of Van Groningen et al. Nature Genetics 2017. These genes were identified by differential expression analysis of mesenchymal-like and adrenergic-like neuroblastoma cell lines.
Wilcoxon ranksum test P-value for gene set overrepresentation: 1.00e+00
Mean rank of genes in gene set: 10032.11
Median rank of genes in gene set: 11333
Rank on gene expression program of top 30 genes in gene set:
| Genes | Weight | Rank | GTEx | DepMap | Descartes | Mean.Counts | Mean.TPM |
|---|---|---|---|---|---|---|---|
| GRB10 | 0.0032227 | 248 | GTEx | DepMap | Descartes | 0.21 | 177.96 |
| GLDC | 0.0028187 | 308 | GTEx | DepMap | Descartes | 0.07 | 62.17 |
| ABLIM1 | 0.0024378 | 371 | GTEx | DepMap | Descartes | 0.39 | 172.98 |
| MYRIP | 0.0011246 | 1020 | GTEx | DepMap | Descartes | 0.19 | 117.65 |
| DAPK1 | 0.0010420 | 1097 | GTEx | DepMap | Descartes | 0.14 | 84.96 |
| EML4 | 0.0010129 | 1122 | GTEx | DepMap | Descartes | 0.42 | 282.46 |
| PRSS12 | 0.0009461 | 1197 | GTEx | DepMap | Descartes | 0.20 | 117.13 |
| PTS | 0.0007098 | 1642 | GTEx | DepMap | Descartes | 0.12 | 445.13 |
| FAM107B | 0.0006136 | 1893 | GTEx | DepMap | Descartes | 0.20 | 217.85 |
| LYN | 0.0005270 | 2169 | GTEx | DepMap | Descartes | 0.06 | 29.69 |
| TUBB4B | 0.0005207 | 2185 | GTEx | DepMap | Descartes | 0.09 | 188.43 |
| PARP6 | 0.0005157 | 2199 | GTEx | DepMap | Descartes | 0.10 | 102.64 |
| DUSP4 | 0.0004978 | 2273 | GTEx | DepMap | Descartes | 0.03 | 24.40 |
| NFIL3 | 0.0004677 | 2391 | GTEx | DepMap | Descartes | 0.05 | 96.98 |
| TDG | 0.0004647 | 2411 | GTEx | DepMap | Descartes | 0.08 | 85.07 |
| NCS1 | 0.0004308 | 2569 | GTEx | DepMap | Descartes | 0.08 | 49.17 |
| AKAP12 | 0.0004301 | 2574 | GTEx | DepMap | Descartes | 0.40 | 150.12 |
| FAM169A | 0.0004115 | 2648 | GTEx | DepMap | Descartes | 0.03 | 16.96 |
| NCOA7 | 0.0003864 | 2759 | GTEx | DepMap | Descartes | 0.31 | NA |
| CAMSAP1 | 0.0003793 | 2811 | GTEx | DepMap | Descartes | 0.13 | 61.79 |
| SYT4 | 0.0003670 | 2884 | GTEx | DepMap | Descartes | 0.07 | 101.98 |
| MAPK8 | 0.0003205 | 3125 | GTEx | DepMap | Descartes | 0.26 | 119.65 |
| IGSF3 | 0.0003168 | 3149 | GTEx | DepMap | Descartes | 0.05 | 28.10 |
| SNAP25 | 0.0002842 | 3355 | GTEx | DepMap | Descartes | 0.19 | 336.53 |
| MMD | 0.0002825 | 3372 | GTEx | DepMap | Descartes | 0.09 | 92.50 |
| NEFL | 0.0002809 | 3383 | GTEx | DepMap | Descartes | 0.07 | 51.81 |
| EIF1B | 0.0002624 | 3518 | GTEx | DepMap | Descartes | 0.05 | 220.99 |
| NAPB | 0.0002408 | 3666 | GTEx | DepMap | Descartes | 0.05 | 75.75 |
| RUFY3 | 0.0001659 | 4239 | GTEx | DepMap | Descartes | 0.24 | 197.76 |
| PHPT1 | 0.0001626 | 4261 | GTEx | DepMap | Descartes | 0.10 | 321.26 |
VanGroningen Mesenchymal Genes
Mesenchymal marker genes from Supplementary Table 2 of Van Groningen et al. Nature Genetics 2017. These genes were identified by differential expression analysis of mesenchymal-like and adrenergic-like neuroblastoma cell lines.
Wilcoxon ranksum test P-value for gene set overrepresentation: 6.97e-43
Mean rank of genes in gene set: 3940.9
Median rank of genes in gene set: 2876
Rank on gene expression program of top 30 genes in gene set:
| Genes | Weight | Rank | GTEx | DepMap | Descartes | Mean.Counts | Mean.TPM |
|---|---|---|---|---|---|---|---|
| COL27A1 | 0.0102972 | 24 | GTEx | DepMap | Descartes | 0.33 | 175.13 |
| PDGFC | 0.0063208 | 62 | GTEx | DepMap | Descartes | 0.19 | 186.54 |
| EGFR | 0.0060274 | 68 | GTEx | DepMap | Descartes | 0.24 | 87.89 |
| GDF15 | 0.0058818 | 70 | GTEx | DepMap | Descartes | 0.25 | 1060.48 |
| CFH | 0.0058378 | 71 | GTEx | DepMap | Descartes | 0.46 | 303.94 |
| FNDC3B | 0.0056456 | 76 | GTEx | DepMap | Descartes | 0.78 | 374.15 |
| SEL1L3 | 0.0054724 | 82 | GTEx | DepMap | Descartes | 0.18 | 185.52 |
| SDC4 | 0.0054624 | 83 | GTEx | DepMap | Descartes | 0.21 | 331.97 |
| TNFRSF12A | 0.0052849 | 86 | GTEx | DepMap | Descartes | 0.27 | 693.56 |
| PDLIM1 | 0.0051945 | 91 | GTEx | DepMap | Descartes | 0.18 | 627.03 |
| SMAD3 | 0.0050826 | 99 | GTEx | DepMap | Descartes | 0.22 | 131.84 |
| PHLDB2 | 0.0049211 | 104 | GTEx | DepMap | Descartes | 0.19 | 142.42 |
| EXT1 | 0.0048677 | 110 | GTEx | DepMap | Descartes | 1.49 | 646.78 |
| YAP1 | 0.0047758 | 120 | GTEx | DepMap | Descartes | 0.22 | 169.81 |
| KLF6 | 0.0046303 | 129 | GTEx | DepMap | Descartes | 0.60 | 567.84 |
| CFI | 0.0046250 | 131 | GTEx | DepMap | Descartes | 0.08 | 151.13 |
| MGST1 | 0.0045280 | 141 | GTEx | DepMap | Descartes | 0.21 | 375.85 |
| PLOD2 | 0.0044270 | 143 | GTEx | DepMap | Descartes | 0.44 | 412.63 |
| ANXA2 | 0.0043579 | 148 | GTEx | DepMap | Descartes | 0.44 | 526.43 |
| PROM1 | 0.0043054 | 151 | GTEx | DepMap | Descartes | 0.05 | 24.89 |
| EPS8 | 0.0043027 | 153 | GTEx | DepMap | Descartes | 0.27 | 246.00 |
| SHROOM3 | 0.0042180 | 158 | GTEx | DepMap | Descartes | 0.14 | 43.57 |
| ITGAV | 0.0041119 | 162 | GTEx | DepMap | Descartes | 0.59 | 354.07 |
| HES1 | 0.0040673 | 164 | GTEx | DepMap | Descartes | 0.19 | 512.70 |
| MAML2 | 0.0040450 | 167 | GTEx | DepMap | Descartes | 0.48 | 283.58 |
| ACADVL | 0.0040055 | 171 | GTEx | DepMap | Descartes | 0.58 | 995.67 |
| NFIA | 0.0038866 | 180 | GTEx | DepMap | Descartes | 0.36 | 33.70 |
| ZFP36L1 | 0.0037899 | 187 | GTEx | DepMap | Descartes | 0.52 | 726.09 |
| SYNJ2 | 0.0037698 | 189 | GTEx | DepMap | Descartes | 0.24 | 124.37 |
| LPP | 0.0036715 | 194 | GTEx | DepMap | Descartes | 0.87 | 168.56 |
Descartes adrenocortical markers
Top 50 marker genes of adrenocortical cells in the Decartes fetal adrenal single cell map (https://atlas.brotmanbaty.org/bbi/human-gene-expression-during-development/cell/adrenocortical/in/adrenal)
Wilcoxon ranksum test P-value for gene set overrepresentation: 9.02e-01
Mean rank of genes in gene set: 7053.44
Median rank of genes in gene set: 7687.5
Rank on gene expression program of top 30 genes in gene set:
| Genes | Weight | Rank | GTEx | DepMap | Descartes | Mean.Counts | Mean.TPM |
|---|---|---|---|---|---|---|---|
| BAIAP2L1 | 0.0080607 | 39 | GTEx | DepMap | Descartes | 0.26 | 276.16 |
| LDLR | 0.0051980 | 90 | GTEx | DepMap | Descartes | 0.32 | 243.30 |
| APOC1 | 0.0010833 | 1058 | GTEx | DepMap | Descartes | 0.51 | 3237.30 |
| ERN1 | 0.0009299 | 1223 | GTEx | DepMap | Descartes | 0.05 | 27.49 |
| FREM2 | 0.0007980 | 1461 | GTEx | DepMap | Descartes | 0.01 | 2.38 |
| DHCR24 | 0.0006475 | 1794 | GTEx | DepMap | Descartes | 0.12 | 116.03 |
| SCAP | 0.0004455 | 2497 | GTEx | DepMap | Descartes | 0.08 | 73.73 |
| PAPSS2 | 0.0004347 | 2552 | GTEx | DepMap | Descartes | 0.09 | 65.66 |
| SH3PXD2B | 0.0004167 | 2629 | GTEx | DepMap | Descartes | 0.10 | 52.71 |
| NPC1 | 0.0003787 | 2816 | GTEx | DepMap | Descartes | 0.08 | 72.66 |
| DHCR7 | 0.0002659 | 3490 | GTEx | DepMap | Descartes | 0.04 | 50.24 |
| CLU | 0.0001366 | 4501 | GTEx | DepMap | Descartes | 0.22 | 306.08 |
| FDPS | 0.0001176 | 4663 | GTEx | DepMap | Descartes | 0.15 | 210.86 |
| HMGCS1 | 0.0000887 | 4927 | GTEx | DepMap | Descartes | 0.07 | 60.24 |
| SCARB1 | 0.0000133 | 5821 | GTEx | DepMap | Descartes | 0.03 | 9.86 |
| STAR | -0.0000051 | 6072 | GTEx | DepMap | Descartes | 0.00 | 0.00 |
| SH3BP5 | -0.0000066 | 6097 | GTEx | DepMap | Descartes | 0.03 | 23.83 |
| TM7SF2 | -0.0000657 | 7130 | GTEx | DepMap | Descartes | 0.03 | 45.61 |
| MSMO1 | -0.0001258 | 8245 | GTEx | DepMap | Descartes | 0.05 | 121.38 |
| FDXR | -0.0001272 | 8267 | GTEx | DepMap | Descartes | 0.00 | 0.00 |
| HMGCR | -0.0001318 | 8338 | GTEx | DepMap | Descartes | 0.05 | 28.70 |
| FDX1 | -0.0001828 | 9154 | GTEx | DepMap | Descartes | 0.02 | 14.54 |
| GRAMD1B | -0.0002011 | 9429 | GTEx | DepMap | Descartes | 0.03 | 10.06 |
| INHA | -0.0002808 | 10405 | GTEx | DepMap | Descartes | 0.01 | 3.03 |
| DNER | -0.0003235 | 10802 | GTEx | DepMap | Descartes | 0.04 | 18.40 |
| CYB5B | -0.0003636 | 11094 | GTEx | DepMap | Descartes | 0.02 | 13.85 |
| POR | -0.0003680 | 11137 | GTEx | DepMap | Descartes | 0.04 | 64.87 |
| SGCZ | -0.0004066 | 11398 | GTEx | DepMap | Descartes | 0.18 | 40.51 |
| SLC16A9 | -0.0004301 | 11538 | GTEx | DepMap | Descartes | 0.01 | 2.28 |
| GSTA4 | -0.0004538 | 11661 | GTEx | DepMap | Descartes | 0.02 | 17.03 |
Descartes chromaffin markers
Top 50 marker genes of chromaffin cells in the Decartes fetal adrenal single cell map (https://atlas.brotmanbaty.org/bbi/human-gene-expression-during-development/cell/chromaffin/in/adrenal)
Wilcoxon ranksum test P-value for gene set overrepresentation: 1.00e+00
Mean rank of genes in gene set: 11330.54
Median rank of genes in gene set: 12267
Rank on gene expression program of top 30 genes in gene set:
| Genes | Weight | Rank | GTEx | DepMap | Descartes | Mean.Counts | Mean.TPM |
|---|---|---|---|---|---|---|---|
| GREM1 | 0.0008604 | 1335 | GTEx | DepMap | Descartes | 0.09 | 26.15 |
| RPH3A | 0.0000856 | 4957 | GTEx | DepMap | Descartes | 0.01 | 0.83 |
| MAB21L1 | -0.0000433 | 6700 | GTEx | DepMap | Descartes | 0.02 | 40.83 |
| FAT3 | -0.0000450 | 6738 | GTEx | DepMap | Descartes | 0.06 | 10.83 |
| TUBB2A | -0.0001944 | 9331 | GTEx | DepMap | Descartes | 0.22 | 410.17 |
| GAP43 | -0.0003030 | 10623 | GTEx | DepMap | Descartes | 0.19 | 268.05 |
| GAL | -0.0003668 | 11126 | GTEx | DepMap | Descartes | 0.11 | 791.73 |
| REEP1 | -0.0003799 | 11232 | GTEx | DepMap | Descartes | 0.05 | 37.37 |
| EPHA6 | -0.0004038 | 11385 | GTEx | DepMap | Descartes | 0.20 | 121.62 |
| PTCHD1 | -0.0004229 | 11493 | GTEx | DepMap | Descartes | 0.05 | 3.96 |
| CNTFR | -0.0004365 | 11568 | GTEx | DepMap | Descartes | 0.02 | 27.44 |
| MAB21L2 | -0.0004425 | 11601 | GTEx | DepMap | Descartes | 0.01 | 5.62 |
| SYNPO2 | -0.0004584 | 11680 | GTEx | DepMap | Descartes | 0.10 | 26.13 |
| NTRK1 | -0.0004667 | 11713 | GTEx | DepMap | Descartes | 0.06 | 41.54 |
| RGMB | -0.0005151 | 11870 | GTEx | DepMap | Descartes | 0.04 | 33.02 |
| TMEFF2 | -0.0005297 | 11913 | GTEx | DepMap | Descartes | 0.02 | 6.52 |
| SLC44A5 | -0.0005392 | 11931 | GTEx | DepMap | Descartes | 0.10 | 59.29 |
| SLC6A2 | -0.0005718 | 12004 | GTEx | DepMap | Descartes | 0.02 | 16.66 |
| PLXNA4 | -0.0006188 | 12073 | GTEx | DepMap | Descartes | 0.04 | 6.94 |
| MLLT11 | -0.0006639 | 12158 | GTEx | DepMap | Descartes | 0.08 | 145.02 |
| ANKFN1 | -0.0007697 | 12267 | GTEx | DepMap | Descartes | 0.01 | 7.34 |
| BASP1 | -0.0008192 | 12311 | GTEx | DepMap | Descartes | 0.17 | 406.04 |
| CNKSR2 | -0.0008287 | 12327 | GTEx | DepMap | Descartes | 0.06 | 14.39 |
| HS3ST5 | -0.0008600 | 12344 | GTEx | DepMap | Descartes | 0.07 | 34.88 |
| MARCH11 | -0.0009117 | 12366 | GTEx | DepMap | Descartes | 0.09 | NA |
| CCND1 | -0.0009328 | 12372 | GTEx | DepMap | Descartes | 0.10 | 105.99 |
| MAP1B | -0.0009467 | 12377 | GTEx | DepMap | Descartes | 0.44 | 103.24 |
| ISL1 | -0.0010445 | 12413 | GTEx | DepMap | Descartes | 0.03 | 27.19 |
| ELAVL2 | -0.0010608 | 12416 | GTEx | DepMap | Descartes | 0.09 | 34.72 |
| EYA1 | -0.0011218 | 12445 | GTEx | DepMap | Descartes | 0.02 | 8.48 |
Descartes Vascular_endothelial markers
Top 50 marker genes of Vascular_endothelial cells in the Decartes fetal adrenal single cell map (https://atlas.brotmanbaty.org/bbi/human-gene-expression-during-development/cell/vascular_endothelial/in/adrenal)
Wilcoxon ranksum test P-value for gene set overrepresentation: 3.99e-01
Mean rank of genes in gene set: 6124.29
Median rank of genes in gene set: 5803
Rank on gene expression program of top 30 genes in gene set:
| Genes | Weight | Rank | GTEx | DepMap | Descartes | Mean.Counts | Mean.TPM |
|---|---|---|---|---|---|---|---|
| NR5A2 | 0.0088952 | 34 | GTEx | DepMap | Descartes | 0.35 | 235.02 |
| ARHGAP29 | 0.0040209 | 169 | GTEx | DepMap | Descartes | 0.20 | 100.61 |
| NPR1 | 0.0012182 | 942 | GTEx | DepMap | Descartes | 0.01 | 11.34 |
| MYRIP | 0.0011246 | 1020 | GTEx | DepMap | Descartes | 0.19 | 117.65 |
| CDH5 | 0.0009500 | 1190 | GTEx | DepMap | Descartes | 0.02 | 15.14 |
| FLT4 | 0.0008777 | 1303 | GTEx | DepMap | Descartes | 0.00 | 0.00 |
| CALCRL | 0.0008649 | 1327 | GTEx | DepMap | Descartes | 0.02 | 21.72 |
| CEACAM1 | 0.0006934 | 1684 | GTEx | DepMap | Descartes | 0.05 | 67.16 |
| SHE | 0.0004974 | 2274 | GTEx | DepMap | Descartes | 0.01 | 1.76 |
| KANK3 | 0.0004971 | 2276 | GTEx | DepMap | Descartes | 0.01 | 13.10 |
| ID1 | 0.0004226 | 2607 | GTEx | DepMap | Descartes | 0.14 | 526.28 |
| CYP26B1 | 0.0002660 | 3489 | GTEx | DepMap | Descartes | 0.01 | 2.95 |
| IRX3 | 0.0002453 | 3628 | GTEx | DepMap | Descartes | 0.01 | 20.79 |
| ROBO4 | 0.0002271 | 3769 | GTEx | DepMap | Descartes | 0.01 | 16.02 |
| EHD3 | 0.0002263 | 3779 | GTEx | DepMap | Descartes | 0.01 | 16.99 |
| TMEM88 | 0.0001343 | 4525 | GTEx | DepMap | Descartes | 0.03 | 209.41 |
| TIE1 | 0.0000795 | 5018 | GTEx | DepMap | Descartes | 0.01 | 9.03 |
| GALNT15 | 0.0000325 | 5580 | GTEx | DepMap | Descartes | 0.01 | NA |
| KDR | 0.0000276 | 5643 | GTEx | DepMap | Descartes | 0.01 | 1.12 |
| SLCO2A1 | 0.0000029 | 5963 | GTEx | DepMap | Descartes | 0.01 | 5.61 |
| SHANK3 | -0.0000092 | 6135 | GTEx | DepMap | Descartes | 0.03 | 18.83 |
| F8 | -0.0000269 | 6392 | GTEx | DepMap | Descartes | 0.00 | 0.00 |
| CRHBP | -0.0000811 | 7418 | GTEx | DepMap | Descartes | 0.00 | 0.00 |
| PLVAP | -0.0001560 | 8778 | GTEx | DepMap | Descartes | 0.00 | 0.00 |
| RASIP1 | -0.0001615 | 8849 | GTEx | DepMap | Descartes | 0.00 | 0.00 |
| MMRN2 | -0.0001756 | 9039 | GTEx | DepMap | Descartes | 0.01 | 1.47 |
| NOTCH4 | -0.0001799 | 9109 | GTEx | DepMap | Descartes | 0.00 | 0.00 |
| HYAL2 | -0.0001910 | 9284 | GTEx | DepMap | Descartes | 0.02 | 28.62 |
| TEK | -0.0002140 | 9606 | GTEx | DepMap | Descartes | 0.01 | 5.38 |
| BTNL9 | -0.0002790 | 10387 | GTEx | DepMap | Descartes | 0.00 | 0.00 |
Descartes stromal markers
Top 50 marker genes of stromal cells in the Decartes fetal adrenal single cell map (https://atlas.brotmanbaty.org/bbi/human-gene-expression-during-development/cell/stromal/in/adrenal)
Wilcoxon ranksum test P-value for gene set overrepresentation: 5.82e-05
Mean rank of genes in gene set: 4174.11
Median rank of genes in gene set: 2635
Rank on gene expression program of top 30 genes in gene set:
| Genes | Weight | Rank | GTEx | DepMap | Descartes | Mean.Counts | Mean.TPM |
|---|---|---|---|---|---|---|---|
| BICC1 | 0.0369479 | 1 | GTEx | DepMap | Descartes | 4.36 | 3517.55 |
| COL27A1 | 0.0102972 | 24 | GTEx | DepMap | Descartes | 0.33 | 175.13 |
| COL1A2 | 0.0028187 | 309 | GTEx | DepMap | Descartes | 1.78 | 1420.98 |
| COL3A1 | 0.0019599 | 503 | GTEx | DepMap | Descartes | 0.94 | 729.03 |
| LOX | 0.0017168 | 611 | GTEx | DepMap | Descartes | 0.03 | 28.43 |
| C7 | 0.0016964 | 621 | GTEx | DepMap | Descartes | 0.12 | 99.80 |
| MGP | 0.0015521 | 692 | GTEx | DepMap | Descartes | 0.21 | 547.57 |
| ADAMTSL3 | 0.0014046 | 776 | GTEx | DepMap | Descartes | 0.07 | 43.87 |
| DCN | 0.0013891 | 785 | GTEx | DepMap | Descartes | 0.11 | 62.79 |
| LUM | 0.0012420 | 919 | GTEx | DepMap | Descartes | 0.12 | 191.85 |
| COL1A1 | 0.0011264 | 1019 | GTEx | DepMap | Descartes | 0.90 | 662.84 |
| ELN | 0.0011105 | 1034 | GTEx | DepMap | Descartes | 0.12 | 145.94 |
| ITGA11 | 0.0011079 | 1036 | GTEx | DepMap | Descartes | 0.07 | 21.86 |
| PRRX1 | 0.0010039 | 1134 | GTEx | DepMap | Descartes | 0.07 | 67.89 |
| COL12A1 | 0.0008790 | 1301 | GTEx | DepMap | Descartes | 0.06 | 22.31 |
| SFRP2 | 0.0005594 | 2065 | GTEx | DepMap | Descartes | 0.07 | 124.57 |
| PDGFRA | 0.0005471 | 2095 | GTEx | DepMap | Descartes | 0.03 | 12.91 |
| ABCA6 | 0.0005142 | 2204 | GTEx | DepMap | Descartes | 0.05 | 15.60 |
| ABCC9 | 0.0005060 | 2234 | GTEx | DepMap | Descartes | 0.02 | 6.60 |
| ADAMTS2 | 0.0004761 | 2349 | GTEx | DepMap | Descartes | 0.10 | 58.78 |
| CDH11 | 0.0004538 | 2457 | GTEx | DepMap | Descartes | 0.18 | 95.64 |
| IGFBP3 | 0.0004329 | 2565 | GTEx | DepMap | Descartes | 0.05 | 71.02 |
| PRICKLE1 | 0.0003979 | 2705 | GTEx | DepMap | Descartes | 0.15 | 110.76 |
| ACTA2 | 0.0003921 | 2733 | GTEx | DepMap | Descartes | 0.09 | 289.91 |
| COL6A3 | 0.0003679 | 2876 | GTEx | DepMap | Descartes | 0.18 | 78.17 |
| ISLR | 0.0003180 | 3142 | GTEx | DepMap | Descartes | 0.04 | 81.05 |
| EDNRA | 0.0002659 | 3491 | GTEx | DepMap | Descartes | 0.05 | 24.49 |
| PCDH18 | 0.0001198 | 4642 | GTEx | DepMap | Descartes | 0.02 | 15.10 |
| LAMC3 | 0.0000821 | 4987 | GTEx | DepMap | Descartes | 0.01 | 4.43 |
| GLI2 | 0.0000610 | 5220 | GTEx | DepMap | Descartes | 0.05 | 29.91 |
Descartes sympathoblasts markers
Top 50 marker genes of sympathoblasts cells in the Decartes fetal adrenal single cell map (https://atlas.brotmanbaty.org/bbi/human-gene-expression-during-development/cell/sympathoblasts/in/adrenal)
Wilcoxon ranksum test P-value for gene set overrepresentation: 1.00e+00
Mean rank of genes in gene set: 10268.97
Median rank of genes in gene set: 11978
Rank on gene expression program of top 30 genes in gene set:
| Genes | Weight | Rank | GTEx | DepMap | Descartes | Mean.Counts | Mean.TPM |
|---|---|---|---|---|---|---|---|
| SLC35F3 | 0.0043981 | 144 | GTEx | DepMap | Descartes | 0.30 | 352.21 |
| LAMA3 | 0.0017848 | 575 | GTEx | DepMap | Descartes | 0.08 | 36.42 |
| PENK | 0.0004908 | 2301 | GTEx | DepMap | Descartes | 0.08 | 292.74 |
| CNTN3 | 0.0003836 | 2779 | GTEx | DepMap | Descartes | 0.02 | 23.94 |
| SORCS3 | 0.0003564 | 2946 | GTEx | DepMap | Descartes | 0.03 | 21.94 |
| DGKK | 0.0001228 | 4620 | GTEx | DepMap | Descartes | 0.01 | 0.43 |
| SLC24A2 | -0.0000455 | 6744 | GTEx | DepMap | Descartes | 0.00 | 0.00 |
| HTATSF1 | -0.0001642 | 8884 | GTEx | DepMap | Descartes | 0.04 | 66.58 |
| CDH12 | -0.0003477 | 10991 | GTEx | DepMap | Descartes | 0.07 | 34.03 |
| GRM7 | -0.0003668 | 11127 | GTEx | DepMap | Descartes | 0.11 | 51.31 |
| PACRG | -0.0004261 | 11510 | GTEx | DepMap | Descartes | 0.05 | 119.56 |
| ARC | -0.0004277 | 11522 | GTEx | DepMap | Descartes | 0.01 | 4.85 |
| TBX20 | -0.0004428 | 11605 | GTEx | DepMap | Descartes | 0.01 | 3.51 |
| ST18 | -0.0004549 | 11671 | GTEx | DepMap | Descartes | 0.01 | 0.86 |
| SPOCK3 | -0.0004588 | 11684 | GTEx | DepMap | Descartes | 0.08 | 54.16 |
| MGAT4C | -0.0004833 | 11772 | GTEx | DepMap | Descartes | 0.08 | 9.66 |
| C1QL1 | -0.0004950 | 11813 | GTEx | DepMap | Descartes | 0.01 | 8.81 |
| CDH18 | -0.0005284 | 11908 | GTEx | DepMap | Descartes | 0.06 | 28.70 |
| NTNG1 | -0.0005567 | 11972 | GTEx | DepMap | Descartes | 0.03 | 7.01 |
| EML6 | -0.0005617 | 11984 | GTEx | DepMap | Descartes | 0.19 | 33.24 |
| GRID2 | -0.0005630 | 11988 | GTEx | DepMap | Descartes | 0.05 | 13.19 |
| PCSK2 | -0.0005657 | 11994 | GTEx | DepMap | Descartes | 0.01 | 10.20 |
| KSR2 | -0.0006369 | 12111 | GTEx | DepMap | Descartes | 0.01 | 1.98 |
| GCH1 | -0.0006556 | 12148 | GTEx | DepMap | Descartes | 0.02 | 13.05 |
| TENM1 | -0.0007052 | 12208 | GTEx | DepMap | Descartes | 0.11 | NA |
| SLC18A1 | -0.0007071 | 12211 | GTEx | DepMap | Descartes | 0.00 | 0.00 |
| TIAM1 | -0.0007553 | 12256 | GTEx | DepMap | Descartes | 0.08 | 40.66 |
| ROBO1 | -0.0007608 | 12261 | GTEx | DepMap | Descartes | 0.24 | 107.06 |
| GALNTL6 | -0.0008141 | 12306 | GTEx | DepMap | Descartes | 0.05 | 26.15 |
| KCTD16 | -0.0010363 | 12409 | GTEx | DepMap | Descartes | 0.09 | 17.15 |
Descartes erythroblasts markers
Top 50 marker genes of erythroblasts cells in the Decartes fetal adrenal single cell map (https://atlas.brotmanbaty.org/bbi/human-gene-expression-during-development/cell/erythroblasts/in/adrenal)
Wilcoxon ranksum test P-value for gene set overrepresentation: 1.78e-01
Mean rank of genes in gene set: 5655.69
Median rank of genes in gene set: 5431
Rank on gene expression program of top 30 genes in gene set:
| Genes | Weight | Rank | GTEx | DepMap | Descartes | Mean.Counts | Mean.TPM |
|---|---|---|---|---|---|---|---|
| BLVRB | 0.0022470 | 417 | GTEx | DepMap | Descartes | 0.05 | 125.06 |
| SLC25A21 | 0.0017973 | 570 | GTEx | DepMap | Descartes | 0.01 | 7.10 |
| DENND4A | 0.0017600 | 589 | GTEx | DepMap | Descartes | 0.43 | 198.74 |
| MARCH3 | 0.0015686 | 681 | GTEx | DepMap | Descartes | 0.11 | NA |
| GCLC | 0.0007735 | 1508 | GTEx | DepMap | Descartes | 0.14 | 168.28 |
| SLC25A37 | 0.0007533 | 1547 | GTEx | DepMap | Descartes | 0.11 | 91.53 |
| GYPC | 0.0007515 | 1550 | GTEx | DepMap | Descartes | 0.01 | 21.46 |
| SOX6 | 0.0006144 | 1891 | GTEx | DepMap | Descartes | 0.16 | 71.31 |
| MICAL2 | 0.0005911 | 1956 | GTEx | DepMap | Descartes | 0.14 | 64.63 |
| EPB41 | 0.0001767 | 4144 | GTEx | DepMap | Descartes | 0.14 | 94.51 |
| SPECC1 | 0.0001524 | 4351 | GTEx | DepMap | Descartes | 0.02 | 4.88 |
| TRAK2 | 0.0001448 | 4422 | GTEx | DepMap | Descartes | 0.06 | 37.24 |
| FECH | 0.0000844 | 4969 | GTEx | DepMap | Descartes | 0.02 | 9.33 |
| ABCB10 | 0.0000550 | 5307 | GTEx | DepMap | Descartes | 0.05 | 48.98 |
| TMCC2 | 0.0000440 | 5431 | GTEx | DepMap | Descartes | 0.00 | 0.00 |
| RGS6 | -0.0000088 | 6130 | GTEx | DepMap | Descartes | 0.01 | 5.77 |
| SLC4A1 | -0.0000291 | 6439 | GTEx | DepMap | Descartes | 0.00 | 0.00 |
| ALAS2 | -0.0000382 | 6609 | GTEx | DepMap | Descartes | 0.00 | 0.00 |
| TFR2 | -0.0001123 | 8005 | GTEx | DepMap | Descartes | 0.09 | 104.04 |
| CAT | -0.0001193 | 8132 | GTEx | DepMap | Descartes | 0.02 | 42.63 |
| RHD | -0.0001327 | 8356 | GTEx | DepMap | Descartes | 0.00 | 0.00 |
| XPO7 | -0.0001513 | 8689 | GTEx | DepMap | Descartes | 0.03 | 24.18 |
| CPOX | -0.0001751 | 9032 | GTEx | DepMap | Descartes | 0.01 | 1.51 |
| RAPGEF2 | -0.0001889 | 9256 | GTEx | DepMap | Descartes | 0.16 | 77.50 |
| SPTB | -0.0002088 | 9538 | GTEx | DepMap | Descartes | 0.02 | 3.96 |
| ANK1 | -0.0002543 | 10101 | GTEx | DepMap | Descartes | 0.01 | 6.41 |
| SNCA | -0.0002649 | 10236 | GTEx | DepMap | Descartes | 0.05 | 44.89 |
| SELENBP1 | -0.0004985 | 11820 | GTEx | DepMap | Descartes | 0.03 | 33.85 |
| TSPAN5 | -0.0008536 | 12339 | GTEx | DepMap | Descartes | 0.10 | 72.32 |
| NA | NA | NA | NA | NA | NA | NA | NA |
Descartes myeloid markers
Top 50 marker genes of myeloid cells in the Decartes fetal adrenal single cell map (https://atlas.brotmanbaty.org/bbi/human-gene-expression-during-development/cell/myeloid/in/adrenal)
Wilcoxon ranksum test P-value for gene set overrepresentation: 3.18e-02
Mean rank of genes in gene set: 5186.82
Median rank of genes in gene set: 4097
Rank on gene expression program of top 30 genes in gene set:
| Genes | Weight | Rank | GTEx | DepMap | Descartes | Mean.Counts | Mean.TPM |
|---|---|---|---|---|---|---|---|
| PTPRE | 0.0023869 | 381 | GTEx | DepMap | Descartes | 0.19 | 125.01 |
| WWP1 | 0.0017921 | 572 | GTEx | DepMap | Descartes | 0.20 | 182.37 |
| CTSB | 0.0014870 | 730 | GTEx | DepMap | Descartes | 0.35 | 475.39 |
| TGFBI | 0.0013807 | 794 | GTEx | DepMap | Descartes | 0.11 | 113.52 |
| CTSD | 0.0010118 | 1123 | GTEx | DepMap | Descartes | 0.40 | 819.41 |
| ITPR2 | 0.0008284 | 1411 | GTEx | DepMap | Descartes | 0.18 | 54.44 |
| SLCO2B1 | 0.0007393 | 1575 | GTEx | DepMap | Descartes | 0.05 | 34.94 |
| MSR1 | 0.0007206 | 1608 | GTEx | DepMap | Descartes | 0.04 | 77.07 |
| SPP1 | 0.0006796 | 1710 | GTEx | DepMap | Descartes | 0.59 | 1437.10 |
| AXL | 0.0005139 | 2205 | GTEx | DepMap | Descartes | 0.05 | 45.07 |
| CTSS | 0.0004352 | 2549 | GTEx | DepMap | Descartes | 0.03 | 46.74 |
| HRH1 | 0.0003820 | 2795 | GTEx | DepMap | Descartes | 0.09 | 48.44 |
| CPVL | 0.0003620 | 2908 | GTEx | DepMap | Descartes | 0.01 | 7.49 |
| ABCA1 | 0.0003273 | 3092 | GTEx | DepMap | Descartes | 0.12 | 41.07 |
| CST3 | 0.0002994 | 3257 | GTEx | DepMap | Descartes | 0.08 | 99.83 |
| HCK | 0.0002966 | 3275 | GTEx | DepMap | Descartes | 0.01 | 21.43 |
| LGMN | 0.0002716 | 3459 | GTEx | DepMap | Descartes | 0.09 | 202.54 |
| MERTK | 0.0002189 | 3820 | GTEx | DepMap | Descartes | 0.01 | 4.70 |
| CD163 | 0.0001857 | 4060 | GTEx | DepMap | Descartes | 0.01 | 3.73 |
| CTSC | 0.0001778 | 4134 | GTEx | DepMap | Descartes | 0.03 | 23.75 |
| IFNGR1 | 0.0001636 | 4255 | GTEx | DepMap | Descartes | 0.06 | 92.32 |
| RGL1 | 0.0001129 | 4710 | GTEx | DepMap | Descartes | 0.07 | 70.47 |
| CD74 | 0.0001032 | 4796 | GTEx | DepMap | Descartes | 0.09 | 133.50 |
| CD14 | 0.0000885 | 4930 | GTEx | DepMap | Descartes | 0.04 | 141.44 |
| ATP8B4 | 0.0000544 | 5314 | GTEx | DepMap | Descartes | 0.02 | 13.69 |
| MS4A4A | 0.0000169 | 5767 | GTEx | DepMap | Descartes | 0.01 | 16.66 |
| SLC9A9 | -0.0000388 | 6618 | GTEx | DepMap | Descartes | 0.10 | 85.47 |
| CSF1R | -0.0000805 | 7400 | GTEx | DepMap | Descartes | 0.02 | 19.50 |
| FGL2 | -0.0002091 | 9544 | GTEx | DepMap | Descartes | 0.00 | 0.00 |
| CYBB | -0.0002125 | 9593 | GTEx | DepMap | Descartes | 0.00 | 0.00 |
Descartes Schwann markers
Top 50 marker genes of Schwann cells in the Decartes fetal adrenal single cell map (https://atlas.brotmanbaty.org/bbi/human-gene-expression-during-development/cell/schwann/in/adrenal)
Wilcoxon ranksum test P-value for gene set overrepresentation: 8.15e-01
Mean rank of genes in gene set: 6763
Median rank of genes in gene set: 6354.5
Rank on gene expression program of top 30 genes in gene set:
| Genes | Weight | Rank | GTEx | DepMap | Descartes | Mean.Counts | Mean.TPM |
|---|---|---|---|---|---|---|---|
| COL18A1 | 0.0071853 | 49 | GTEx | DepMap | Descartes | 0.69 | 464.95 |
| LAMC1 | 0.0036300 | 200 | GTEx | DepMap | Descartes | 0.35 | 184.25 |
| ERBB3 | 0.0019448 | 508 | GTEx | DepMap | Descartes | 0.06 | 51.88 |
| COL5A2 | 0.0017802 | 580 | GTEx | DepMap | Descartes | 0.43 | 243.54 |
| VCAN | 0.0017611 | 587 | GTEx | DepMap | Descartes | 0.39 | 136.25 |
| DST | 0.0015832 | 671 | GTEx | DepMap | Descartes | 1.11 | 194.21 |
| STARD13 | 0.0011991 | 958 | GTEx | DepMap | Descartes | 0.17 | 125.40 |
| VIM | 0.0010740 | 1072 | GTEx | DepMap | Descartes | 0.52 | 931.12 |
| PLCE1 | 0.0007947 | 1470 | GTEx | DepMap | Descartes | 0.15 | 30.53 |
| GAS7 | 0.0007862 | 1487 | GTEx | DepMap | Descartes | 0.08 | 39.63 |
| IL1RAPL2 | 0.0003970 | 2709 | GTEx | DepMap | Descartes | 0.06 | 54.78 |
| ADAMTS5 | 0.0002646 | 3501 | GTEx | DepMap | Descartes | 0.00 | 0.00 |
| LAMA4 | 0.0001587 | 4299 | GTEx | DepMap | Descartes | 0.02 | 12.85 |
| SLC35F1 | 0.0001088 | 4743 | GTEx | DepMap | Descartes | 0.01 | 13.79 |
| MPZ | 0.0000883 | 4933 | GTEx | DepMap | Descartes | 0.00 | 0.00 |
| PLP1 | 0.0000497 | 5371 | GTEx | DepMap | Descartes | 0.01 | 4.88 |
| HMGA2 | 0.0000485 | 5382 | GTEx | DepMap | Descartes | 0.06 | 8.89 |
| COL25A1 | 0.0000478 | 5397 | GTEx | DepMap | Descartes | 0.05 | 14.63 |
| IL1RAPL1 | 0.0000325 | 5579 | GTEx | DepMap | Descartes | 0.23 | 119.03 |
| EDNRB | 0.0000288 | 5626 | GTEx | DepMap | Descartes | 0.01 | 3.71 |
| NRXN3 | 0.0000087 | 5885 | GTEx | DepMap | Descartes | 0.18 | 60.47 |
| PTPRZ1 | -0.0000200 | 6276 | GTEx | DepMap | Descartes | 0.01 | 2.87 |
| SFRP1 | -0.0000288 | 6433 | GTEx | DepMap | Descartes | 0.05 | 39.16 |
| OLFML2A | -0.0000330 | 6501 | GTEx | DepMap | Descartes | 0.00 | 0.00 |
| MDGA2 | -0.0000943 | 7654 | GTEx | DepMap | Descartes | 0.00 | 0.00 |
| FIGN | -0.0001017 | 7802 | GTEx | DepMap | Descartes | 0.06 | 18.25 |
| TRPM3 | -0.0001568 | 8793 | GTEx | DepMap | Descartes | 0.05 | 17.48 |
| SCN7A | -0.0001625 | 8856 | GTEx | DepMap | Descartes | 0.02 | 15.93 |
| GRIK3 | -0.0001893 | 9264 | GTEx | DepMap | Descartes | 0.02 | 4.83 |
| KCTD12 | -0.0002378 | 9899 | GTEx | DepMap | Descartes | 0.01 | 8.20 |
Descartes Megakaryocytes markers
Top 50 marker genes of Megakaryocytes cells in the Decartes fetal adrenal single cell map (https://atlas.brotmanbaty.org/bbi/human-gene-expression-during-development/cell/megakaryocytes/in/adrenal)
Wilcoxon ranksum test P-value for gene set overrepresentation: 1.26e-01
Mean rank of genes in gene set: 5656.29
Median rank of genes in gene set: 5723
Rank on gene expression program of top 30 genes in gene set:
| Genes | Weight | Rank | GTEx | DepMap | Descartes | Mean.Counts | Mean.TPM |
|---|---|---|---|---|---|---|---|
| UBASH3B | 0.0068963 | 52 | GTEx | DepMap | Descartes | 0.24 | 165.86 |
| MYH9 | 0.0042632 | 155 | GTEx | DepMap | Descartes | 0.40 | 259.05 |
| THBS1 | 0.0033280 | 233 | GTEx | DepMap | Descartes | 0.61 | 339.33 |
| FLNA | 0.0021984 | 432 | GTEx | DepMap | Descartes | 0.42 | 195.87 |
| LTBP1 | 0.0018719 | 537 | GTEx | DepMap | Descartes | 0.18 | 104.40 |
| ACTN1 | 0.0018292 | 556 | GTEx | DepMap | Descartes | 0.37 | 327.61 |
| GSN | 0.0017113 | 616 | GTEx | DepMap | Descartes | 0.20 | 149.44 |
| STOM | 0.0013786 | 797 | GTEx | DepMap | Descartes | 0.09 | 109.52 |
| MYLK | 0.0013139 | 854 | GTEx | DepMap | Descartes | 0.05 | 29.71 |
| VCL | 0.0012725 | 892 | GTEx | DepMap | Descartes | 0.13 | 55.82 |
| ARHGAP6 | 0.0009516 | 1189 | GTEx | DepMap | Descartes | 0.04 | 28.90 |
| TRPC6 | 0.0007118 | 1635 | GTEx | DepMap | Descartes | 0.01 | 16.05 |
| TPM4 | 0.0006767 | 1713 | GTEx | DepMap | Descartes | 0.15 | 100.32 |
| P2RX1 | 0.0006614 | 1750 | GTEx | DepMap | Descartes | 0.01 | 10.00 |
| FLI1 | 0.0005632 | 2054 | GTEx | DepMap | Descartes | 0.03 | 42.52 |
| ZYX | 0.0004809 | 2331 | GTEx | DepMap | Descartes | 0.07 | 154.33 |
| TGFB1 | 0.0004587 | 2442 | GTEx | DepMap | Descartes | 0.10 | 99.90 |
| RAP1B | 0.0004454 | 2500 | GTEx | DepMap | Descartes | 0.16 | 43.75 |
| PSTPIP2 | 0.0002348 | 3710 | GTEx | DepMap | Descartes | 0.02 | 30.36 |
| CD9 | 0.0002236 | 3790 | GTEx | DepMap | Descartes | 0.16 | 161.65 |
| ITGB3 | 0.0001473 | 4396 | GTEx | DepMap | Descartes | 0.00 | 0.00 |
| SLC24A3 | 0.0001115 | 4723 | GTEx | DepMap | Descartes | 0.04 | 40.19 |
| FERMT3 | 0.0000205 | 5723 | GTEx | DepMap | Descartes | 0.02 | 49.23 |
| SLC2A3 | 0.0000204 | 5725 | GTEx | DepMap | Descartes | 0.10 | 66.18 |
| TLN1 | 0.0000115 | 5844 | GTEx | DepMap | Descartes | 0.04 | 21.97 |
| LIMS1 | 0.0000037 | 5949 | GTEx | DepMap | Descartes | 0.13 | 112.16 |
| ANGPT1 | 0.0000004 | 5997 | GTEx | DepMap | Descartes | 0.01 | 13.16 |
| TUBB1 | -0.0000652 | 7119 | GTEx | DepMap | Descartes | 0.00 | 0.00 |
| MMRN1 | -0.0000942 | 7652 | GTEx | DepMap | Descartes | 0.00 | 0.00 |
| DOK6 | -0.0001040 | 7843 | GTEx | DepMap | Descartes | 0.10 | 40.28 |
Descartes Lyphoid markers
Top 50 marker genes of Lyphoid cells in the Decartes fetal adrenal single cell map (https://atlas.brotmanbaty.org/bbi/human-gene-expression-during-development/cell/lymphoid/in/adrenal)
Wilcoxon ranksum test P-value for gene set overrepresentation: 9.56e-01
Mean rank of genes in gene set: 7227.88
Median rank of genes in gene set: 8387
Rank on gene expression program of top 30 genes in gene set:
| Genes | Weight | Rank | GTEx | DepMap | Descartes | Mean.Counts | Mean.TPM |
|---|---|---|---|---|---|---|---|
| ABLIM1 | 0.0024378 | 371 | GTEx | DepMap | Descartes | 0.39 | 172.98 |
| CCND3 | 0.0023765 | 383 | GTEx | DepMap | Descartes | 0.14 | 229.81 |
| MSN | 0.0015514 | 694 | GTEx | DepMap | Descartes | 0.11 | 108.36 |
| ARID5B | 0.0013044 | 863 | GTEx | DepMap | Descartes | 0.27 | 110.38 |
| MCTP2 | 0.0012648 | 897 | GTEx | DepMap | Descartes | 0.07 | 37.85 |
| ETS1 | 0.0012504 | 911 | GTEx | DepMap | Descartes | 0.11 | 73.86 |
| SP100 | 0.0010634 | 1086 | GTEx | DepMap | Descartes | 0.12 | 110.60 |
| MBNL1 | 0.0009906 | 1154 | GTEx | DepMap | Descartes | 0.41 | 223.14 |
| FOXP1 | 0.0005591 | 2066 | GTEx | DepMap | Descartes | 0.77 | 318.76 |
| BACH2 | 0.0005499 | 2087 | GTEx | DepMap | Descartes | 0.42 | 156.22 |
| ITPKB | 0.0005392 | 2123 | GTEx | DepMap | Descartes | 0.02 | 11.70 |
| PLEKHA2 | 0.0004908 | 2300 | GTEx | DepMap | Descartes | 0.06 | 37.52 |
| ANKRD44 | 0.0000689 | 5131 | GTEx | DepMap | Descartes | 0.13 | 70.71 |
| PRKCH | 0.0000658 | 5167 | GTEx | DepMap | Descartes | 0.02 | 25.65 |
| B2M | 0.0000656 | 5169 | GTEx | DepMap | Descartes | 0.48 | 700.19 |
| CCL5 | 0.0000301 | 5607 | GTEx | DepMap | Descartes | 0.00 | 0.00 |
| ARHGDIB | 0.0000131 | 5823 | GTEx | DepMap | Descartes | 0.01 | 22.50 |
| LCP1 | -0.0000018 | 6032 | GTEx | DepMap | Descartes | 0.01 | 11.07 |
| CD44 | -0.0000473 | 6781 | GTEx | DepMap | Descartes | 0.09 | 100.77 |
| STK39 | -0.0000833 | 7465 | GTEx | DepMap | Descartes | 0.15 | 197.19 |
| SAMD3 | -0.0001202 | 8150 | GTEx | DepMap | Descartes | 0.01 | 5.19 |
| RCSD1 | -0.0001479 | 8624 | GTEx | DepMap | Descartes | 0.01 | 2.20 |
| LEF1 | -0.0001759 | 9045 | GTEx | DepMap | Descartes | 0.01 | 9.86 |
| IKZF1 | -0.0002068 | 9507 | GTEx | DepMap | Descartes | 0.00 | 0.00 |
| RAP1GAP2 | -0.0002306 | 9812 | GTEx | DepMap | Descartes | 0.32 | 152.16 |
| SKAP1 | -0.0002579 | 10153 | GTEx | DepMap | Descartes | 0.02 | 6.51 |
| SORL1 | -0.0002702 | 10288 | GTEx | DepMap | Descartes | 0.09 | 24.28 |
| PTPRC | -0.0002734 | 10327 | GTEx | DepMap | Descartes | 0.01 | 7.99 |
| SCML4 | -0.0002847 | 10437 | GTEx | DepMap | Descartes | 0.06 | 34.14 |
| WIPF1 | -0.0003735 | 11181 | GTEx | DepMap | Descartes | 0.05 | 41.10 |
Below shows the ranks on this GEP for immune marker gene lists curated by CellTypist (https://www.celltypist.org/encyclopedia).
High ranks indicate this gene is a driver of this GEP.
These curated gene list are ranked by P-value (on this GEP) of their constituent genes.
The Mean Count column shows the mean read count in cells scoring highly (H > 50) on this gene expression program.
Fibroblasts: Fibroblasts (curated markers)
the most common cells of connective tissues which synthesize the extracellular matrix and collagen to maintain tissue homeostasis:
Wilcoxon ranksum test P-value for gene set overrepresentation: 3.87e-03
Mean rank of genes in gene set: 704.33
Rank on gene expression program of genes in gene set:
| Genes | Weight | Rank | GTEx | DepMap | Decartes | Mean.Counts | Mean.TPM |
|---|---|---|---|---|---|---|---|
| COL1A2 | 0.0028187 | 309 | GTEx | DepMap | Descartes | 1.78 | 1420.98 |
| DCN | 0.0013891 | 785 | GTEx | DepMap | Descartes | 0.11 | 62.79 |
| COL1A1 | 0.0011264 | 1019 | GTEx | DepMap | Descartes | 0.90 | 662.84 |
Double-negative thymocytes: Double-negative thymocytes (curated markers)
the early immature thymocytes from the thymus in the double negative (co-receptors CD4- and CD8-) stage:
Wilcoxon ranksum test P-value for gene set overrepresentation: 8.03e-03
Mean rank of genes in gene set: 108.5
Rank on gene expression program of genes in gene set:
| Genes | Weight | Rank | GTEx | DepMap | Decartes | Mean.Counts | Mean.TPM |
|---|---|---|---|---|---|---|---|
| FXYD2 | 0.0067950 | 53 | GTEx | DepMap | Descartes | 0.06 | 82.01 |
| HES1 | 0.0040673 | 164 | GTEx | DepMap | Descartes | 0.19 | 512.70 |
pDC precursor: pDC precursor (curated markers)
precursors of plasmacytoid dendritic cells which have intermixed lymphoid and myeloid origins and give rise to plasmacytoid dendritic cells:
Wilcoxon ranksum test P-value for gene set overrepresentation: 2.69e-02
Mean rank of genes in gene set: 1333.5
Rank on gene expression program of genes in gene set:
| Genes | Weight | Rank | GTEx | DepMap | Decartes | Mean.Counts | Mean.TPM |
|---|---|---|---|---|---|---|---|
| CCDC50 | 0.0009240 | 1230 | GTEx | DepMap | Descartes | 0.10 | 50.57 |
| IRF7 | 0.0008144 | 1437 | GTEx | DepMap | Descartes | 0.05 | 125.24 |