Program: 4. Macrophage.
Submit a comment on this gene expression program’s interpretation: CLICK
QQ-plot of gene loadings, averaged over both independent splits of the data
This plot highlights the relative contribution of each gene to the GEP
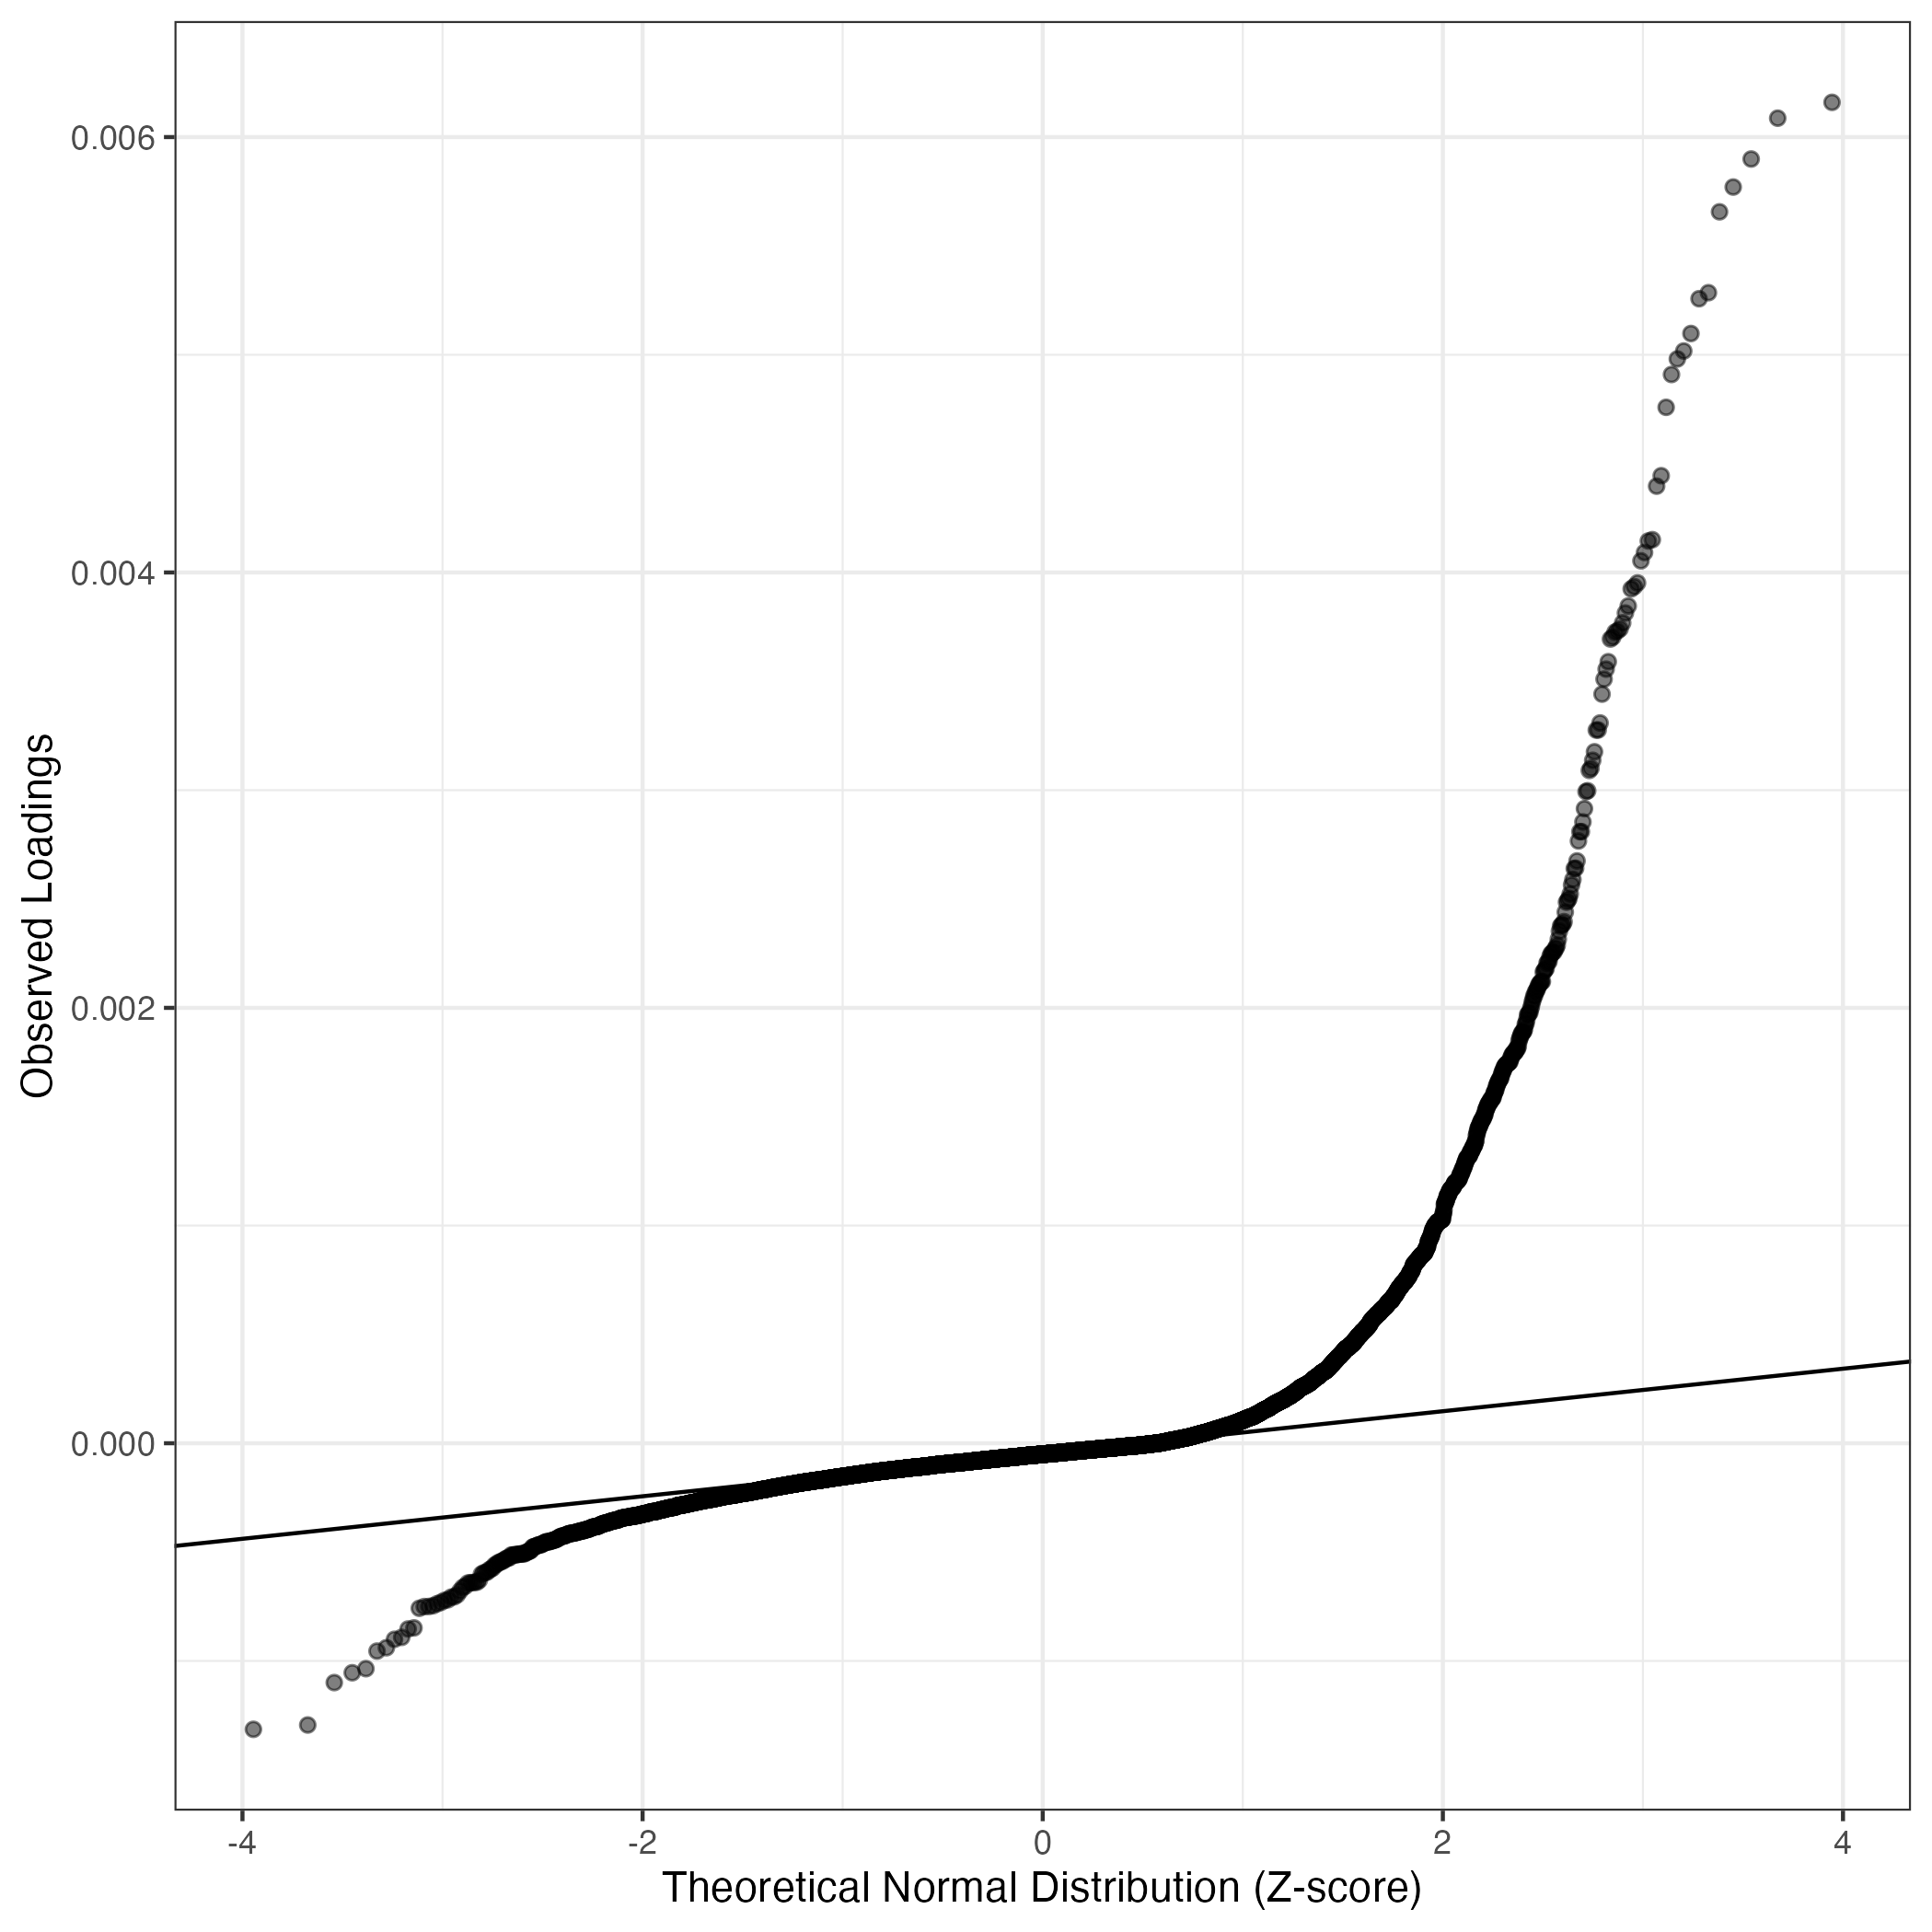
Top genes driving this program.
Note: Decartes website is buggy, try refreshing. Also, Decartes fetal adrenal data have been collected at specific time points (89-122 days), all possible cell types of interest may not be represented, do not overinterpret.
The Mean Count column shows the mean read count in cells scoring highly (H > 50) on this gene expression program.
| Gene | Loading | Gene.Name | GTEx | DepMap | Descartes | Mean.Counts | Mean.Tpm | |
|---|---|---|---|---|---|---|---|---|
| 1 | GPNMB | 0.0061595 | glycoprotein nmb | GTEx | DepMap | Descartes | 6.33 | 519.13 |
| 2 | CSTB | 0.0060868 | cystatin B | GTEx | DepMap | Descartes | 17.69 | NA |
| 3 | CAPG | 0.0058993 | capping actin protein, gelsolin like | GTEx | DepMap | Descartes | 4.71 | 800.16 |
| 4 | CTSD | 0.0057705 | cathepsin D | GTEx | DepMap | Descartes | 29.70 | 3587.56 |
| 5 | APOC1 | 0.0056566 | apolipoprotein C1 | GTEx | DepMap | Descartes | 55.54 | 16862.42 |
| 6 | CD68 | 0.0052851 | CD68 molecule | GTEx | DepMap | Descartes | 10.89 | 1376.90 |
| 7 | ACP5 | 0.0052575 | acid phosphatase 5, tartrate resistant | GTEx | DepMap | Descartes | 2.73 | 313.53 |
| 8 | CYP27A1 | 0.0050977 | cytochrome P450 family 27 subfamily A member 1 | GTEx | DepMap | Descartes | 0.77 | 61.44 |
| 9 | CTSZ | 0.0050173 | cathepsin Z | GTEx | DepMap | Descartes | 9.29 | 1415.96 |
| 10 | CTSB | 0.0049809 | cathepsin B | GTEx | DepMap | Descartes | 20.73 | 1419.88 |
| 11 | PLA2G7 | 0.0049094 | phospholipase A2 group VII | GTEx | DepMap | Descartes | 2.45 | 263.29 |
| 12 | LGALS3 | 0.0047586 | galectin 3 | GTEx | DepMap | Descartes | 7.38 | 832.92 |
| 13 | SPP1 | 0.0044444 | secreted phosphoprotein 1 | GTEx | DepMap | Descartes | 144.70 | 26388.04 |
| 14 | MMP9 | 0.0043965 | matrix metallopeptidase 9 | GTEx | DepMap | Descartes | 2.77 | 194.81 |
| 15 | FUCA1 | 0.0041507 | alpha-L-fucosidase 1 | GTEx | DepMap | Descartes | 2.76 | 243.01 |
| 16 | NUPR1 | 0.0041446 | nuclear protein 1, transcriptional regulator | GTEx | DepMap | Descartes | 2.45 | 102.53 |
| 17 | PSAP | 0.0040919 | prosaposin | GTEx | DepMap | Descartes | 14.31 | 1010.83 |
| 18 | PLIN2 | 0.0040535 | perilipin 2 | GTEx | DepMap | Descartes | 5.91 | 870.36 |
| 19 | NPL | 0.0039520 | N-acetylneuraminate pyruvate lyase | GTEx | DepMap | Descartes | 1.65 | 127.56 |
| 20 | ATOX1 | 0.0039351 | antioxidant 1 copper chaperone | GTEx | DepMap | Descartes | 6.56 | 301.35 |
| 21 | APOE | 0.0039245 | apolipoprotein E | GTEx | DepMap | Descartes | 117.94 | 20862.80 |
| 22 | S100A11 | 0.0038460 | S100 calcium binding protein A11 | GTEx | DepMap | Descartes | 17.87 | 7468.96 |
| 23 | LIPA | 0.0038137 | lipase A, lysosomal acid type | GTEx | DepMap | Descartes | 4.54 | 408.02 |
| 24 | CTSL | 0.0037686 | cathepsin L | GTEx | DepMap | Descartes | 10.89 | NA |
| 25 | GM2A | 0.0037409 | GM2 ganglioside activator | GTEx | DepMap | Descartes | 1.13 | 67.58 |
| 26 | IL4I1 | 0.0037314 | interleukin 4 induced 1 | GTEx | DepMap | Descartes | 1.09 | 105.41 |
| 27 | IL18 | 0.0037261 | interleukin 18 | GTEx | DepMap | Descartes | 2.04 | 241.73 |
| 28 | NPC2 | 0.0037030 | NPC intracellular cholesterol transporter 2 | GTEx | DepMap | Descartes | 10.18 | 1553.32 |
| 29 | GRN | 0.0036943 | granulin precursor | GTEx | DepMap | Descartes | 8.99 | 852.20 |
| 30 | OTOA | 0.0035901 | otoancorin | GTEx | DepMap | Descartes | 0.82 | 33.71 |
| 31 | FTH1 | 0.0035559 | ferritin heavy chain 1 | GTEx | DepMap | Descartes | 154.58 | 27938.67 |
| 32 | FABP5 | 0.0035100 | fatty acid binding protein 5 | GTEx | DepMap | Descartes | 14.69 | 3965.12 |
| 33 | FCER1G | 0.0034412 | Fc epsilon receptor Ig | GTEx | DepMap | Descartes | 12.05 | 4724.51 |
| 34 | RAB42 | 0.0033087 | RAB42, member RAS oncogene family | GTEx | DepMap | Descartes | 0.75 | 80.14 |
| 35 | CD63 | 0.0032765 | CD63 molecule | GTEx | DepMap | Descartes | 14.41 | 2690.24 |
| 36 | CTSH | 0.0032761 | cathepsin H | GTEx | DepMap | Descartes | 2.71 | 258.59 |
| 37 | PRDX1 | 0.0031763 | peroxiredoxin 1 | GTEx | DepMap | Descartes | 8.75 | 1438.08 |
| 38 | LGALS1 | 0.0031371 | galectin 1 | GTEx | DepMap | Descartes | 15.51 | 5512.11 |
| 39 | CTSA | 0.0031005 | cathepsin A | GTEx | DepMap | Descartes | 2.38 | 180.41 |
| 40 | GLUL | 0.0030906 | glutamate-ammonia ligase | GTEx | DepMap | Descartes | 7.11 | 221.48 |
| 41 | ITGB2 | 0.0029971 | integrin subunit beta 2 | GTEx | DepMap | Descartes | 3.72 | 177.53 |
| 42 | CREG1 | 0.0029933 | cellular repressor of E1A stimulated genes 1 | GTEx | DepMap | Descartes | 3.67 | 402.33 |
| 43 | BLVRB | 0.0029151 | biliverdin reductase B | GTEx | DepMap | Descartes | 4.01 | 675.54 |
| 44 | TYROBP | 0.0028541 | transmembrane immune signaling adaptor TYROBP | GTEx | DepMap | Descartes | 22.46 | 8139.71 |
| 45 | ASAH1 | 0.0028095 | N-acylsphingosine amidohydrolase 1 | GTEx | DepMap | Descartes | 5.24 | 197.41 |
| 46 | CTSS | 0.0028093 | cathepsin S | GTEx | DepMap | Descartes | 6.25 | 304.47 |
| 47 | MMP12 | 0.0027666 | matrix metallopeptidase 12 | GTEx | DepMap | Descartes | 4.71 | 487.95 |
| 48 | BRI3 | 0.0026749 | brain protein I3 | GTEx | DepMap | Descartes | 6.09 | 429.80 |
| 49 | VAMP8 | 0.0026413 | vesicle associated membrane protein 8 | GTEx | DepMap | Descartes | 4.48 | 1252.79 |
| 50 | CD84 | 0.0026399 | CD84 molecule | GTEx | DepMap | Descartes | 1.09 | 29.32 |
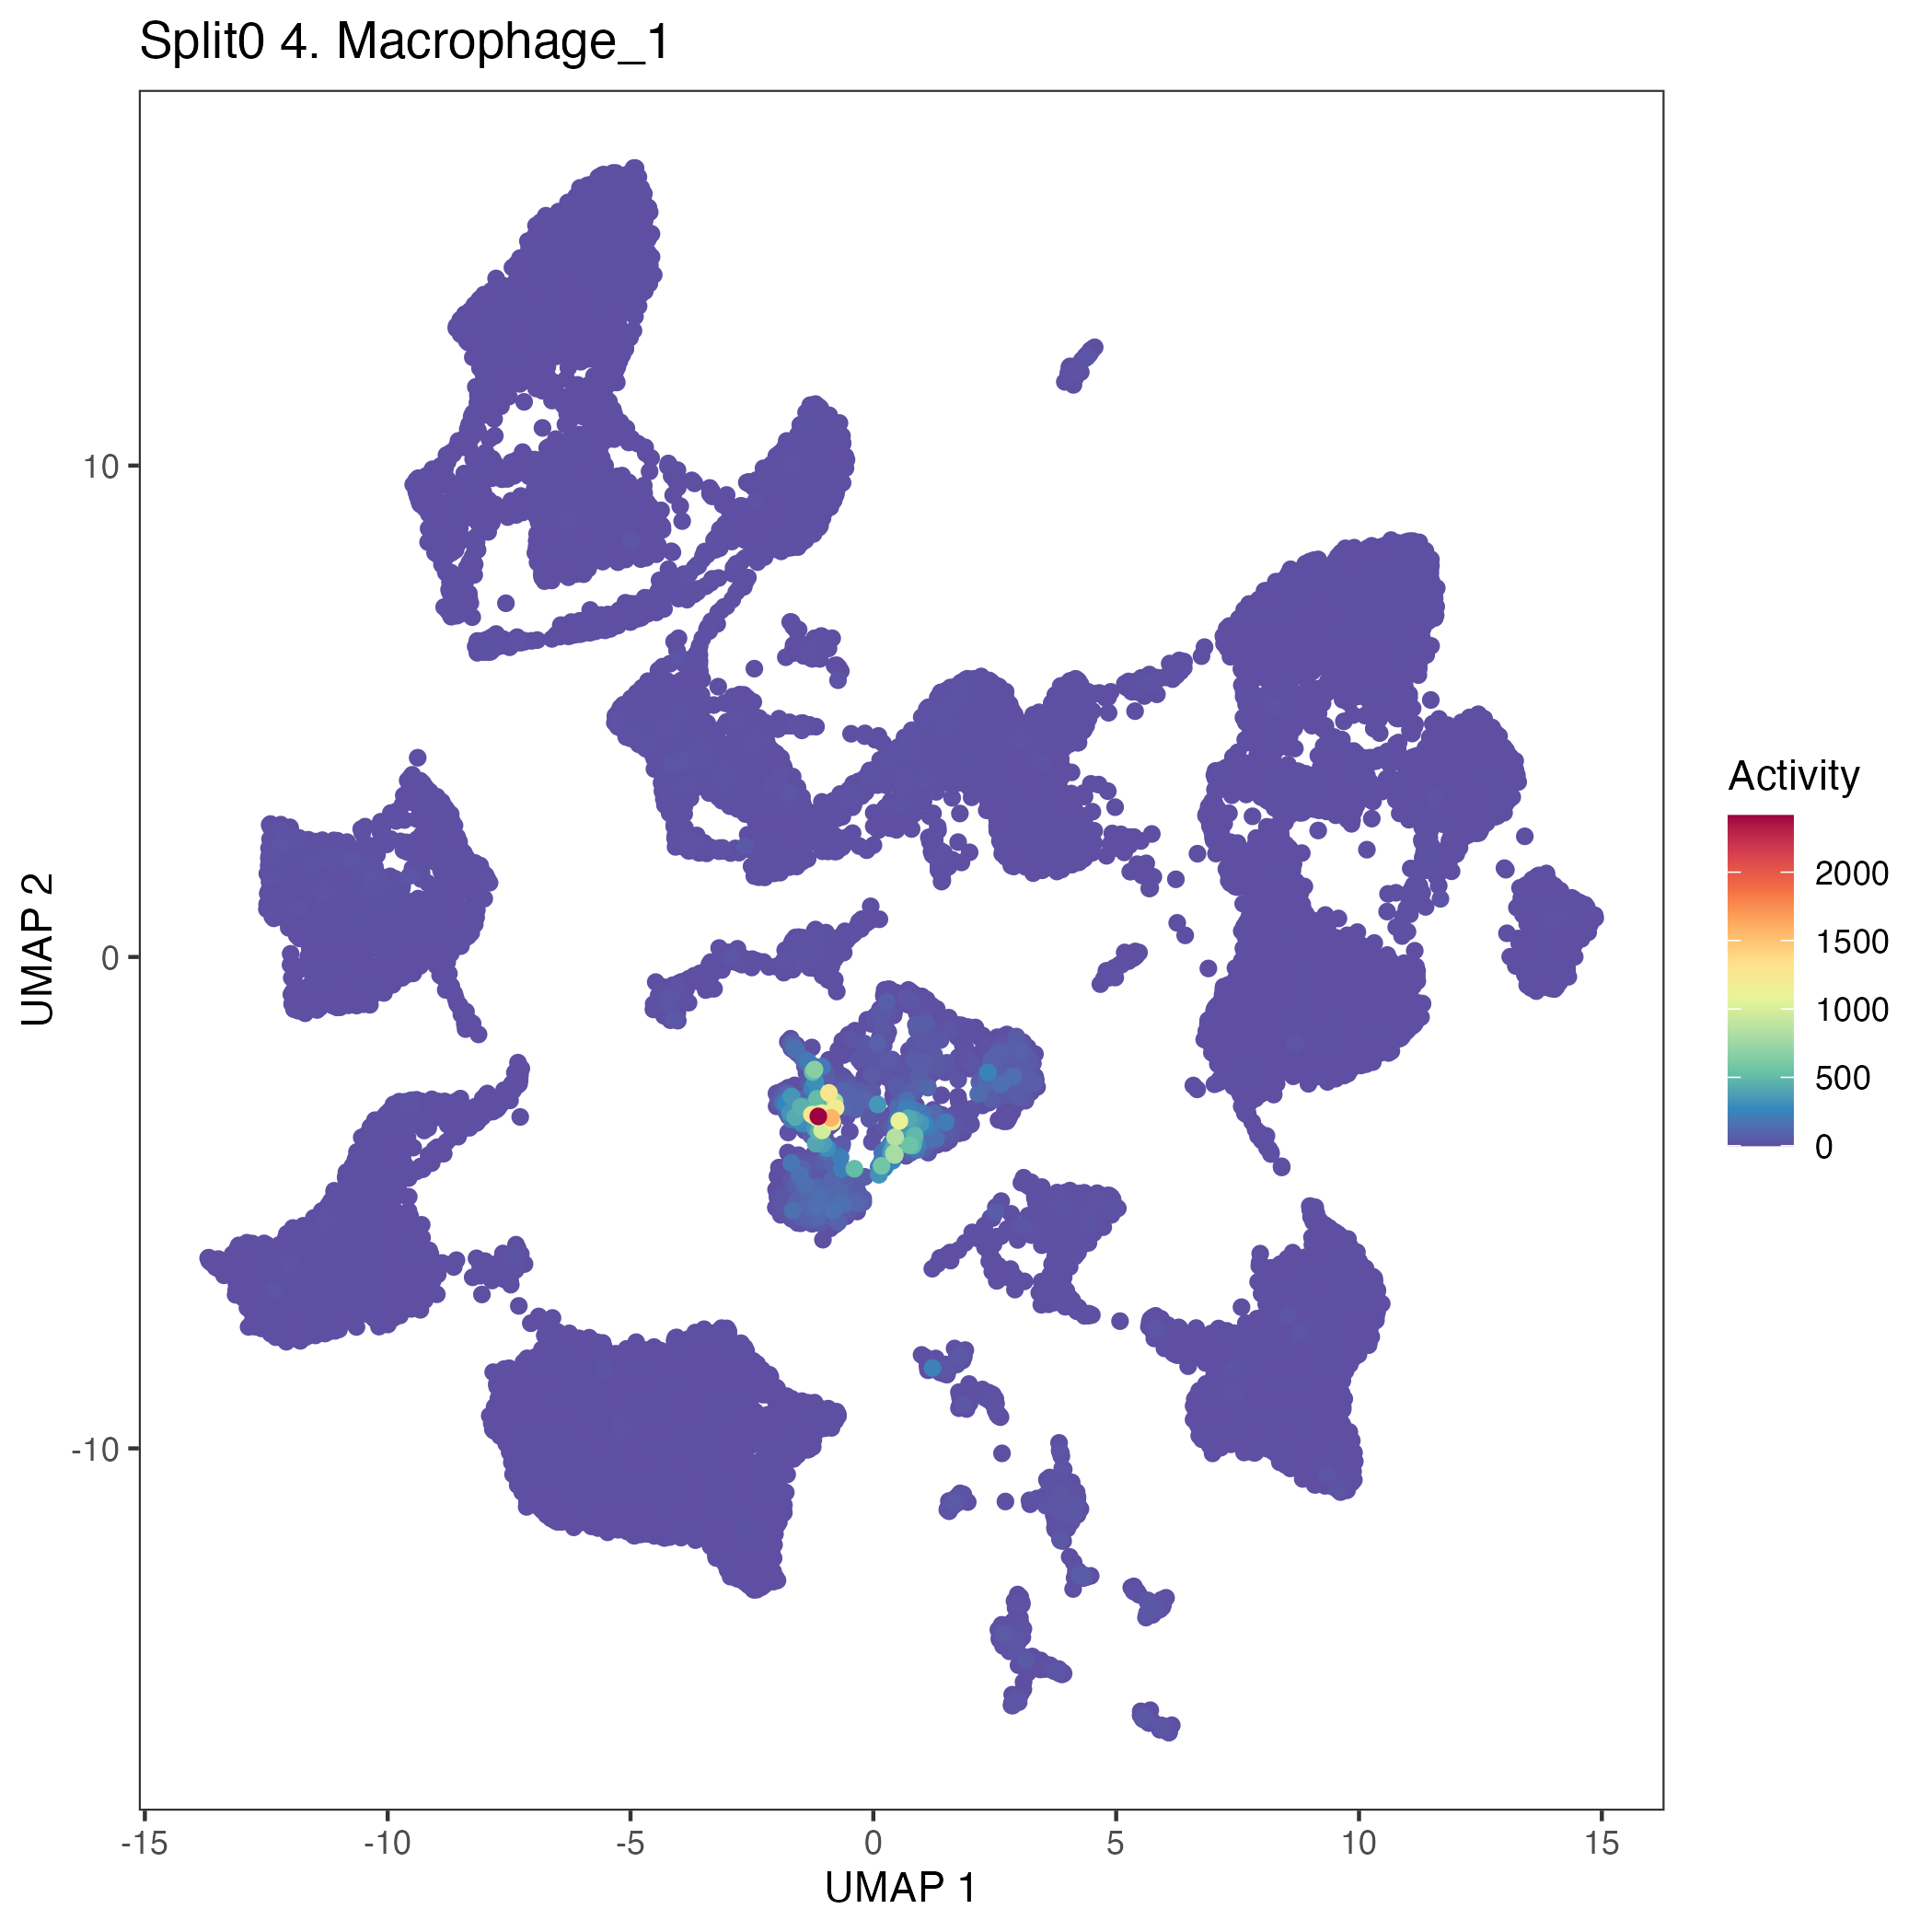
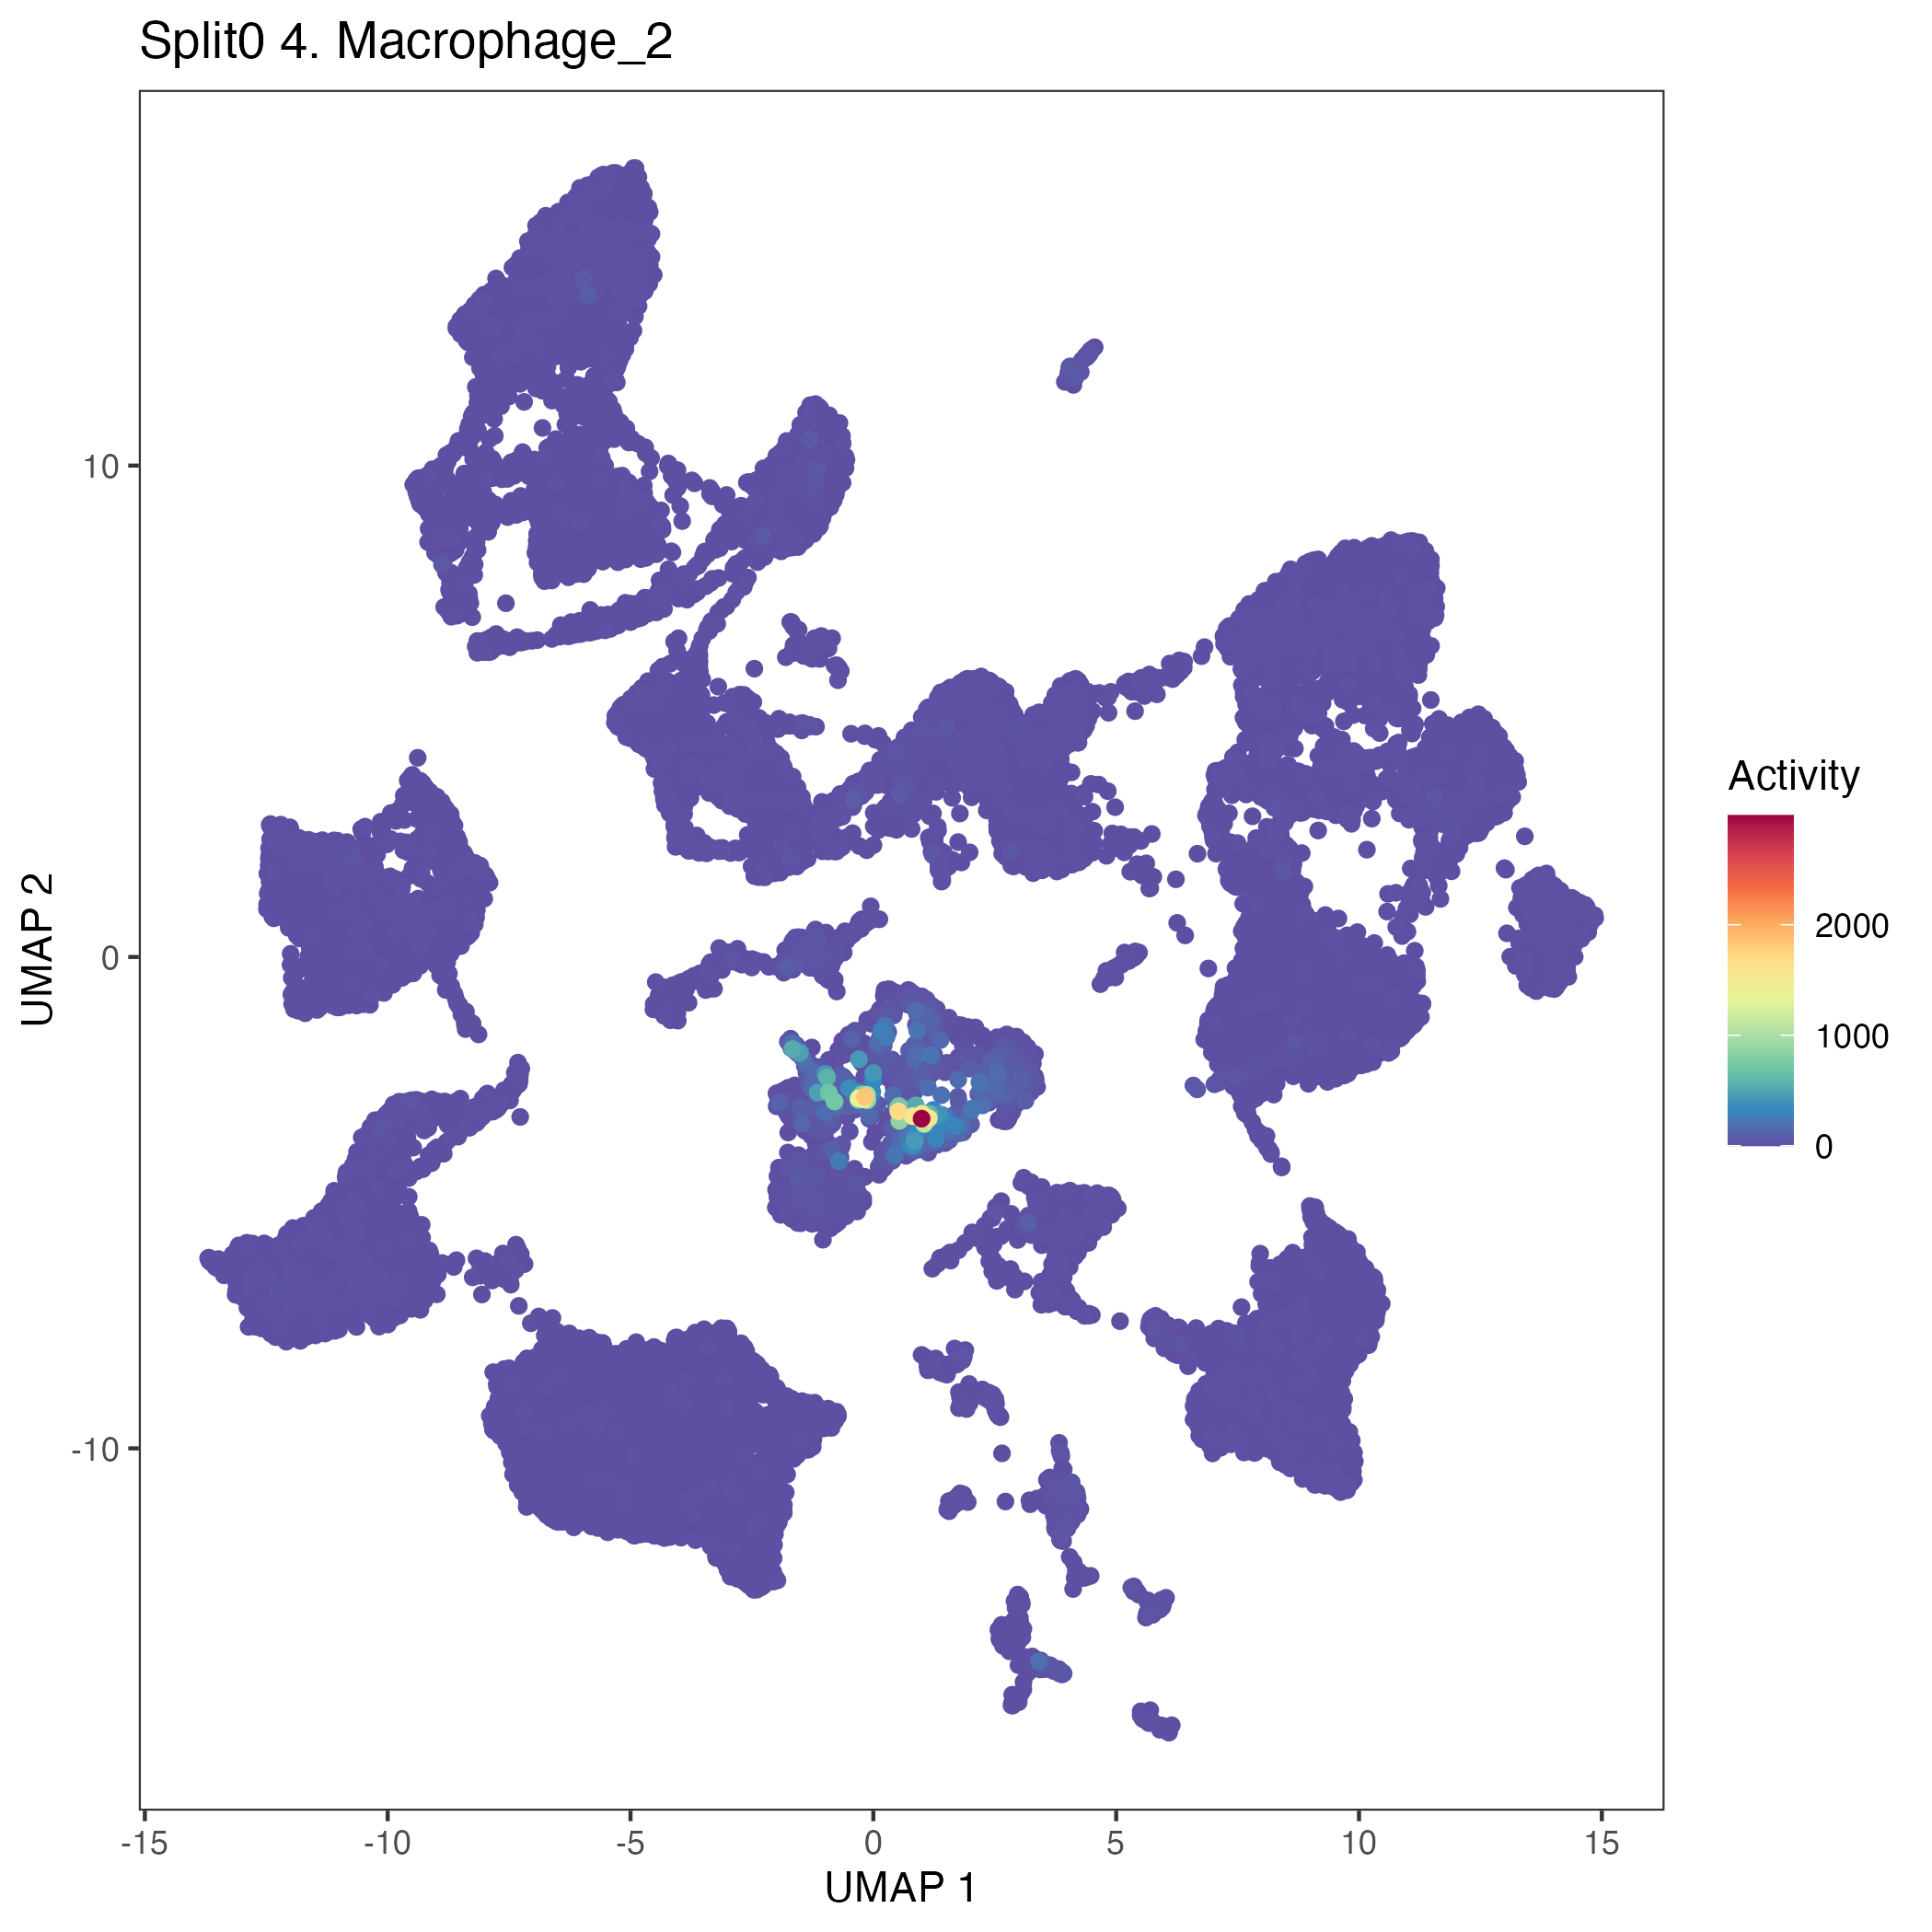
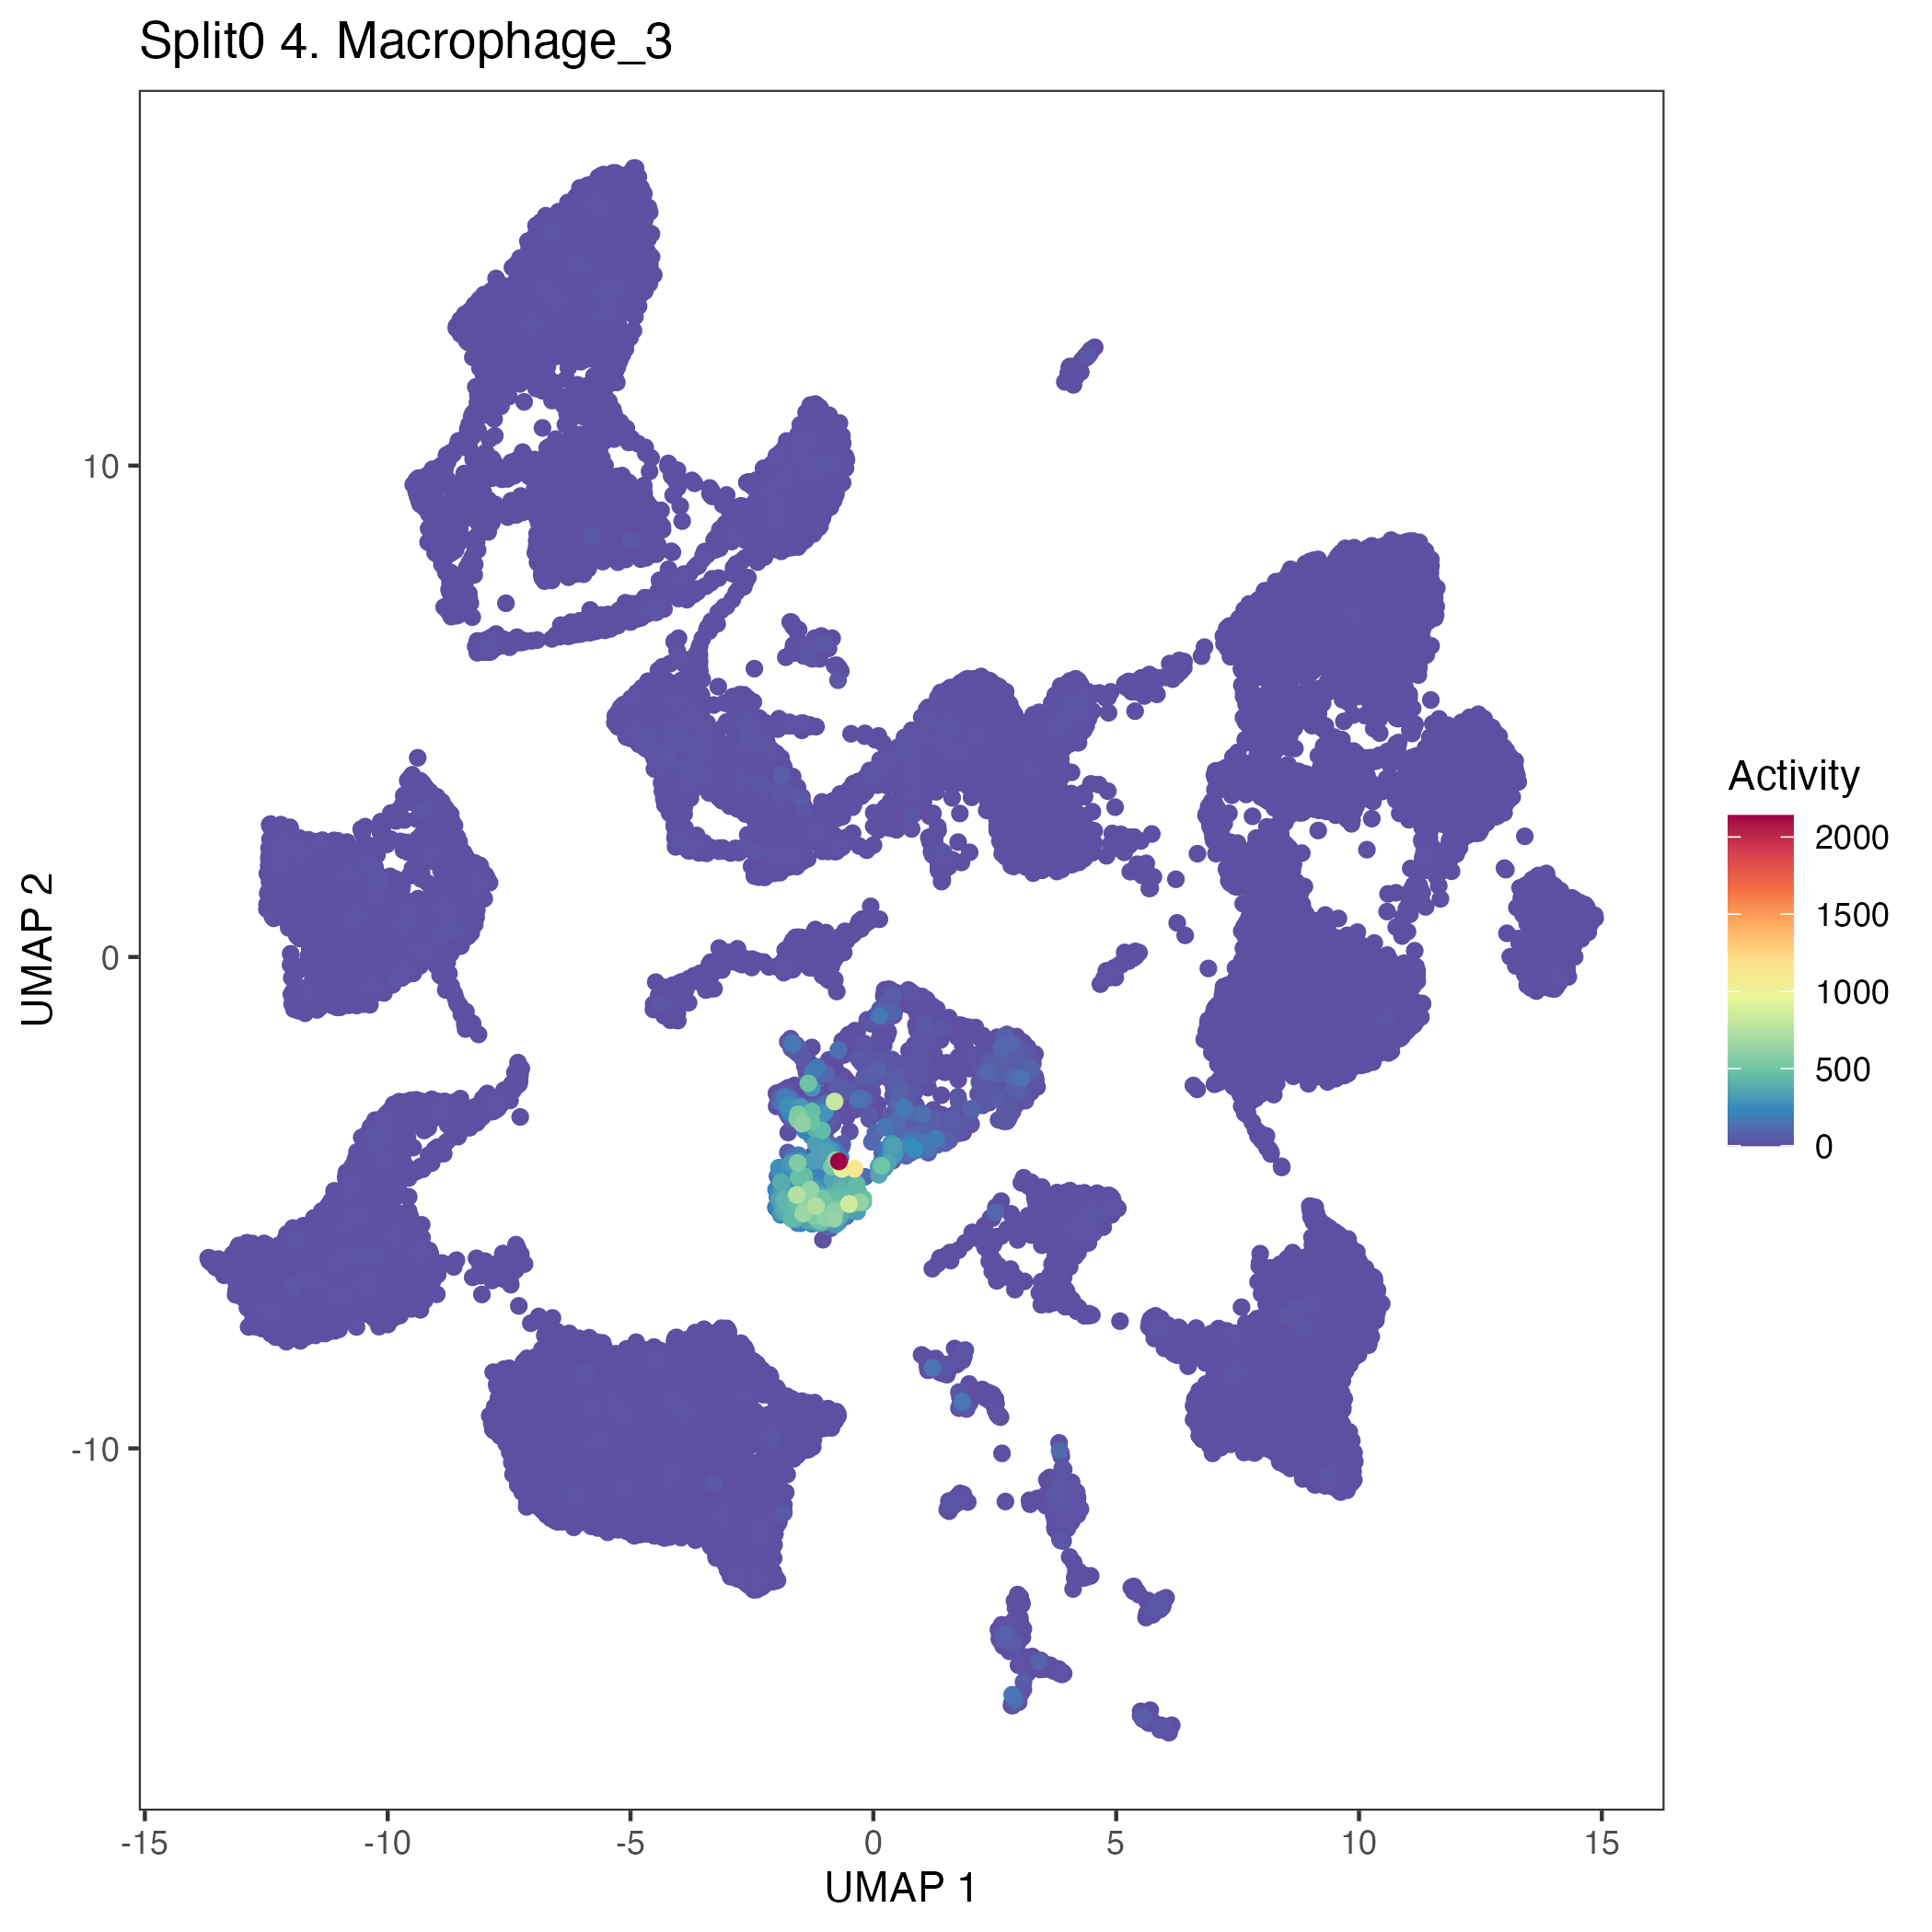
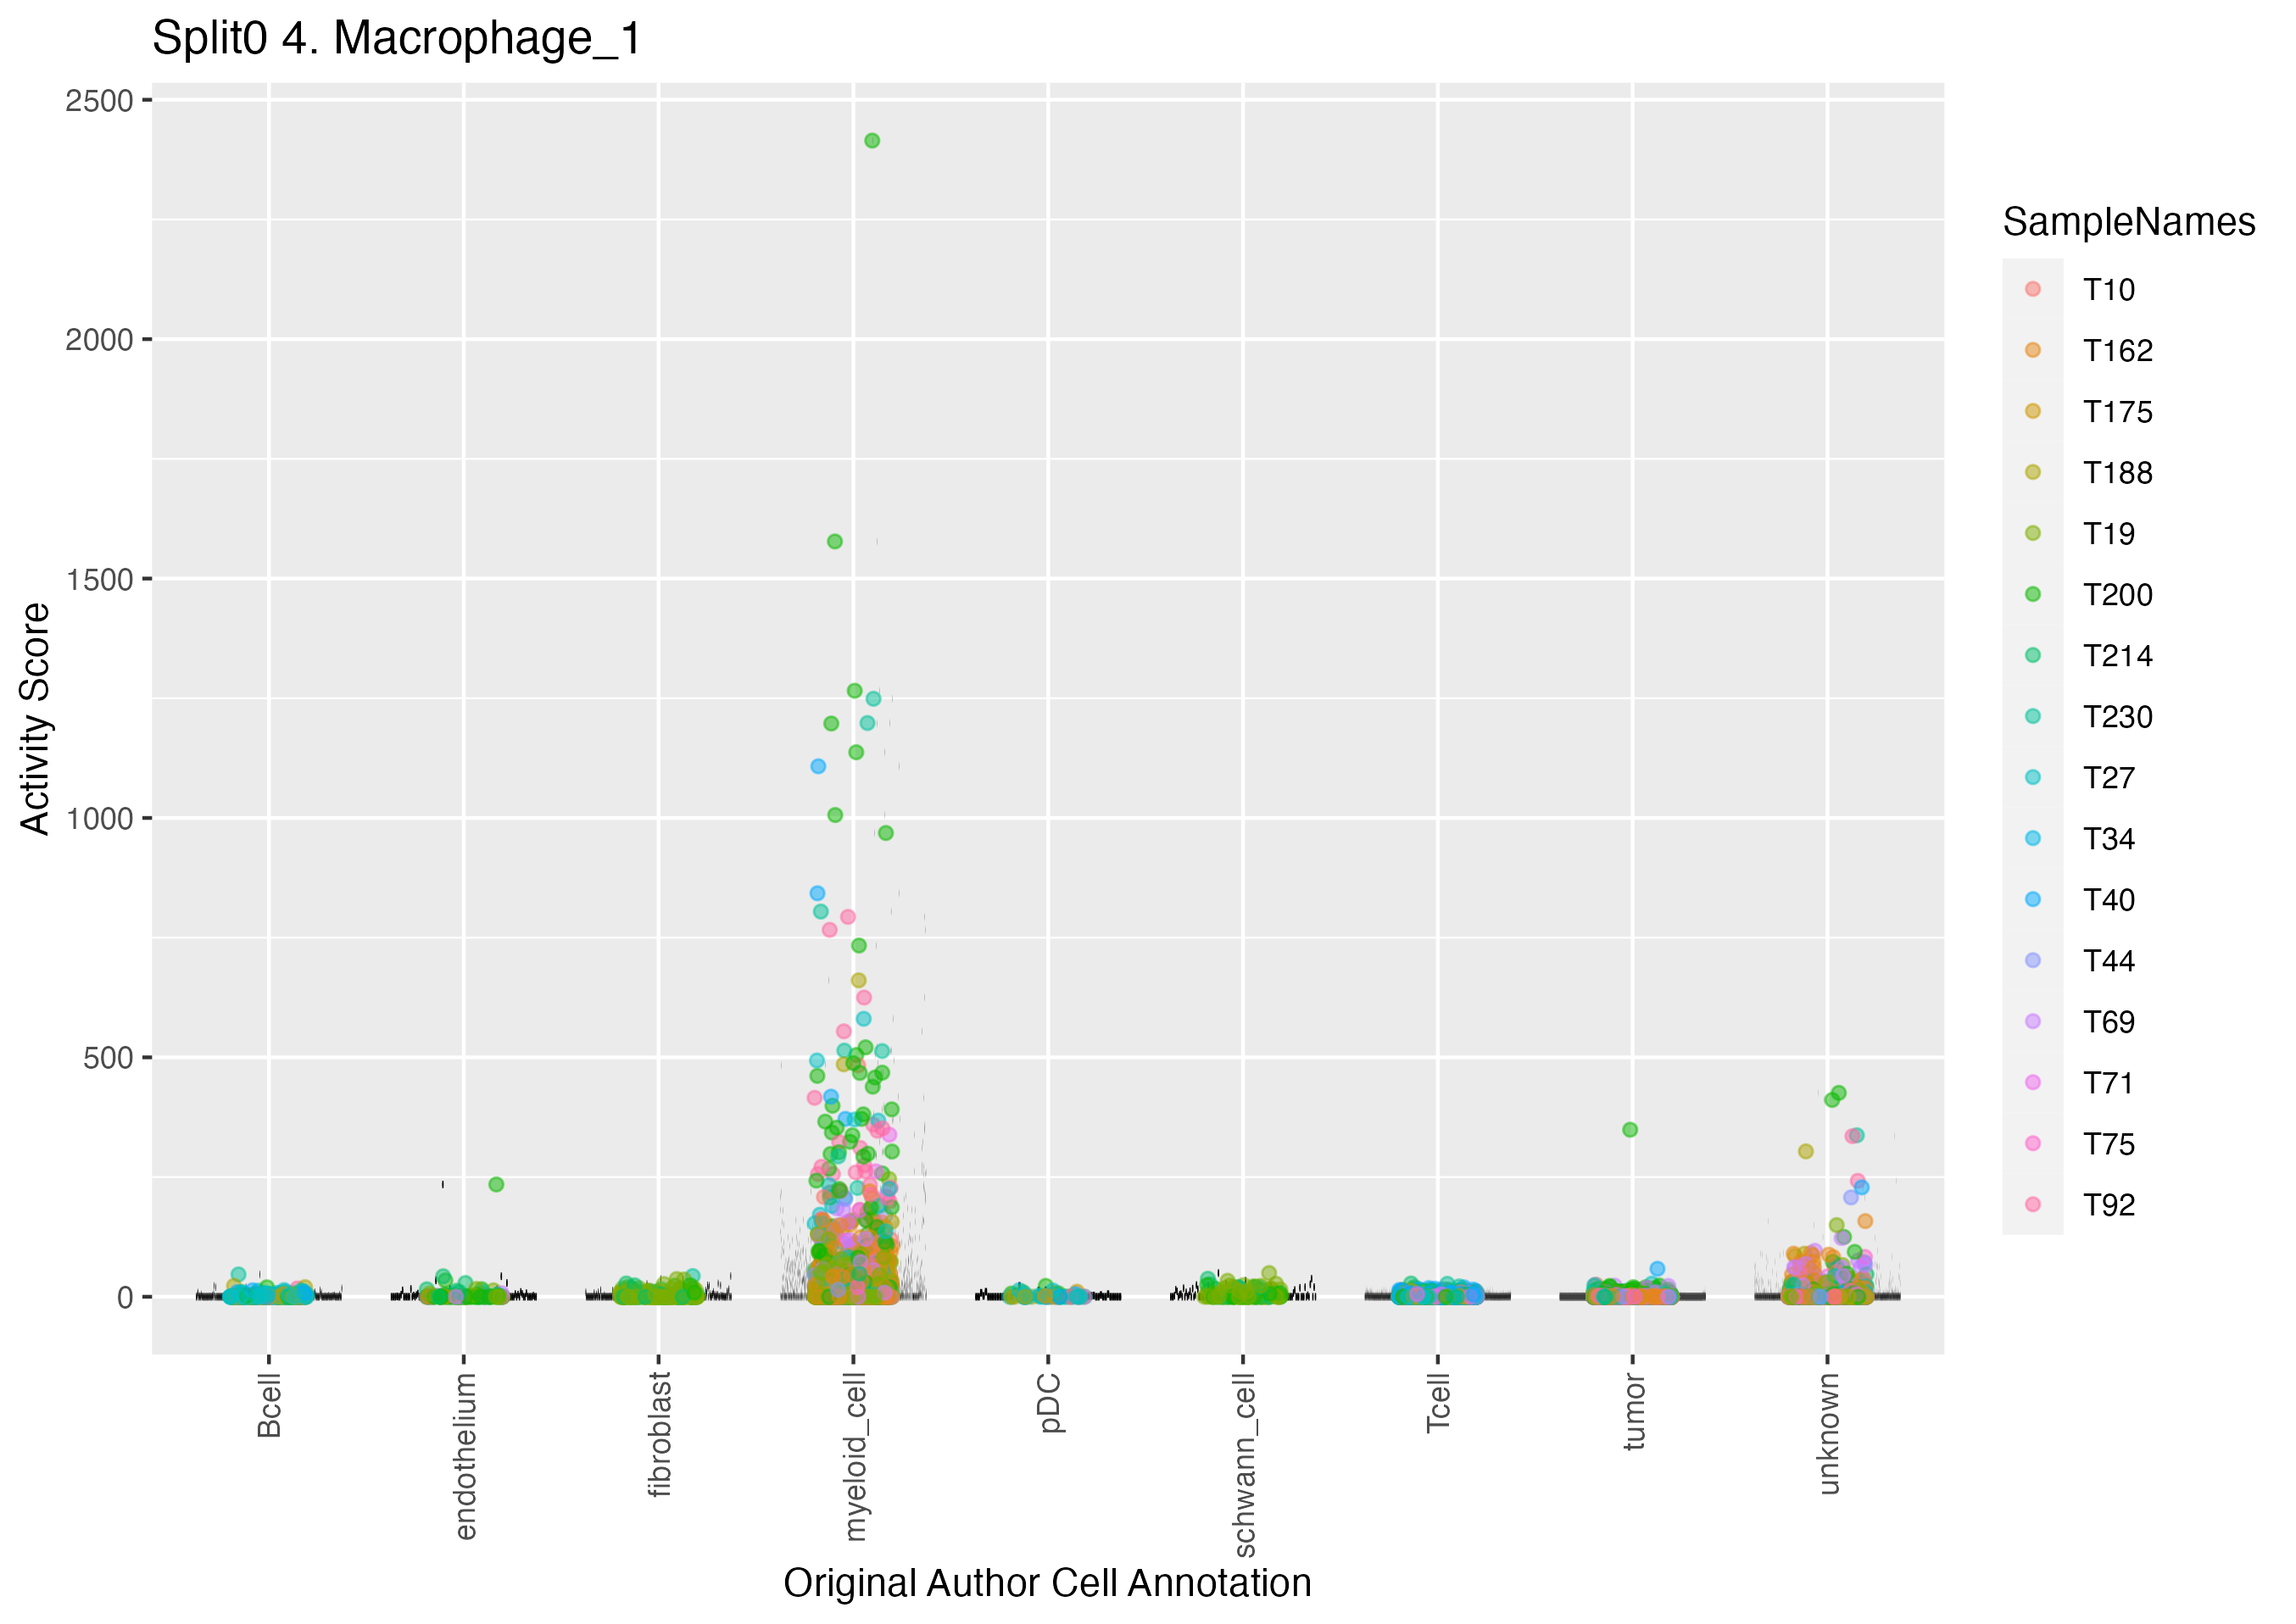
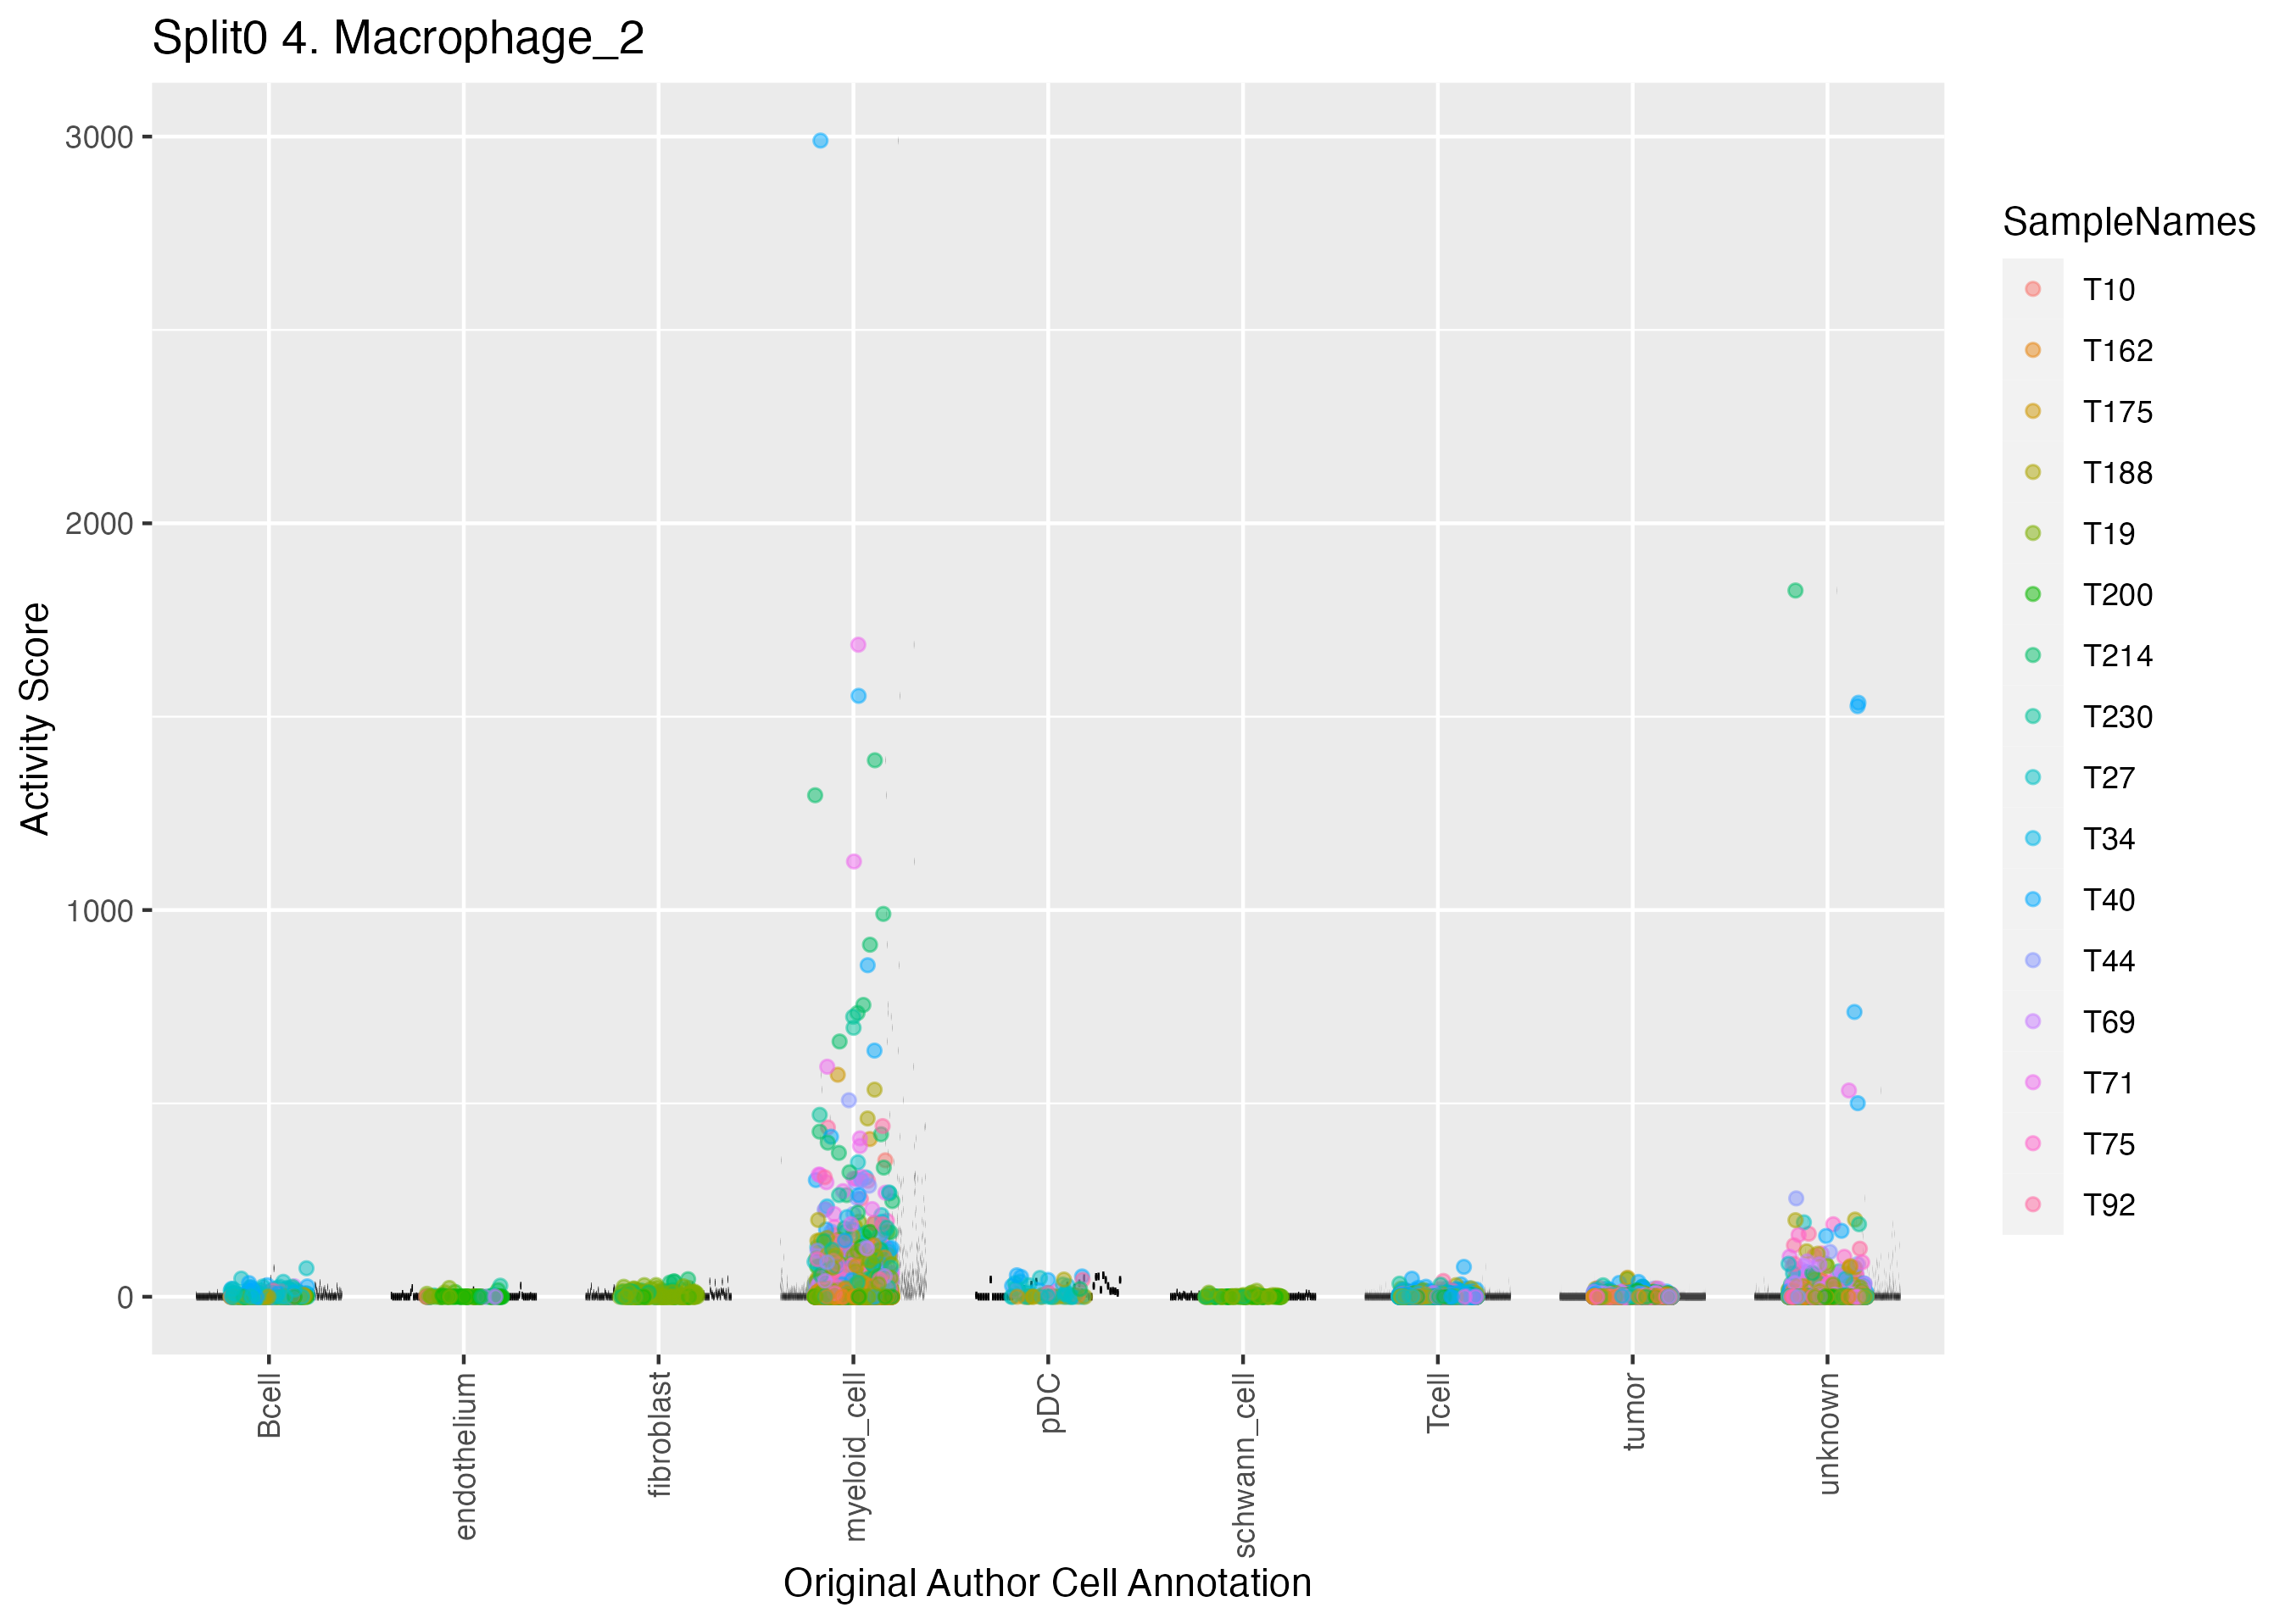
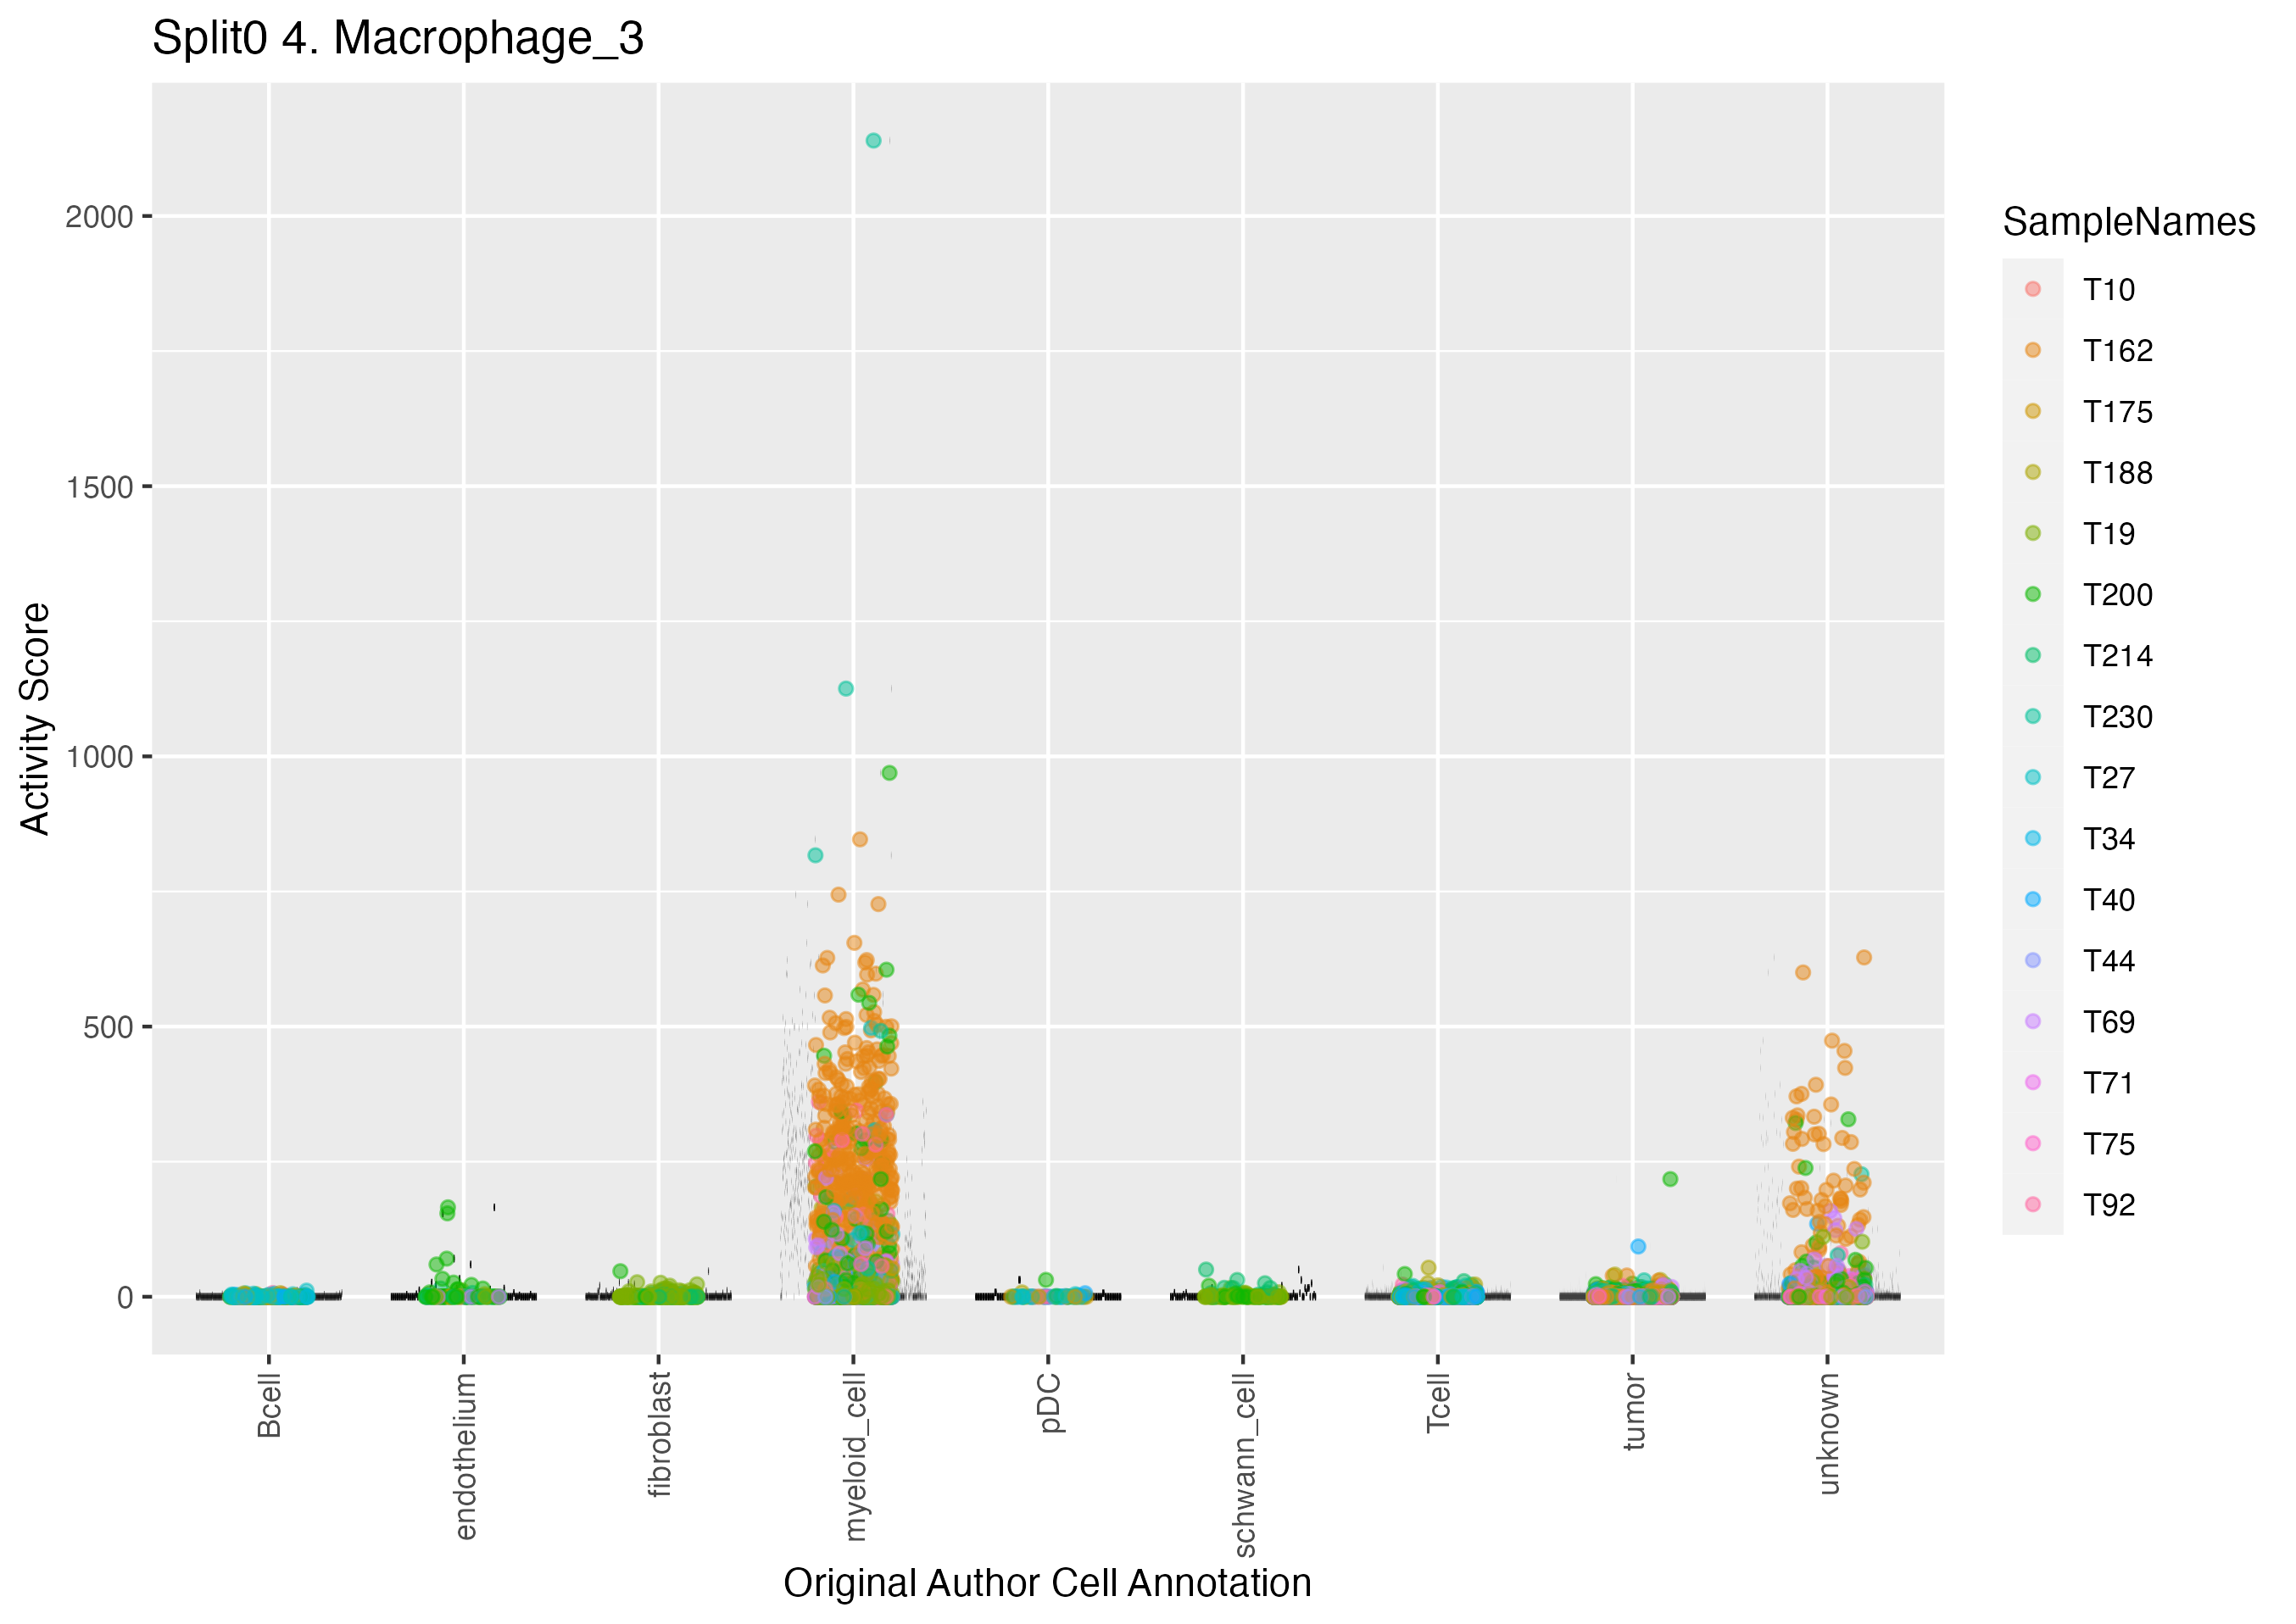
UMAP plots showing activity of gene expression program identified in GEP 4. Macrophage:
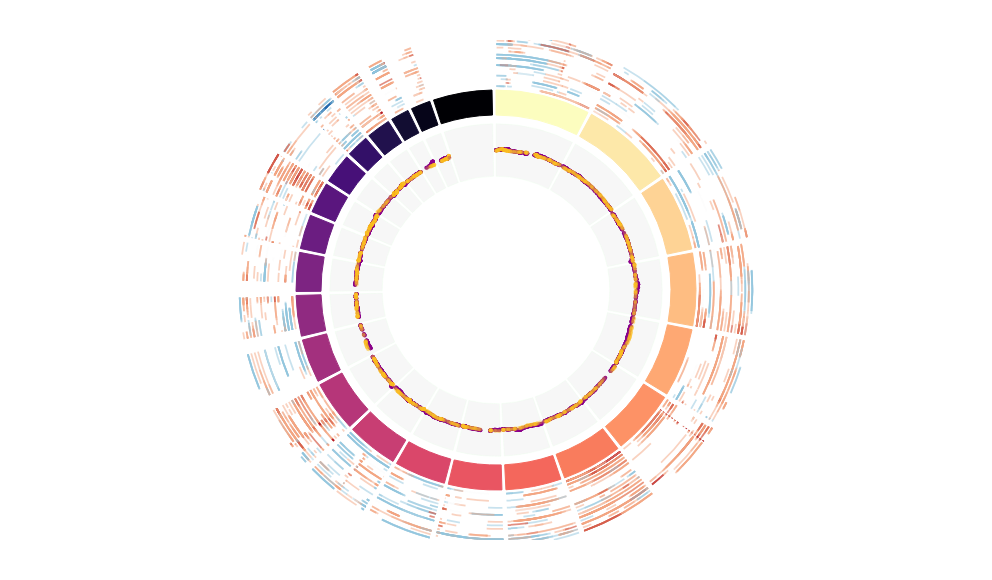
CNV Data procured from inferCNV.
Outer tracks are putative CNV regions (gains = red, losses = blue) for each patient
Inner track is expression data representing:
The top cells expressing this GEP (purple)
Random cells (n =50) from the reference set used in inferCNV (orange)
Gene set Enrichments for this program, caculated from top 50 genes
mSigDB Cell Types Gene Set:
| P-value | OR | Lower 95% CI | FDR | FWER | Genes Found | Gene Set Size | |
|---|---|---|---|---|---|---|---|
| TRAVAGLINI_LUNG_TREM2_DENDRITIC_CELL | 8.57e-59 | 274.72 | 99.44 | 5.75e-56 | 5.75e-56 | 46GPNMB, CSTB, CAPG, CTSD, APOC1, CD68, ACP5, CYP27A1, CTSZ, CTSB, PLA2G7, LGALS3, SPP1, MMP9, FUCA1, NUPR1, PSAP, NPL, ATOX1, APOE, S100A11, LIPA, CTSL, GM2A, IL4I1, IL18, NPC2, GRN, FTH1, FABP5, FCER1G, CD63, CTSH, PRDX1, LGALS1, CTSA, GLUL, ITGB2, CREG1, BLVRB, TYROBP, ASAH1, CTSS, BRI3, VAMP8, CD84 |
572 |
| TRAVAGLINI_LUNG_MACROPHAGE_CELL | 1.16e-30 | 65.09 | 35.08 | 1.95e-28 | 7.81e-28 | 24GPNMB, CSTB, CAPG, CTSD, APOC1, ACP5, CTSB, LGALS3, NUPR1, PSAP, APOE, S100A11, CTSL, NPC2, GRN, FTH1, FABP5, FCER1G, CTSH, LGALS1, GLUL, TYROBP, ASAH1, CTSS |
201 |
| FAN_EMBRYONIC_CTX_MICROGLIA_3 | 1.20e-08 | 92.39 | 25.13 | 3.51e-07 | 8.07e-06 | 5CTSD, CD68, CTSB, CREG1, ASAH1 |
20 |
| TRAVAGLINI_LUNG_PROLIFERATING_MACROPHAGE_CELL | 1.87e-35 | 47.81 | 23.93 | 6.27e-33 | 1.25e-32 | 39GPNMB, CSTB, CAPG, CTSD, APOC1, CD68, ACP5, CYP27A1, CTSZ, CTSB, LGALS3, FUCA1, NUPR1, PSAP, PLIN2, ATOX1, APOE, S100A11, LIPA, CTSL, IL18, NPC2, GRN, FTH1, FABP5, FCER1G, CD63, CTSH, PRDX1, LGALS1, CTSA, GLUL, CREG1, BLVRB, TYROBP, ASAH1, CTSS, BRI3, VAMP8 |
968 |
| FAN_OVARY_CL13_MONOCYTE_MACROPHAGE | 2.43e-31 | 43.84 | 23.87 | 5.43e-29 | 1.63e-28 | 30CSTB, CAPG, CTSD, CD68, CTSZ, CTSB, LGALS3, MMP9, PSAP, PLIN2, ATOX1, S100A11, CTSL, IL4I1, NPC2, GRN, FTH1, FABP5, FCER1G, CD63, CTSH, PRDX1, LGALS1, ITGB2, BLVRB, TYROBP, ASAH1, CTSS, BRI3, VAMP8 |
458 |
| ZHONG_PFC_MAJOR_TYPES_MICROGLIA | 1.16e-28 | 38.82 | 21.22 | 1.56e-26 | 7.78e-26 | 28CTSD, APOC1, CD68, CTSB, PLA2G7, SPP1, PSAP, NPL, APOE, S100A11, LIPA, CTSL, GM2A, NPC2, GRN, FCER1G, CD63, CTSA, GLUL, ITGB2, CREG1, BLVRB, TYROBP, ASAH1, CTSS, BRI3, VAMP8, CD84 |
438 |
| AIZARANI_LIVER_C6_KUPFFER_CELLS_2 | 1.36e-22 | 40.06 | 21.18 | 1.02e-20 | 9.12e-20 | 20GPNMB, CTSD, CTSB, PSAP, S100A11, LIPA, IL18, NPC2, GRN, FTH1, FCER1G, GLUL, ITGB2, CREG1, BLVRB, TYROBP, ASAH1, CTSS, VAMP8, CD84 |
228 |
| FAN_EMBRYONIC_CTX_BIG_GROUPS_MICROGLIA | 2.90e-24 | 33.27 | 18.08 | 3.25e-22 | 1.95e-21 | 24CTSD, APOC1, CD68, CTSB, SPP1, PSAP, NPL, APOE, S100A11, LIPA, CTSL, GM2A, NPC2, GRN, FCER1G, CTSH, GLUL, ITGB2, CREG1, TYROBP, ASAH1, CTSS, VAMP8, CD84 |
371 |
| AIZARANI_LIVER_C2_KUPFFER_CELLS_1 | 2.27e-17 | 31.95 | 16.17 | 1.52e-15 | 1.52e-14 | 16CTSB, PSAP, S100A11, LIPA, IL18, NPC2, GRN, FTH1, FABP5, FCER1G, CTSH, LGALS1, ITGB2, TYROBP, CTSS, CD84 |
200 |
| DURANTE_ADULT_OLFACTORY_NEUROEPITHELIUM_MACROPHAGES | 2.36e-11 | 38.04 | 15.67 | 1.05e-09 | 1.58e-08 | 9APOC1, CD68, APOE, NPC2, GRN, FCER1G, ITGB2, TYROBP, CTSS |
81 |
| MANNO_MIDBRAIN_NEUROTYPES_HMGL | 1.37e-22 | 24.60 | 13.48 | 1.02e-20 | 9.16e-20 | 26GPNMB, CAPG, CTSD, APOC1, CD68, CTSB, SPP1, NPL, APOE, LIPA, CTSL, GM2A, IL18, NPC2, GRN, FCER1G, CTSH, ITGB2, CREG1, BLVRB, TYROBP, ASAH1, CTSS, BRI3, VAMP8, CD84 |
577 |
| MURARO_PANCREAS_DUCTAL_CELL | 1.01e-22 | 19.56 | 10.55 | 9.68e-21 | 6.77e-20 | 33GPNMB, CSTB, CAPG, CTSD, CD68, ACP5, CTSB, PLA2G7, LGALS3, SPP1, FUCA1, PSAP, S100A11, LIPA, CTSL, GM2A, IL18, NPC2, GRN, FTH1, FCER1G, CD63, CTSH, PRDX1, GLUL, ITGB2, CREG1, TYROBP, ASAH1, CTSS, BRI3, VAMP8, CD84 |
1276 |
| HU_FETAL_RETINA_MICROGLIA | 1.50e-15 | 19.33 | 10.11 | 8.40e-14 | 1.01e-12 | 18CTSD, CTSB, SPP1, PSAP, NPL, S100A11, LIPA, GM2A, NPC2, GRN, FCER1G, GLUL, ITGB2, CREG1, TYROBP, CTSS, VAMP8, CD84 |
382 |
| GAO_LARGE_INTESTINE_24W_C11_PANETH_LIKE_CELL | 4.27e-14 | 19.04 | 9.71 | 2.20e-12 | 2.86e-11 | 16CD68, ACP5, CTSZ, PLA2G7, MMP9, PLIN2, NPL, LIPA, CTSL, GM2A, IL4I1, FCER1G, ITGB2, CREG1, TYROBP, CD84 |
325 |
| RUBENSTEIN_SKELETAL_MUSCLE_MYELOID_CELLS | 1.15e-13 | 17.78 | 9.07 | 5.51e-12 | 7.71e-11 | 16CSTB, CD68, CTSZ, CTSB, PSAP, S100A11, NPC2, FTH1, FCER1G, CTSH, ITGB2, CREG1, TYROBP, ASAH1, CTSS, VAMP8 |
347 |
| DESCARTES_FETAL_CEREBELLUM_MICROGLIA | 2.28e-16 | 15.85 | 8.59 | 1.39e-14 | 1.53e-13 | 22GPNMB, CAPG, APOC1, CD68, CTSZ, CTSB, PLA2G7, LGALS3, SPP1, NPL, APOE, CTSL, GM2A, IL4I1, IL18, FCER1G, ITGB2, CREG1, BLVRB, TYROBP, CTSS, CD84 |
642 |
| DESCARTES_FETAL_THYMUS_ANTIGEN_PRESENTING_CELLS | 1.01e-09 | 19.28 | 8.45 | 3.57e-08 | 6.79e-07 | 10CD68, MMP9, FUCA1, IL4I1, IL18, FCER1G, CTSH, TYROBP, CTSS, CD84 |
172 |
| CUI_DEVELOPING_HEART_C8_MACROPHAGE | 2.67e-11 | 16.77 | 8.08 | 1.12e-09 | 1.79e-08 | 13CTSD, CD68, CTSB, PSAP, NPC2, GRN, FCER1G, GLUL, ITGB2, CREG1, TYROBP, CTSS, VAMP8 |
275 |
| TRAVAGLINI_LUNG_NONCLASSICAL_MONOCYTE_CELL | 1.57e-09 | 18.38 | 8.06 | 5.26e-08 | 1.05e-06 | 10PSAP, NPL, S100A11, NPC2, FTH1, FCER1G, TYROBP, ASAH1, CTSS, BRI3 |
180 |
| AIZARANI_LIVER_C25_KUPFFER_CELLS_4 | 2.11e-08 | 16.62 | 6.99 | 5.89e-07 | 1.41e-05 | 9PSAP, S100A11, NPC2, GRN, FTH1, FCER1G, ITGB2, TYROBP, CTSS |
174 |
Dowload full table
mSigDB Hallmark Gene Sets:
| P-value | OR | Lower 95% CI | FDR | FWER | Genes Found | Gene Set Size | |
|---|---|---|---|---|---|---|---|
| HALLMARK_COMPLEMENT | 1.15e-11 | 20.99 | 9.83 | 5.75e-10 | 5.75e-10 | 12CTSD, APOC1, CTSB, PLA2G7, LGALS3, ATOX1, LIPA, CTSL, FCER1G, CTSH, CTSS, MMP12 |
200 |
| HALLMARK_KRAS_SIGNALING_UP | 1.19e-05 | 10.54 | 3.95 | 2.97e-04 | 5.94e-04 | 7GPNMB, SPP1, MMP9, FUCA1, FCER1G, ITGB2, CTSS |
200 |
| HALLMARK_CHOLESTEROL_HOMEOSTASIS | 3.11e-03 | 11.23 | 2.19 | 2.59e-02 | 1.56e-01 | 3LGALS3, S100A11, FABP5 |
74 |
| HALLMARK_P53_PATHWAY | 1.08e-03 | 7.12 | 2.18 | 1.35e-02 | 5.40e-02 | 5CTSD, FUCA1, NUPR1, GM2A, VAMP8 |
200 |
| HALLMARK_ALLOGRAFT_REJECTION | 1.08e-03 | 7.12 | 2.18 | 1.35e-02 | 5.40e-02 | 5CAPG, MMP9, IL18, ITGB2, CTSS |
200 |
| HALLMARK_COAGULATION | 2.09e-03 | 8.11 | 2.09 | 2.09e-02 | 1.05e-01 | 4APOC1, CTSB, MMP9, CTSH |
138 |
| HALLMARK_IL2_STAT5_SIGNALING | 7.58e-03 | 5.57 | 1.44 | 4.82e-02 | 3.79e-01 | 4CAPG, CTSZ, SPP1, PLIN2 |
199 |
| HALLMARK_EPITHELIAL_MESENCHYMAL_TRANSITION | 7.71e-03 | 5.55 | 1.44 | 4.82e-02 | 3.85e-01 | 4CAPG, SPP1, FUCA1, LGALS1 |
200 |
| HALLMARK_REACTIVE_OXYGEN_SPECIES_PATHWAY | 1.61e-02 | 11.07 | 1.27 | 8.96e-02 | 8.06e-01 | 2ATOX1, PRDX1 |
49 |
| HALLMARK_FATTY_ACID_METABOLISM | 2.41e-02 | 5.15 | 1.01 | 1.21e-01 | 1.00e+00 | 3IL4I1, LGALS1, GLUL |
158 |
| HALLMARK_MTORC1_SIGNALING | 4.35e-02 | 4.05 | 0.80 | 1.67e-01 | 1.00e+00 | 3NUPR1, PRDX1, ITGB2 |
200 |
| HALLMARK_XENOBIOTIC_METABOLISM | 4.35e-02 | 4.05 | 0.80 | 1.67e-01 | 1.00e+00 | 3CYP27A1, APOE, BLVRB |
200 |
| HALLMARK_HEME_METABOLISM | 4.35e-02 | 4.05 | 0.80 | 1.67e-01 | 1.00e+00 | 3ACP5, CTSB, BLVRB |
200 |
| HALLMARK_APOPTOSIS | 1.32e-01 | 3.28 | 0.38 | 4.46e-01 | 1.00e+00 | 2LGALS3, IL18 |
161 |
| HALLMARK_ADIPOGENESIS | 1.85e-01 | 2.63 | 0.31 | 5.44e-01 | 1.00e+00 | 2PLIN2, APOE |
200 |
| HALLMARK_ESTROGEN_RESPONSE_LATE | 1.85e-01 | 2.63 | 0.31 | 5.44e-01 | 1.00e+00 | 2FABP5, BLVRB |
200 |
| HALLMARK_ANGIOGENESIS | 1.34e-01 | 7.29 | 0.18 | 4.46e-01 | 1.00e+00 | 1SPP1 |
36 |
| HALLMARK_PROTEIN_SECRETION | 3.17e-01 | 2.68 | 0.07 | 8.82e-01 | 1.00e+00 | 1CD63 |
96 |
| HALLMARK_PEROXISOME | 3.39e-01 | 2.48 | 0.06 | 8.91e-01 | 1.00e+00 | 1PRDX1 |
104 |
| HALLMARK_BILE_ACID_METABOLISM | 3.59e-01 | 2.30 | 0.06 | 8.98e-01 | 1.00e+00 | 1CYP27A1 |
112 |
Dowload full table
KEGG Pathways:
| P-value | OR | Lower 95% CI | FDR | FWER | Genes Found | Gene Set Size | |
|---|---|---|---|---|---|---|---|
| KEGG_LYSOSOME | 6.46e-21 | 55.87 | 27.93 | 1.20e-18 | 1.20e-18 | 16CTSD, CD68, ACP5, CTSZ, CTSB, FUCA1, PSAP, LIPA, CTSL, GM2A, NPC2, CD63, CTSH, CTSA, ASAH1, CTSS |
121 |
| KEGG_ALANINE_ASPARTATE_AND_GLUTAMATE_METABOLISM | 7.12e-03 | 17.34 | 1.95 | 4.41e-01 | 1.00e+00 | 2IL4I1, GLUL |
32 |
| KEGG_ANTIGEN_PROCESSING_AND_PRESENTATION | 5.05e-03 | 9.38 | 1.83 | 4.41e-01 | 9.39e-01 | 3CTSB, CTSL, CTSS |
88 |
| KEGG_PORPHYRIN_AND_CHLOROPHYLL_METABOLISM | 1.15e-02 | 13.35 | 1.52 | 5.34e-01 | 1.00e+00 | 2FTH1, BLVRB |
41 |
| KEGG_NATURAL_KILLER_CELL_MEDIATED_CYTOTOXICITY | 1.67e-02 | 5.95 | 1.17 | 6.21e-01 | 1.00e+00 | 3FCER1G, ITGB2, TYROBP |
137 |
| KEGG_PPAR_SIGNALING_PATHWAY | 3.05e-02 | 7.77 | 0.90 | 9.45e-01 | 1.00e+00 | 2CYP27A1, FABP5 |
69 |
| KEGG_LEUKOCYTE_TRANSENDOTHELIAL_MIGRATION | 7.67e-02 | 4.57 | 0.53 | 1.00e+00 | 1.00e+00 | 2MMP9, ITGB2 |
116 |
| KEGG_OTHER_GLYCAN_DEGRADATION | 6.18e-02 | 16.98 | 0.40 | 1.00e+00 | 1.00e+00 | 1FUCA1 |
16 |
| KEGG_RIBOFLAVIN_METABOLISM | 6.18e-02 | 16.98 | 0.40 | 1.00e+00 | 1.00e+00 | 1ACP5 |
16 |
| KEGG_PRIMARY_BILE_ACID_BIOSYNTHESIS | 6.18e-02 | 16.98 | 0.40 | 1.00e+00 | 1.00e+00 | 1CYP27A1 |
16 |
| KEGG_RENIN_ANGIOTENSIN_SYSTEM | 6.56e-02 | 15.93 | 0.37 | 1.00e+00 | 1.00e+00 | 1CTSA |
17 |
| KEGG_STEROID_BIOSYNTHESIS | 6.56e-02 | 15.93 | 0.37 | 1.00e+00 | 1.00e+00 | 1LIPA |
17 |
| KEGG_PHENYLALANINE_METABOLISM | 6.93e-02 | 14.99 | 0.35 | 1.00e+00 | 1.00e+00 | 1IL4I1 |
18 |
| KEGG_NITROGEN_METABOLISM | 8.77e-02 | 11.59 | 0.28 | 1.00e+00 | 1.00e+00 | 1GLUL |
23 |
| KEGG_ASTHMA | 1.13e-01 | 8.79 | 0.21 | 1.00e+00 | 1.00e+00 | 1FCER1G |
30 |
| KEGG_ETHER_LIPID_METABOLISM | 1.23e-01 | 7.97 | 0.19 | 1.00e+00 | 1.00e+00 | 1PLA2G7 |
33 |
| KEGG_CYSTEINE_AND_METHIONINE_METABOLISM | 1.27e-01 | 7.73 | 0.19 | 1.00e+00 | 1.00e+00 | 1IL4I1 |
34 |
| KEGG_SNARE_INTERACTIONS_IN_VESICULAR_TRANSPORT | 1.41e-01 | 6.89 | 0.17 | 1.00e+00 | 1.00e+00 | 1VAMP8 |
38 |
| KEGG_SPHINGOLIPID_METABOLISM | 1.44e-01 | 6.71 | 0.16 | 1.00e+00 | 1.00e+00 | 1ASAH1 |
39 |
| KEGG_TRYPTOPHAN_METABOLISM | 1.47e-01 | 6.54 | 0.16 | 1.00e+00 | 1.00e+00 | 1IL4I1 |
40 |
Dowload full table
CHR Positional Gene Sets:
| P-value | OR | Lower 95% CI | FDR | FWER | Genes Found | Gene Set Size | |
|---|---|---|---|---|---|---|---|
| chr5q33 | 6.89e-02 | 4.87 | 0.57 | 1.00e+00 | 1.00e+00 | 2ATOX1, GM2A |
109 |
| chr20q13 | 2.00e-01 | 2.01 | 0.40 | 1.00e+00 | 1.00e+00 | 3CTSZ, MMP9, CTSA |
400 |
| chr1q25 | 1.31e-01 | 3.30 | 0.38 | 1.00e+00 | 1.00e+00 | 2NPL, GLUL |
160 |
| chr19q13 | 6.12e-01 | 1.20 | 0.37 | 1.00e+00 | 1.00e+00 | 5APOC1, APOE, IL4I1, BLVRB, TYROBP |
1165 |
| chr2p11 | 1.92e-01 | 2.57 | 0.30 | 1.00e+00 | 1.00e+00 | 2CAPG, VAMP8 |
205 |
| chr1q23 | 2.09e-01 | 2.42 | 0.28 | 1.00e+00 | 1.00e+00 | 2FCER1G, CD84 |
217 |
| chr21q22 | 3.99e-01 | 1.48 | 0.17 | 1.00e+00 | 1.00e+00 | 2CSTB, ITGB2 |
353 |
| chr1q21 | 6.64e-01 | 1.34 | 0.16 | 1.00e+00 | 1.00e+00 | 2S100A11, CTSS |
392 |
| chr8p22 | 1.64e-01 | 5.80 | 0.14 | 1.00e+00 | 1.00e+00 | 1ASAH1 |
45 |
| chr4q22 | 2.43e-01 | 3.70 | 0.09 | 1.00e+00 | 1.00e+00 | 1SPP1 |
70 |
| chr14q22 | 3.01e-01 | 2.87 | 0.07 | 1.00e+00 | 1.00e+00 | 1LGALS3 |
90 |
| chr7p15 | 3.17e-01 | 2.68 | 0.07 | 1.00e+00 | 1.00e+00 | 1GPNMB |
96 |
| chr11q22 | 3.23e-01 | 2.63 | 0.06 | 1.00e+00 | 1.00e+00 | 1MMP12 |
98 |
| chr1q24 | 3.87e-01 | 2.09 | 0.05 | 1.00e+00 | 1.00e+00 | 1CREG1 |
123 |
| chr2q35 | 3.94e-01 | 2.04 | 0.05 | 1.00e+00 | 1.00e+00 | 1CYP27A1 |
126 |
| chr1p35 | 4.03e-01 | 1.98 | 0.05 | 1.00e+00 | 1.00e+00 | 1RAB42 |
130 |
| chr15q25 | 4.53e-01 | 1.69 | 0.04 | 1.00e+00 | 1.00e+00 | 1CTSH |
152 |
| chr16p12 | 4.78e-01 | 1.56 | 0.04 | 1.00e+00 | 1.00e+00 | 1OTOA |
164 |
| chr7q21 | 4.78e-01 | 1.56 | 0.04 | 1.00e+00 | 1.00e+00 | 1BRI3 |
164 |
| chr8q21 | 5.06e-01 | 1.44 | 0.04 | 1.00e+00 | 1.00e+00 | 1FABP5 |
178 |
Dowload full table
Transcription Factor Targets:
| P-value | OR | Lower 95% CI | FDR | FWER | Genes Found | Gene Set Size | |
|---|---|---|---|---|---|---|---|
| TCANNTGAY_SREBP1_01 | 2.21e-03 | 4.31 | 1.63 | 1.00e+00 | 1.00e+00 | 7GPNMB, CTSD, CYP27A1, PSAP, GRN, CTSA, CTSS |
479 |
| CBFA2T2_TARGET_GENES | 1.59e-03 | 2.90 | 1.44 | 1.00e+00 | 1.00e+00 | 14GPNMB, CSTB, CTSD, APOC1, ACP5, CTSB, PLIN2, NPL, ATOX1, CTSL, GRN, CD63, CTSH, CTSA |
1694 |
| ZNF354B_TARGET_GENES | 8.25e-03 | 5.43 | 1.41 | 1.00e+00 | 1.00e+00 | 4CSTB, CTSD, GRN, CTSA |
204 |
| ZNF490_TARGET_GENES | 1.11e-02 | 4.03 | 1.24 | 1.00e+00 | 1.00e+00 | 5CTSB, S100A11, GRN, LGALS1, VAMP8 |
350 |
| NFAT_Q6 | 1.60e-02 | 4.44 | 1.15 | 1.00e+00 | 1.00e+00 | 4CAPG, LGALS1, VAMP8, CD84 |
249 |
| PEA3_Q6 | 1.91e-02 | 4.20 | 1.09 | 1.00e+00 | 1.00e+00 | 4FUCA1, IL18, CTSS, CD84 |
263 |
| TFEB_TARGET_GENES | 2.88e-02 | 2.27 | 1.01 | 1.00e+00 | 1.00e+00 | 10CTSD, CD68, ACP5, CTSB, PLIN2, IL4I1, GRN, CD63, CTSA, BRI3 |
1387 |
| RYTTCCTG_ETS2_B | 6.16e-02 | 2.16 | 0.87 | 1.00e+00 | 1.00e+00 | 8MMP9, PSAP, FTH1, FCER1G, CTSA, TYROBP, CTSS, VAMP8 |
1112 |
| SMN1_SMN2_TARGET_GENES | 8.12e-02 | 2.22 | 0.84 | 1.00e+00 | 1.00e+00 | 7CAPG, CTSB, CD63, ITGB2, BLVRB, CTSS, CD84 |
922 |
| LXR_Q3 | 4.08e-02 | 6.59 | 0.76 | 1.00e+00 | 1.00e+00 | 2APOC1, BLVRB |
81 |
| SS18_SSX1_FUSION_UNIPROT_Q8IZH1_UNREVIEWED_TARGET_GENES | 5.22e-02 | 5.72 | 0.66 | 1.00e+00 | 1.00e+00 | 2CD63, GLUL |
93 |
| LXR_DR4_Q3 | 5.22e-02 | 5.72 | 0.66 | 1.00e+00 | 1.00e+00 | 2APOC1, BLVRB |
93 |
| ELF1_Q6 | 7.32e-02 | 3.24 | 0.64 | 1.00e+00 | 1.00e+00 | 3FCER1G, CTSA, TYROBP |
249 |
| GREB1_TARGET_GENES | 1.60e-01 | 1.82 | 0.63 | 1.00e+00 | 1.00e+00 | 6GPNMB, CTSB, S100A11, CD63, ITGB2, BLVRB |
941 |
| IRF1_Q6 | 8.29e-02 | 3.07 | 0.61 | 1.00e+00 | 1.00e+00 | 3TYROBP, CTSS, VAMP8 |
263 |
| DACH1_TARGET_GENES | 1.77e-01 | 1.74 | 0.60 | 1.00e+00 | 1.00e+00 | 6CTSD, PSAP, CD63, LGALS1, GLUL, ASAH1 |
987 |
| FOXE1_TARGET_GENES | 1.97e-01 | 1.92 | 0.59 | 1.00e+00 | 1.00e+00 | 5CSTB, IL4I1, PRDX1, CTSA, GLUL |
728 |
| ZNF768_TARGET_GENES | 3.31e-01 | 1.52 | 0.58 | 1.00e+00 | 1.00e+00 | 7APOE, GRN, OTOA, FTH1, TYROBP, ASAH1, CTSS |
1346 |
| RBM34_TARGET_GENES | 2.76e-01 | 1.65 | 0.57 | 1.00e+00 | 1.00e+00 | 6CSTB, PLIN2, ATOX1, CTSH, CTSA, BRI3 |
1038 |
| ZNF282_TARGET_GENES | 2.81e-01 | 1.62 | 0.56 | 1.00e+00 | 1.00e+00 | 6APOC1, CD68, ACP5, CTSZ, PRDX1, CTSA |
1058 |
Dowload full table
GO Biological Processes:
| P-value | OR | Lower 95% CI | FDR | FWER | Genes Found | Gene Set Size | |
|---|---|---|---|---|---|---|---|
| GOBP_CELLULAR_RESPONSE_TO_THYROID_HORMONE_STIMULUS | 3.90e-07 | 90.00 | 20.43 | 2.65e-04 | 2.92e-03 | 4CTSB, CTSL, CTSH, CTSS |
16 |
| GOBP_MYELOID_LEUKOCYTE_MEDIATED_IMMUNITY | 1.57e-24 | 28.09 | 15.39 | 1.06e-20 | 1.17e-20 | 27CSTB, CTSD, CD68, CTSZ, CTSB, LGALS3, MMP9, FUCA1, PSAP, S100A11, GM2A, NPC2, GRN, FTH1, FABP5, FCER1G, CD63, CTSH, CTSA, ITGB2, CREG1, TYROBP, ASAH1, CTSS, BRI3, VAMP8, CD84 |
550 |
| GOBP_ELASTIN_CATABOLIC_PROCESS | 1.54e-04 | 172.68 | 14.09 | 4.12e-02 | 1.00e+00 | 2CTSL, MMP12 |
5 |
| GOBP_MYELOID_LEUKOCYTE_ACTIVATION | 6.32e-24 | 25.25 | 13.84 | 1.58e-20 | 4.73e-20 | 28CSTB, CTSD, CD68, CTSZ, CTSB, LGALS3, MMP9, FUCA1, PSAP, S100A11, GM2A, IL18, NPC2, GRN, FTH1, FABP5, FCER1G, CD63, CTSH, CTSA, ITGB2, CREG1, TYROBP, ASAH1, CTSS, BRI3, VAMP8, CD84 |
659 |
| GOBP_COLLAGEN_CATABOLIC_PROCESS | 2.72e-08 | 41.49 | 13.69 | 2.26e-05 | 2.04e-04 | 6CTSD, CTSB, MMP9, CTSL, CTSS, MMP12 |
47 |
| GOBP_CELL_ACTIVATION_INVOLVED_IN_IMMUNE_RESPONSE | 2.84e-24 | 24.95 | 13.67 | 1.06e-20 | 2.13e-20 | 29CSTB, CTSD, CD68, CTSZ, CTSB, LGALS3, MMP9, FUCA1, PSAP, S100A11, GM2A, IL18, NPC2, GRN, FTH1, FABP5, FCER1G, CD63, CTSH, LGALS1, CTSA, ITGB2, CREG1, TYROBP, ASAH1, CTSS, BRI3, VAMP8, CD84 |
722 |
| GOBP_RESPONSE_TO_THYROID_HORMONE | 1.85e-06 | 57.04 | 13.59 | 1.07e-03 | 1.39e-02 | 4CTSB, CTSL, CTSH, CTSS |
23 |
| GOBP_LIPID_TRANSPORT_ACROSS_BLOOD_BRAIN_BARRIER | 2.31e-04 | 129.66 | 11.45 | 5.57e-02 | 1.00e+00 | 2APOE, FABP5 |
6 |
| GOBP_LEUKOCYTE_MEDIATED_IMMUNITY | 8.70e-21 | 18.86 | 10.35 | 1.30e-17 | 6.51e-17 | 28CSTB, CTSD, CD68, CTSZ, CTSB, LGALS3, MMP9, FUCA1, PSAP, S100A11, GM2A, IL18, NPC2, GRN, FTH1, FABP5, FCER1G, CD63, CTSH, CTSA, ITGB2, CREG1, TYROBP, ASAH1, CTSS, BRI3, VAMP8, CD84 |
873 |
| GOBP_GLYCOLIPID_TRANSPORT | 3.22e-04 | 103.49 | 9.64 | 6.15e-02 | 1.00e+00 | 2PSAP, NPC2 |
7 |
| GOBP_EXOCYTOSIS | 2.58e-19 | 17.01 | 9.35 | 3.22e-16 | 1.93e-15 | 27CSTB, CTSD, CD68, CTSZ, CTSB, LGALS3, MMP9, FUCA1, PSAP, S100A11, GM2A, NPC2, GRN, FTH1, FABP5, FCER1G, CD63, CTSH, CTSA, ITGB2, CREG1, TYROBP, ASAH1, CTSS, BRI3, VAMP8, CD84 |
891 |
| GOBP_CELL_ACTIVATION | 4.81e-21 | 17.03 | 9.19 | 8.99e-18 | 3.60e-17 | 33GPNMB, CSTB, CTSD, CD68, CTSZ, CTSB, LGALS3, MMP9, FUCA1, PSAP, APOE, S100A11, CTSL, GM2A, IL18, NPC2, GRN, FTH1, FABP5, FCER1G, CD63, CTSH, PRDX1, LGALS1, CTSA, ITGB2, CREG1, TYROBP, ASAH1, CTSS, BRI3, VAMP8, CD84 |
1461 |
| GOBP_CELLULAR_RESPONSE_TO_LIPOPROTEIN_PARTICLE_STIMULUS | 9.37e-06 | 36.12 | 8.90 | 4.67e-03 | 7.01e-02 | 4CD68, APOE, FCER1G, ITGB2 |
34 |
| GOBP_TRIGLYCERIDE_RICH_LIPOPROTEIN_PARTICLE_CLEARANCE | 4.28e-04 | 86.37 | 8.33 | 7.29e-02 | 1.00e+00 | 2APOC1, APOE |
8 |
| GOBP_IMMUNE_EFFECTOR_PROCESS | 7.47e-19 | 14.83 | 8.12 | 7.98e-16 | 5.59e-15 | 30CSTB, CTSD, CD68, CTSZ, CTSB, LGALS3, MMP9, FUCA1, PSAP, S100A11, GM2A, IL18, NPC2, GRN, FTH1, FABP5, FCER1G, CD63, CTSH, LGALS1, CTSA, ITGB2, CREG1, TYROBP, ASAH1, CTSS, MMP12, BRI3, VAMP8, CD84 |
1296 |
| GOBP_POSITIVE_REGULATION_OF_CHOLESTEROL_ESTERIFICATION | 5.49e-04 | 74.10 | 7.33 | 8.39e-02 | 1.00e+00 | 2APOC1, APOE |
9 |
| GOBP_ELASTIN_METABOLIC_PROCESS | 5.49e-04 | 74.10 | 7.33 | 8.39e-02 | 1.00e+00 | 2CTSL, MMP12 |
9 |
| GOBP_NEUROINFLAMMATORY_RESPONSE | 2.66e-05 | 27.14 | 6.78 | 1.17e-02 | 1.99e-01 | 4MMP9, NUPR1, IL18, GRN |
44 |
| GOBP_SECRETION | 2.08e-16 | 12.05 | 6.62 | 1.95e-13 | 1.56e-12 | 29CSTB, CTSD, CD68, CTSZ, CTSB, LGALS3, SPP1, MMP9, FUCA1, PSAP, APOE, S100A11, GM2A, NPC2, GRN, FTH1, FABP5, FCER1G, CD63, CTSH, CTSA, ITGB2, CREG1, TYROBP, ASAH1, CTSS, BRI3, VAMP8, CD84 |
1464 |
| GOBP_VERY_LOW_DENSITY_LIPOPROTEIN_PARTICLE_CLEARANCE | 6.85e-04 | 64.86 | 6.55 | 9.32e-02 | 1.00e+00 | 2APOC1, APOE |
10 |
Dowload full table
Immunological Gene Sets:
| P-value | OR | Lower 95% CI | FDR | FWER | Genes Found | Gene Set Size | |
|---|---|---|---|---|---|---|---|
| GSE24634_TREG_VS_TCONV_POST_DAY7_IL4_CONVERSION_DN | 1.61e-25 | 51.06 | 27.16 | 7.83e-22 | 7.83e-22 | 21CD68, ACP5, CTSZ, CTSB, PLA2G7, LGALS3, MMP9, PSAP, NPL, LIPA, CTSL, GM2A, IL18, FTH1, CD63, CTSH, CREG1, TYROBP, ASAH1, CTSS, MMP12 |
198 |
| GSE24634_TREG_VS_TCONV_POST_DAY10_IL4_CONVERSION_DN | 4.34e-22 | 42.31 | 22.14 | 1.06e-18 | 2.12e-18 | 19CAPG, APOC1, CYP27A1, CTSZ, CTSB, SPP1, FUCA1, PSAP, LIPA, CTSL, NPC2, GRN, CD63, CTSA, GLUL, ITGB2, CREG1, BLVRB, TYROBP |
200 |
| GSE24634_TEFF_VS_TCONV_DAY10_IN_CULTURE_DN | 1.78e-20 | 38.62 | 20.01 | 2.16e-17 | 8.66e-17 | 18GPNMB, CAPG, CTSZ, LGALS3, SPP1, NUPR1, PSAP, NPL, LIPA, NPC2, GRN, FCER1G, CD63, CTSH, GLUL, ITGB2, CREG1, BLVRB |
200 |
| GSE29618_MONOCYTE_VS_MDC_DAY7_FLU_VACCINE_UP | 1.78e-20 | 38.62 | 20.01 | 2.16e-17 | 8.66e-17 | 18CTSD, CD68, CYP27A1, CTSB, PLA2G7, LGALS3, FUCA1, PSAP, PLIN2, NPL, CTSL, NPC2, CD63, CTSA, GLUL, CREG1, ASAH1, CTSS |
200 |
| GSE29618_MONOCYTE_VS_MDC_UP | 2.27e-17 | 31.95 | 16.17 | 2.21e-14 | 1.10e-13 | 16CTSD, CD68, CYP27A1, CTSB, PLA2G7, PSAP, NPL, CTSL, NPC2, FCER1G, CD63, GLUL, CREG1, TYROBP, ASAH1, CTSS |
200 |
| GSE22886_NAIVE_CD8_TCELL_VS_MONOCYTE_DN | 7.03e-16 | 28.93 | 14.43 | 4.89e-13 | 3.43e-12 | 15CAPG, CTSB, LGALS3, PSAP, NPL, S100A11, NPC2, GRN, FCER1G, CTSH, GLUL, CREG1, TYROBP, ASAH1, CTSS |
200 |
| GSE7509_DC_VS_MONOCYTE_UP | 7.03e-16 | 28.93 | 14.43 | 4.89e-13 | 3.43e-12 | 15CTSD, CD68, CTSB, LGALS3, SPP1, PSAP, PLIN2, APOE, GM2A, FABP5, CD63, CTSH, LGALS1, CREG1, MMP12 |
200 |
| GSE34156_TLR1_TLR2_LIGAND_VS_NOD2_AND_TLR1_TLR2_LIGAND_24H_TREATED_MONOCYTE_UP | 1.61e-14 | 26.55 | 13.00 | 8.76e-12 | 7.83e-11 | 14CAPG, CTSD, CYP27A1, CTSZ, LGALS3, PSAP, CTSL, GM2A, GRN, GLUL, CREG1, TYROBP, ASAH1, BRI3 |
197 |
| GSE24634_TREG_VS_TCONV_POST_DAY5_IL4_CONVERSION_DN | 1.72e-14 | 26.41 | 12.93 | 8.76e-12 | 8.39e-11 | 14CD68, ACP5, CTSZ, CTSB, LGALS3, LIPA, NPC2, GRN, FCER1G, CTSA, CREG1, TYROBP, CTSS, CD84 |
198 |
| GSE22886_NAIVE_CD4_TCELL_VS_MONOCYTE_DN | 1.98e-14 | 26.13 | 12.79 | 8.76e-12 | 9.64e-11 | 14CAPG, CTSB, LGALS3, PSAP, S100A11, NPC2, GRN, FCER1G, CTSH, CTSA, GLUL, CREG1, ASAH1, CTSS |
200 |
| GSE24634_TEFF_VS_TCONV_DAY7_IN_CULTURE_DN | 1.98e-14 | 26.13 | 12.79 | 8.76e-12 | 9.64e-11 | 14ACP5, CTSB, PLA2G7, SPP1, PSAP, ATOX1, LIPA, CTSL, GM2A, NPC2, CD63, TYROBP, CTSS, CD84 |
200 |
| GSE34156_UNTREATED_VS_6H_TLR1_TLR2_LIGAND_TREATED_MONOCYTE_UP | 4.15e-13 | 23.85 | 11.44 | 1.44e-10 | 2.02e-09 | 13CYP27A1, CTSZ, LGALS3, PSAP, GM2A, NPC2, GRN, CD63, LGALS1, GLUL, CREG1, ASAH1, BRI3 |
197 |
| GSE34156_NOD2_LIGAND_VS_TLR1_TLR2_LIGAND_6H_TREATED_MONOCYTE_DN | 4.15e-13 | 23.85 | 11.44 | 1.44e-10 | 2.02e-09 | 13CAPG, CTSD, CTSZ, LGALS3, CTSL, GM2A, GRN, GLUL, CREG1, BLVRB, TYROBP, ASAH1, BRI3 |
197 |
| GSE10325_LUPUS_CD4_TCELL_VS_LUPUS_MYELOID_DN | 5.03e-13 | 23.47 | 11.26 | 1.44e-10 | 2.45e-09 | 13CTSD, CTSB, LGALS3, PSAP, NPL, GM2A, GRN, FCER1G, CTSA, CREG1, BLVRB, TYROBP, ASAH1 |
200 |
| GSE22886_NAIVE_BCELL_VS_MONOCYTE_DN | 5.03e-13 | 23.47 | 11.26 | 1.44e-10 | 2.45e-09 | 13CAPG, CTSD, CTSB, LGALS3, PSAP, NPL, S100A11, GRN, FCER1G, LGALS1, CREG1, TYROBP, ASAH1 |
200 |
| GSE24634_TREG_VS_TCONV_POST_DAY3_IL4_CONVERSION_DN | 5.03e-13 | 23.47 | 11.26 | 1.44e-10 | 2.45e-09 | 13ACP5, CTSZ, CTSB, PLA2G7, LGALS3, PSAP, NPL, ATOX1, IL18, LGALS1, ITGB2, CREG1, ASAH1 |
200 |
| GSE29618_BCELL_VS_MONOCYTE_DN | 5.03e-13 | 23.47 | 11.26 | 1.44e-10 | 2.45e-09 | 13CD68, CTSB, PSAP, NPL, S100A11, CTSL, CD63, CTSA, ITGB2, CREG1, BLVRB, CTSS, VAMP8 |
200 |
| GSE6269_FLU_VS_STAPH_AUREUS_INF_PBMC_DN | 3.45e-11 | 22.58 | 10.24 | 8.02e-09 | 1.68e-07 | 11CTSD, CTSB, LGALS3, NPL, NPC2, GRN, FTH1, CD63, GLUL, CREG1, BLVRB |
167 |
| GSE10325_LUPUS_BCELL_VS_LUPUS_MYELOID_DN | 1.15e-11 | 20.99 | 9.83 | 2.80e-09 | 5.60e-08 | 12CTSD, CTSB, LGALS3, PSAP, NPL, S100A11, FCER1G, CTSA, GLUL, CREG1, BLVRB, TYROBP |
200 |
| GSE22886_NAIVE_TCELL_VS_MONOCYTE_DN | 1.15e-11 | 20.99 | 9.83 | 2.80e-09 | 5.60e-08 | 12CAPG, CTSB, LGALS3, PSAP, NPL, S100A11, NPC2, GRN, CTSH, GLUL, CREG1, ASAH1 |
200 |
Top Ranked Transcription Factors for this Gene Expression Program:
| Gene Symbol | TF Rank | DNA Binding Domain | Motif Status | IUPAC PWM | GTEx | DepMap | Decartes |
|---|---|---|---|---|---|---|---|
| ITGB2 | 41 | No | Unlikely to be sequence specific TF | Not a DNA binding protein | No motif | None | None |
| CREG1 | 42 | No | Unlikely to be sequence specific TF | Not a DNA binding protein | No motif | None | Regulates transcription in tethering assays (PMID: 9710587). Unlikely to be a TF, based on the lack of a canonical DBD |
| HMOX1 | 52 | No | Unlikely to be sequence specific TF | Not a DNA binding protein | No motif | None | Well characterized enzyme with no additional domains. Included only because GO lists it as a regulator of TFs. No support for DNA binding activity. |
| CD36 | 55 | No | Unlikely to be sequence specific TF | Not a DNA binding protein | No motif | None | None |
| NR1H3 | 59 | Yes | Inferred motif | Obligate heteromer | In vivo/Misc source | None | Binds as an obligate heterodimer with RXR-proteins. (PDB: 2ACL) is a crystal structure of the two proteins without DNA |
| SPI1 | 61 | Yes | Known motif | Monomer or homomultimer | High-throughput in vitro | None | None |
| CEBPA | 63 | Yes | Known motif | Monomer or homomultimer | 100 perc ID - in vitro | None | None |
| MITF | 81 | Yes | Known motif | Monomer or homomultimer | 100 perc ID - in vitro | None | Binds DNA both as homo- and heterodimers (PMID: 23207919). The structure 4ATI is a homodimer with DNA GTTAGCACATGACCCT. |
| LGALS9 | 85 | No | Unlikely to be sequence specific TF | Not a DNA binding protein | No motif | None | None |
| PLEK | 126 | No | Unlikely to be sequence specific TF | Not a DNA binding protein | No motif | None | The DEP-domain is a winged helix-turn-helix protein domain, and thus it is related to ETS, RFX, and FOX domains. However, there is no evidence for DNA-binding activity and it has been shown to operate in G-protein signalling upstream of TFs |
| SGK1 | 128 | No | Unlikely to be sequence specific TF | Not a DNA binding protein | No motif | None | None |
| ANXA4 | 136 | No | Unlikely to be sequence specific TF | Not a DNA binding protein | No motif | None | None |
| ATF5 | 166 | Yes | Known motif | Obligate heteromer | In vivo/Misc source | Only known motifs are from Transfac or HocoMoco - origin is uncertain | Transfac motifs dont correspond to canonical bZIP binding sites. Annotated as obligate heteromer based on peptide array studies (PMID:12805554). |
| HAVCR2 | 191 | No | Unlikely to be sequence specific TF | Not a DNA binding protein | No motif | None | None |
| ENO1 | 220 | No | Unlikely to be sequence specific TF | Not a DNA binding protein | No motif | Only known motifs are from Transfac or HocoMoco - origin is uncertain | Enolase - DNA binding not shown to be direct |
| SYK | 228 | No | Unlikely to be sequence specific TF | Not a DNA binding protein | No motif | None | Known co-factor |
| HCK | 233 | No | Unlikely to be sequence specific TF | Not a DNA binding protein | No motif | None | Inhibits TP73-mediated transcription activation (PMID: 17535448) |
| PYCARD | 243 | No | Unlikely to be sequence specific TF | Not a DNA binding protein | No motif | None | None |
| CMKLR1 | 258 | No | Unlikely to be sequence specific TF | Not a DNA binding protein | No motif | None | Protein is a G protein-coupled receptor for the chemoattractant adipokine chemerin |
| TLR4 | 290 | No | Unlikely to be sequence specific TF | Not a DNA binding protein | No motif | None | None |
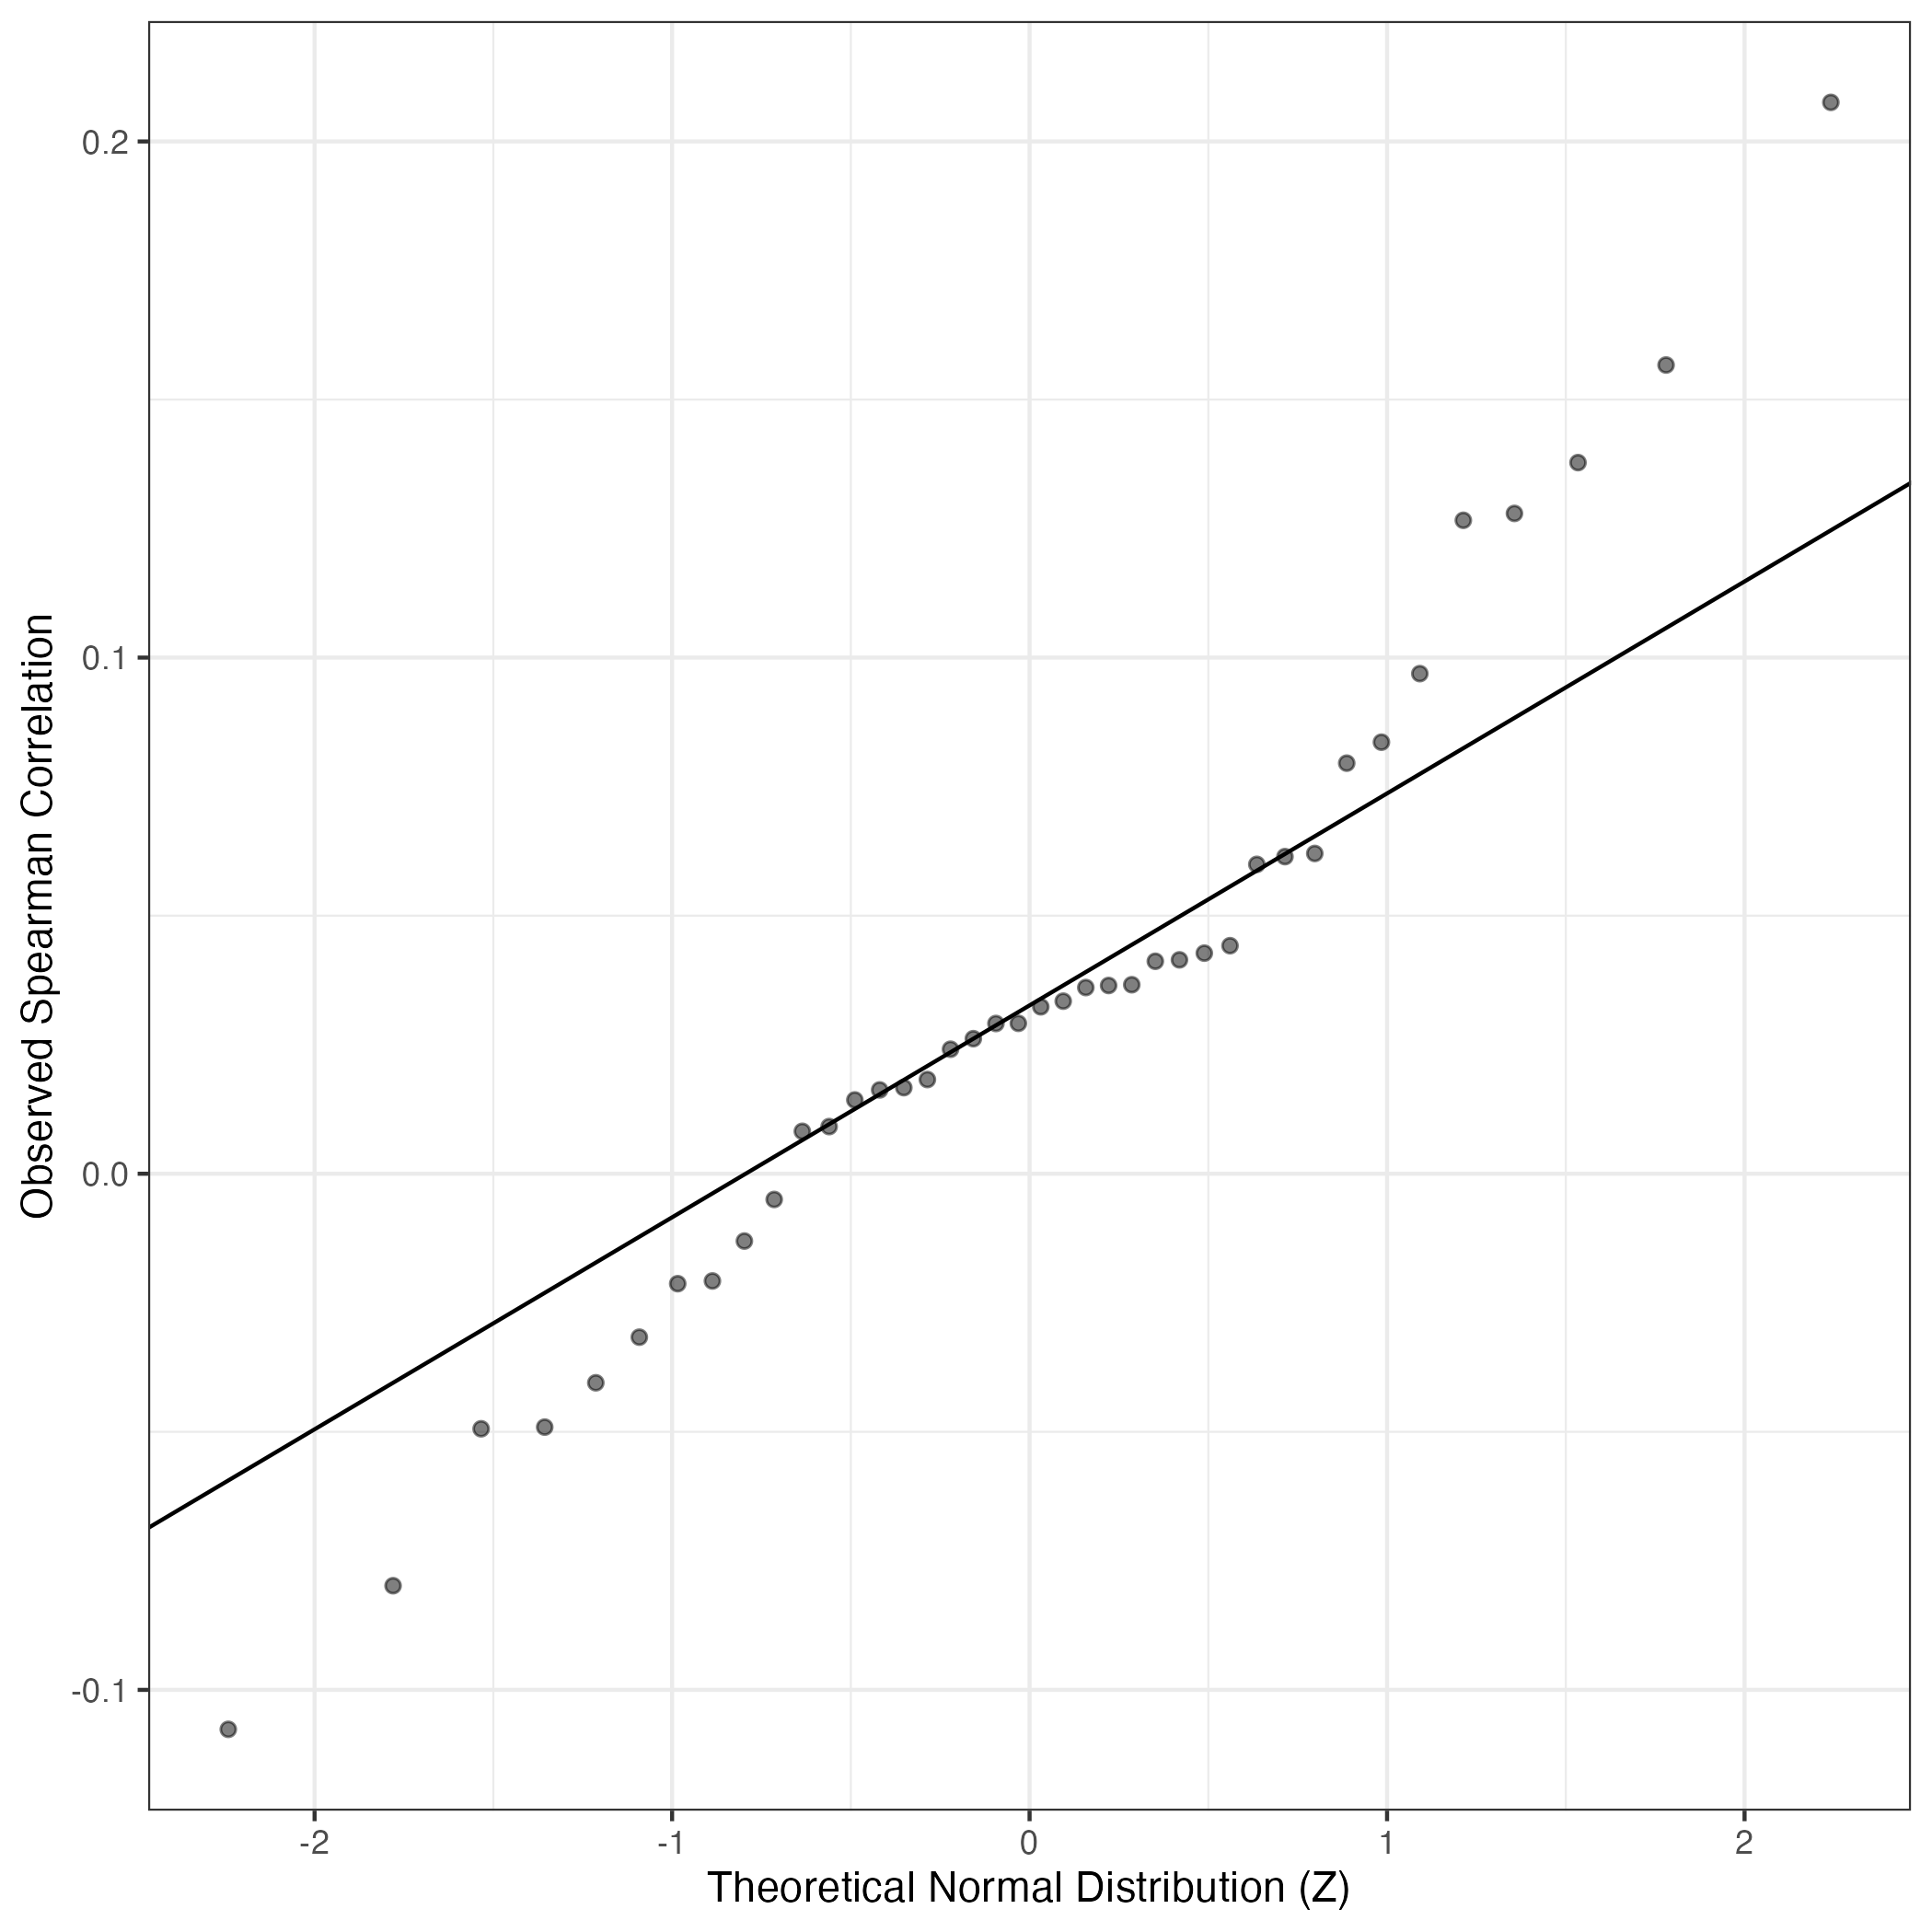
QQ Plot showing correlations with other GEPs in this dataset, calculated by Spearman correlation:
Interactive QQ-plot of gene loadings:
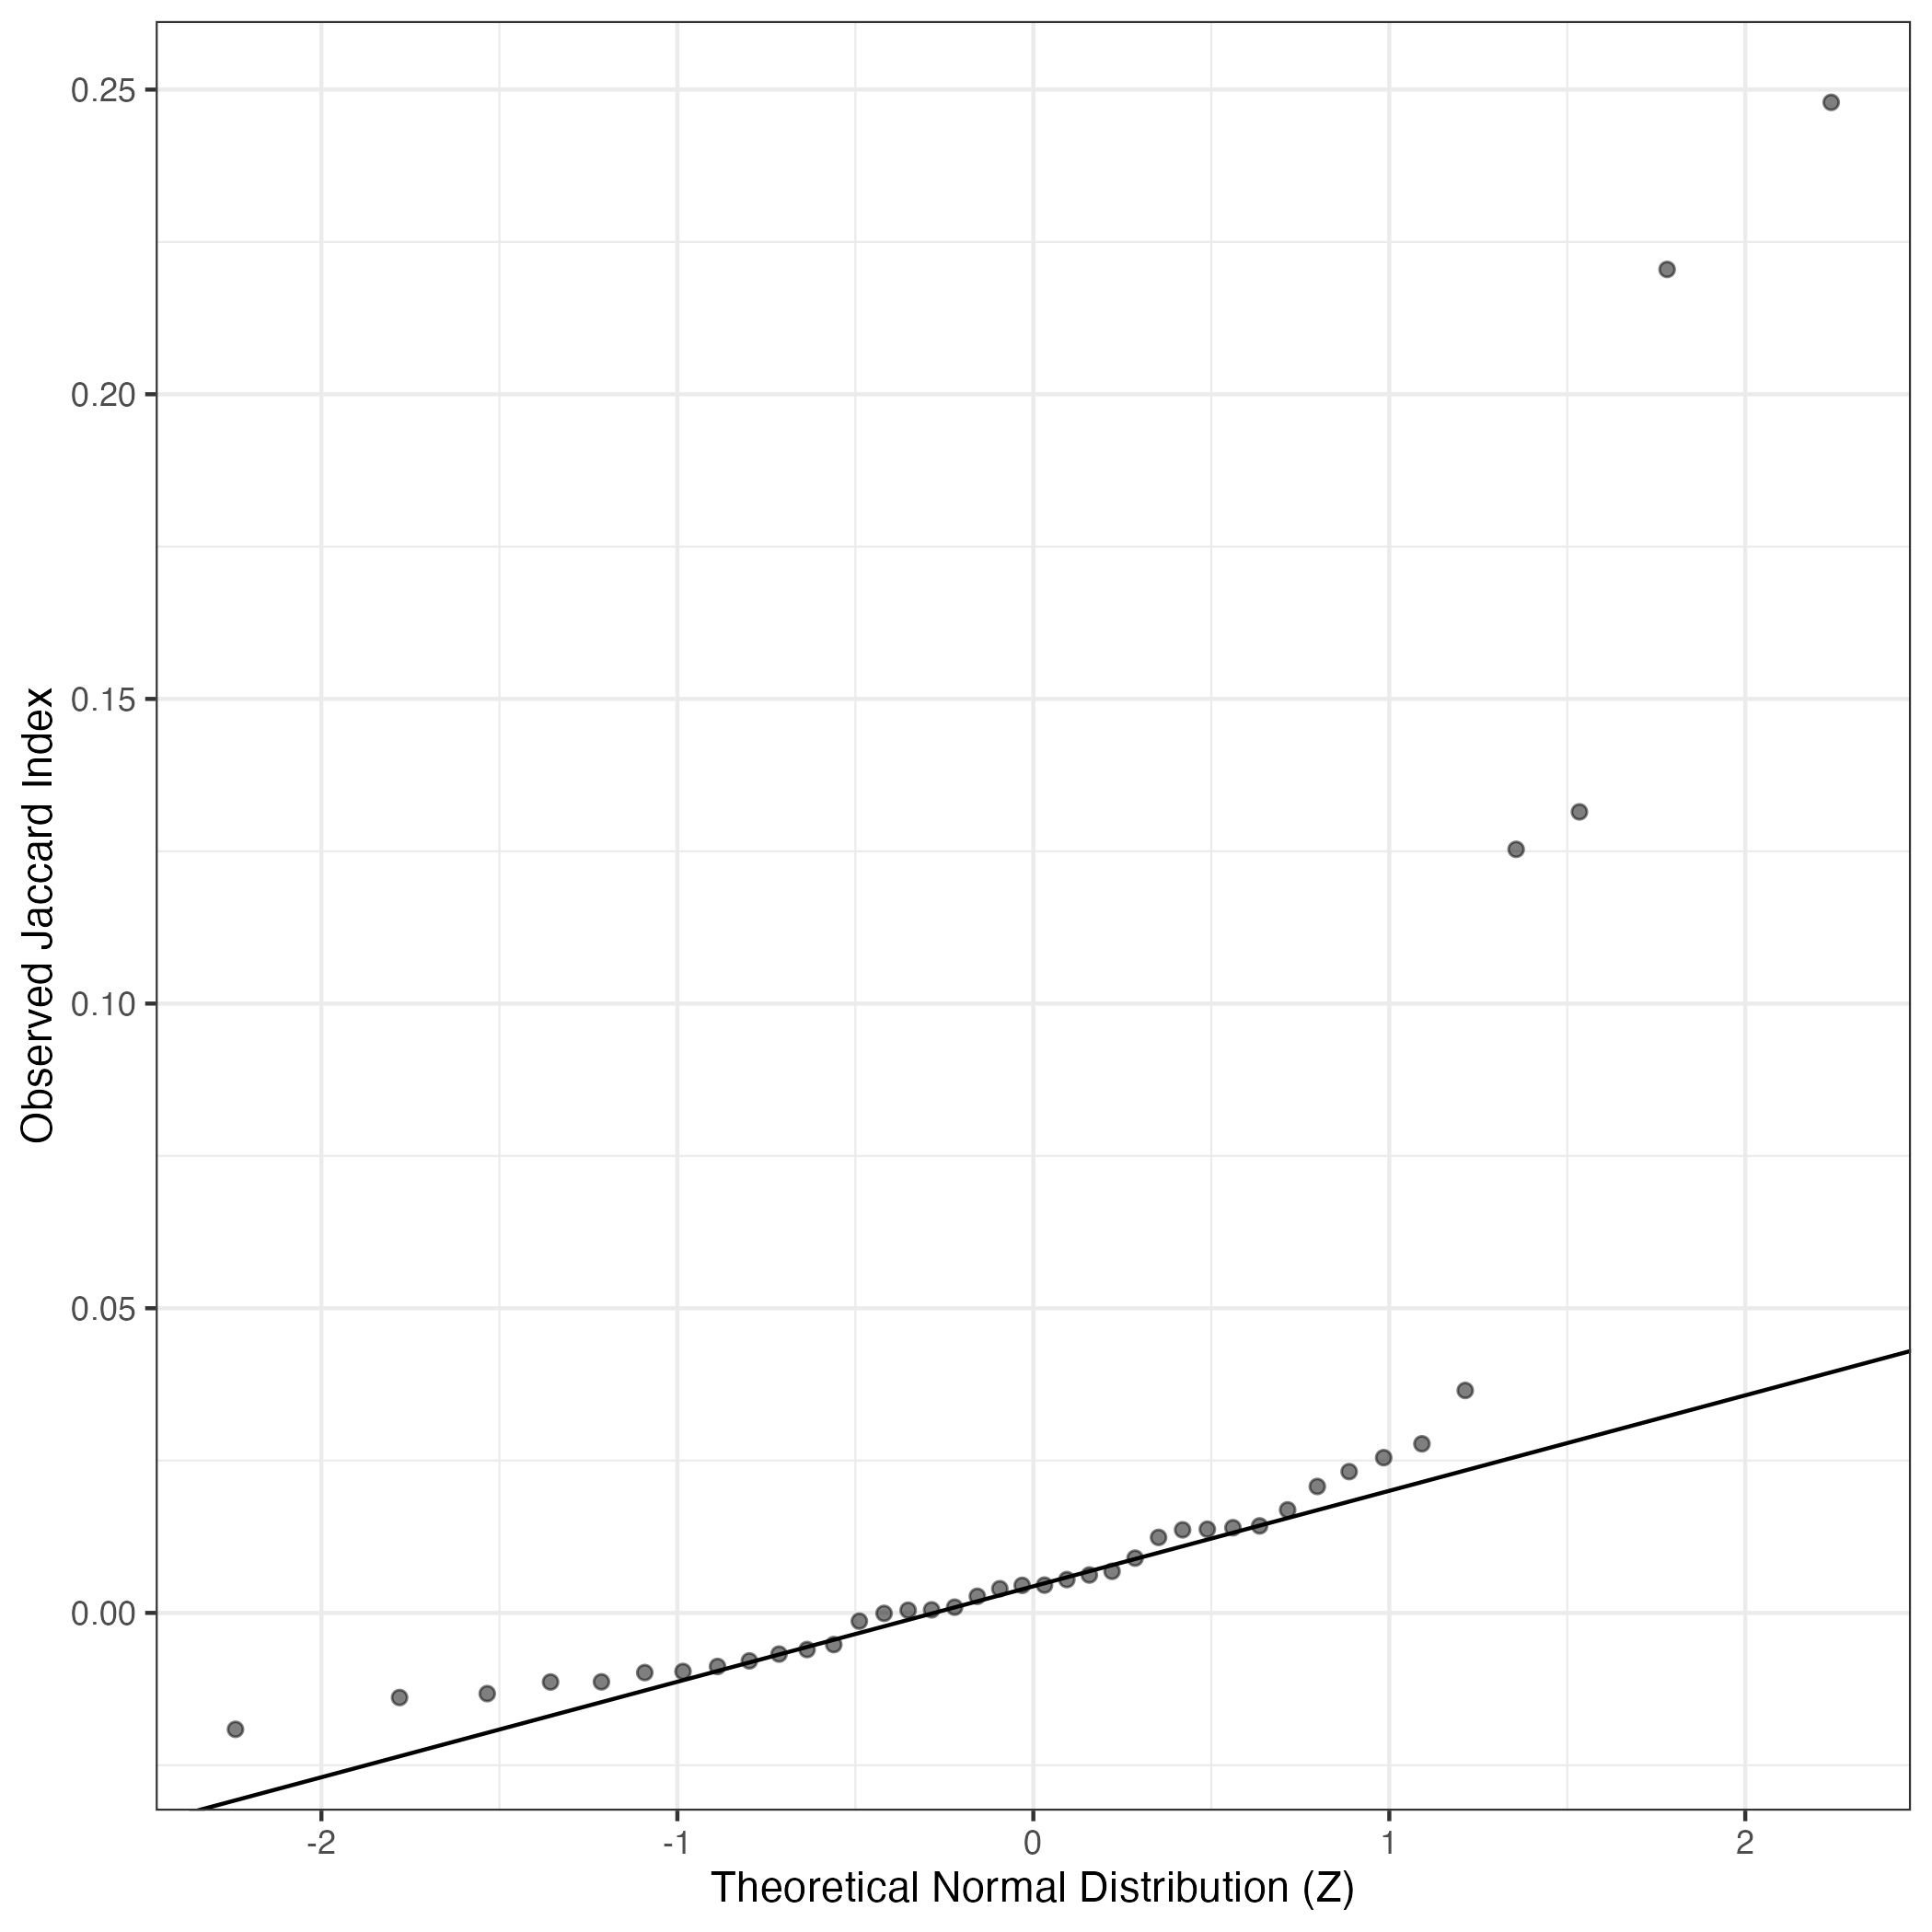
A similar QQ-plot as above, but only for instances where the H value is e.g. > 25, i.e. we are confident that the expression program is active above noise. Agreemenet between these binary vectors is tested using the Jaccard Index, with the P-values calculated by an exact test:
Interactive QQ-plot:
Singler cell type annotations for the top 50 cells on this program.
| Cell ID | Singler label | Singler Delta | Activity Score | Top Singler Raw Scores |
|---|---|---|---|---|
| T230_AGTGCCGAGAAGTCTA-1 | Macrophage:monocyte-derived:IFNa | 0.19 | 2139.53 | Raw ScoresMacrophage:monocyte-derived:M-CSF: 0.43, DC:monocyte-derived:LPS: 0.43, DC:monocyte-derived:Galectin-1: 0.43, Macrophage:monocyte-derived:M-CSF/IFNg: 0.43, DC:monocyte-derived: 0.43, DC:monocyte-derived:anti-DC-SIGN_2h: 0.43, DC:monocyte-derived:antiCD40/VAF347: 0.42, Macrophage:monocyte-derived:IFNa: 0.42, DC:monocyte-derived:AEC-conditioned: 0.42, Macrophage:monocyte-derived:S._aureus: 0.42 |
| T230_TACACCCTCCACGGGT-1 | Macrophage:monocyte-derived:IL-4/Dex/TGFb | 0.21 | 1125.42 | Raw ScoresMacrophage:monocyte-derived:IL-4/Dex/TGFb: 0.46, Macrophage:monocyte-derived:IL-4/Dex/cntrl: 0.46, Macrophage:monocyte-derived:M-CSF: 0.45, Macrophage:monocyte-derived:IL-4/cntrl: 0.45, Macrophage:monocyte-derived:IL-4/TGFb: 0.45, Macrophage:Alveolar: 0.45, Macrophage:monocyte-derived:IFNa: 0.45, Macrophage:Alveolar:B._anthacis_spores: 0.45, DC:monocyte-derived: 0.45, DC:monocyte-derived:LPS: 0.45 |
| T200_GGAATGGTCCGTGTAA-1 | Macrophage:monocyte-derived:IFNa | 0.19 | 969.39 | Raw ScoresMacrophage:monocyte-derived:M-CSF: 0.47, Macrophage:monocyte-derived:M-CSF/IFNg: 0.47, DC:monocyte-derived:AEC-conditioned: 0.46, Macrophage:monocyte-derived:IFNa: 0.46, Monocyte:anti-FcgRIIB: 0.46, Macrophage:monocyte-derived:S._aureus: 0.46, Macrophage:Alveolar: 0.46, Macrophage:monocyte-derived:IL-4/Dex/TGFb: 0.46, DC:monocyte-derived:LPS: 0.46, Macrophage:monocyte-derived: 0.46 |
| T162_TGACGCGCAGACATCT-1 | Macrophage:monocyte-derived:S._aureus | 0.13 | 846.43 | Raw ScoresMacrophage:monocyte-derived:S._aureus: 0.38, Macrophage:monocyte-derived: 0.38, Macrophage:Alveolar: 0.38, Macrophage:monocyte-derived:M-CSF: 0.37, DC:monocyte-derived: 0.37, Monocyte:anti-FcgRIIB: 0.37, Macrophage:Alveolar:B._anthacis_spores: 0.37, DC:monocyte-derived:antiCD40/VAF347: 0.37, DC:monocyte-derived:Schuler_treatment: 0.37, DC:monocyte-derived:immature: 0.37 |
| T230_CGTTAGATCGCCAGTG-1 | Macrophage:monocyte-derived:M-CSF | 0.18 | 816.96 | Raw ScoresDC:monocyte-derived:AEC-conditioned: 0.43, Macrophage:monocyte-derived:M-CSF: 0.43, Macrophage:monocyte-derived: 0.43, Macrophage:monocyte-derived:IFNa: 0.42, DC:monocyte-derived:anti-DC-SIGN_2h: 0.42, Macrophage:monocyte-derived:M-CSF/IFNg: 0.42, DC:monocyte-derived:immature: 0.42, Macrophage:monocyte-derived:IL-4/Dex/TGFb: 0.42, Macrophage:monocyte-derived:IL-4/Dex/cntrl: 0.41, DC:monocyte-derived:Galectin-1: 0.41 |
| T162_CCACTTGTCGCCGAAC-1 | Macrophage:monocyte-derived:IFNa | 0.13 | 744.15 | Raw ScoresMacrophage:monocyte-derived:IFNa: 0.4, Macrophage:monocyte-derived:S._aureus: 0.4, Macrophage:monocyte-derived: 0.4, Macrophage:monocyte-derived:M-CSF: 0.4, DC:monocyte-derived:Galectin-1: 0.4, Monocyte:anti-FcgRIIB: 0.4, DC:monocyte-derived:LPS: 0.39, DC:monocyte-derived: 0.39, Macrophage:monocyte-derived:IL-4/Dex/TGFb: 0.39, DC:monocyte-derived:antiCD40/VAF347: 0.39 |
| T162_GGTAATCCAATAGTAG-1 | Macrophage:Alveolar | 0.19 | 726.66 | Raw ScoresMacrophage:Alveolar:B._anthacis_spores: 0.46, Macrophage:monocyte-derived:M-CSF: 0.46, Macrophage:Alveolar: 0.46, DC:monocyte-derived:LPS: 0.45, Macrophage:monocyte-derived:S._aureus: 0.45, DC:monocyte-derived:Galectin-1: 0.45, DC:monocyte-derived:AEC-conditioned: 0.45, Macrophage:monocyte-derived:IFNa: 0.45, Macrophage:monocyte-derived:M-CSF/IFNg: 0.45, Macrophage:monocyte-derived:M-CSF/IFNg/Pam3Cys: 0.45 |
| T162_GGGCTACAGACAAGCC-1 | Macrophage:monocyte-derived:IFNa | 0.16 | 654.92 | Raw ScoresMacrophage:monocyte-derived:S._aureus: 0.44, Macrophage:Alveolar:B._anthacis_spores: 0.43, Macrophage:monocyte-derived:IFNa: 0.43, Macrophage:monocyte-derived:M-CSF/IFNg/Pam3Cys: 0.43, Monocyte:anti-FcgRIIB: 0.43, DC:monocyte-derived:AEC-conditioned: 0.43, Macrophage:Alveolar: 0.42, Macrophage:monocyte-derived:M-CSF/Pam3Cys: 0.42, DC:monocyte-derived:LPS: 0.42, Macrophage:monocyte-derived:M-CSF/IFNg: 0.42 |
| T162_GTAACACGTACTTCCC-1 | Monocyte:anti-FcgRIIB | 0.10 | 627.92 | Raw ScoresMacrophage:monocyte-derived:S._aureus: 0.35, DC:monocyte-derived:Galectin-1: 0.35, Monocyte:anti-FcgRIIB: 0.35, Macrophage:Alveolar: 0.35, DC:monocyte-derived:antiCD40/VAF347: 0.35, DC:monocyte-derived:LPS: 0.35, Macrophage:Alveolar:B._anthacis_spores: 0.35, Macrophage:monocyte-derived: 0.35, DC:monocyte-derived: 0.35, Macrophage:monocyte-derived:M-CSF/Pam3Cys: 0.35 |
| T162_TTGGGTACACACAGAG-1 | Macrophage:monocyte-derived:IL-4/Dex/TGFb | 0.17 | 627.06 | Raw ScoresMacrophage:monocyte-derived:M-CSF: 0.44, Macrophage:monocyte-derived:IL-4/Dex/TGFb: 0.44, Macrophage:monocyte-derived:IL-4/Dex/cntrl: 0.44, Macrophage:monocyte-derived:M-CSF/IFNg: 0.43, DC:monocyte-derived:AEC-conditioned: 0.43, Monocyte:leukotriene_D4: 0.43, DC:monocyte-derived:anti-DC-SIGN_2h: 0.43, DC:monocyte-derived: 0.42, Monocyte:anti-FcgRIIB: 0.42, DC:monocyte-derived:immature: 0.42 |
| T162_AGAGCCCAGCTCGCAC-1 | Macrophage:Alveolar | 0.16 | 623.11 | Raw ScoresMacrophage:monocyte-derived:M-CSF: 0.45, Macrophage:monocyte-derived:M-CSF/IFNg: 0.45, Macrophage:Alveolar: 0.44, Macrophage:Alveolar:B._anthacis_spores: 0.44, Monocyte:anti-FcgRIIB: 0.44, Macrophage:monocyte-derived:M-CSF/IFNg/Pam3Cys: 0.44, Monocyte:leukotriene_D4: 0.44, Macrophage:monocyte-derived:S._aureus: 0.44, Macrophage:monocyte-derived:IFNa: 0.44, DC:monocyte-derived:LPS: 0.44 |
| T162_TACTGCCCATATCGGT-1 | Macrophage:monocyte-derived:S._aureus | 0.10 | 618.52 | Raw ScoresMacrophage:monocyte-derived: 0.37, Monocyte:MCSF: 0.37, Macrophage:monocyte-derived:S._aureus: 0.37, Macrophage:monocyte-derived:IL-4/cntrl: 0.37, Macrophage:monocyte-derived:IL-4/Dex/TGFb: 0.36, Monocyte:CXCL4: 0.36, Macrophage:monocyte-derived:IL-4/TGFb: 0.36, Macrophage:monocyte-derived:IL-4/Dex/cntrl: 0.36, Macrophage:monocyte-derived:M-CSF: 0.36, DC:monocyte-derived:AEC-conditioned: 0.36 |
| T162_TACAGGTGTACCTGTA-1 | DC:monocyte-derived:antiCD40/VAF347 | 0.15 | 613.08 | Raw ScoresMacrophage:Alveolar:B._anthacis_spores: 0.44, Macrophage:monocyte-derived:S._aureus: 0.44, Macrophage:Alveolar: 0.43, DC:monocyte-derived: 0.43, DC:monocyte-derived:anti-DC-SIGN_2h: 0.43, Macrophage:monocyte-derived: 0.43, Macrophage:monocyte-derived:M-CSF: 0.43, DC:monocyte-derived:antiCD40/VAF347: 0.43, DC:monocyte-derived:Galectin-1: 0.43, Macrophage:monocyte-derived:IL-4/Dex/TGFb: 0.43 |
| T200_ATCACAGCAGCACAGA-1 | Macrophage:monocyte-derived:M-CSF/IFNg/Pam3Cys | 0.22 | 605.22 | Raw ScoresMacrophage:monocyte-derived:M-CSF/IFNg: 0.49, Macrophage:monocyte-derived:M-CSF/IFNg/Pam3Cys: 0.49, Macrophage:monocyte-derived:M-CSF: 0.49, DC:monocyte-derived:LPS: 0.49, DC:monocyte-derived:AEC-conditioned: 0.48, Macrophage:monocyte-derived:S._aureus: 0.48, DC:monocyte-derived:Galectin-1: 0.48, Monocyte:leukotriene_D4: 0.48, Macrophage:monocyte-derived:IFNa: 0.48, Macrophage:Alveolar:B._anthacis_spores: 0.48 |
| T162_CTACGGGAGAGTTGAT-1 | Macrophage:monocyte-derived:M-CSF/IFNg/Pam3Cys | 0.09 | 600.13 | Raw ScoresMacrophage:monocyte-derived: 0.36, Macrophage:monocyte-derived:IFNa: 0.36, DC:monocyte-derived:Schuler_treatment: 0.36, Macrophage:monocyte-derived:S._aureus: 0.36, DC:monocyte-derived:AEC-conditioned: 0.36, DC:monocyte-derived:antiCD40/VAF347: 0.36, DC:monocyte-derived:A._fumigatus_germ_tubes_6h: 0.36, DC:monocyte-derived:CD40L: 0.36, DC:monocyte-derived:anti-DC-SIGN_2h: 0.35, Macrophage:monocyte-derived:M-CSF: 0.35 |
| T162_ACTACGACATCGAAGG-1 | Macrophage:Alveolar:B._anthacis_spores | 0.16 | 597.89 | Raw ScoresMacrophage:Alveolar:B._anthacis_spores: 0.43, Macrophage:monocyte-derived:S._aureus: 0.43, Macrophage:Alveolar: 0.42, Monocyte:anti-FcgRIIB: 0.42, DC:monocyte-derived:A._fumigatus_germ_tubes_6h: 0.42, Macrophage:monocyte-derived: 0.42, DC:monocyte-derived:antiCD40/VAF347: 0.42, Macrophage:monocyte-derived:IFNa: 0.42, DC:monocyte-derived: 0.42, Macrophage:monocyte-derived:M-CSF/IFNg/Pam3Cys: 0.41 |
| T162_AGATGCTTCCCTCTAG-1 | Macrophage:Alveolar:B._anthacis_spores | 0.17 | 596.17 | Raw ScoresMacrophage:Alveolar: 0.44, Macrophage:Alveolar:B._anthacis_spores: 0.44, Macrophage:monocyte-derived: 0.44, Macrophage:monocyte-derived:S._aureus: 0.44, DC:monocyte-derived:AEC-conditioned: 0.44, Monocyte:anti-FcgRIIB: 0.44, Macrophage:monocyte-derived:IL-4/cntrl: 0.44, Macrophage:monocyte-derived:IFNa: 0.44, Macrophage:monocyte-derived:IL-4/TGFb: 0.43, Monocyte:MCSF: 0.43 |
| T162_CTCTGGTTCCAAATGC-1 | Macrophage:monocyte-derived:M-CSF | 0.17 | 568.59 | Raw ScoresMacrophage:monocyte-derived:IFNa: 0.44, Macrophage:monocyte-derived:S._aureus: 0.44, Macrophage:monocyte-derived:M-CSF: 0.43, Monocyte:anti-FcgRIIB: 0.43, Macrophage:Alveolar:B._anthacis_spores: 0.43, DC:monocyte-derived:Galectin-1: 0.43, DC:monocyte-derived:LPS: 0.43, Macrophage:Alveolar: 0.43, Macrophage:monocyte-derived: 0.43, DC:monocyte-derived: 0.43 |
| T200_TAGAGTCCAGAGAGGG-1 | Macrophage:monocyte-derived:M-CSF/IFNg/Pam3Cys | 0.22 | 559.03 | Raw ScoresMacrophage:monocyte-derived:M-CSF/IFNg/Pam3Cys: 0.45, Macrophage:monocyte-derived:M-CSF: 0.45, Monocyte:anti-FcgRIIB: 0.45, Macrophage:monocyte-derived:M-CSF/IFNg: 0.44, DC:monocyte-derived:LPS: 0.44, Macrophage:monocyte-derived:S._aureus: 0.44, Monocyte:leukotriene_D4: 0.44, Macrophage:monocyte-derived:IFNa: 0.44, Macrophage:Alveolar:B._anthacis_spores: 0.44, DC:monocyte-derived:AEC-conditioned: 0.44 |
| T162_GGAATCTGTGAACTAA-1 | DC:monocyte-derived:antiCD40/VAF347 | 0.17 | 558.58 | Raw ScoresMacrophage:monocyte-derived:S._aureus: 0.43, DC:monocyte-derived:anti-DC-SIGN_2h: 0.43, Macrophage:monocyte-derived: 0.43, DC:monocyte-derived:antiCD40/VAF347: 0.43, Macrophage:Alveolar:B._anthacis_spores: 0.43, Macrophage:monocyte-derived:IFNa: 0.42, Macrophage:monocyte-derived:M-CSF: 0.42, DC:monocyte-derived: 0.42, DC:monocyte-derived:A._fumigatus_germ_tubes_6h: 0.42, DC:monocyte-derived:AEC-conditioned: 0.42 |
| T162_TCTATCACAGCTCATA-1 | DC:monocyte-derived:antiCD40/VAF347 | 0.13 | 557.56 | Raw ScoresMacrophage:Alveolar:B._anthacis_spores: 0.41, Monocyte:anti-FcgRIIB: 0.4, Macrophage:monocyte-derived:S._aureus: 0.4, Macrophage:monocyte-derived:M-CSF: 0.4, Macrophage:Alveolar: 0.4, Macrophage:monocyte-derived:IFNa: 0.4, DC:monocyte-derived: 0.4, DC:monocyte-derived:LPS: 0.4, DC:monocyte-derived:antiCD40/VAF347: 0.4, DC:monocyte-derived:A._fumigatus_germ_tubes_6h: 0.4 |
| T200_TCACTCGCACTACCGG-1 | Monocyte:CD14+ | 0.18 | 543.90 | Raw ScoresMacrophage:monocyte-derived:M-CSF/IFNg: 0.44, Monocyte:leukotriene_D4: 0.44, Macrophage:monocyte-derived:M-CSF: 0.44, Monocyte:CD16-: 0.43, Monocyte:CD14+: 0.43, Monocyte:anti-FcgRIIB: 0.43, Macrophage:monocyte-derived:M-CSF/IFNg/Pam3Cys: 0.43, DC:monocyte-derived:AEC-conditioned: 0.43, Monocyte: 0.43, DC:monocyte-derived:anti-DC-SIGN_2h: 0.43 |
| T162_GAGAGGTCAACAGCCC-1 | Macrophage:Alveolar | 0.15 | 526.81 | Raw ScoresMacrophage:monocyte-derived:M-CSF: 0.42, Macrophage:monocyte-derived:IL-4/Dex/TGFb: 0.42, Macrophage:monocyte-derived:IL-4/Dex/cntrl: 0.42, Macrophage:Alveolar: 0.41, Macrophage:monocyte-derived:M-CSF/IFNg: 0.41, Macrophage:Alveolar:B._anthacis_spores: 0.41, DC:monocyte-derived:anti-DC-SIGN_2h: 0.41, DC:monocyte-derived:AEC-conditioned: 0.41, Macrophage:monocyte-derived:IL-4/TGFb: 0.41, Macrophage:monocyte-derived:IL-4/cntrl: 0.41 |
| T162_TCATGTTCAACACAAA-1 | DC:monocyte-derived:antiCD40/VAF347 | 0.12 | 521.51 | Raw ScoresDC:monocyte-derived:AEC-conditioned: 0.42, Macrophage:monocyte-derived:IFNa: 0.42, Macrophage:monocyte-derived:S._aureus: 0.42, DC:monocyte-derived:anti-DC-SIGN_2h: 0.42, DC:monocyte-derived:A._fumigatus_germ_tubes_6h: 0.42, Macrophage:monocyte-derived: 0.42, DC:monocyte-derived:Galectin-1: 0.42, DC:monocyte-derived:antiCD40/VAF347: 0.42, DC:monocyte-derived:LPS: 0.42, DC:monocyte-derived: 0.42 |
| T162_AACCAACAGAGCTGCA-1 | Macrophage:Alveolar:B._anthacis_spores | 0.16 | 516.33 | Raw ScoresMacrophage:monocyte-derived:S._aureus: 0.41, DC:monocyte-derived:antiCD40/VAF347: 0.41, Macrophage:Alveolar:B._anthacis_spores: 0.41, Macrophage:monocyte-derived:IFNa: 0.4, Macrophage:Alveolar: 0.4, Macrophage:monocyte-derived: 0.4, Monocyte:anti-FcgRIIB: 0.4, DC:monocyte-derived:Galectin-1: 0.4, DC:monocyte-derived:A._fumigatus_germ_tubes_6h: 0.4, Macrophage:monocyte-derived:M-CSF: 0.4 |
| T162_TCTTTGAGTAACTTCG-1 | Macrophage:monocyte-derived:S._aureus | 0.09 | 513.84 | Raw ScoresMacrophage:monocyte-derived: 0.36, Macrophage:monocyte-derived:IFNa: 0.36, Macrophage:monocyte-derived:S._aureus: 0.36, DC:monocyte-derived:anti-DC-SIGN_2h: 0.36, DC:monocyte-derived:AEC-conditioned: 0.36, Macrophage:monocyte-derived:IL-4/Dex/TGFb: 0.36, Macrophage:monocyte-derived:M-CSF: 0.35, Macrophage:Alveolar:B._anthacis_spores: 0.35, DC:monocyte-derived:immature: 0.35, Macrophage:Alveolar: 0.35 |
| T162_CAGATACAGGCACTCC-1 | Monocyte:anti-FcgRIIB | 0.16 | 510.45 | Raw ScoresMacrophage:monocyte-derived:M-CSF: 0.43, Monocyte:anti-FcgRIIB: 0.43, Macrophage:monocyte-derived:IL-4/Dex/TGFb: 0.43, Macrophage:Alveolar: 0.43, Macrophage:monocyte-derived:IL-4/Dex/cntrl: 0.43, Macrophage:monocyte-derived: 0.43, Macrophage:monocyte-derived:IL-4/TGFb: 0.43, Macrophage:monocyte-derived:IL-4/cntrl: 0.43, Macrophage:Alveolar:B._anthacis_spores: 0.43, DC:monocyte-derived:Galectin-1: 0.43 |
| T162_ACCTACCCAACTTGCA-1 | DC:monocyte-derived:antiCD40/VAF347 | 0.13 | 506.25 | Raw ScoresDC:monocyte-derived:antiCD40/VAF347: 0.37, DC:monocyte-derived:A._fumigatus_germ_tubes_6h: 0.37, Macrophage:monocyte-derived:S._aureus: 0.37, DC:monocyte-derived:Galectin-1: 0.37, DC:monocyte-derived:Schuler_treatment: 0.37, DC:monocyte-derived: 0.36, Macrophage:monocyte-derived:M-CSF/IFNg/Pam3Cys: 0.36, DC:monocyte-derived:LPS: 0.36, Macrophage:monocyte-derived:M-CSF/Pam3Cys: 0.36, DC:monocyte-derived:anti-DC-SIGN_2h: 0.36 |
| T162_GAGGGATTCTATCGGA-1 | Macrophage:Alveolar:B._anthacis_spores | 0.16 | 503.02 | Raw ScoresMacrophage:Alveolar:B._anthacis_spores: 0.43, Macrophage:monocyte-derived:M-CSF: 0.43, Macrophage:monocyte-derived:S._aureus: 0.42, Macrophage:monocyte-derived:M-CSF/Pam3Cys: 0.42, Macrophage:Alveolar: 0.42, Monocyte:anti-FcgRIIB: 0.42, Macrophage:monocyte-derived:M-CSF/IFNg/Pam3Cys: 0.42, DC:monocyte-derived:anti-DC-SIGN_2h: 0.42, DC:monocyte-derived:AEC-conditioned: 0.42, DC:monocyte-derived:A._fumigatus_germ_tubes_6h: 0.42 |
| T162_GGGTGTCTCGACACTA-1 | Macrophage:monocyte-derived:IFNa | 0.10 | 500.52 | Raw ScoresDC:monocyte-derived:AEC-conditioned: 0.38, Macrophage:Alveolar:B._anthacis_spores: 0.38, Macrophage:monocyte-derived: 0.38, Macrophage:monocyte-derived:IFNa: 0.37, Macrophage:Alveolar: 0.37, Macrophage:monocyte-derived:S._aureus: 0.37, Monocyte:anti-FcgRIIB: 0.37, DC:monocyte-derived: 0.37, DC:monocyte-derived:antiCD40/VAF347: 0.37, Macrophage:monocyte-derived:M-CSF: 0.37 |
| T162_CCACAAACATAACTCG-1 | Macrophage:monocyte-derived:S._aureus | 0.13 | 499.59 | Raw ScoresMacrophage:monocyte-derived:S._aureus: 0.39, Macrophage:monocyte-derived: 0.39, DC:monocyte-derived:Schuler_treatment: 0.38, DC:monocyte-derived:CD40L: 0.38, DC:monocyte-derived:antiCD40/VAF347: 0.38, DC:monocyte-derived:A._fumigatus_germ_tubes_6h: 0.38, Macrophage:monocyte-derived:IFNa: 0.38, Macrophage:Alveolar:B._anthacis_spores: 0.38, DC:monocyte-derived: 0.38, Monocyte:anti-FcgRIIB: 0.38 |
| T162_CATGGATCAAGTCATC-1 | Macrophage:monocyte-derived | 0.11 | 499.30 | Raw ScoresMacrophage:monocyte-derived: 0.38, Macrophage:monocyte-derived:S._aureus: 0.38, Monocyte:MCSF: 0.37, Macrophage:monocyte-derived:IFNa: 0.37, Macrophage:monocyte-derived:IL-4/cntrl: 0.37, Macrophage:monocyte-derived:IL-4/TGFb: 0.37, Macrophage:Alveolar: 0.37, Monocyte:CXCL4: 0.37, Macrophage:monocyte-derived:IL-4/Dex/TGFb: 0.36, Macrophage:Alveolar:B._anthacis_spores: 0.36 |
| T27_ATTGGTGGTGCTAGCC.1 | DC:monocyte-derived:antiCD40/VAF347 | 0.16 | 497.63 | Raw ScoresMacrophage:monocyte-derived:S._aureus: 0.42, Monocyte:anti-FcgRIIB: 0.42, Macrophage:monocyte-derived: 0.42, Macrophage:Alveolar:B._anthacis_spores: 0.42, Macrophage:Alveolar: 0.41, DC:monocyte-derived:antiCD40/VAF347: 0.41, DC:monocyte-derived:A._fumigatus_germ_tubes_6h: 0.41, Macrophage:monocyte-derived:IFNa: 0.41, DC:monocyte-derived:Schuler_treatment: 0.41, Macrophage:monocyte-derived:IL-4/cntrl: 0.41 |
| T162_CTCAAGACACGGATCC-1 | Macrophage:monocyte-derived:S._aureus | 0.13 | 497.31 | Raw ScoresMacrophage:monocyte-derived:S._aureus: 0.37, Macrophage:monocyte-derived:IFNa: 0.37, Macrophage:monocyte-derived: 0.37, Macrophage:Alveolar:B._anthacis_spores: 0.36, Macrophage:Alveolar: 0.36, DC:monocyte-derived:A._fumigatus_germ_tubes_6h: 0.36, DC:monocyte-derived:Galectin-1: 0.36, DC:monocyte-derived: 0.36, DC:monocyte-derived:AEC-conditioned: 0.36, DC:monocyte-derived:antiCD40/VAF347: 0.36 |
| T162_ACACGCGCATTCTCTA-1 | Macrophage:monocyte-derived:M-CSF/IFNg | 0.14 | 492.89 | Raw ScoresMacrophage:monocyte-derived:IFNa: 0.39, Macrophage:monocyte-derived:M-CSF/IFNg: 0.39, Macrophage:monocyte-derived:S._aureus: 0.39, Macrophage:Alveolar:B._anthacis_spores: 0.39, DC:monocyte-derived:Poly(IC): 0.39, Monocyte:anti-FcgRIIB: 0.39, Macrophage:monocyte-derived:M-CSF/IFNg/Pam3Cys: 0.39, Macrophage:monocyte-derived:M-CSF: 0.39, DC:monocyte-derived:AEC-conditioned: 0.39, Macrophage:Alveolar: 0.39 |
| T230_GTGCTGGAGCCAGTAG-1 | Macrophage:monocyte-derived:M-CSF | 0.20 | 492.00 | Raw ScoresDC:monocyte-derived:anti-DC-SIGN_2h: 0.44, DC:monocyte-derived:A._fumigatus_germ_tubes_6h: 0.43, Macrophage:monocyte-derived:M-CSF: 0.43, DC:monocyte-derived: 0.43, DC:monocyte-derived:antiCD40/VAF347: 0.42, Macrophage:monocyte-derived:IL-4/Dex/TGFb: 0.42, Macrophage:monocyte-derived:IL-4/Dex/cntrl: 0.42, DC:monocyte-derived:Galectin-1: 0.42, DC:monocyte-derived:AEC-conditioned: 0.41, Macrophage:Alveolar:B._anthacis_spores: 0.41 |
| T162_ATCGTGACAGTCGCAC-1 | Macrophage:monocyte-derived | 0.15 | 489.14 | Raw ScoresDC:monocyte-derived:AEC-conditioned: 0.43, Macrophage:monocyte-derived:IFNa: 0.42, Macrophage:monocyte-derived: 0.42, DC:monocyte-derived:Galectin-1: 0.42, Monocyte:anti-FcgRIIB: 0.42, Macrophage:monocyte-derived:M-CSF: 0.42, Macrophage:Alveolar:B._anthacis_spores: 0.42, Macrophage:monocyte-derived:S._aureus: 0.42, Macrophage:Alveolar: 0.42, DC:monocyte-derived:LPS: 0.42 |
| T200_GAAGGACAGGTATTGA-1 | Macrophage:monocyte-derived:M-CSF/IFNg | 0.22 | 483.14 | Raw ScoresMacrophage:monocyte-derived:M-CSF/IFNg: 0.47, Macrophage:monocyte-derived:M-CSF: 0.46, DC:monocyte-derived:AEC-conditioned: 0.46, DC:monocyte-derived:LPS: 0.45, Monocyte:leukotriene_D4: 0.45, Macrophage:monocyte-derived:M-CSF/IFNg/Pam3Cys: 0.45, DC:monocyte-derived:Galectin-1: 0.45, Macrophage:monocyte-derived:IL-4/Dex/cntrl: 0.45, Macrophage:monocyte-derived:IFNa: 0.45, Monocyte:anti-FcgRIIB: 0.44 |
| T162_CAATCGACAAGTCATC-1 | Macrophage:Alveolar | 0.10 | 473.90 | Raw ScoresDC:monocyte-derived:AEC-conditioned: 0.33, Macrophage:Alveolar: 0.33, Macrophage:Alveolar:B._anthacis_spores: 0.33, Macrophage:monocyte-derived: 0.32, Macrophage:monocyte-derived:IFNa: 0.32, Macrophage:monocyte-derived:M-CSF: 0.32, Macrophage:monocyte-derived:IL-4/Dex/TGFb: 0.32, Macrophage:monocyte-derived:S._aureus: 0.32, Macrophage:monocyte-derived:M-CSF/IFNg: 0.32, Macrophage:monocyte-derived:IL-4/Dex/cntrl: 0.32 |
| T162_ACAGAAACATCCTAAG-1 | Macrophage:monocyte-derived:IFNa | 0.14 | 470.20 | Raw ScoresMacrophage:Alveolar:B._anthacis_spores: 0.41, Macrophage:Alveolar: 0.41, Macrophage:monocyte-derived:M-CSF: 0.4, Monocyte:anti-FcgRIIB: 0.4, Macrophage:monocyte-derived: 0.4, Macrophage:monocyte-derived:S._aureus: 0.4, Macrophage:monocyte-derived:IFNa: 0.4, DC:monocyte-derived:AEC-conditioned: 0.4, Monocyte:leukotriene_D4: 0.4, Macrophage:monocyte-derived:IL-4/Dex/TGFb: 0.39 |
| T162_CTTCTCTTCCACTGGG-1 | Macrophage:monocyte-derived:S._aureus | 0.11 | 469.33 | Raw ScoresMacrophage:monocyte-derived:S._aureus: 0.38, Macrophage:monocyte-derived: 0.37, Macrophage:Alveolar:B._anthacis_spores: 0.37, DC:monocyte-derived:LPS: 0.37, DC:monocyte-derived:antiCD40/VAF347: 0.37, DC:monocyte-derived:Galectin-1: 0.37, DC:monocyte-derived:AEC-conditioned: 0.37, DC:monocyte-derived: 0.37, Macrophage:monocyte-derived:M-CSF/Pam3Cys: 0.37, Macrophage:monocyte-derived:IFNa: 0.37 |
| T162_GGCACGTTCCGAGCTG-1 | Macrophage:monocyte-derived:IFNa | 0.14 | 465.94 | Raw ScoresMacrophage:monocyte-derived:IFNa: 0.44, Macrophage:monocyte-derived: 0.43, Macrophage:monocyte-derived:M-CSF: 0.43, DC:monocyte-derived:AEC-conditioned: 0.43, Macrophage:monocyte-derived:M-CSF/IFNg: 0.43, Macrophage:Alveolar:B._anthacis_spores: 0.42, Macrophage:monocyte-derived:S._aureus: 0.42, Macrophage:Alveolar: 0.42, DC:monocyte-derived:anti-DC-SIGN_2h: 0.42, DC:monocyte-derived:Galectin-1: 0.42 |
| T200_GGGAGATGTCTCGACG-1 | Macrophage:monocyte-derived:M-CSF/IFNg | 0.22 | 463.01 | Raw ScoresMacrophage:monocyte-derived:M-CSF/IFNg: 0.48, Macrophage:monocyte-derived:M-CSF/IFNg/Pam3Cys: 0.46, Monocyte:leukotriene_D4: 0.46, Monocyte:CD16-: 0.46, Monocyte:anti-FcgRIIB: 0.46, DC:monocyte-derived:AEC-conditioned: 0.46, Macrophage:monocyte-derived:IFNa: 0.46, DC:monocyte-derived:LPS: 0.46, Monocyte:CD14+: 0.46, Macrophage:monocyte-derived:S._aureus: 0.46 |
| T162_AGAGCAGGTAGCTCGC-1 | DC:monocyte-derived:antiCD40/VAF347 | 0.13 | 460.28 | Raw ScoresMacrophage:monocyte-derived:M-CSF: 0.42, Macrophage:monocyte-derived:M-CSF/IFNg/Pam3Cys: 0.42, Macrophage:monocyte-derived:M-CSF/Pam3Cys: 0.42, Monocyte:anti-FcgRIIB: 0.42, Monocyte:leukotriene_D4: 0.42, DC:monocyte-derived:A._fumigatus_germ_tubes_6h: 0.42, DC:monocyte-derived:Galectin-1: 0.42, Macrophage:monocyte-derived:S._aureus: 0.42, DC:monocyte-derived: 0.42, DC:monocyte-derived:LPS: 0.42 |
| T162_TCCGAAATCCTCAGAA-1 | Macrophage:monocyte-derived | 0.10 | 457.84 | Raw ScoresMacrophage:monocyte-derived: 0.39, Macrophage:monocyte-derived:S._aureus: 0.38, Macrophage:monocyte-derived:IFNa: 0.38, DC:monocyte-derived:immature: 0.38, DC:monocyte-derived:Schuler_treatment: 0.38, Monocyte:MCSF: 0.38, Macrophage:monocyte-derived:IL-4/cntrl: 0.38, Monocyte:anti-FcgRIIB: 0.37, Macrophage:monocyte-derived:IL-4/TGFb: 0.37, DC:monocyte-derived:antiCD40/VAF347: 0.37 |
| T162_AGGGTCCTCGGCTGTG-1 | Macrophage:Alveolar:B._anthacis_spores | 0.12 | 454.99 | Raw ScoresMacrophage:Alveolar:B._anthacis_spores: 0.39, Macrophage:Alveolar: 0.38, Macrophage:monocyte-derived:S._aureus: 0.38, DC:monocyte-derived:antiCD40/VAF347: 0.38, Macrophage:monocyte-derived:IFNa: 0.38, DC:monocyte-derived:anti-DC-SIGN_2h: 0.38, DC:monocyte-derived:Galectin-1: 0.38, Macrophage:monocyte-derived:M-CSF/Pam3Cys: 0.38, DC:monocyte-derived:A._fumigatus_germ_tubes_6h: 0.38, Macrophage:monocyte-derived: 0.38 |
| T162_CTATCTACACCAGCCA-1 | Macrophage:monocyte-derived | 0.12 | 452.25 | Raw ScoresMacrophage:monocyte-derived: 0.43, DC:monocyte-derived:AEC-conditioned: 0.42, Macrophage:monocyte-derived:IFNa: 0.42, Macrophage:monocyte-derived:S._aureus: 0.41, Macrophage:monocyte-derived:M-CSF: 0.41, Monocyte:anti-FcgRIIB: 0.41, Monocyte:leukotriene_D4: 0.41, Monocyte:MCSF: 0.41, DC:monocyte-derived:anti-DC-SIGN_2h: 0.4, Macrophage:monocyte-derived:IL-4/Dex/TGFb: 0.4 |
| T162_CTCTGGTGTAGCCCTG-1 | Macrophage:Alveolar:B._anthacis_spores | 0.11 | 452.24 | Raw ScoresMacrophage:monocyte-derived: 0.4, Macrophage:monocyte-derived:S._aureus: 0.4, Monocyte:MCSF: 0.39, Macrophage:monocyte-derived:IFNa: 0.39, Macrophage:monocyte-derived:IL-4/cntrl: 0.39, Macrophage:monocyte-derived:IL-4/TGFb: 0.39, Macrophage:Alveolar: 0.39, DC:monocyte-derived:AEC-conditioned: 0.39, Monocyte:CXCL4: 0.39, Macrophage:Alveolar:B._anthacis_spores: 0.39 |
| T162_GTATTGGCAAGACGAC-1 | DC:monocyte-derived | 0.16 | 447.22 | Raw ScoresMacrophage:monocyte-derived:S._aureus: 0.42, Macrophage:monocyte-derived: 0.42, Macrophage:monocyte-derived:IL-4/Dex/TGFb: 0.42, DC:monocyte-derived:Galectin-1: 0.42, DC:monocyte-derived: 0.42, Macrophage:monocyte-derived:M-CSF: 0.42, Macrophage:monocyte-derived:IL-4/Dex/cntrl: 0.42, Macrophage:monocyte-derived:IL-4/cntrl: 0.42, DC:monocyte-derived:antiCD40/VAF347: 0.42, Macrophage:monocyte-derived:IL-4/TGFb: 0.42 |
| T200_ACTTAGGTCTTCCAGC-1 | DC:monocyte-derived:AEC-conditioned | 0.15 | 446.04 | Raw ScoresDC:monocyte-derived:AEC-conditioned: 0.42, Macrophage:monocyte-derived:IFNa: 0.41, Macrophage:monocyte-derived:M-CSF/IFNg: 0.41, Macrophage:monocyte-derived:M-CSF: 0.41, Macrophage:monocyte-derived: 0.41, Macrophage:monocyte-derived:IL-4/Dex/cntrl: 0.4, DC:monocyte-derived:LPS: 0.4, Macrophage:monocyte-derived:S._aureus: 0.4, DC:monocyte-derived:Galectin-1: 0.4, Macrophage:Alveolar: 0.4 |
Below shows the significant enrichments of this GEP for literature curated gene lists
This data was procured from existing single cell RNA-seq maps of neuroblastoma or related relevant data.
High ranks indicate this gene is a driver of this GEP.
These curated gene list are ranked by the P-value (on this GEP) of their constituent genes.
The Mean Count column shows the mean read count in cells scoring highly (H > 50) on this gene expression program.
M1 Macrophage
These genes were collated from multiple sources:
Wilcoxon ranksum test P-value for gene set overrepresentation: 7.27e-04
Mean rank of genes in gene set: 2798.82
Rank on gene expression program of genes in gene set:
| Genes | Weight | Rank | GTEx | DepMap | Decartes | Mean.Counts | Mean.TPM |
|---|---|---|---|---|---|---|---|
| IL18 | 0.0037261 | 27 | GTEx | DepMap | Descartes | 2.04 | 241.73 |
| CD14 | 0.0023524 | 62 | GTEx | DepMap | Descartes | 9.36 | 1334.13 |
| CXCL16 | 0.0018124 | 112 | GTEx | DepMap | Descartes | 1.60 | 155.38 |
| ITGAX | 0.0017507 | 124 | GTEx | DepMap | Descartes | 0.58 | 26.43 |
| TLR4 | 0.0010268 | 290 | GTEx | DepMap | Descartes | 0.34 | 5.62 |
| CCL2 | 0.0004402 | 795 | GTEx | DepMap | Descartes | 1.89 | 522.77 |
| CD80 | 0.0003899 | 885 | GTEx | DepMap | Descartes | 0.12 | 8.53 |
| IL1B | 0.0001617 | 1624 | GTEx | DepMap | Descartes | 7.82 | 1178.92 |
| IL33 | -0.0000149 | 4257 | GTEx | DepMap | Descartes | 0.00 | 0.39 |
| CCL5 | -0.0001396 | 10233 | GTEx | DepMap | Descartes | 0.63 | 91.53 |
| TNF | -0.0003728 | 12378 | GTEx | DepMap | Descartes | 0.81 | 104.56 |
M2 Macrophage
These genes were collated from multiple sources:
Wilcoxon ranksum test P-value for gene set overrepresentation: 1.63e-03
Mean rank of genes in gene set: 2246.57
Rank on gene expression program of genes in gene set:
| Genes | Weight | Rank | GTEx | DepMap | Decartes | Mean.Counts | Mean.TPM |
|---|---|---|---|---|---|---|---|
| CD14 | 0.0023524 | 62 | GTEx | DepMap | Descartes | 9.36 | 1334.13 |
| CD163 | 0.0009878 | 318 | GTEx | DepMap | Descartes | 1.65 | 78.66 |
| TGFB1 | 0.0003097 | 1053 | GTEx | DepMap | Descartes | 0.82 | 64.63 |
| VEGFA | 0.0002631 | 1202 | GTEx | DepMap | Descartes | 0.48 | 9.79 |
| IL10 | 0.0002590 | 1219 | GTEx | DepMap | Descartes | 0.57 | 59.32 |
| IL13 | -0.0000277 | 4970 | GTEx | DepMap | Descartes | 0.00 | 0.00 |
| ARG1 | -0.0000617 | 6902 | GTEx | DepMap | Descartes | 0.00 | 0.00 |
HSCs and immune cells (Kameneva)
Marker gene were obtained from Fig. 1D of Kameneva et al (PMID 33833454). These genes were used by the authors to annotate each cell type in their human fetal adrenal scRNA-seq data obtained 6, 8, 9, 11, 12 and 14 weeks post conception.:
Wilcoxon ranksum test P-value for gene set overrepresentation: 2.59e-03
Mean rank of genes in gene set: 429
Rank on gene expression program of genes in gene set:
| Genes | Weight | Rank | GTEx | DepMap | Decartes | Mean.Counts | Mean.TPM |
|---|---|---|---|---|---|---|---|
| AIF1 | 0.0014847 | 177 | GTEx | DepMap | Descartes | 9.13 | 1645.84 |
| CD163 | 0.0009878 | 318 | GTEx | DepMap | Descartes | 1.65 | 78.66 |
| RGS10 | 0.0004416 | 792 | GTEx | DepMap | Descartes | 2.60 | 556.86 |
Below shows ranks on this GEP for literature curated gene lists for large gene sets
These include those reported as mesenchymal/adrenergic by Van Groningen et al.
High ranks indicate this gene is a driver of this GEP (note these results are not ordered).
The Mean Count column shows the mean read count in cells scoring highly (H > 50) on this gene expression program.
VanGroningen Adrenergic Genes
Adrenergic marker genes from Supplementary Table 2 of Van Groningen et al. Nature Genetics 2017. These genes were identified by differential expression analysis of mesenchymal-like and adrenergic-like neuroblastoma cell lines.
Wilcoxon ranksum test P-value for gene set overrepresentation: 1.00e+00
Mean rank of genes in gene set: 10054.5
Median rank of genes in gene set: 11107
Rank on gene expression program of top 30 genes in gene set:
| Genes | Weight | Rank | GTEx | DepMap | Descartes | Mean.Counts | Mean.TPM |
|---|---|---|---|---|---|---|---|
| HK2 | 0.0016664 | 142 | GTEx | DepMap | Descartes | 0.28 | 12.83 |
| UCP2 | 0.0013371 | 204 | GTEx | DepMap | Descartes | 2.59 | 265.81 |
| ATP6V1B2 | 0.0010266 | 291 | GTEx | DepMap | Descartes | 1.12 | 33.28 |
| LYN | 0.0010217 | 298 | GTEx | DepMap | Descartes | 0.89 | 33.77 |
| DAPK1 | 0.0003796 | 903 | GTEx | DepMap | Descartes | 0.33 | 11.56 |
| NFIL3 | 0.0002980 | 1092 | GTEx | DepMap | Descartes | 0.42 | 53.86 |
| MYO5A | 0.0002875 | 1116 | GTEx | DepMap | Descartes | 0.27 | 4.86 |
| GLRX | 0.0002169 | 1370 | GTEx | DepMap | Descartes | 1.60 | 96.28 |
| AP1S2 | 0.0001993 | 1444 | GTEx | DepMap | Descartes | 1.28 | 77.80 |
| EML4 | 0.0001975 | 1453 | GTEx | DepMap | Descartes | 0.41 | 17.30 |
| GNB1 | 0.0001415 | 1739 | GTEx | DepMap | Descartes | 0.81 | 55.58 |
| ST3GAL6 | 0.0001045 | 2001 | GTEx | DepMap | Descartes | 0.25 | 15.78 |
| SETD7 | 0.0000825 | 2205 | GTEx | DepMap | Descartes | 0.11 | 3.92 |
| FAM107B | 0.0000613 | 2453 | GTEx | DepMap | Descartes | 0.51 | 32.00 |
| PDK1 | 0.0000557 | 2526 | GTEx | DepMap | Descartes | 0.07 | 1.03 |
| ARL6IP1 | 0.0000450 | 2673 | GTEx | DepMap | Descartes | 1.37 | 120.66 |
| DUSP4 | 0.0000431 | 2699 | GTEx | DepMap | Descartes | 0.26 | 10.40 |
| INO80C | 0.0000253 | 2979 | GTEx | DepMap | Descartes | 0.17 | 10.59 |
| ANP32A | 0.0000174 | 3146 | GTEx | DepMap | Descartes | 0.88 | 46.47 |
| SEC11C | 0.0000167 | 3159 | GTEx | DepMap | Descartes | 0.92 | 93.44 |
| PPP2R3C | 0.0000088 | 3332 | GTEx | DepMap | Descartes | 0.32 | 38.43 |
| TSPAN13 | -0.0000062 | 3801 | GTEx | DepMap | Descartes | 0.29 | 31.13 |
| LSM3 | -0.0000071 | 3842 | GTEx | DepMap | Descartes | 1.28 | 78.16 |
| PHPT1 | -0.0000121 | 4087 | GTEx | DepMap | Descartes | 1.83 | 289.09 |
| RPS6KA2 | -0.0000161 | 4325 | GTEx | DepMap | Descartes | 0.09 | 2.81 |
| EXOC5 | -0.0000261 | 4864 | GTEx | DepMap | Descartes | 0.19 | 3.54 |
| STRA6 | -0.0000269 | 4911 | GTEx | DepMap | Descartes | 0.01 | 0.60 |
| SLIT1 | -0.0000373 | 5533 | GTEx | DepMap | Descartes | 0.04 | 1.31 |
| SHC3 | -0.0000376 | 5550 | GTEx | DepMap | Descartes | 0.01 | 0.14 |
| GGCT | -0.0000392 | 5626 | GTEx | DepMap | Descartes | 0.48 | 77.64 |
VanGroningen Mesenchymal Genes
Mesenchymal marker genes from Supplementary Table 2 of Van Groningen et al. Nature Genetics 2017. These genes were identified by differential expression analysis of mesenchymal-like and adrenergic-like neuroblastoma cell lines.
Wilcoxon ranksum test P-value for gene set overrepresentation: 2.04e-21
Mean rank of genes in gene set: 4665.58
Median rank of genes in gene set: 3626
Rank on gene expression program of top 30 genes in gene set:
| Genes | Weight | Rank | GTEx | DepMap | Descartes | Mean.Counts | Mean.TPM |
|---|---|---|---|---|---|---|---|
| CTSB | 0.0049809 | 10 | GTEx | DepMap | Descartes | 20.73 | 1419.88 |
| APOE | 0.0039245 | 21 | GTEx | DepMap | Descartes | 117.94 | 20862.80 |
| LIPA | 0.0038137 | 23 | GTEx | DepMap | Descartes | 4.54 | 408.02 |
| NPC2 | 0.0037030 | 28 | GTEx | DepMap | Descartes | 10.18 | 1553.32 |
| GRN | 0.0036943 | 29 | GTEx | DepMap | Descartes | 8.99 | 852.20 |
| CD63 | 0.0032765 | 35 | GTEx | DepMap | Descartes | 14.41 | 2690.24 |
| LGALS1 | 0.0031371 | 38 | GTEx | DepMap | Descartes | 15.51 | 5512.11 |
| CREG1 | 0.0029933 | 42 | GTEx | DepMap | Descartes | 3.67 | 402.33 |
| HEXB | 0.0022051 | 74 | GTEx | DepMap | Descartes | 1.31 | 150.97 |
| LAMP1 | 0.0021106 | 82 | GTEx | DepMap | Descartes | 1.94 | 84.53 |
| TSPAN4 | 0.0020731 | 87 | GTEx | DepMap | Descartes | 1.43 | 106.68 |
| VIM | 0.0020377 | 90 | GTEx | DepMap | Descartes | 15.39 | 1296.07 |
| HNMT | 0.0019766 | 95 | GTEx | DepMap | Descartes | 1.18 | 84.74 |
| ANXA5 | 0.0018139 | 111 | GTEx | DepMap | Descartes | 2.77 | 367.64 |
| GPR137B | 0.0017816 | 120 | GTEx | DepMap | Descartes | 0.52 | 57.10 |
| SDCBP | 0.0017696 | 121 | GTEx | DepMap | Descartes | 3.38 | 202.11 |
| SGK1 | 0.0017421 | 128 | GTEx | DepMap | Descartes | 3.59 | 144.25 |
| GNS | 0.0017259 | 133 | GTEx | DepMap | Descartes | 1.02 | 48.86 |
| PPT1 | 0.0017137 | 134 | GTEx | DepMap | Descartes | 1.75 | 94.61 |
| CTSC | 0.0016730 | 140 | GTEx | DepMap | Descartes | 6.69 | 200.28 |
| SH3BGRL | 0.0015686 | 159 | GTEx | DepMap | Descartes | 2.15 | 273.79 |
| LITAF | 0.0015677 | 160 | GTEx | DepMap | Descartes | 3.10 | 256.45 |
| FNDC3B | 0.0015675 | 161 | GTEx | DepMap | Descartes | 0.51 | 15.31 |
| ARPC1B | 0.0015054 | 172 | GTEx | DepMap | Descartes | 3.66 | 408.21 |
| ADAM9 | 0.0014450 | 186 | GTEx | DepMap | Descartes | 0.47 | 30.11 |
| PCOLCE2 | 0.0013653 | 196 | GTEx | DepMap | Descartes | 0.22 | 39.07 |
| RAB31 | 0.0013635 | 197 | GTEx | DepMap | Descartes | 0.73 | 45.21 |
| SLC38A6 | 0.0013560 | 199 | GTEx | DepMap | Descartes | 0.36 | 28.82 |
| PAPSS2 | 0.0013369 | 205 | GTEx | DepMap | Descartes | 0.25 | 14.80 |
| B2M | 0.0012926 | 218 | GTEx | DepMap | Descartes | 101.52 | 8715.55 |
Descartes adrenocortical markers
Top 50 marker genes of adrenocortical cells in the Decartes fetal adrenal single cell map (https://atlas.brotmanbaty.org/bbi/human-gene-expression-during-development/cell/adrenocortical/in/adrenal)
Wilcoxon ranksum test P-value for gene set overrepresentation: 8.41e-01
Mean rank of genes in gene set: 6876.31
Median rank of genes in gene set: 7156
Rank on gene expression program of top 30 genes in gene set:
| Genes | Weight | Rank | GTEx | DepMap | Descartes | Mean.Counts | Mean.TPM |
|---|---|---|---|---|---|---|---|
| APOC1 | 0.0056566 | 5 | GTEx | DepMap | Descartes | 55.54 | 16862.42 |
| PAPSS2 | 0.0013369 | 205 | GTEx | DepMap | Descartes | 0.25 | 14.80 |
| SCARB1 | 0.0007634 | 427 | GTEx | DepMap | Descartes | 0.23 | 7.85 |
| NPC1 | 0.0005971 | 584 | GTEx | DepMap | Descartes | 0.16 | 6.85 |
| POR | 0.0005808 | 607 | GTEx | DepMap | Descartes | 0.51 | 47.41 |
| FDX1 | 0.0003337 | 991 | GTEx | DepMap | Descartes | 0.57 | 37.96 |
| SH3PXD2B | 0.0001655 | 1609 | GTEx | DepMap | Descartes | 0.08 | 2.31 |
| ERN1 | 0.0001246 | 1832 | GTEx | DepMap | Descartes | 0.28 | 7.54 |
| SH3BP5 | 0.0000037 | 3449 | GTEx | DepMap | Descartes | 0.38 | 23.92 |
| FREM2 | -0.0000128 | 4128 | GTEx | DepMap | Descartes | 0.00 | 0.01 |
| GRAMD1B | -0.0000149 | 4259 | GTEx | DepMap | Descartes | 0.05 | 1.17 |
| SCAP | -0.0000301 | 5102 | GTEx | DepMap | Descartes | 0.12 | 5.28 |
| INHA | -0.0000360 | 5447 | GTEx | DepMap | Descartes | 0.00 | 0.32 |
| FDXR | -0.0000404 | 5686 | GTEx | DepMap | Descartes | 0.08 | 7.07 |
| DHCR7 | -0.0000479 | 6127 | GTEx | DepMap | Descartes | 0.07 | 4.80 |
| BAIAP2L1 | -0.0000511 | 6322 | GTEx | DepMap | Descartes | 0.00 | 0.08 |
| SLC16A9 | -0.0000555 | 6586 | GTEx | DepMap | Descartes | 0.03 | 1.19 |
| SGCZ | -0.0000567 | 6650 | GTEx | DepMap | Descartes | 0.00 | 0.01 |
| FRMD5 | -0.0000758 | 7662 | GTEx | DepMap | Descartes | 0.02 | 0.55 |
| STAR | -0.0000922 | 8488 | GTEx | DepMap | Descartes | 0.00 | 0.26 |
| DHCR24 | -0.0000955 | 8651 | GTEx | DepMap | Descartes | 0.03 | 0.95 |
| PDE10A | -0.0001096 | 9214 | GTEx | DepMap | Descartes | 0.03 | 0.37 |
| HMGCR | -0.0001137 | 9395 | GTEx | DepMap | Descartes | 0.10 | 4.23 |
| JAKMIP2 | -0.0001240 | 9770 | GTEx | DepMap | Descartes | 0.10 | 2.12 |
| DNER | -0.0001512 | 10509 | GTEx | DepMap | Descartes | 0.04 | 2.05 |
| CYB5B | -0.0001554 | 10615 | GTEx | DepMap | Descartes | 0.19 | 8.88 |
| SLC1A2 | -0.0001601 | 10711 | GTEx | DepMap | Descartes | 0.04 | 0.53 |
| IGF1R | -0.0001697 | 10898 | GTEx | DepMap | Descartes | 0.07 | 0.95 |
| LDLR | -0.0001716 | 10946 | GTEx | DepMap | Descartes | 0.09 | 3.03 |
| HMGCS1 | -0.0001796 | 11096 | GTEx | DepMap | Descartes | 0.13 | 4.80 |
Descartes chromaffin markers
Top 50 marker genes of chromaffin cells in the Decartes fetal adrenal single cell map (https://atlas.brotmanbaty.org/bbi/human-gene-expression-during-development/cell/chromaffin/in/adrenal)
Wilcoxon ranksum test P-value for gene set overrepresentation: 1.00e+00
Mean rank of genes in gene set: 10899.76
Median rank of genes in gene set: 11814
Rank on gene expression program of top 30 genes in gene set:
| Genes | Weight | Rank | GTEx | DepMap | Descartes | Mean.Counts | Mean.TPM |
|---|---|---|---|---|---|---|---|
| SLC44A5 | -0.0000462 | 6035 | GTEx | DepMap | Descartes | 0.02 | 0.89 |
| GREM1 | -0.0000551 | 6560 | GTEx | DepMap | Descartes | 0.01 | 0.16 |
| EPHA6 | -0.0000769 | 7718 | GTEx | DepMap | Descartes | 0.01 | 0.25 |
| RPH3A | -0.0000780 | 7771 | GTEx | DepMap | Descartes | 0.02 | 0.83 |
| ALK | -0.0000797 | 7869 | GTEx | DepMap | Descartes | 0.04 | 1.31 |
| ANKFN1 | -0.0000917 | 8460 | GTEx | DepMap | Descartes | 0.00 | 0.12 |
| FAT3 | -0.0000941 | 8577 | GTEx | DepMap | Descartes | 0.02 | 0.30 |
| EYA1 | -0.0001122 | 9341 | GTEx | DepMap | Descartes | 0.03 | 1.09 |
| RYR2 | -0.0001208 | 9649 | GTEx | DepMap | Descartes | 0.02 | 0.19 |
| HS3ST5 | -0.0001266 | 9865 | GTEx | DepMap | Descartes | 0.01 | 0.68 |
| KCNB2 | -0.0001358 | 10128 | GTEx | DepMap | Descartes | 0.01 | 0.47 |
| EYA4 | -0.0001487 | 10453 | GTEx | DepMap | Descartes | 0.02 | 0.37 |
| CNKSR2 | -0.0001529 | 10550 | GTEx | DepMap | Descartes | 0.02 | 0.47 |
| PTCHD1 | -0.0001556 | 10616 | GTEx | DepMap | Descartes | 0.01 | 0.19 |
| SYNPO2 | -0.0001644 | 10799 | GTEx | DepMap | Descartes | 0.08 | 0.88 |
| SLC6A2 | -0.0001647 | 10802 | GTEx | DepMap | Descartes | 0.04 | 2.43 |
| TMEM132C | -0.0001652 | 10813 | GTEx | DepMap | Descartes | 0.01 | 0.50 |
| PLXNA4 | -0.0001748 | 11006 | GTEx | DepMap | Descartes | 0.03 | 0.30 |
| TMEFF2 | -0.0001965 | 11339 | GTEx | DepMap | Descartes | 0.04 | 2.56 |
| NTRK1 | -0.0002007 | 11394 | GTEx | DepMap | Descartes | 0.08 | 3.78 |
| GAL | -0.0002398 | 11814 | GTEx | DepMap | Descartes | 0.31 | 86.31 |
| RGMB | -0.0002428 | 11838 | GTEx | DepMap | Descartes | 0.08 | 3.14 |
| REEP1 | -0.0002455 | 11861 | GTEx | DepMap | Descartes | 0.05 | 1.92 |
| RBFOX1 | -0.0002557 | 11932 | GTEx | DepMap | Descartes | 0.02 | 0.80 |
| MAB21L2 | -0.0002715 | 12034 | GTEx | DepMap | Descartes | 0.15 | 6.44 |
| IL7 | -0.0002853 | 12111 | GTEx | DepMap | Descartes | 0.06 | 6.10 |
| MAB21L1 | -0.0002858 | 12114 | GTEx | DepMap | Descartes | 0.20 | 12.10 |
| TUBB2A | -0.0002943 | 12143 | GTEx | DepMap | Descartes | 0.68 | 63.94 |
| CNTFR | -0.0003071 | 12201 | GTEx | DepMap | Descartes | 0.12 | 10.77 |
| ISL1 | -0.0003253 | 12262 | GTEx | DepMap | Descartes | 0.42 | 34.90 |
Descartes Vascular_endothelial markers
Top 50 marker genes of Vascular_endothelial cells in the Decartes fetal adrenal single cell map (https://atlas.brotmanbaty.org/bbi/human-gene-expression-during-development/cell/vascular_endothelial/in/adrenal)
Wilcoxon ranksum test P-value for gene set overrepresentation: 8.21e-01
Mean rank of genes in gene set: 6814.5
Median rank of genes in gene set: 6915
Rank on gene expression program of top 30 genes in gene set:
| Genes | Weight | Rank | GTEx | DepMap | Descartes | Mean.Counts | Mean.TPM |
|---|---|---|---|---|---|---|---|
| CRHBP | 0.0006547 | 515 | GTEx | DepMap | Descartes | 0.10 | 12.28 |
| F8 | 0.0000625 | 2439 | GTEx | DepMap | Descartes | 0.02 | 0.46 |
| NR5A2 | 0.0000305 | 2886 | GTEx | DepMap | Descartes | 0.00 | 0.01 |
| SHE | 0.0000190 | 3113 | GTEx | DepMap | Descartes | 0.01 | 0.62 |
| TMEM88 | 0.0000086 | 3334 | GTEx | DepMap | Descartes | 0.11 | 28.38 |
| HYAL2 | -0.0000109 | 4012 | GTEx | DepMap | Descartes | 0.27 | 12.95 |
| ESM1 | -0.0000126 | 4118 | GTEx | DepMap | Descartes | 0.04 | 1.35 |
| TEK | -0.0000257 | 4846 | GTEx | DepMap | Descartes | 0.01 | 0.09 |
| MMRN2 | -0.0000318 | 5203 | GTEx | DepMap | Descartes | 0.01 | 0.26 |
| GALNT15 | -0.0000334 | 5303 | GTEx | DepMap | Descartes | 0.00 | NA |
| SLCO2A1 | -0.0000362 | 5459 | GTEx | DepMap | Descartes | 0.00 | 0.00 |
| MYRIP | -0.0000393 | 5632 | GTEx | DepMap | Descartes | 0.01 | 0.14 |
| NPR1 | -0.0000467 | 6067 | GTEx | DepMap | Descartes | 0.00 | 0.25 |
| PTPRB | -0.0000479 | 6128 | GTEx | DepMap | Descartes | 0.03 | 0.28 |
| PLVAP | -0.0000498 | 6244 | GTEx | DepMap | Descartes | 0.07 | 3.89 |
| CDH5 | -0.0000572 | 6682 | GTEx | DepMap | Descartes | 0.04 | 1.08 |
| KDR | -0.0000604 | 6840 | GTEx | DepMap | Descartes | 0.01 | 0.20 |
| EHD3 | -0.0000614 | 6883 | GTEx | DepMap | Descartes | 0.01 | 0.27 |
| CALCRL | -0.0000619 | 6911 | GTEx | DepMap | Descartes | 0.02 | 0.69 |
| IRX3 | -0.0000620 | 6919 | GTEx | DepMap | Descartes | 0.02 | 1.64 |
| KANK3 | -0.0000638 | 7014 | GTEx | DepMap | Descartes | 0.00 | 0.33 |
| CYP26B1 | -0.0000664 | 7168 | GTEx | DepMap | Descartes | 0.02 | 0.53 |
| TIE1 | -0.0000743 | 7587 | GTEx | DepMap | Descartes | 0.01 | 0.53 |
| FLT4 | -0.0000763 | 7687 | GTEx | DepMap | Descartes | 0.01 | 0.14 |
| SHANK3 | -0.0000782 | 7787 | GTEx | DepMap | Descartes | 0.01 | 0.10 |
| RASIP1 | -0.0000806 | 7903 | GTEx | DepMap | Descartes | 0.01 | 0.33 |
| ROBO4 | -0.0000808 | 7914 | GTEx | DepMap | Descartes | 0.02 | 0.52 |
| PODXL | -0.0000873 | 8231 | GTEx | DepMap | Descartes | 0.04 | 0.81 |
| CLDN5 | -0.0000902 | 8371 | GTEx | DepMap | Descartes | 0.11 | 8.95 |
| CEACAM1 | -0.0000908 | 8407 | GTEx | DepMap | Descartes | 0.01 | 0.33 |
Descartes stromal markers
Top 50 marker genes of stromal cells in the Decartes fetal adrenal single cell map (https://atlas.brotmanbaty.org/bbi/human-gene-expression-during-development/cell/stromal/in/adrenal)
Wilcoxon ranksum test P-value for gene set overrepresentation: 7.65e-01
Mean rank of genes in gene set: 6669.73
Median rank of genes in gene set: 6505
Rank on gene expression program of top 30 genes in gene set:
| Genes | Weight | Rank | GTEx | DepMap | Descartes | Mean.Counts | Mean.TPM |
|---|---|---|---|---|---|---|---|
| DKK2 | 0.0002703 | 1171 | GTEx | DepMap | Descartes | 0.02 | 1.33 |
| COL27A1 | 0.0002212 | 1345 | GTEx | DepMap | Descartes | 0.02 | 0.57 |
| ABCA6 | 0.0000079 | 3354 | GTEx | DepMap | Descartes | 0.05 | 1.19 |
| ADAMTS2 | -0.0000084 | 3894 | GTEx | DepMap | Descartes | 0.02 | 0.65 |
| SCARA5 | -0.0000101 | 3972 | GTEx | DepMap | Descartes | 0.00 | 0.00 |
| EDNRA | -0.0000146 | 4231 | GTEx | DepMap | Descartes | 0.01 | 0.28 |
| ABCC9 | -0.0000204 | 4546 | GTEx | DepMap | Descartes | 0.00 | 0.04 |
| GAS2 | -0.0000246 | 4797 | GTEx | DepMap | Descartes | 0.00 | 0.24 |
| SFRP2 | -0.0000311 | 5164 | GTEx | DepMap | Descartes | 0.02 | 5.61 |
| ITGA11 | -0.0000316 | 5190 | GTEx | DepMap | Descartes | 0.00 | 0.09 |
| HHIP | -0.0000330 | 5277 | GTEx | DepMap | Descartes | 0.06 | 1.51 |
| IGFBP3 | -0.0000392 | 5628 | GTEx | DepMap | Descartes | 0.03 | 1.08 |
| BICC1 | -0.0000406 | 5702 | GTEx | DepMap | Descartes | 0.01 | 0.22 |
| ADAMTSL3 | -0.0000443 | 5906 | GTEx | DepMap | Descartes | 0.00 | 0.01 |
| POSTN | -0.0000465 | 6056 | GTEx | DepMap | Descartes | 0.05 | 3.38 |
| PCDH18 | -0.0000468 | 6071 | GTEx | DepMap | Descartes | 0.01 | 0.29 |
| ACTA2 | -0.0000468 | 6073 | GTEx | DepMap | Descartes | 0.20 | 14.54 |
| LAMC3 | -0.0000470 | 6088 | GTEx | DepMap | Descartes | 0.00 | 0.03 |
| GLI2 | -0.0000485 | 6160 | GTEx | DepMap | Descartes | 0.00 | 0.00 |
| COL6A3 | -0.0000500 | 6253 | GTEx | DepMap | Descartes | 0.05 | 1.08 |
| FREM1 | -0.0000503 | 6269 | GTEx | DepMap | Descartes | 0.00 | 0.06 |
| C7 | -0.0000510 | 6317 | GTEx | DepMap | Descartes | 0.01 | 0.12 |
| LUM | -0.0000574 | 6693 | GTEx | DepMap | Descartes | 0.20 | 13.56 |
| PRRX1 | -0.0000583 | 6745 | GTEx | DepMap | Descartes | 0.01 | 0.57 |
| PAMR1 | -0.0000642 | 7038 | GTEx | DepMap | Descartes | 0.01 | 0.58 |
| LOX | -0.0000685 | 7284 | GTEx | DepMap | Descartes | 0.02 | 0.77 |
| LRRC17 | -0.0000696 | 7350 | GTEx | DepMap | Descartes | 0.01 | 0.88 |
| CD248 | -0.0000700 | 7371 | GTEx | DepMap | Descartes | 0.02 | 1.38 |
| RSPO3 | -0.0000704 | 7384 | GTEx | DepMap | Descartes | 0.00 | NA |
| DCN | -0.0000714 | 7450 | GTEx | DepMap | Descartes | 0.23 | 10.85 |
Descartes sympathoblasts markers
Top 50 marker genes of sympathoblasts cells in the Decartes fetal adrenal single cell map (https://atlas.brotmanbaty.org/bbi/human-gene-expression-during-development/cell/sympathoblasts/in/adrenal)
Wilcoxon ranksum test P-value for gene set overrepresentation: 1.00e+00
Mean rank of genes in gene set: 8283.95
Median rank of genes in gene set: 8830
Rank on gene expression program of top 30 genes in gene set:
| Genes | Weight | Rank | GTEx | DepMap | Descartes | Mean.Counts | Mean.TPM |
|---|---|---|---|---|---|---|---|
| ST18 | 0.0001826 | 1534 | GTEx | DepMap | Descartes | 0.02 | 0.79 |
| PENK | 0.0000142 | 3220 | GTEx | DepMap | Descartes | 0.00 | 0.47 |
| SLC35F3 | -0.0000130 | 4142 | GTEx | DepMap | Descartes | 0.00 | 0.20 |
| SORCS3 | -0.0000168 | 4359 | GTEx | DepMap | Descartes | 0.01 | 0.36 |
| CNTN3 | -0.0000301 | 5097 | GTEx | DepMap | Descartes | 0.00 | 0.10 |
| LAMA3 | -0.0000320 | 5222 | GTEx | DepMap | Descartes | 0.00 | 0.05 |
| CDH18 | -0.0000351 | 5384 | GTEx | DepMap | Descartes | 0.01 | 0.37 |
| TBX20 | -0.0000359 | 5438 | GTEx | DepMap | Descartes | 0.00 | 0.27 |
| SLC24A2 | -0.0000428 | 5815 | GTEx | DepMap | Descartes | 0.00 | 0.02 |
| DGKK | -0.0000456 | 5998 | GTEx | DepMap | Descartes | 0.01 | 0.38 |
| GRM7 | -0.0000474 | 6101 | GTEx | DepMap | Descartes | 0.00 | 0.00 |
| EML6 | -0.0000516 | 6345 | GTEx | DepMap | Descartes | 0.01 | 0.09 |
| TIAM1 | -0.0000517 | 6347 | GTEx | DepMap | Descartes | 0.09 | 2.63 |
| GALNTL6 | -0.0000704 | 7395 | GTEx | DepMap | Descartes | 0.00 | 0.38 |
| PCSK2 | -0.0000752 | 7635 | GTEx | DepMap | Descartes | 0.00 | 0.16 |
| CDH12 | -0.0000756 | 7655 | GTEx | DepMap | Descartes | 0.01 | 0.16 |
| AGBL4 | -0.0000914 | 8443 | GTEx | DepMap | Descartes | 0.01 | 0.19 |
| NTNG1 | -0.0000978 | 8751 | GTEx | DepMap | Descartes | 0.03 | 0.96 |
| TENM1 | -0.0000987 | 8795 | GTEx | DepMap | Descartes | 0.00 | NA |
| ROBO1 | -0.0001006 | 8865 | GTEx | DepMap | Descartes | 0.07 | 1.54 |
| SPOCK3 | -0.0001024 | 8932 | GTEx | DepMap | Descartes | 0.01 | 0.26 |
| PACRG | -0.0001059 | 9064 | GTEx | DepMap | Descartes | 0.01 | 1.55 |
| GRID2 | -0.0001119 | 9322 | GTEx | DepMap | Descartes | 0.02 | 0.27 |
| CCSER1 | -0.0001191 | 9599 | GTEx | DepMap | Descartes | 0.02 | NA |
| SLC18A1 | -0.0001237 | 9753 | GTEx | DepMap | Descartes | 0.02 | 1.23 |
| KSR2 | -0.0001250 | 9803 | GTEx | DepMap | Descartes | 0.01 | 0.12 |
| FGF14 | -0.0001254 | 9820 | GTEx | DepMap | Descartes | 0.04 | 0.74 |
| UNC80 | -0.0001323 | 10037 | GTEx | DepMap | Descartes | 0.04 | 0.71 |
| MGAT4C | -0.0001460 | 10394 | GTEx | DepMap | Descartes | 0.02 | 0.11 |
| FAM155A | -0.0001542 | 10583 | GTEx | DepMap | Descartes | 0.06 | 1.28 |
Descartes erythroblasts markers
Top 50 marker genes of erythroblasts cells in the Decartes fetal adrenal single cell map (https://atlas.brotmanbaty.org/bbi/human-gene-expression-during-development/cell/erythroblasts/in/adrenal)
Wilcoxon ranksum test P-value for gene set overrepresentation: 6.05e-02
Mean rank of genes in gene set: 5233.14
Median rank of genes in gene set: 4098
Rank on gene expression program of top 30 genes in gene set:
| Genes | Weight | Rank | GTEx | DepMap | Descartes | Mean.Counts | Mean.TPM |
|---|---|---|---|---|---|---|---|
| BLVRB | 0.0029151 | 43 | GTEx | DepMap | Descartes | 4.01 | 675.54 |
| CAT | 0.0005845 | 602 | GTEx | DepMap | Descartes | 0.54 | 48.69 |
| SPECC1 | 0.0001148 | 1921 | GTEx | DepMap | Descartes | 0.11 | 2.69 |
| TRAK2 | 0.0000873 | 2154 | GTEx | DepMap | Descartes | 0.08 | 2.60 |
| RAPGEF2 | 0.0000819 | 2215 | GTEx | DepMap | Descartes | 0.24 | 6.47 |
| FECH | 0.0000766 | 2273 | GTEx | DepMap | Descartes | 0.09 | 2.33 |
| MARCH3 | 0.0000682 | 2374 | GTEx | DepMap | Descartes | 0.08 | NA |
| ABCB10 | 0.0000646 | 2419 | GTEx | DepMap | Descartes | 0.06 | 2.54 |
| GCLC | 0.0000445 | 2682 | GTEx | DepMap | Descartes | 0.18 | 10.33 |
| CPOX | 0.0000374 | 2782 | GTEx | DepMap | Descartes | 0.05 | 3.68 |
| SELENBP1 | 0.0000316 | 2870 | GTEx | DepMap | Descartes | 0.01 | 0.67 |
| SLC4A1 | 0.0000183 | 3125 | GTEx | DepMap | Descartes | 0.01 | 0.34 |
| MICAL2 | -0.0000095 | 3945 | GTEx | DepMap | Descartes | 0.03 | 1.28 |
| SLC25A21 | -0.0000117 | 4063 | GTEx | DepMap | Descartes | 0.00 | 0.00 |
| RHD | -0.0000123 | 4098 | GTEx | DepMap | Descartes | 0.00 | 0.00 |
| XPO7 | -0.0000177 | 4409 | GTEx | DepMap | Descartes | 0.11 | 4.20 |
| RGS6 | -0.0000194 | 4488 | GTEx | DepMap | Descartes | 0.00 | 0.05 |
| GYPC | -0.0000228 | 4691 | GTEx | DepMap | Descartes | 0.98 | 123.64 |
| ALAS2 | -0.0000371 | 5522 | GTEx | DepMap | Descartes | 0.00 | 0.24 |
| TFR2 | -0.0000667 | 7181 | GTEx | DepMap | Descartes | 0.03 | 1.44 |
| SPTB | -0.0000798 | 7874 | GTEx | DepMap | Descartes | 0.01 | 0.26 |
| ANK1 | -0.0000902 | 8376 | GTEx | DepMap | Descartes | 0.02 | 0.28 |
| TMCC2 | -0.0000970 | 8717 | GTEx | DepMap | Descartes | 0.01 | 0.51 |
| SOX6 | -0.0001140 | 9405 | GTEx | DepMap | Descartes | 0.01 | 0.10 |
| DENND4A | -0.0001250 | 9805 | GTEx | DepMap | Descartes | 0.13 | 3.46 |
| SLC25A37 | -0.0001261 | 9847 | GTEx | DepMap | Descartes | 0.22 | 11.69 |
| SNCA | -0.0001557 | 10620 | GTEx | DepMap | Descartes | 0.17 | 10.62 |
| EPB41 | -0.0001880 | 11223 | GTEx | DepMap | Descartes | 0.14 | 4.22 |
| TSPAN5 | -0.0002722 | 12037 | GTEx | DepMap | Descartes | 0.11 | 4.41 |
| NA | NA | NA | NA | NA | NA | NA | NA |
Descartes myeloid markers
Top 50 marker genes of myeloid cells in the Decartes fetal adrenal single cell map (https://atlas.brotmanbaty.org/bbi/human-gene-expression-during-development/cell/myeloid/in/adrenal)
Wilcoxon ranksum test P-value for gene set overrepresentation: 2.58e-13
Mean rank of genes in gene set: 2037.63
Median rank of genes in gene set: 344
Rank on gene expression program of top 30 genes in gene set:
| Genes | Weight | Rank | GTEx | DepMap | Descartes | Mean.Counts | Mean.TPM |
|---|---|---|---|---|---|---|---|
| CTSD | 0.0057705 | 4 | GTEx | DepMap | Descartes | 29.70 | 3587.56 |
| CTSB | 0.0049809 | 10 | GTEx | DepMap | Descartes | 20.73 | 1419.88 |
| SPP1 | 0.0044444 | 13 | GTEx | DepMap | Descartes | 144.70 | 26388.04 |
| CTSS | 0.0028093 | 46 | GTEx | DepMap | Descartes | 6.25 | 304.47 |
| ABCA1 | 0.0025897 | 51 | GTEx | DepMap | Descartes | 1.26 | 29.50 |
| LGMN | 0.0024397 | 57 | GTEx | DepMap | Descartes | 6.06 | 613.53 |
| CD14 | 0.0023524 | 62 | GTEx | DepMap | Descartes | 9.36 | 1334.13 |
| CTSC | 0.0016730 | 140 | GTEx | DepMap | Descartes | 6.69 | 200.28 |
| MSR1 | 0.0015839 | 155 | GTEx | DepMap | Descartes | 1.03 | 71.34 |
| ADAP2 | 0.0014632 | 182 | GTEx | DepMap | Descartes | 1.01 | 87.71 |
| SLCO2B1 | 0.0012929 | 217 | GTEx | DepMap | Descartes | 0.87 | 34.23 |
| HCK | 0.0012313 | 233 | GTEx | DepMap | Descartes | 0.62 | 55.55 |
| IFNGR1 | 0.0011786 | 252 | GTEx | DepMap | Descartes | 1.20 | 102.73 |
| CD74 | 0.0010175 | 302 | GTEx | DepMap | Descartes | 41.32 | 2497.02 |
| SLC1A3 | 0.0010140 | 304 | GTEx | DepMap | Descartes | 0.40 | 21.40 |
| CD163 | 0.0009878 | 318 | GTEx | DepMap | Descartes | 1.65 | 78.66 |
| TGFBI | 0.0009665 | 324 | GTEx | DepMap | Descartes | 1.48 | 72.48 |
| CYBB | 0.0009545 | 327 | GTEx | DepMap | Descartes | 1.31 | 62.66 |
| MS4A4A | 0.0009469 | 330 | GTEx | DepMap | Descartes | 2.62 | 326.17 |
| MARCH1 | 0.0008708 | 358 | GTEx | DepMap | Descartes | 0.62 | NA |
| RGL1 | 0.0008259 | 394 | GTEx | DepMap | Descartes | 0.32 | 14.06 |
| CSF1R | 0.0007202 | 462 | GTEx | DepMap | Descartes | 1.19 | 66.71 |
| MERTK | 0.0006757 | 497 | GTEx | DepMap | Descartes | 0.38 | 22.46 |
| CST3 | 0.0003793 | 904 | GTEx | DepMap | Descartes | 15.58 | 959.23 |
| FGD2 | 0.0002658 | 1192 | GTEx | DepMap | Descartes | 0.15 | 5.05 |
| ITPR2 | 0.0002204 | 1349 | GTEx | DepMap | Descartes | 0.37 | 5.94 |
| PTPRE | 0.0001508 | 1695 | GTEx | DepMap | Descartes | 0.64 | 23.32 |
| AXL | 0.0001234 | 1842 | GTEx | DepMap | Descartes | 0.69 | 29.61 |
| RBPJ | 0.0001190 | 1882 | GTEx | DepMap | Descartes | 0.83 | 32.22 |
| ATP8B4 | 0.0001109 | 1950 | GTEx | DepMap | Descartes | 0.09 | 3.46 |
Descartes Schwann markers
Top 50 marker genes of Schwann cells in the Decartes fetal adrenal single cell map (https://atlas.brotmanbaty.org/bbi/human-gene-expression-during-development/cell/schwann/in/adrenal)
Wilcoxon ranksum test P-value for gene set overrepresentation: 9.25e-01
Mean rank of genes in gene set: 7058.75
Median rank of genes in gene set: 7355.5
Rank on gene expression program of top 30 genes in gene set:
| Genes | Weight | Rank | GTEx | DepMap | Descartes | Mean.Counts | Mean.TPM |
|---|---|---|---|---|---|---|---|
| VIM | 0.0020377 | 90 | GTEx | DepMap | Descartes | 15.39 | 1296.07 |
| KCTD12 | 0.0009258 | 339 | GTEx | DepMap | Descartes | 0.75 | 28.24 |
| GAS7 | 0.0005965 | 585 | GTEx | DepMap | Descartes | 0.25 | 7.44 |
| VCAN | 0.0005015 | 704 | GTEx | DepMap | Descartes | 0.80 | 21.22 |
| EDNRB | 0.0002181 | 1359 | GTEx | DepMap | Descartes | 0.08 | 4.76 |
| STARD13 | 0.0001039 | 2005 | GTEx | DepMap | Descartes | 0.06 | 2.26 |
| LAMC1 | 0.0000436 | 2690 | GTEx | DepMap | Descartes | 0.09 | 2.31 |
| IL1RAPL2 | -0.0000018 | 3628 | GTEx | DepMap | Descartes | 0.00 | 0.00 |
| MDGA2 | -0.0000126 | 4117 | GTEx | DepMap | Descartes | 0.00 | 0.00 |
| PAG1 | -0.0000127 | 4123 | GTEx | DepMap | Descartes | 0.30 | 6.70 |
| HMGA2 | -0.0000158 | 4305 | GTEx | DepMap | Descartes | 0.00 | 0.03 |
| PMP22 | -0.0000283 | 5002 | GTEx | DepMap | Descartes | 0.70 | 78.53 |
| ADAMTS5 | -0.0000293 | 5046 | GTEx | DepMap | Descartes | 0.02 | 0.47 |
| IL1RAPL1 | -0.0000368 | 5508 | GTEx | DepMap | Descartes | 0.00 | 0.35 |
| MPZ | -0.0000465 | 6055 | GTEx | DepMap | Descartes | 0.03 | 3.38 |
| ERBB4 | -0.0000466 | 6064 | GTEx | DepMap | Descartes | 0.02 | 0.53 |
| PLCE1 | -0.0000536 | 6468 | GTEx | DepMap | Descartes | 0.04 | 0.66 |
| NRXN3 | -0.0000536 | 6469 | GTEx | DepMap | Descartes | 0.01 | 0.13 |
| PLP1 | -0.0000549 | 6548 | GTEx | DepMap | Descartes | 0.04 | 2.04 |
| TRPM3 | -0.0000561 | 6617 | GTEx | DepMap | Descartes | 0.00 | 0.03 |
| GRIK3 | -0.0000611 | 6878 | GTEx | DepMap | Descartes | 0.01 | 0.12 |
| COL25A1 | -0.0000676 | 7238 | GTEx | DepMap | Descartes | 0.01 | 0.07 |
| XKR4 | -0.0000720 | 7473 | GTEx | DepMap | Descartes | 0.01 | 0.08 |
| MARCKS | -0.0000730 | 7523 | GTEx | DepMap | Descartes | 5.29 | 252.42 |
| EGFLAM | -0.0000770 | 7722 | GTEx | DepMap | Descartes | 0.02 | 0.53 |
| LRRTM4 | -0.0000853 | 8120 | GTEx | DepMap | Descartes | 0.01 | 0.28 |
| PTPRZ1 | -0.0000878 | 8251 | GTEx | DepMap | Descartes | 0.00 | 0.03 |
| SLC35F1 | -0.0000909 | 8418 | GTEx | DepMap | Descartes | 0.02 | 0.64 |
| ERBB3 | -0.0000914 | 8441 | GTEx | DepMap | Descartes | 0.01 | 0.40 |
| COL18A1 | -0.0000931 | 8532 | GTEx | DepMap | Descartes | 0.14 | 2.94 |
Descartes Megakaryocytes markers
Top 50 marker genes of Megakaryocytes cells in the Decartes fetal adrenal single cell map (https://atlas.brotmanbaty.org/bbi/human-gene-expression-during-development/cell/megakaryocytes/in/adrenal)
Wilcoxon ranksum test P-value for gene set overrepresentation: 6.32e-06
Mean rank of genes in gene set: 3921.29
Median rank of genes in gene set: 1591
Rank on gene expression program of top 30 genes in gene set:
| Genes | Weight | Rank | GTEx | DepMap | Descartes | Mean.Counts | Mean.TPM |
|---|---|---|---|---|---|---|---|
| CD84 | 0.0026399 | 50 | GTEx | DepMap | Descartes | 1.09 | 29.32 |
| PLEK | 0.0017452 | 126 | GTEx | DepMap | Descartes | 2.05 | 168.86 |
| ACTB | 0.0016508 | 145 | GTEx | DepMap | Descartes | 37.41 | 3710.50 |
| LIMS1 | 0.0016146 | 150 | GTEx | DepMap | Descartes | 1.90 | 98.99 |
| FERMT3 | 0.0013195 | 209 | GTEx | DepMap | Descartes | 0.77 | 66.29 |
| TMSB4X | 0.0011671 | 260 | GTEx | DepMap | Descartes | 133.63 | 16229.86 |
| TPM4 | 0.0011052 | 278 | GTEx | DepMap | Descartes | 2.23 | 112.05 |
| CD9 | 0.0008404 | 384 | GTEx | DepMap | Descartes | 1.41 | 182.71 |
| UBASH3B | 0.0008351 | 387 | GTEx | DepMap | Descartes | 0.17 | 6.78 |
| FLNA | 0.0006747 | 498 | GTEx | DepMap | Descartes | 0.74 | 21.41 |
| TLN1 | 0.0006404 | 534 | GTEx | DepMap | Descartes | 0.87 | 21.40 |
| RAP1B | 0.0006136 | 564 | GTEx | DepMap | Descartes | 1.08 | 18.02 |
| ZYX | 0.0005900 | 597 | GTEx | DepMap | Descartes | 0.66 | 61.77 |
| GSN | 0.0005311 | 664 | GTEx | DepMap | Descartes | 1.55 | 48.78 |
| PSTPIP2 | 0.0004377 | 805 | GTEx | DepMap | Descartes | 0.16 | 12.06 |
| SPN | 0.0003661 | 925 | GTEx | DepMap | Descartes | 0.17 | 4.61 |
| STOM | 0.0003578 | 940 | GTEx | DepMap | Descartes | 0.54 | 36.86 |
| ACTN1 | 0.0003177 | 1035 | GTEx | DepMap | Descartes | 0.43 | 18.79 |
| TGFB1 | 0.0003097 | 1053 | GTEx | DepMap | Descartes | 0.82 | 64.63 |
| MCTP1 | 0.0002775 | 1143 | GTEx | DepMap | Descartes | 0.10 | 3.59 |
| MYH9 | 0.0001856 | 1514 | GTEx | DepMap | Descartes | 0.49 | 14.30 |
| ITGB3 | 0.0001717 | 1587 | GTEx | DepMap | Descartes | 0.00 | 0.19 |
| SLC2A3 | 0.0001695 | 1591 | GTEx | DepMap | Descartes | 0.72 | 36.36 |
| GP1BA | 0.0000995 | 2045 | GTEx | DepMap | Descartes | 0.00 | 0.23 |
| FLI1 | 0.0000659 | 2399 | GTEx | DepMap | Descartes | 0.13 | 5.39 |
| HIPK2 | 0.0000033 | 3459 | GTEx | DepMap | Descartes | 0.22 | 3.35 |
| SLC24A3 | -0.0000077 | 3860 | GTEx | DepMap | Descartes | 0.00 | 0.21 |
| ARHGAP6 | -0.0000210 | 4584 | GTEx | DepMap | Descartes | 0.01 | 0.11 |
| TUBB1 | -0.0000273 | 4943 | GTEx | DepMap | Descartes | 0.00 | 0.06 |
| P2RX1 | -0.0000416 | 5764 | GTEx | DepMap | Descartes | 0.01 | 0.94 |
Descartes Lyphoid markers
Top 50 marker genes of Lyphoid cells in the Decartes fetal adrenal single cell map (https://atlas.brotmanbaty.org/bbi/human-gene-expression-during-development/cell/lymphoid/in/adrenal)
Wilcoxon ranksum test P-value for gene set overrepresentation: 9.89e-01
Mean rank of genes in gene set: 7558.9
Median rank of genes in gene set: 10256.5
Rank on gene expression program of top 30 genes in gene set:
| Genes | Weight | Rank | GTEx | DepMap | Descartes | Mean.Counts | Mean.TPM |
|---|---|---|---|---|---|---|---|
| B2M | 0.0012926 | 218 | GTEx | DepMap | Descartes | 101.52 | 8715.55 |
| LCP1 | 0.0007723 | 421 | GTEx | DepMap | Descartes | 1.51 | 84.59 |
| ARHGDIB | 0.0006728 | 500 | GTEx | DepMap | Descartes | 4.16 | 730.52 |
| CD44 | 0.0006484 | 526 | GTEx | DepMap | Descartes | 1.79 | 84.85 |
| MSN | 0.0005720 | 618 | GTEx | DepMap | Descartes | 0.99 | 57.14 |
| PLEKHA2 | 0.0004093 | 853 | GTEx | DepMap | Descartes | 0.25 | 10.33 |
| WIPF1 | 0.0002813 | 1134 | GTEx | DepMap | Descartes | 0.65 | 29.83 |
| TMSB10 | 0.0000758 | 2283 | GTEx | DepMap | Descartes | 54.29 | 23427.35 |
| ITPKB | 0.0000625 | 2440 | GTEx | DepMap | Descartes | 0.05 | 1.62 |
| MBNL1 | 0.0000622 | 2445 | GTEx | DepMap | Descartes | 0.55 | 19.24 |
| SP100 | 0.0000574 | 2503 | GTEx | DepMap | Descartes | 0.47 | 17.38 |
| IKZF1 | 0.0000430 | 2700 | GTEx | DepMap | Descartes | 0.29 | 10.77 |
| DOCK10 | 0.0000117 | 3282 | GTEx | DepMap | Descartes | 0.23 | 7.06 |
| ARID5B | -0.0000012 | 3603 | GTEx | DepMap | Descartes | 0.35 | 10.59 |
| PTPRC | -0.0000017 | 3620 | GTEx | DepMap | Descartes | 1.41 | 55.75 |
| RCSD1 | -0.0000303 | 5116 | GTEx | DepMap | Descartes | 0.25 | 10.47 |
| CELF2 | -0.0000562 | 6623 | GTEx | DepMap | Descartes | 0.53 | 14.81 |
| PITPNC1 | -0.0000757 | 7659 | GTEx | DepMap | Descartes | 0.16 | 5.06 |
| MCTP2 | -0.0001134 | 9386 | GTEx | DepMap | Descartes | 0.01 | 0.22 |
| ARHGAP15 | -0.0001191 | 9598 | GTEx | DepMap | Descartes | 0.22 | 14.52 |
| CCL5 | -0.0001396 | 10233 | GTEx | DepMap | Descartes | 0.63 | 91.53 |
| SAMD3 | -0.0001415 | 10280 | GTEx | DepMap | Descartes | 0.01 | 0.43 |
| PRKCH | -0.0001509 | 10507 | GTEx | DepMap | Descartes | 0.07 | 3.92 |
| BACH2 | -0.0001569 | 10646 | GTEx | DepMap | Descartes | 0.05 | 1.13 |
| SORL1 | -0.0001572 | 10654 | GTEx | DepMap | Descartes | 0.28 | 5.99 |
| ABLIM1 | -0.0001886 | 11235 | GTEx | DepMap | Descartes | 0.07 | 1.89 |
| SCML4 | -0.0001893 | 11245 | GTEx | DepMap | Descartes | 0.02 | 1.08 |
| RAP1GAP2 | -0.0001895 | 11248 | GTEx | DepMap | Descartes | 0.05 | 1.54 |
| ETS1 | -0.0001933 | 11301 | GTEx | DepMap | Descartes | 0.07 | 1.53 |
| BCL2 | -0.0001934 | 11302 | GTEx | DepMap | Descartes | 0.19 | 5.48 |
Below shows the ranks on this GEP for immune marker gene lists curated by CellTypist (https://www.celltypist.org/encyclopedia).
High ranks indicate this gene is a driver of this GEP.
These curated gene list are ranked by P-value (on this GEP) of their constituent genes.
The Mean Count column shows the mean read count in cells scoring highly (H > 50) on this gene expression program.
Myelocytes: Myelocytes (model markers)
early granulocyte precursors that are derive from promyelocytes and later mature into metamyelocytes:
Wilcoxon ranksum test P-value for gene set overrepresentation: 1.26e-04
Mean rank of genes in gene set: 346.4
Rank on gene expression program of genes in gene set:
| Genes | Weight | Rank | GTEx | DepMap | Decartes | Mean.Counts | Mean.TPM |
|---|---|---|---|---|---|---|---|
| FTH1 | 0.0035559 | 31 | GTEx | DepMap | Descartes | 154.58 | 27938.67 |
| TYROBP | 0.0028541 | 44 | GTEx | DepMap | Descartes | 22.46 | 8139.71 |
| ACTB | 0.0016508 | 145 | GTEx | DepMap | Descartes | 37.41 | 3710.50 |
| SRGN | 0.0010305 | 287 | GTEx | DepMap | Descartes | 12.52 | 2377.60 |
| S100A6 | 0.0002574 | 1225 | GTEx | DepMap | Descartes | 4.80 | 1617.56 |
Monocytes: Monocytes (model markers)
myeloid mononuclear recirculating leukocytes that are capable of differentiating into macrophages and myeloid lineage dendritic cells:
Wilcoxon ranksum test P-value for gene set overrepresentation: 1.90e-03
Mean rank of genes in gene set: 220.67
Rank on gene expression program of genes in gene set:
| Genes | Weight | Rank | GTEx | DepMap | Decartes | Mean.Counts | Mean.TPM |
|---|---|---|---|---|---|---|---|
| TYROBP | 0.0028541 | 44 | GTEx | DepMap | Descartes | 22.46 | 8139.71 |
| SAT1 | 0.0014530 | 184 | GTEx | DepMap | Descartes | 29.48 | 5542.64 |
| NEAT1 | 0.0007572 | 434 | GTEx | DepMap | Descartes | 8.86 | 90.32 |
DC: DC2 (model markers)
conventional type 2 dendritic cells which constitute the major subset of myeloid dendritic cells:
Wilcoxon ranksum test P-value for gene set overrepresentation: 5.72e-03
Mean rank of genes in gene set: 986
Rank on gene expression program of genes in gene set:
| Genes | Weight | Rank | GTEx | DepMap | Decartes | Mean.Counts | Mean.TPM |
|---|---|---|---|---|---|---|---|
| MMP9 | 0.0043965 | 14 | GTEx | DepMap | Descartes | 2.77 | 194.81 |
| CST3 | 0.0003793 | 904 | GTEx | DepMap | Descartes | 15.58 | 959.23 |
| AGRP | 0.0000999 | 2040 | GTEx | DepMap | Descartes | 0.01 | 5.71 |