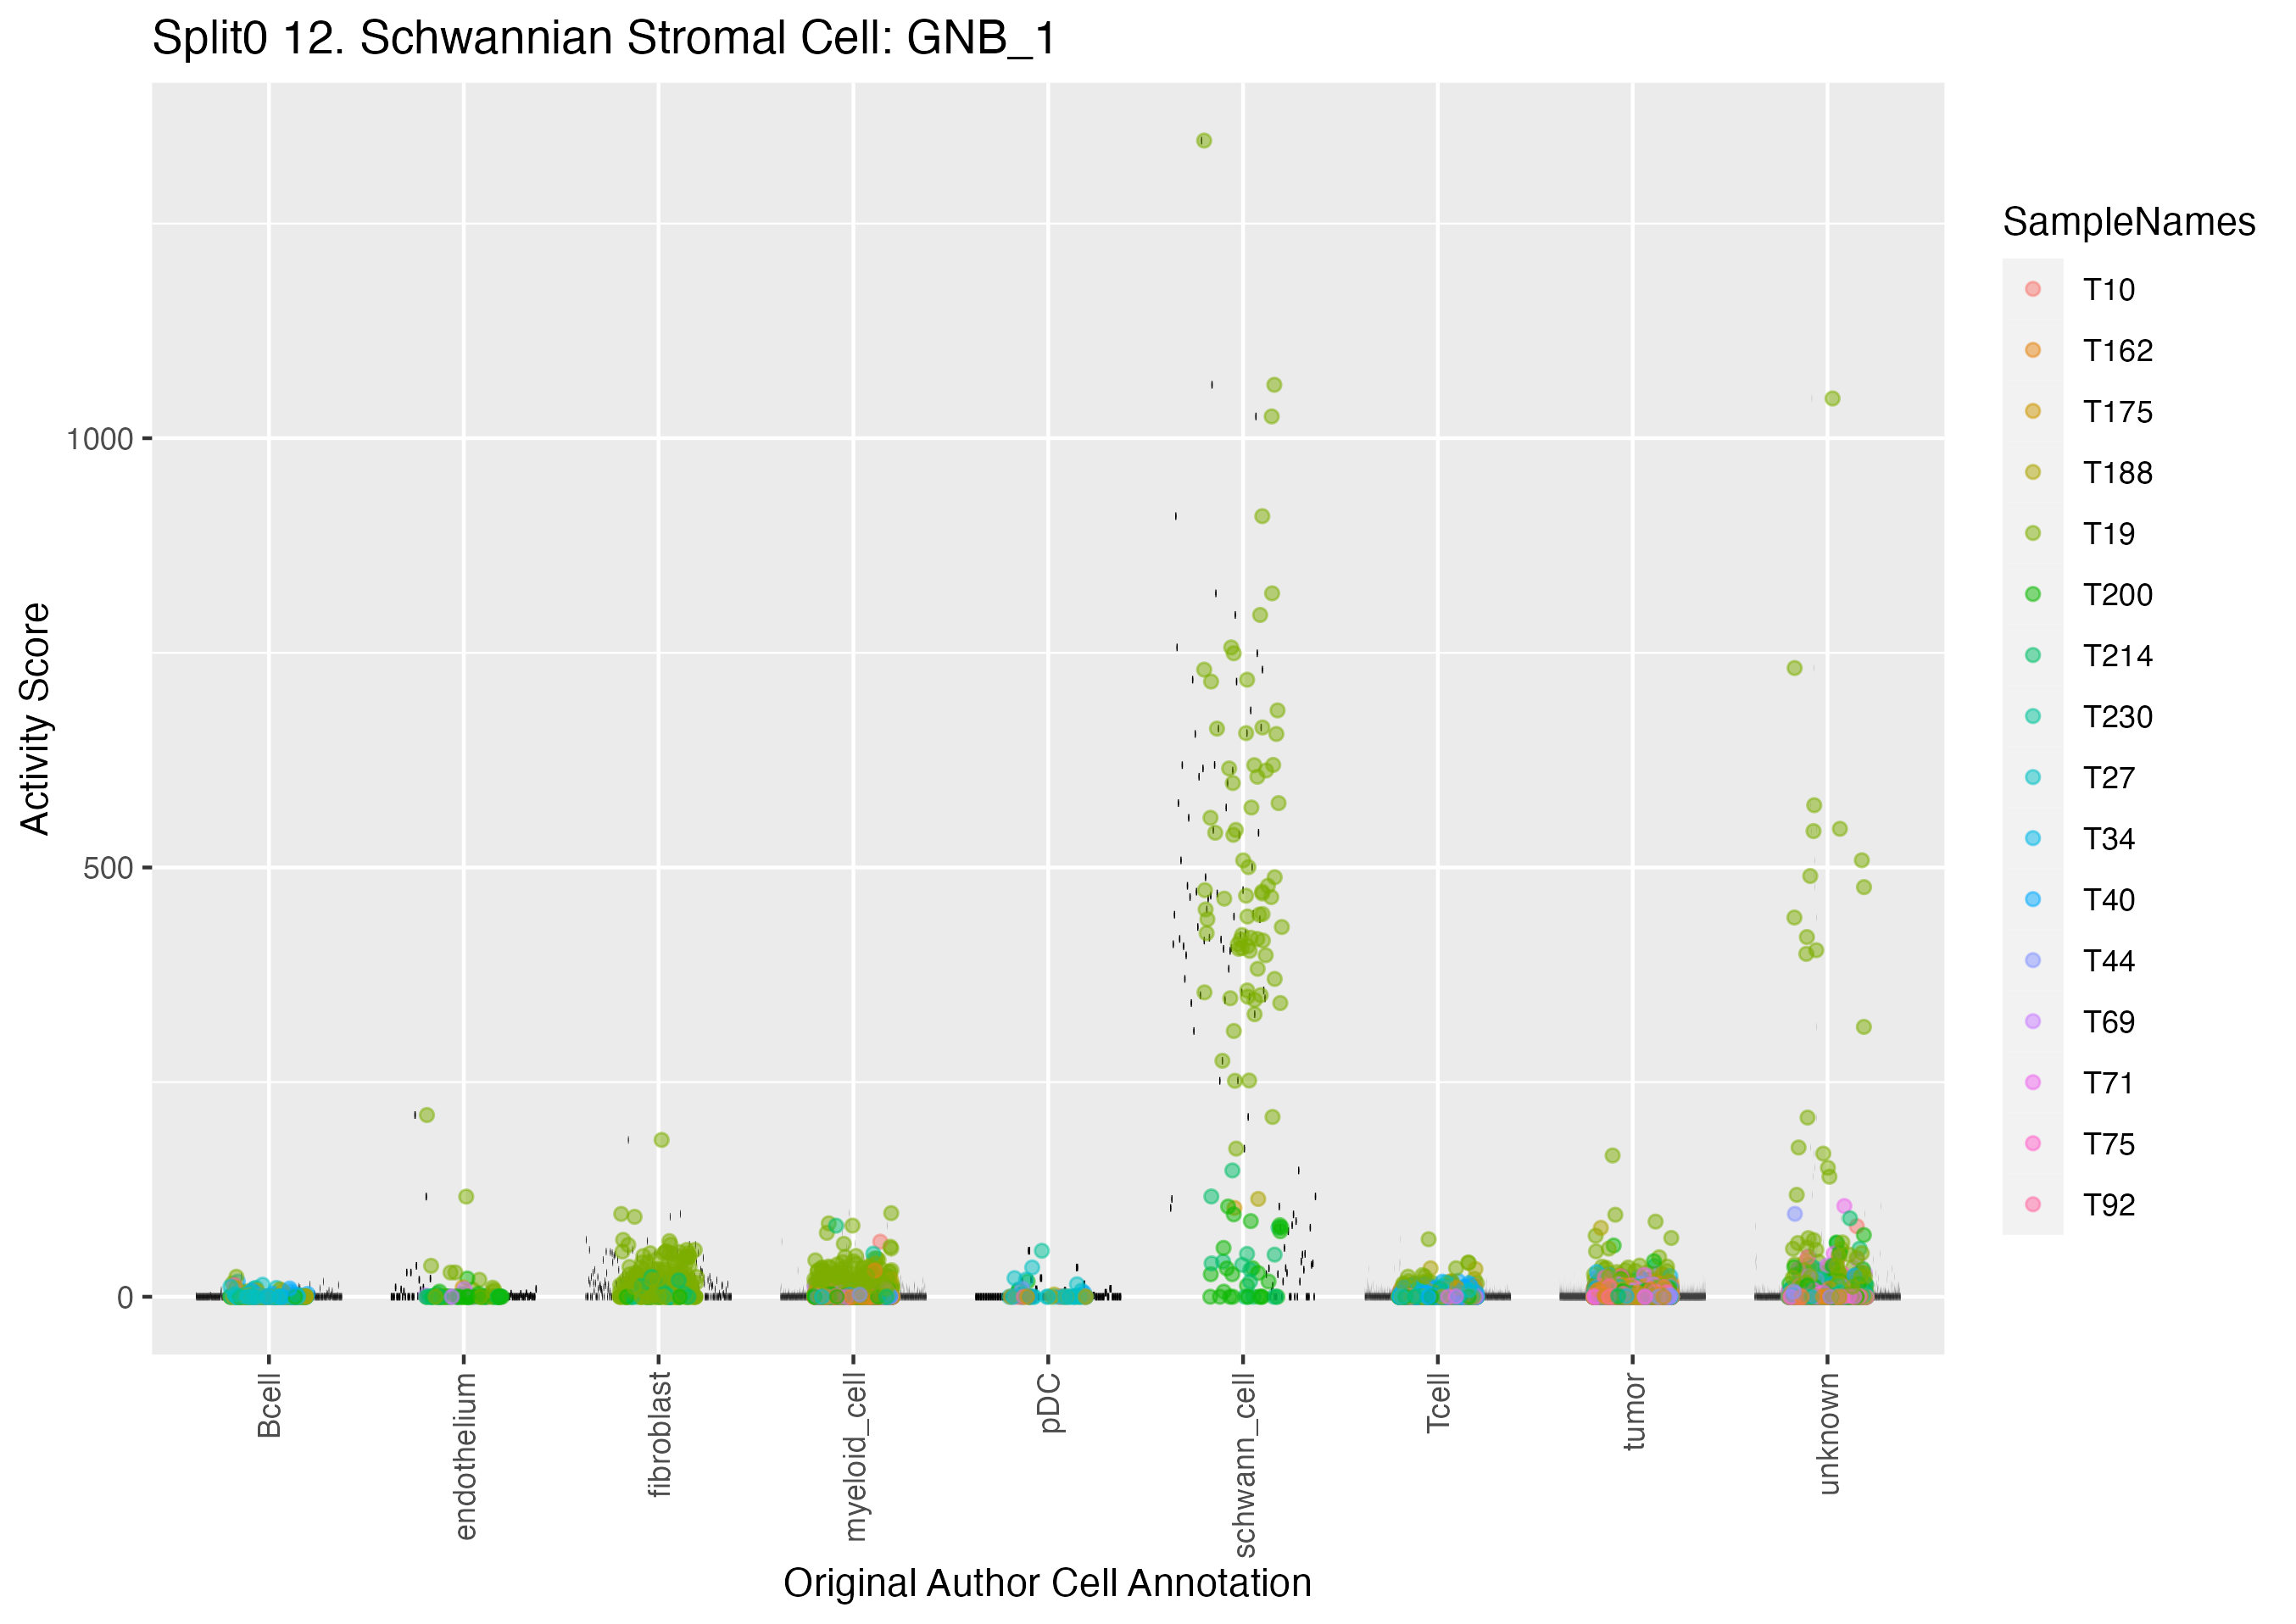
Program: 12. Schwannian Stromal Cell: GNB.
Submit a comment on this gene expression program’s interpretation: CLICK
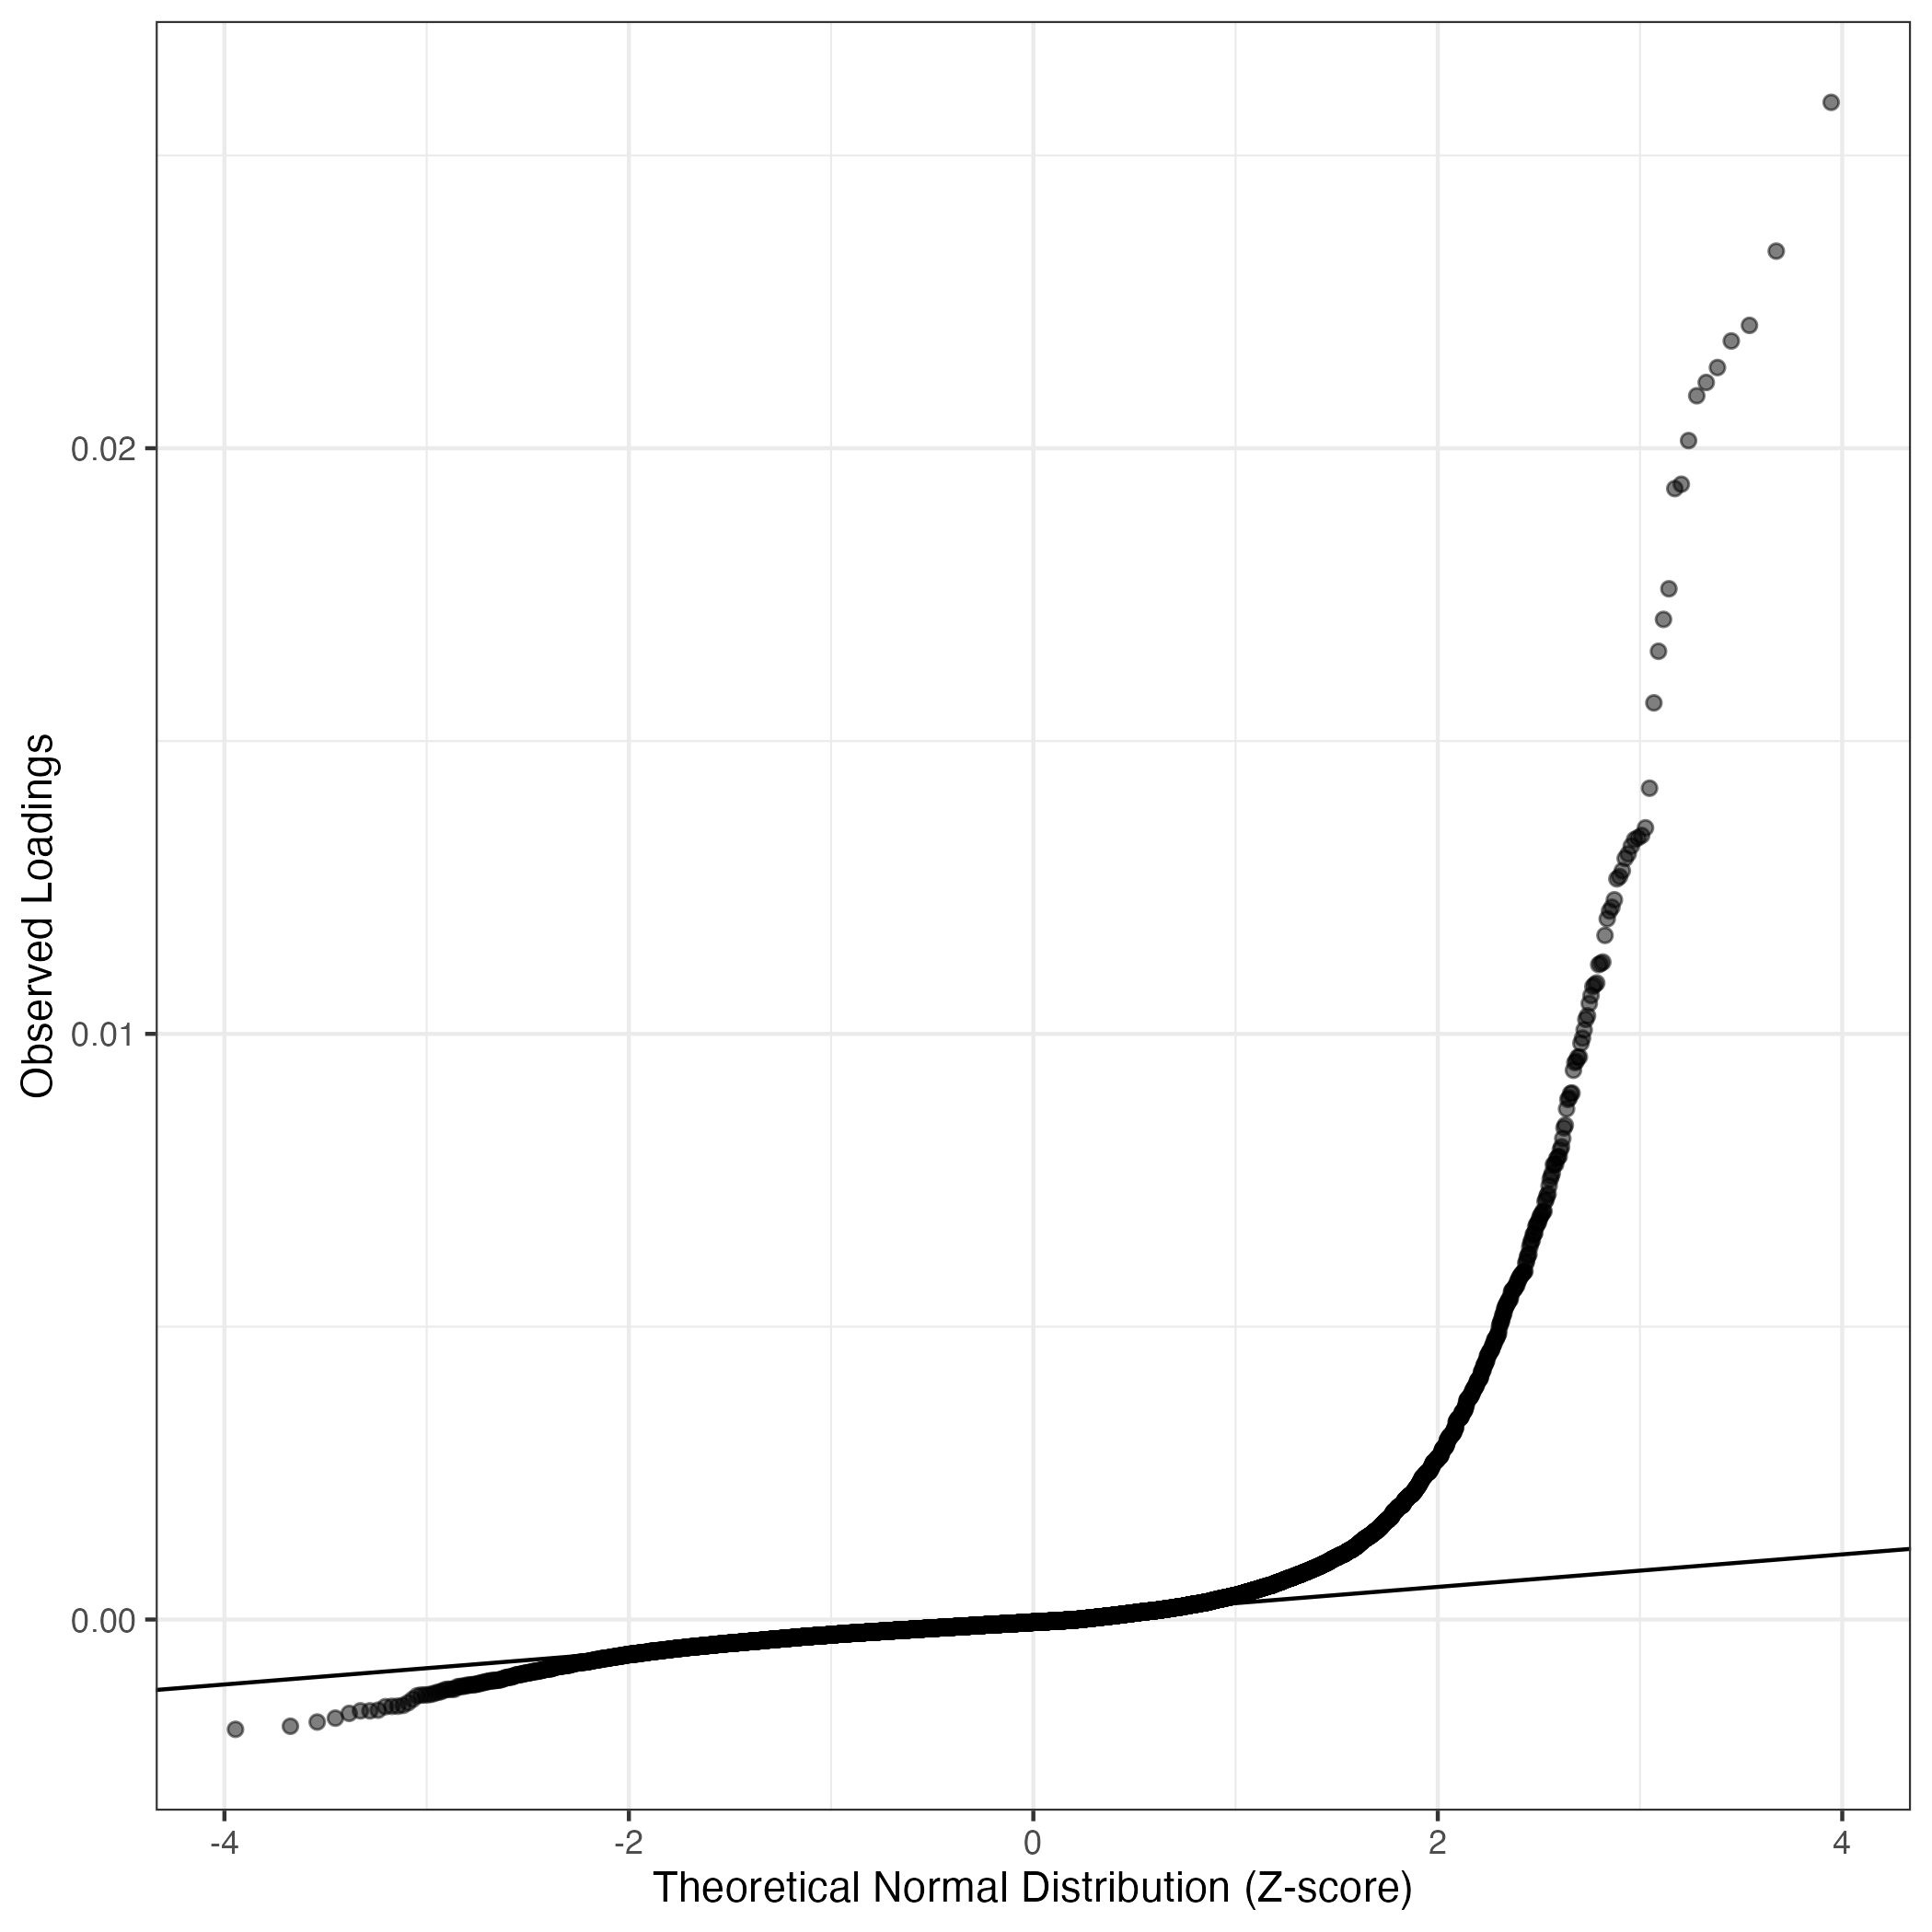
QQ-plot of gene loadings, averaged over both independent splits of the data
This plot highlights the relative contribution of each gene to the GEP
Top genes driving this program.
Note: Decartes website is buggy, try refreshing. Also, Decartes fetal adrenal data have been collected at specific time points (89-122 days), all possible cell types of interest may not be represented, do not overinterpret.
The Mean Count column shows the mean read count in cells scoring highly (H > 50) on this gene expression program.
| Gene | Loading | Gene.Name | GTEx | DepMap | Descartes | Mean.Counts | Mean.Tpm | |
|---|---|---|---|---|---|---|---|---|
| 1 | S100B | 0.0259059 | S100 calcium binding protein B | GTEx | DepMap | Descartes | 21.89 | 9074.86 |
| 2 | PLP1 | 0.0233658 | proteolipid protein 1 | GTEx | DepMap | Descartes | 4.44 | 653.76 |
| 3 | LGI4 | 0.0220981 | leucine rich repeat LGI family member 4 | GTEx | DepMap | Descartes | 2.78 | 437.06 |
| 4 | FXYD1 | 0.0218314 | FXYD domain containing ion transport regulator 1 | GTEx | DepMap | Descartes | 3.71 | 1797.47 |
| 5 | SEMA3B | 0.0213777 | semaphorin 3B | GTEx | DepMap | Descartes | 3.61 | 511.41 |
| 6 | IL34 | 0.0211231 | interleukin 34 | GTEx | DepMap | Descartes | 1.42 | 390.19 |
| 7 | ITGB8 | 0.0208961 | integrin subunit beta 8 | GTEx | DepMap | Descartes | 2.60 | 134.09 |
| 8 | MIA | 0.0201307 | MIA SH3 domain containing | GTEx | DepMap | Descartes | 4.06 | 2885.00 |
| 9 | CMTM5 | 0.0193852 | CKLF like MARVEL transmembrane domain containing 5 | GTEx | DepMap | Descartes | 0.83 | 202.13 |
| 10 | GPM6B | 0.0193109 | glycoprotein M6B | GTEx | DepMap | Descartes | 4.63 | 521.26 |
| 11 | ITIH5 | 0.0176003 | inter-alpha-trypsin inhibitor heavy chain 5 | GTEx | DepMap | Descartes | 0.79 | 47.44 |
| 12 | GATM | 0.0170773 | glycine amidinotransferase | GTEx | DepMap | Descartes | 1.55 | 170.83 |
| 13 | COL14A1 | 0.0165330 | collagen type XIV alpha 1 chain | GTEx | DepMap | Descartes | 1.46 | 85.43 |
| 14 | SBSPON | 0.0156522 | somatomedin B and thrombospondin type 1 domain containing | GTEx | DepMap | Descartes | 0.98 | NA |
| 15 | ALDH1A1 | 0.0141950 | aldehyde dehydrogenase 1 family member A1 | GTEx | DepMap | Descartes | 1.25 | 273.89 |
| 16 | RARRES2 | 0.0135186 | retinoic acid receptor responder 2 | GTEx | DepMap | Descartes | 4.67 | 982.41 |
| 17 | ST6GALNAC2 | 0.0133881 | ST6 N-acetylgalactosaminide alpha-2,6-sialyltransferase 2 | GTEx | DepMap | Descartes | 0.61 | 164.14 |
| 18 | ARHGAP15 | 0.0133487 | Rho GTPase activating protein 15 | GTEx | DepMap | Descartes | 1.94 | 309.44 |
| 19 | PLLP | 0.0133173 | plasmolipin | GTEx | DepMap | Descartes | 0.54 | 36.07 |
| 20 | PON2 | 0.0132064 | paraoxonase 2 | GTEx | DepMap | Descartes | 0.95 | 221.05 |
| 21 | MPZ | 0.0130732 | myelin protein zero | GTEx | DepMap | Descartes | 2.96 | 710.50 |
| 22 | DHH | 0.0129963 | desert hedgehog signaling molecule | GTEx | DepMap | Descartes | 0.23 | 22.51 |
| 23 | ERBB3 | 0.0127857 | erb-b2 receptor tyrosine kinase 3 | GTEx | DepMap | Descartes | 0.87 | 62.27 |
| 24 | IFITM3 | 0.0126861 | interferon induced transmembrane protein 3 | GTEx | DepMap | Descartes | 20.43 | 11724.91 |
| 25 | EMP2 | 0.0126473 | epithelial membrane protein 2 | GTEx | DepMap | Descartes | 1.45 | 119.10 |
| 26 | ASPA | 0.0122893 | aspartoacylase | GTEx | DepMap | Descartes | 0.27 | 22.38 |
| 27 | CTNNAL1 | 0.0121621 | catenin alpha like 1 | GTEx | DepMap | Descartes | 2.36 | 442.67 |
| 28 | PLEKHA4 | 0.0120986 | pleckstrin homology domain containing A4 | GTEx | DepMap | Descartes | 0.90 | 113.42 |
| 29 | RELN | 0.0119647 | reelin | GTEx | DepMap | Descartes | 0.54 | 22.46 |
| 30 | TTYH1 | 0.0116816 | tweety family member 1 | GTEx | DepMap | Descartes | 0.85 | 95.20 |
| 31 | NTM | 0.0112259 | neurotrimin | GTEx | DepMap | Descartes | 0.99 | 120.29 |
| 32 | S100A6 | 0.0112022 | S100 calcium binding protein A6 | GTEx | DepMap | Descartes | 25.86 | 14753.98 |
| 33 | LGALS3BP | 0.0111826 | galectin 3 binding protein | GTEx | DepMap | Descartes | 4.94 | 957.57 |
| 34 | PRIMA1 | 0.0108692 | proline rich membrane anchor 1 | GTEx | DepMap | Descartes | 0.46 | 62.92 |
| 35 | MICALL2 | 0.0108402 | MICAL like 2 | GTEx | DepMap | Descartes | 0.72 | 58.22 |
| 36 | SOX2 | 0.0108086 | SRY-box transcription factor 2 | GTEx | DepMap | Descartes | 0.62 | 108.15 |
| 37 | MOXD1 | 0.0106558 | monooxygenase DBH like 1 | GTEx | DepMap | Descartes | 0.21 | 33.44 |
| 38 | SMIM5 | 0.0105195 | small integral membrane protein 5 | GTEx | DepMap | Descartes | 0.32 | NA |
| 39 | MATN2 | 0.0103090 | matrilin 2 | GTEx | DepMap | Descartes | 0.91 | 92.52 |
| 40 | FXYD3 | 0.0102472 | FXYD domain containing ion transport regulator 3 | GTEx | DepMap | Descartes | 0.17 | 59.40 |
| 41 | LGI1 | 0.0100682 | leucine rich glioma inactivated 1 | GTEx | DepMap | Descartes | 0.26 | 21.29 |
| 42 | LGALS1 | 0.0099273 | galectin 1 | GTEx | DepMap | Descartes | 22.85 | 13754.31 |
| 43 | FSTL3 | 0.0098393 | follistatin like 3 | GTEx | DepMap | Descartes | 1.33 | 179.50 |
| 44 | GPR37L1 | 0.0096070 | G protein-coupled receptor 37 like 1 | GTEx | DepMap | Descartes | 0.10 | 5.80 |
| 45 | SHC4 | 0.0096020 | SHC adaptor protein 4 | GTEx | DepMap | Descartes | 0.30 | 25.04 |
| 46 | TSC22D4 | 0.0095335 | TSC22 domain family member 4 | GTEx | DepMap | Descartes | 1.67 | 296.83 |
| 47 | SCN7A | 0.0095106 | sodium voltage-gated channel alpha subunit 7 | GTEx | DepMap | Descartes | 1.28 | 82.15 |
| 48 | PRSS23 | 0.0093791 | serine protease 23 | GTEx | DepMap | Descartes | 1.67 | 146.03 |
| 49 | TIMP3 | 0.0089899 | TIMP metallopeptidase inhibitor 3 | GTEx | DepMap | Descartes | 3.69 | 295.24 |
| 50 | PROS1 | 0.0089815 | protein S | GTEx | DepMap | Descartes | 0.66 | 88.89 |
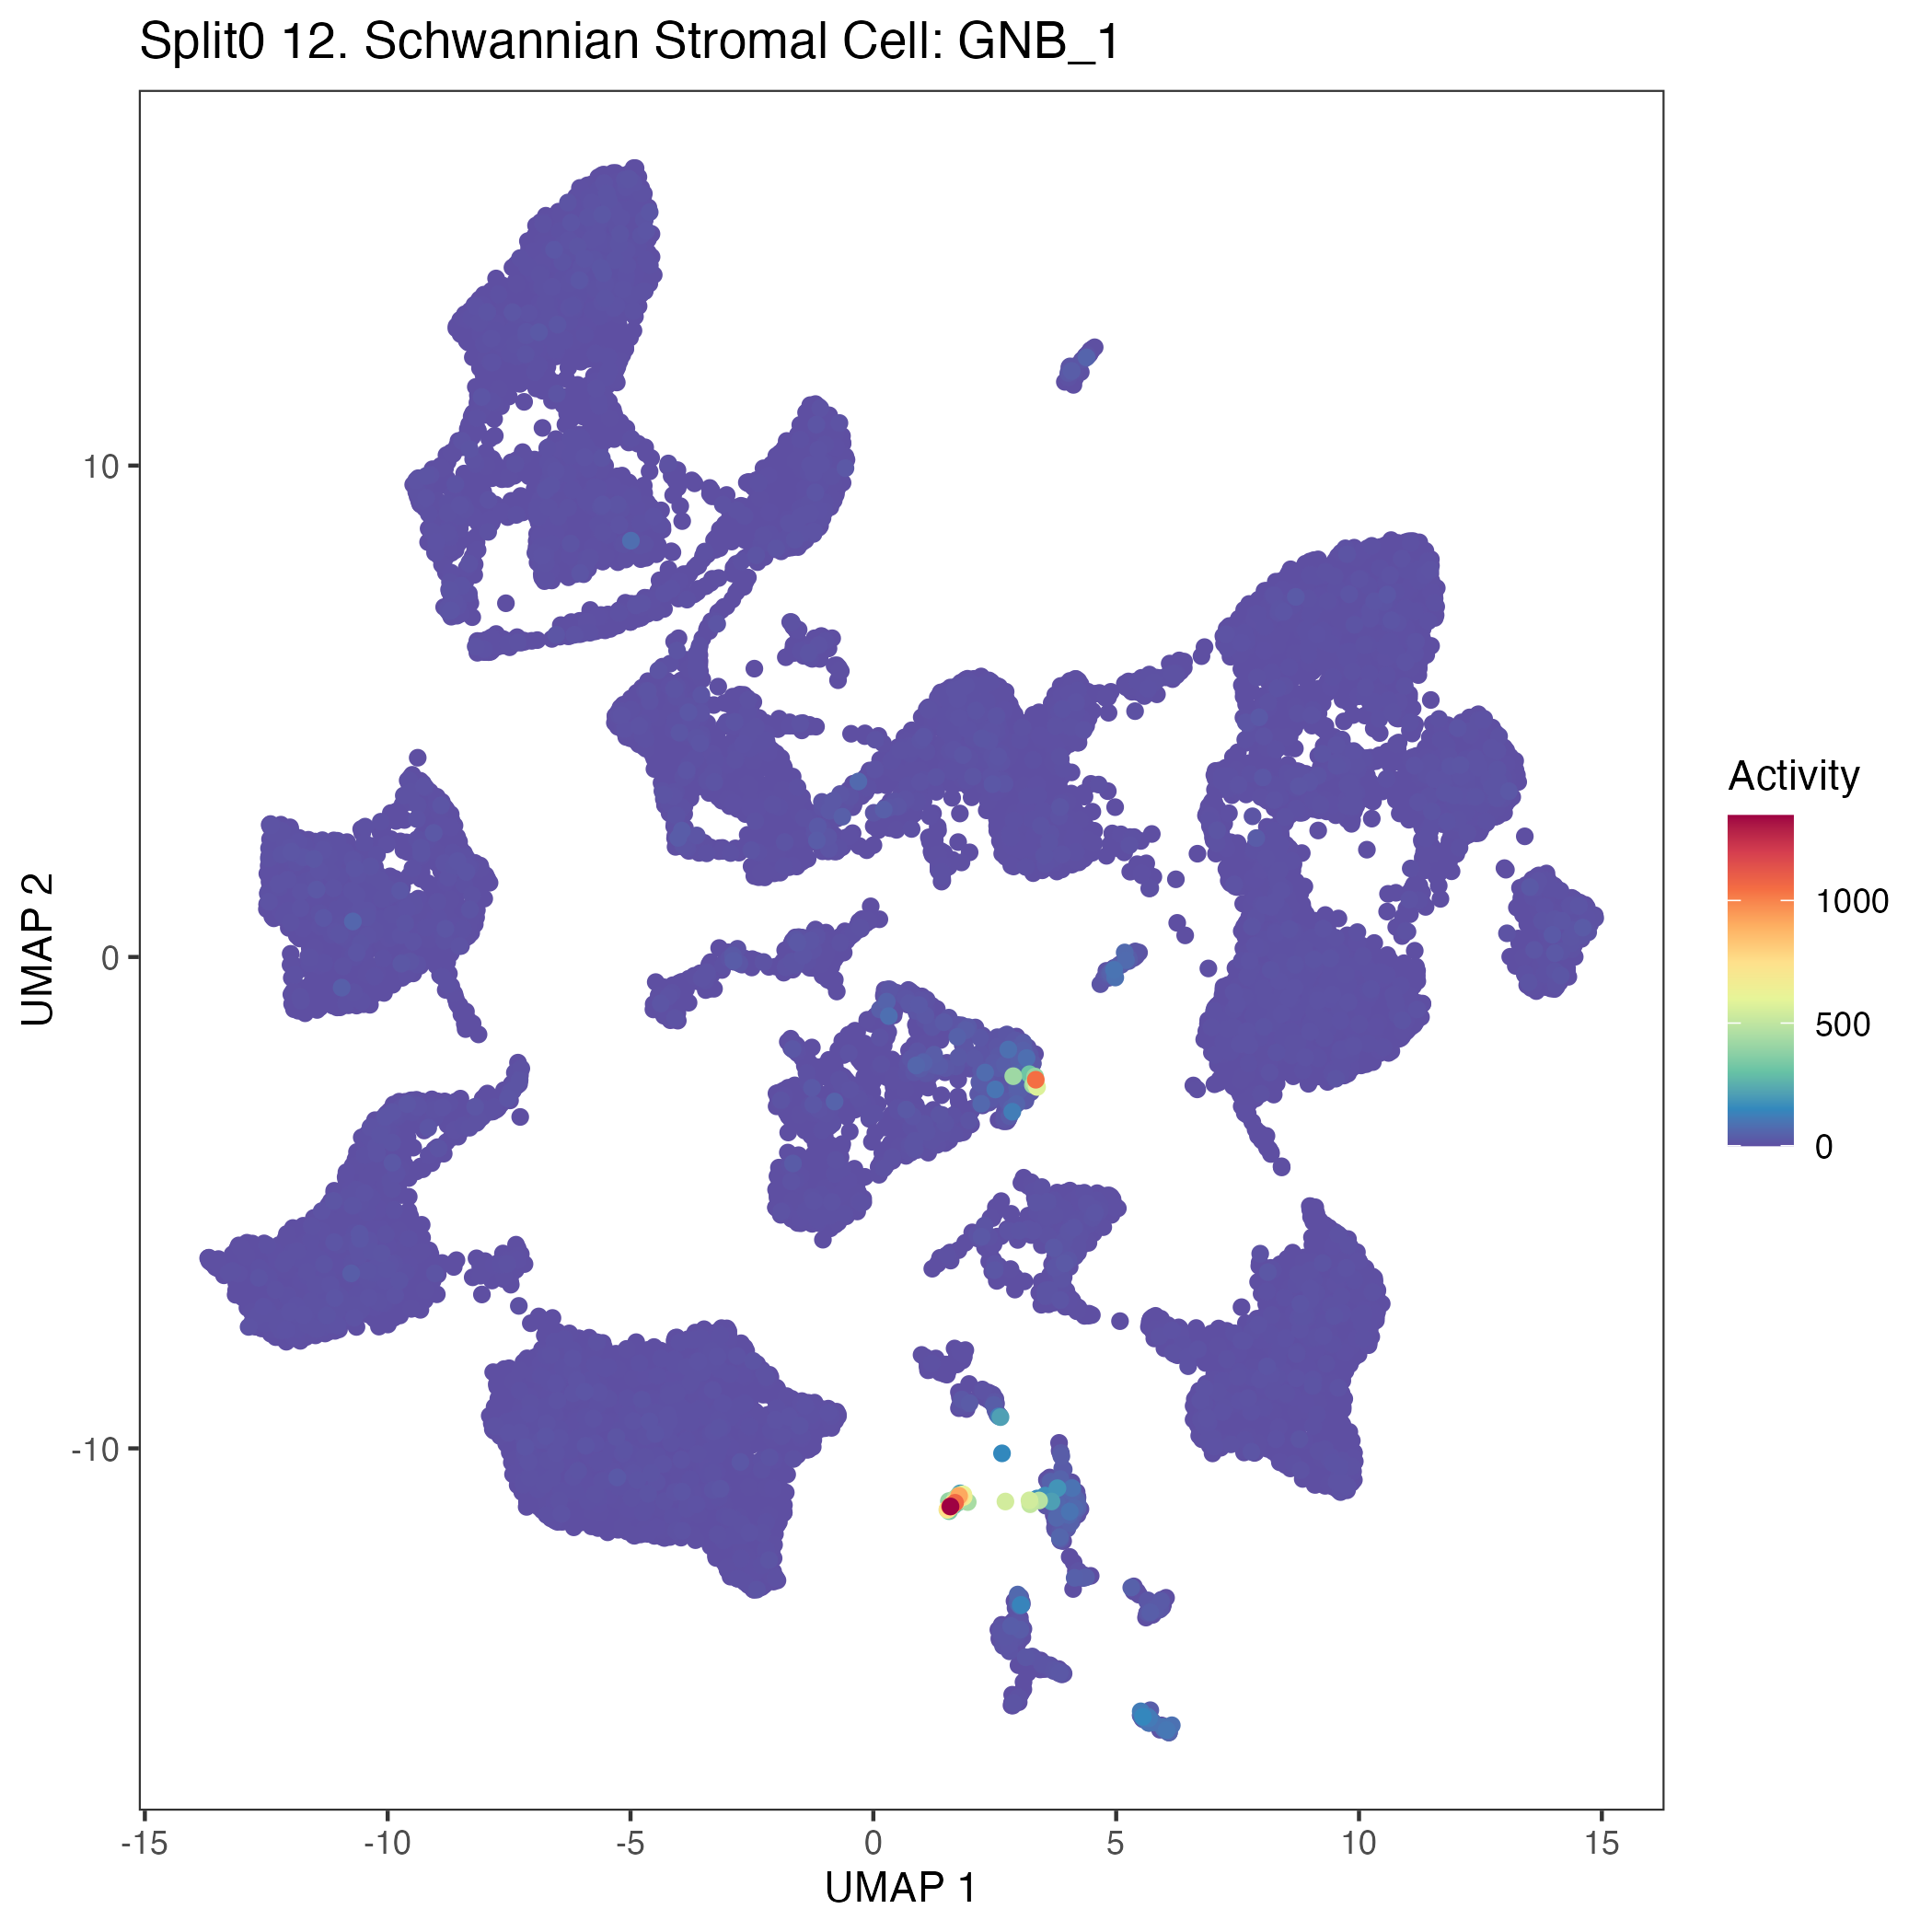
UMAP plots showing activity of gene expression program identified in GEP 12. Schwannian Stromal Cell: GNB:
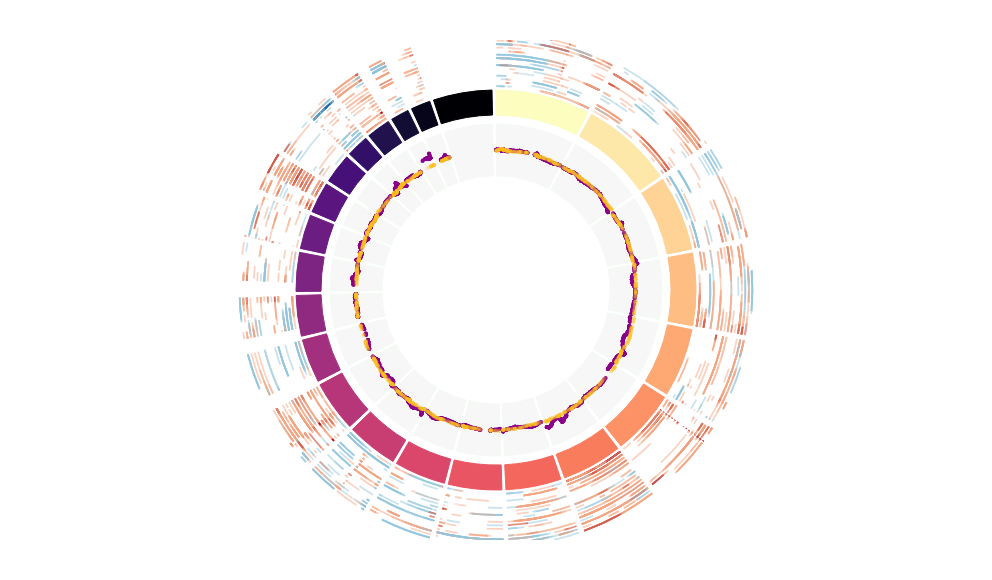
CNV Data procured from inferCNV.
Outer tracks are putative CNV regions (gains = red, losses = blue) for each patient
Inner track is expression data representing:
The top cells expressing this GEP (purple)
Random cells (n =50) from the reference set used in inferCNV (orange)
Gene set Enrichments for this program, caculated from top 50 genes
mSigDB Cell Types Gene Set:
| P-value | OR | Lower 95% CI | FDR | FWER | Genes Found | Gene Set Size | |
|---|---|---|---|---|---|---|---|
| DURANTE_ADULT_OLFACTORY_NEUROEPITHELIUM_OLFACTORY_ENSHEATHING_GLIA | 7.75e-37 | 126.42 | 66.69 | 5.20e-34 | 5.20e-34 | 24S100B, PLP1, LGI4, FXYD1, SEMA3B, ITGB8, MIA, CMTM5, GPM6B, ITIH5, ALDH1A1, RARRES2, ARHGAP15, PON2, MPZ, ERBB3, IFITM3, PLEKHA4, TTYH1, LGALS1, GPR37L1, TSC22D4, SCN7A, TIMP3 |
115 |
| DESCARTES_FETAL_HEART_SCHWANN_CELLS | 2.37e-19 | 80.98 | 37.41 | 7.96e-17 | 1.59e-16 | 13S100B, PLP1, LGI4, MIA, ITIH5, ALDH1A1, ST6GALNAC2, MPZ, ERBB3, ASPA, PLEKHA4, PRIMA1, SHC4 |
67 |
| DESCARTES_FETAL_PANCREAS_ENS_GLIA | 4.04e-15 | 55.82 | 24.65 | 5.42e-13 | 2.71e-12 | 11S100B, PLP1, LGI4, MIA, CMTM5, MPZ, ERBB3, ASPA, PRIMA1, SOX2, SHC4 |
74 |
| DESCARTES_FETAL_ADRENAL_SCHWANN_CELLS | 9.39e-19 | 46.91 | 23.13 | 2.10e-16 | 6.30e-16 | 15S100B, PLP1, LGI4, FXYD1, MIA, GPM6B, ALDH1A1, MPZ, DHH, ERBB3, TTYH1, PRIMA1, SOX2, SHC4, SCN7A |
129 |
| DESCARTES_FETAL_INTESTINE_ENS_GLIA | 1.05e-12 | 55.84 | 22.64 | 1.17e-10 | 7.01e-10 | 9S100B, PLP1, LGI4, CMTM5, MPZ, TTYH1, PRIMA1, SOX2, SHC4 |
58 |
| DESCARTES_MAIN_FETAL_SCHWANN_CELLS | 1.91e-11 | 55.20 | 21.15 | 1.61e-09 | 1.28e-08 | 8S100B, PLP1, MIA, MPZ, DHH, ASPA, LGI1, SCN7A |
51 |
| DESCARTES_FETAL_MUSCLE_SCHWANN_CELLS | 4.80e-16 | 42.17 | 19.96 | 8.05e-14 | 3.22e-13 | 13S100B, PLP1, SEMA3B, ITGB8, PLLP, MPZ, DHH, ASPA, PLEKHA4, TTYH1, PRIMA1, SOX2, MOXD1 |
117 |
| DESCARTES_FETAL_STOMACH_ENS_GLIA | 3.10e-08 | 40.47 | 13.39 | 1.73e-06 | 2.08e-05 | 6S100B, PLP1, LGI4, MPZ, PRIMA1, MOXD1 |
48 |
| ZHONG_PFC_MAJOR_TYPES_OPC | 2.21e-09 | 28.66 | 11.27 | 1.48e-07 | 1.48e-06 | 8S100B, ITGB8, GPM6B, GATM, PLLP, PON2, TTYH1, TSC22D4 |
91 |
| HU_FETAL_RETINA_MULLER | 6.13e-07 | 37.43 | 10.99 | 2.74e-05 | 4.11e-04 | 5PLP1, LGI4, GPM6B, TTYH1, SOX2 |
42 |
| FAN_EMBRYONIC_CTX_BIG_GROUPS_GLIAL | 2.03e-09 | 22.12 | 9.25 | 1.48e-07 | 1.37e-06 | 9S100B, ITGB8, GPM6B, GATM, PON2, TTYH1, NTM, SOX2, TSC22D4 |
133 |
| ZHONG_PFC_MAJOR_TYPES_ASTROCYTES | 1.34e-11 | 15.63 | 7.71 | 1.28e-09 | 8.96e-09 | 14S100B, FXYD1, GPM6B, GATM, PON2, IFITM3, TTYH1, LGALS3BP, SOX2, LGI1, LGALS1, GPR37L1, TSC22D4, TIMP3 |
325 |
| ZHONG_PFC_C9_ORG_OTHER | 8.45e-07 | 22.11 | 7.48 | 3.34e-05 | 5.67e-04 | 6ITGB8, GPM6B, GATM, TTYH1, NTM, MOXD1 |
83 |
| CUI_DEVELOPING_HEART_C6_EPICARDIAL_CELL | 3.37e-09 | 16.89 | 7.41 | 2.06e-07 | 2.26e-06 | 10SEMA3B, ITGB8, SBSPON, RARRES2, PLLP, PLEKHA4, S100A6, LGALS3BP, PRSS23, PROS1 |
195 |
| AIZARANI_LIVER_C21_STELLATE_CELLS_1 | 5.33e-08 | 14.83 | 6.24 | 2.75e-06 | 3.58e-05 | 9COL14A1, ALDH1A1, IFITM3, LGALS3BP, MATN2, LGALS1, PRSS23, TIMP3, PROS1 |
194 |
| TRAVAGLINI_LUNG_ALVEOLAR_FIBROBLAST_CELL | 3.28e-06 | 12.96 | 4.84 | 1.22e-04 | 2.20e-03 | 7GPM6B, ALDH1A1, RARRES2, EMP2, MOXD1, SCN7A, TIMP3 |
164 |
| MANNO_MIDBRAIN_NEUROTYPES_HRGL2C | 3.94e-07 | 9.89 | 4.37 | 1.89e-05 | 2.65e-04 | 10ITGB8, GPM6B, GATM, PLLP, PON2, ERBB3, RELN, TTYH1, SOX2, TSC22D4 |
326 |
| TRAVAGLINI_LUNG_CAPILLARY_AEROCYTE_CELL | 6.07e-04 | 20.43 | 3.90 | 1.13e-02 | 4.07e-01 | 3EMP2, S100A6, LGALS1 |
42 |
| CUI_DEVELOPING_HEART_C5_VALVAR_CELL | 1.53e-05 | 10.12 | 3.80 | 5.11e-04 | 1.02e-02 | 7S100B, ERBB3, CTNNAL1, S100A6, MATN2, LGALS1, TIMP3 |
208 |
| MANNO_MIDBRAIN_NEUROTYPES_HRGL2B | 6.74e-07 | 8.22 | 3.77 | 2.83e-05 | 4.52e-04 | 11PLP1, ITGB8, CMTM5, GPM6B, GATM, PON2, MPZ, TTYH1, SOX2, TSC22D4, TIMP3 |
440 |
Dowload full table
mSigDB Hallmark Gene Sets:
| P-value | OR | Lower 95% CI | FDR | FWER | Genes Found | Gene Set Size | |
|---|---|---|---|---|---|---|---|
| HALLMARK_EPITHELIAL_MESENCHYMAL_TRANSITION | 1.08e-03 | 7.12 | 2.18 | 5.40e-02 | 5.40e-02 | 5NTM, MATN2, LGALS1, FSTL3, TIMP3 |
200 |
| HALLMARK_ESTROGEN_RESPONSE_LATE | 7.71e-03 | 5.55 | 1.44 | 1.93e-01 | 3.85e-01 | 4SEMA3B, ST6GALNAC2, EMP2, PRSS23 |
200 |
| HALLMARK_COAGULATION | 1.70e-02 | 5.91 | 1.16 | 2.83e-01 | 8.50e-01 | 3PRSS23, TIMP3, PROS1 |
138 |
| HALLMARK_APOPTOSIS | 2.53e-02 | 5.05 | 0.99 | 3.17e-01 | 1.00e+00 | 3ERBB3, IFITM3, TIMP3 |
161 |
| HALLMARK_INTERFERON_ALPHA_RESPONSE | 5.62e-02 | 5.48 | 0.64 | 5.62e-01 | 1.00e+00 | 2IFITM3, LGALS3BP |
97 |
| HALLMARK_FATTY_ACID_METABOLISM | 1.28e-01 | 3.34 | 0.39 | 8.40e-01 | 1.00e+00 | 2ALDH1A1, LGALS1 |
158 |
| HALLMARK_IL2_STAT5_SIGNALING | 1.83e-01 | 2.64 | 0.31 | 8.40e-01 | 1.00e+00 | 2ITIH5, IFITM3 |
199 |
| HALLMARK_ESTROGEN_RESPONSE_EARLY | 1.85e-01 | 2.63 | 0.31 | 8.40e-01 | 1.00e+00 | 2SEMA3B, PRSS23 |
200 |
| HALLMARK_MYOGENESIS | 1.85e-01 | 2.63 | 0.31 | 8.40e-01 | 1.00e+00 | 2FXYD1, ERBB3 |
200 |
| HALLMARK_INTERFERON_GAMMA_RESPONSE | 1.85e-01 | 2.63 | 0.31 | 8.40e-01 | 1.00e+00 | 2IFITM3, LGALS3BP |
200 |
| HALLMARK_KRAS_SIGNALING_UP | 1.85e-01 | 2.63 | 0.31 | 8.40e-01 | 1.00e+00 | 2SEMA3B, RELN |
200 |
| HALLMARK_CHOLESTEROL_HOMEOSTASIS | 2.55e-01 | 3.49 | 0.09 | 1.00e+00 | 1.00e+00 | 1SEMA3B |
74 |
| HALLMARK_PEROXISOME | 3.39e-01 | 2.48 | 0.06 | 1.00e+00 | 1.00e+00 | 1ALDH1A1 |
104 |
| HALLMARK_BILE_ACID_METABOLISM | 3.59e-01 | 2.30 | 0.06 | 1.00e+00 | 1.00e+00 | 1ALDH1A1 |
112 |
| HALLMARK_ADIPOGENESIS | 5.47e-01 | 1.28 | 0.03 | 1.00e+00 | 1.00e+00 | 1ITIH5 |
200 |
| HALLMARK_INFLAMMATORY_RESPONSE | 5.47e-01 | 1.28 | 0.03 | 1.00e+00 | 1.00e+00 | 1ITGB8 |
200 |
| HALLMARK_XENOBIOTIC_METABOLISM | 5.47e-01 | 1.28 | 0.03 | 1.00e+00 | 1.00e+00 | 1PROS1 |
200 |
| HALLMARK_TNFA_SIGNALING_VIA_NFKB | 1.00e+00 | 0.00 | 0.00 | 1.00e+00 | 1.00e+00 | 0 |
200 |
| HALLMARK_HYPOXIA | 1.00e+00 | 0.00 | 0.00 | 1.00e+00 | 1.00e+00 | 0 |
200 |
| HALLMARK_MITOTIC_SPINDLE | 1.00e+00 | 0.00 | 0.00 | 1.00e+00 | 1.00e+00 | 0 |
199 |
Dowload full table
KEGG Pathways:
| P-value | OR | Lower 95% CI | FDR | FWER | Genes Found | Gene Set Size | |
|---|---|---|---|---|---|---|---|
| KEGG_FOCAL_ADHESION | 4.30e-02 | 4.07 | 0.80 | 1.00e+00 | 1.00e+00 | 3ITGB8, RELN, SHC4 |
199 |
| KEGG_ECM_RECEPTOR_INTERACTION | 4.36e-02 | 6.35 | 0.74 | 1.00e+00 | 1.00e+00 | 2ITGB8, RELN |
84 |
| KEGG_ERBB_SIGNALING_PATHWAY | 4.64e-02 | 6.13 | 0.71 | 1.00e+00 | 1.00e+00 | 2ERBB3, SHC4 |
87 |
| KEGG_CELL_ADHESION_MOLECULES_CAMS | 9.66e-02 | 3.98 | 0.46 | 1.00e+00 | 1.00e+00 | 2ITGB8, MPZ |
133 |
| KEGG_HISTIDINE_METABOLISM | 1.09e-01 | 9.11 | 0.22 | 1.00e+00 | 1.00e+00 | 1ASPA |
29 |
| KEGG_GLYCINE_SERINE_AND_THREONINE_METABOLISM | 1.16e-01 | 8.50 | 0.20 | 1.00e+00 | 1.00e+00 | 1GATM |
31 |
| KEGG_ALANINE_ASPARTATE_AND_GLUTAMATE_METABOLISM | 1.20e-01 | 8.23 | 0.20 | 1.00e+00 | 1.00e+00 | 1ASPA |
32 |
| KEGG_ARGININE_AND_PROLINE_METABOLISM | 1.94e-01 | 4.81 | 0.12 | 1.00e+00 | 1.00e+00 | 1GATM |
54 |
| KEGG_HEDGEHOG_SIGNALING_PATHWAY | 2.00e-01 | 4.64 | 0.11 | 1.00e+00 | 1.00e+00 | 1DHH |
56 |
| KEGG_RETINOL_METABOLISM | 2.25e-01 | 4.05 | 0.10 | 1.00e+00 | 1.00e+00 | 1ALDH1A1 |
64 |
| KEGG_GLIOMA | 2.28e-01 | 3.99 | 0.10 | 1.00e+00 | 1.00e+00 | 1SHC4 |
65 |
| KEGG_COMPLEMENT_AND_COAGULATION_CASCADES | 2.40e-01 | 3.75 | 0.09 | 1.00e+00 | 1.00e+00 | 1PROS1 |
69 |
| KEGG_CHRONIC_MYELOID_LEUKEMIA | 2.52e-01 | 3.54 | 0.09 | 1.00e+00 | 1.00e+00 | 1SHC4 |
73 |
| KEGG_ARRHYTHMOGENIC_RIGHT_VENTRICULAR_CARDIOMYOPATHY_ARVC | 2.55e-01 | 3.49 | 0.09 | 1.00e+00 | 1.00e+00 | 1ITGB8 |
74 |
| KEGG_HYPERTROPHIC_CARDIOMYOPATHY_HCM | 2.81e-01 | 3.11 | 0.08 | 1.00e+00 | 1.00e+00 | 1ITGB8 |
83 |
| KEGG_DILATED_CARDIOMYOPATHY | 3.01e-01 | 2.87 | 0.07 | 1.00e+00 | 1.00e+00 | 1ITGB8 |
90 |
| KEGG_NEUROTROPHIN_SIGNALING_PATHWAY | 3.94e-01 | 2.04 | 0.05 | 1.00e+00 | 1.00e+00 | 1SHC4 |
126 |
| KEGG_AXON_GUIDANCE | 4.01e-01 | 1.99 | 0.05 | 1.00e+00 | 1.00e+00 | 1SEMA3B |
129 |
| KEGG_NATURAL_KILLER_CELL_MEDIATED_CYTOTOXICITY | 4.20e-01 | 1.88 | 0.05 | 1.00e+00 | 1.00e+00 | 1SHC4 |
137 |
| KEGG_INSULIN_SIGNALING_PATHWAY | 4.20e-01 | 1.88 | 0.05 | 1.00e+00 | 1.00e+00 | 1SHC4 |
137 |
Dowload full table
CHR Positional Gene Sets:
| P-value | OR | Lower 95% CI | FDR | FWER | Genes Found | Gene Set Size | |
|---|---|---|---|---|---|---|---|
| chr17q25 | 1.09e-01 | 2.71 | 0.54 | 1.00e+00 | 1.00e+00 | 3ST6GALNAC2, LGALS3BP, SMIM5 |
297 |
| chr19q13 | 3.15e-01 | 1.47 | 0.51 | 1.00e+00 | 1.00e+00 | 6LGI4, FXYD1, MIA, PLEKHA4, TTYH1, FXYD3 |
1165 |
| chr15q21 | 1.40e-01 | 3.16 | 0.37 | 1.00e+00 | 1.00e+00 | 2GATM, SHC4 |
167 |
| chr7q22 | 2.03e-01 | 2.47 | 0.29 | 1.00e+00 | 1.00e+00 | 2RELN, TSC22D4 |
213 |
| chr11q25 | 1.16e-01 | 8.50 | 0.20 | 1.00e+00 | 1.00e+00 | 1NTM |
31 |
| chr16q13 | 1.47e-01 | 6.54 | 0.16 | 1.00e+00 | 1.00e+00 | 1PLLP |
40 |
| chr12q13 | 6.71e-01 | 1.29 | 0.15 | 1.00e+00 | 1.00e+00 | 2DHH, ERBB3 |
407 |
| chr10p14 | 1.71e-01 | 5.54 | 0.13 | 1.00e+00 | 1.00e+00 | 1ITIH5 |
47 |
| chr3q11 | 1.81e-01 | 5.21 | 0.13 | 1.00e+00 | 1.00e+00 | 1PROS1 |
50 |
| chr2q22 | 2.37e-01 | 3.81 | 0.09 | 1.00e+00 | 1.00e+00 | 1ARHGAP15 |
68 |
| chr7p21 | 2.81e-01 | 3.11 | 0.08 | 1.00e+00 | 1.00e+00 | 1ITGB8 |
83 |
| chr6q23 | 3.44e-01 | 2.43 | 0.06 | 1.00e+00 | 1.00e+00 | 1MOXD1 |
106 |
| chr7p22 | 3.82e-01 | 2.13 | 0.05 | 1.00e+00 | 1.00e+00 | 1MICALL2 |
121 |
| chr2q24 | 3.91e-01 | 2.06 | 0.05 | 1.00e+00 | 1.00e+00 | 1SCN7A |
125 |
| chr9q31 | 3.99e-01 | 2.01 | 0.05 | 1.00e+00 | 1.00e+00 | 1CTNNAL1 |
128 |
| chr11q14 | 4.29e-01 | 1.82 | 0.04 | 1.00e+00 | 1.00e+00 | 1PRSS23 |
141 |
| chr7q36 | 4.38e-01 | 1.77 | 0.04 | 1.00e+00 | 1.00e+00 | 1RARRES2 |
145 |
| chr8q22 | 4.55e-01 | 1.68 | 0.04 | 1.00e+00 | 1.00e+00 | 1MATN2 |
153 |
| chr7q21 | 4.78e-01 | 1.56 | 0.04 | 1.00e+00 | 1.00e+00 | 1PON2 |
164 |
| chrXq22 | 4.88e-01 | 1.52 | 0.04 | 1.00e+00 | 1.00e+00 | 1PLP1 |
169 |
Dowload full table
Transcription Factor Targets:
| P-value | OR | Lower 95% CI | FDR | FWER | Genes Found | Gene Set Size | |
|---|---|---|---|---|---|---|---|
| CAGCTG_AP4_Q5 | 4.71e-05 | 3.89 | 2.00 | 5.33e-02 | 5.33e-02 | 16PLP1, LGI4, IL34, ITGB8, CMTM5, GPM6B, ALDH1A1, ERBB3, ASPA, PLEKHA4, SOX2, FXYD3, LGI1, LGALS1, GPR37L1, TSC22D4 |
1530 |
| ZIC1_01 | 3.67e-03 | 5.32 | 1.64 | 7.09e-01 | 1.00e+00 | 5SEMA3B, ERBB3, LGI1, FSTL3, TSC22D4 |
266 |
| STTTCRNTTT_IRF_Q6 | 6.70e-03 | 5.78 | 1.50 | 7.09e-01 | 1.00e+00 | 4ALDH1A1, ASPA, LGALS3BP, LGI1 |
192 |
| WTGAAAT_UNKNOWN | 8.85e-03 | 3.29 | 1.24 | 7.09e-01 | 1.00e+00 | 7IL34, GPM6B, SBSPON, ASPA, CTNNAL1, SOX2, SCN7A |
625 |
| ZIC2_01 | 1.66e-02 | 4.38 | 1.14 | 7.09e-01 | 1.00e+00 | 4SEMA3B, ERBB3, TSC22D4, TIMP3 |
252 |
| ICSBP_Q6 | 1.69e-02 | 4.37 | 1.13 | 7.09e-01 | 1.00e+00 | 4PLP1, ALDH1A1, ASPA, LGI1 |
253 |
| ZIC3_01 | 1.73e-02 | 4.33 | 1.12 | 7.09e-01 | 1.00e+00 | 4SEMA3B, ERBB3, FSTL3, TIMP3 |
255 |
| HNF4_DR1_Q3 | 2.00e-02 | 4.13 | 1.07 | 7.09e-01 | 1.00e+00 | 4LGI4, FXYD1, SEMA3B, ERBB3 |
267 |
| ZID_01 | 2.05e-02 | 4.10 | 1.06 | 7.09e-01 | 1.00e+00 | 4PLP1, CMTM5, ERBB3, TSC22D4 |
269 |
| HEB_Q6 | 2.05e-02 | 4.10 | 1.06 | 7.09e-01 | 1.00e+00 | 4IL34, ERBB3, GPR37L1, TSC22D4 |
269 |
| AP4_Q5 | 2.13e-02 | 4.06 | 1.05 | 7.09e-01 | 1.00e+00 | 4CMTM5, GPM6B, ALDH1A1, ERBB3 |
272 |
| ZNF596_TARGET_GENES | 3.65e-02 | 2.62 | 0.91 | 9.14e-01 | 1.00e+00 | 6COL14A1, ERBB3, SOX2, LGALS1, TSC22D4, TIMP3 |
656 |
| GCANCTGNY_MYOD_Q6 | 8.29e-02 | 2.19 | 0.83 | 9.14e-01 | 1.00e+00 | 7IL34, ALDH1A1, ERBB3, PLEKHA4, SOX2, LGALS1, GPR37L1 |
935 |
| AAANWWTGC_UNKNOWN | 4.09e-02 | 4.16 | 0.82 | 9.14e-01 | 1.00e+00 | 3ASPA, PRIMA1, TSC22D4 |
195 |
| HFH8_01 | 4.79e-02 | 3.89 | 0.77 | 9.14e-01 | 1.00e+00 | 3ASPA, PRIMA1, SOX2 |
208 |
| RREB1_01 | 4.84e-02 | 3.87 | 0.76 | 9.14e-01 | 1.00e+00 | 3ITGB8, DHH, TIMP3 |
209 |
| SIX1_TARGET_GENES | 5.70e-02 | 2.92 | 0.76 | 9.14e-01 | 1.00e+00 | 4SEMA3B, GATM, ARHGAP15, IFITM3 |
376 |
| MAZR_01 | 5.71e-02 | 3.61 | 0.71 | 9.14e-01 | 1.00e+00 | 3FXYD1, FXYD3, LGALS1 |
224 |
| SRF_Q5_01 | 5.78e-02 | 3.59 | 0.71 | 9.14e-01 | 1.00e+00 | 3ITGB8, ASPA, TIMP3 |
225 |
| CTGYNNCTYTAA_UNKNOWN | 4.73e-02 | 6.05 | 0.70 | 9.14e-01 | 1.00e+00 | 2PLP1, FXYD3 |
88 |
Dowload full table
GO Biological Processes:
| P-value | OR | Lower 95% CI | FDR | FWER | Genes Found | Gene Set Size | |
|---|---|---|---|---|---|---|---|
| GOBP_ENSHEATHMENT_OF_NEURONS | 9.51e-06 | 14.20 | 4.85 | 3.04e-02 | 7.12e-02 | 6PLP1, LGI4, PLLP, MPZ, DHH, ASPA |
126 |
| GOBP_GLIAL_CELL_DIFFERENTIATION | 1.40e-06 | 11.78 | 4.72 | 1.05e-02 | 1.05e-02 | 8PLP1, LGI4, IL34, ERBB3, ASPA, RELN, SOX2, GPR37L1 |
210 |
| GOBP_POSITIVE_REGULATION_OF_MACROPHAGE_CHEMOTAXIS | 2.03e-03 | 34.68 | 3.75 | 1.00e+00 | 1.00e+00 | 2IL34, RARRES2 |
17 |
| GOBP_GLIOGENESIS | 1.22e-05 | 8.66 | 3.48 | 3.04e-02 | 9.11e-02 | 8PLP1, LGI4, IL34, ERBB3, ASPA, RELN, SOX2, GPR37L1 |
283 |
| GOBP_AXON_ENSHEATHMENT_IN_CENTRAL_NERVOUS_SYSTEM | 3.10e-03 | 27.37 | 3.01 | 1.00e+00 | 1.00e+00 | 2PLP1, ASPA |
21 |
| GOBP_POSITIVE_REGULATION_OF_OLIGODENDROCYTE_DIFFERENTIATION | 3.40e-03 | 26.01 | 2.87 | 1.00e+00 | 1.00e+00 | 2IL34, ASPA |
22 |
| GOBP_POSITIVE_REGULATION_OF_PROTEIN_TYROSINE_KINASE_ACTIVITY | 1.71e-03 | 13.99 | 2.71 | 1.00e+00 | 1.00e+00 | 3IL34, ERBB3, RELN |
60 |
| GOBP_POSITIVE_REGULATION_OF_MACROPHAGE_MIGRATION | 4.05e-03 | 23.65 | 2.62 | 1.00e+00 | 1.00e+00 | 2IL34, RARRES2 |
24 |
| GOBP_REGULATION_OF_GLIAL_CELL_DIFFERENTIATION | 2.45e-03 | 12.27 | 2.38 | 1.00e+00 | 1.00e+00 | 3IL34, ASPA, GPR37L1 |
68 |
| GOBP_REGULATION_OF_MACROPHAGE_CHEMOTAXIS | 5.10e-03 | 20.80 | 2.32 | 1.00e+00 | 1.00e+00 | 2IL34, RARRES2 |
27 |
| GOBP_PLATELET_DEGRANULATION | 1.59e-03 | 8.76 | 2.26 | 1.00e+00 | 1.00e+00 | 4RARRES2, LGALS3BP, TIMP3, PROS1 |
128 |
| GOBP_NEUROTRANSMITTER_METABOLIC_PROCESS | 5.87e-03 | 19.27 | 2.16 | 1.00e+00 | 1.00e+00 | 2PRIMA1, MOXD1 |
29 |
| GOBP_NEUROGENESIS | 8.33e-05 | 3.69 | 1.90 | 1.56e-01 | 6.23e-01 | 16S100B, PLP1, LGI4, SEMA3B, IL34, GPM6B, ERBB3, ASPA, RELN, NTM, S100A6, MICALL2, SOX2, LGI1, LGALS1, GPR37L1 |
1613 |
| GOBP_BIOLOGICAL_ADHESION | 1.32e-04 | 3.66 | 1.85 | 1.97e-01 | 9.86e-01 | 15ITGB8, GPM6B, COL14A1, MPZ, ERBB3, EMP2, CTNNAL1, RELN, TTYH1, NTM, LGALS3BP, MICALL2, SOX2, LGALS1, FSTL3 |
1481 |
| GOBP_REGULATION_OF_SYSTEMIC_ARTERIAL_BLOOD_PRESSURE | 5.37e-03 | 9.17 | 1.79 | 1.00e+00 | 1.00e+00 | 3RARRES2, EMP2, GPR37L1 |
90 |
| GOBP_SCHWANN_CELL_DIFFERENTIATION | 8.94e-03 | 15.30 | 1.73 | 1.00e+00 | 1.00e+00 | 2LGI4, ERBB3 |
36 |
| GOBP_REGULATION_OF_GLIOGENESIS | 5.88e-03 | 8.86 | 1.73 | 1.00e+00 | 1.00e+00 | 3IL34, ASPA, GPR37L1 |
93 |
| GOBP_OLIGODENDROCYTE_DIFFERENTIATION | 5.88e-03 | 8.86 | 1.73 | 1.00e+00 | 1.00e+00 | 3PLP1, IL34, ASPA |
93 |
| GOBP_REGULATION_OF_PROTEIN_TYROSINE_KINASE_ACTIVITY | 6.06e-03 | 8.76 | 1.71 | 1.00e+00 | 1.00e+00 | 3IL34, ERBB3, RELN |
94 |
| GOBP_REGULATION_OF_OLIGODENDROCYTE_DIFFERENTIATION | 9.43e-03 | 14.87 | 1.69 | 1.00e+00 | 1.00e+00 | 2IL34, ASPA |
37 |
Dowload full table
Immunological Gene Sets:
| P-value | OR | Lower 95% CI | FDR | FWER | Genes Found | Gene Set Size | |
|---|---|---|---|---|---|---|---|
| GSE25123_WT_VS_PPARG_KO_MACROPHAGE_IL4_STIM_DN | 1.24e-04 | 8.78 | 3.02 | 6.03e-01 | 6.03e-01 | 6ITGB8, GPM6B, ITIH5, ERBB3, S100A6, LGALS1 |
200 |
| GSE13522_WT_VS_IFNAR_KO_SKIN_DN | 6.28e-04 | 8.07 | 2.47 | 1.00e+00 | 1.00e+00 | 5GATM, ERBB3, S100A6, LGALS3BP, LGALS1 |
177 |
| GSE22589_HEALTHY_VS_HIV_INFECTED_DC_DN | 1.08e-03 | 7.12 | 2.18 | 1.00e+00 | 1.00e+00 | 5S100B, IFITM3, CTNNAL1, LGALS3BP, MATN2 |
200 |
| GSE26030_TH1_VS_TH17_DAY15_POST_POLARIZATION_DN | 1.08e-03 | 7.12 | 2.18 | 1.00e+00 | 1.00e+00 | 5ARHGAP15, IFITM3, S100A6, SMIM5, LGALS1 |
200 |
| GSE21927_SPLENIC_C26GM_TUMOROUS_VS_4T1_TUMOR_MONOCYTES_UP | 5.90e-03 | 6.00 | 1.55 | 1.00e+00 | 1.00e+00 | 4GPM6B, COL14A1, MICALL2, TIMP3 |
185 |
| GSE22611_UNSTIM_VS_6H_MDP_STIM_NOD2_TRANSDUCED_HEK293T_CELL_UP | 7.20e-03 | 5.66 | 1.47 | 1.00e+00 | 1.00e+00 | 4PLLP, CTNNAL1, S100A6, LGALS3BP |
196 |
| GSE29949_DC_BRAIN_VS_MONOCYTE_BONE_MARROW_DN | 7.45e-03 | 5.60 | 1.45 | 1.00e+00 | 1.00e+00 | 4PLLP, DHH, IFITM3, MOXD1 |
198 |
| GSE19888_ADENOSINE_A3R_INH_VS_ACT_IN_MAST_CELL_DN | 7.58e-03 | 5.57 | 1.44 | 1.00e+00 | 1.00e+00 | 4GPM6B, GATM, ARHGAP15, IFITM3 |
199 |
| GSE16450_CTRL_VS_IFNA_6H_STIM_MATURE_NEURON_CELL_LINE_UP | 7.58e-03 | 5.57 | 1.44 | 1.00e+00 | 1.00e+00 | 4ITIH5, NTM, LGI1, TSC22D4 |
199 |
| GSE26727_WT_VS_KLF2_KO_LPS_STIM_MACROPHAGE_UP | 7.58e-03 | 5.57 | 1.44 | 1.00e+00 | 1.00e+00 | 4ITGB8, COL14A1, TSC22D4, SCN7A |
199 |
| GSE35543_IN_VIVO_NTREG_VS_IN_VITRO_ITREG_UP | 7.58e-03 | 5.57 | 1.44 | 1.00e+00 | 1.00e+00 | 4SEMA3B, IL34, RELN, SCN7A |
199 |
| GSE17580_UNINFECTED_VS_S_MANSONI_INF_TREG_DN | 7.71e-03 | 5.55 | 1.44 | 1.00e+00 | 1.00e+00 | 4GPM6B, S100A6, LGALS1, PROS1 |
200 |
| GSE22886_DC_VS_MONOCYTE_UP | 7.71e-03 | 5.55 | 1.44 | 1.00e+00 | 1.00e+00 | 4S100B, PON2, CTNNAL1, MICALL2 |
200 |
| GSE34205_HEALTHY_VS_FLU_INF_INFANT_PBMC_DN | 7.71e-03 | 5.55 | 1.44 | 1.00e+00 | 1.00e+00 | 4IFITM3, CTNNAL1, S100A6, LGALS3BP |
200 |
| GSE9650_NAIVE_VS_EXHAUSTED_CD8_TCELL_DN | 7.71e-03 | 5.55 | 1.44 | 1.00e+00 | 1.00e+00 | 4GPM6B, ST6GALNAC2, RELN, SCN7A |
200 |
| GSE411_UNSTIM_VS_100MIN_IL6_STIM_SOCS3_KO_MACROPHAGE_DN | 7.71e-03 | 5.55 | 1.44 | 1.00e+00 | 1.00e+00 | 4ARHGAP15, IFITM3, S100A6, LGALS1 |
200 |
| GSE8921_3H_VS_24H_TLR1_2_STIM_MONOCYTE_DN | 7.71e-03 | 5.55 | 1.44 | 1.00e+00 | 1.00e+00 | 4S100A6, MICALL2, LGALS1, TSC22D4 |
200 |
| GSE5679_CTRL_VS_PPARG_LIGAND_ROSIGLITAZONE_AND_RARA_AGONIST_AM580_TREATED_DC_DN | 7.71e-03 | 5.55 | 1.44 | 1.00e+00 | 1.00e+00 | 4RARRES2, S100A6, LGALS1, FSTL3 |
200 |
| GSE7219_WT_VS_NIK_NFKB2_KO_LPS_AND_ANTI_CD40_STIM_DC_UP | 7.71e-03 | 5.55 | 1.44 | 1.00e+00 | 1.00e+00 | 4ITIH5, ST6GALNAC2, IFITM3, TIMP3 |
200 |
| GSE16451_CTRL_VS_WEST_EQUINE_ENC_VIRUS_MATURE_NEURON_CELL_LINE_DN | 7.71e-03 | 5.55 | 1.44 | 1.00e+00 | 1.00e+00 | 4ITIH5, IFITM3, S100A6, LGALS1 |
200 |
Top Ranked Transcription Factors for this Gene Expression Program:
| Gene Symbol | TF Rank | DNA Binding Domain | Motif Status | IUPAC PWM | GTEx | DepMap | Decartes |
|---|---|---|---|---|---|---|---|
| PLEKHA4 | 28 | No | Unlikely to be sequence specific TF | Not a DNA binding protein | No motif | Has a putative AT-hook | No DBDs; no indication of DNA binding - included only because Vasquerizas 2009 included it with an x. |
| RELN | 29 | No | Unlikely to be sequence specific TF | Not a DNA binding protein | No motif | None | Protein is a large secreted extracellular matrix protein |
| SOX2 | 36 | Yes | Known motif | Monomer or homomultimer | High-throughput in vitro | None | None |
| TSC22D4 | 46 | No | Unlikely to be sequence specific TF | Not a DNA binding protein | No motif | None | There is some evidence that a related protein (TSC22D1) binds DNA specifically - thus, it is possible this is also a TF. |
| NDP | 65 | No | Unlikely to be sequence specific TF | Not a DNA binding protein | No motif | None | Included only because GO says positive regulation of sequence-specific DNA binding transcription factor activity. Not DNA binding. |
| AHR | 83 | Yes | Known motif | Monomer or homomultimer | In vivo/Misc source | Only known motifs are from Transfac or HocoMoco - origin is uncertain | None |
| RCAN1 | 88 | No | Unlikely to be sequence specific TF | Not a DNA binding protein | No motif | None | SH3 domain protein that interacts with calcineurin. GO annotation and abstract in (PMID: 8595418) appear erroneous - mentions a binding domain in the abstract, but no evidence is provided in the paper. |
| VGLL3 | 89 | No | Unlikely to be sequence specific TF | Not a DNA binding protein | No motif | None | (PMID: 23380592) describes this protein as a co-activator, and it doesnt seem to have a DBD (fig. 1) |
| SPHK1 | 98 | No | Unlikely to be sequence specific TF | Not a DNA binding protein | No motif | None | None |
| CLU | 99 | No | Unlikely to be sequence specific TF | Not a DNA binding protein | No motif | None | Included only because GO says positive regulation of NF-kappaB transcription factor activity, but there is no DBD and no evidence of DNA binding. |
| PRNP | 117 | No | Unlikely to be sequence specific TF | Not a DNA binding protein | No motif | None | None |
| GAS7 | 121 | No | Unlikely to be sequence specific TF | Not a DNA binding protein | No motif | None | (PMID: 9736752) only shows that it has a proline-rich domain similar to the one in Oct2. No evidence of DNA binding. |
| ANXA3 | 126 | No | Unlikely to be sequence specific TF | Not a DNA binding protein | No motif | None | Protein operates far upstream on the signaling cascade. |
| HOXB7 | 129 | Yes | Known motif | Monomer or homomultimer | High-throughput in vitro | None | None |
| PRDM16 | 132 | Yes | Inferred motif | Monomer or homomultimer | In vivo/Misc source | None | None |
| GULP1 | 180 | No | Unlikely to be sequence specific TF | Not a DNA binding protein | No motif | None | Based on the alignments, the protein is only weakly related to the other bZIP proteins and lacks the basic region required for DNA binding |
| CAPN3 | 190 | No | Unlikely to be sequence specific TF | Not a DNA binding protein | No motif | None | Included only because GO says positive regulation of NF-kappaB transcription factor activity. No indication of sequence specific DNA binding. |
| ID3 | 206 | No | Unlikely to be sequence specific TF | Not a DNA binding protein | No motif | None | ID bHLH proteins lack the basic region and should not be able to bind DNA. The HT-SELEX motif for ID4 is likely by a co-precipitated protein or it is a contamination |
| PARP10 | 218 | No | ssDNA/RNA binding | Not a DNA binding protein | No motif | None | Contains two RRM domains, so likely an RNA-binding protein. Myc-interacting factor capable of ADP-ribosylating itself and core histones (PMID: 15674325). |
| RXRG | 220 | Yes | Known motif | Monomer or homomultimer | High-throughput in vitro | None | Usually binds in vivo as a heterodimer, but can bind as a homodimer in vitro |
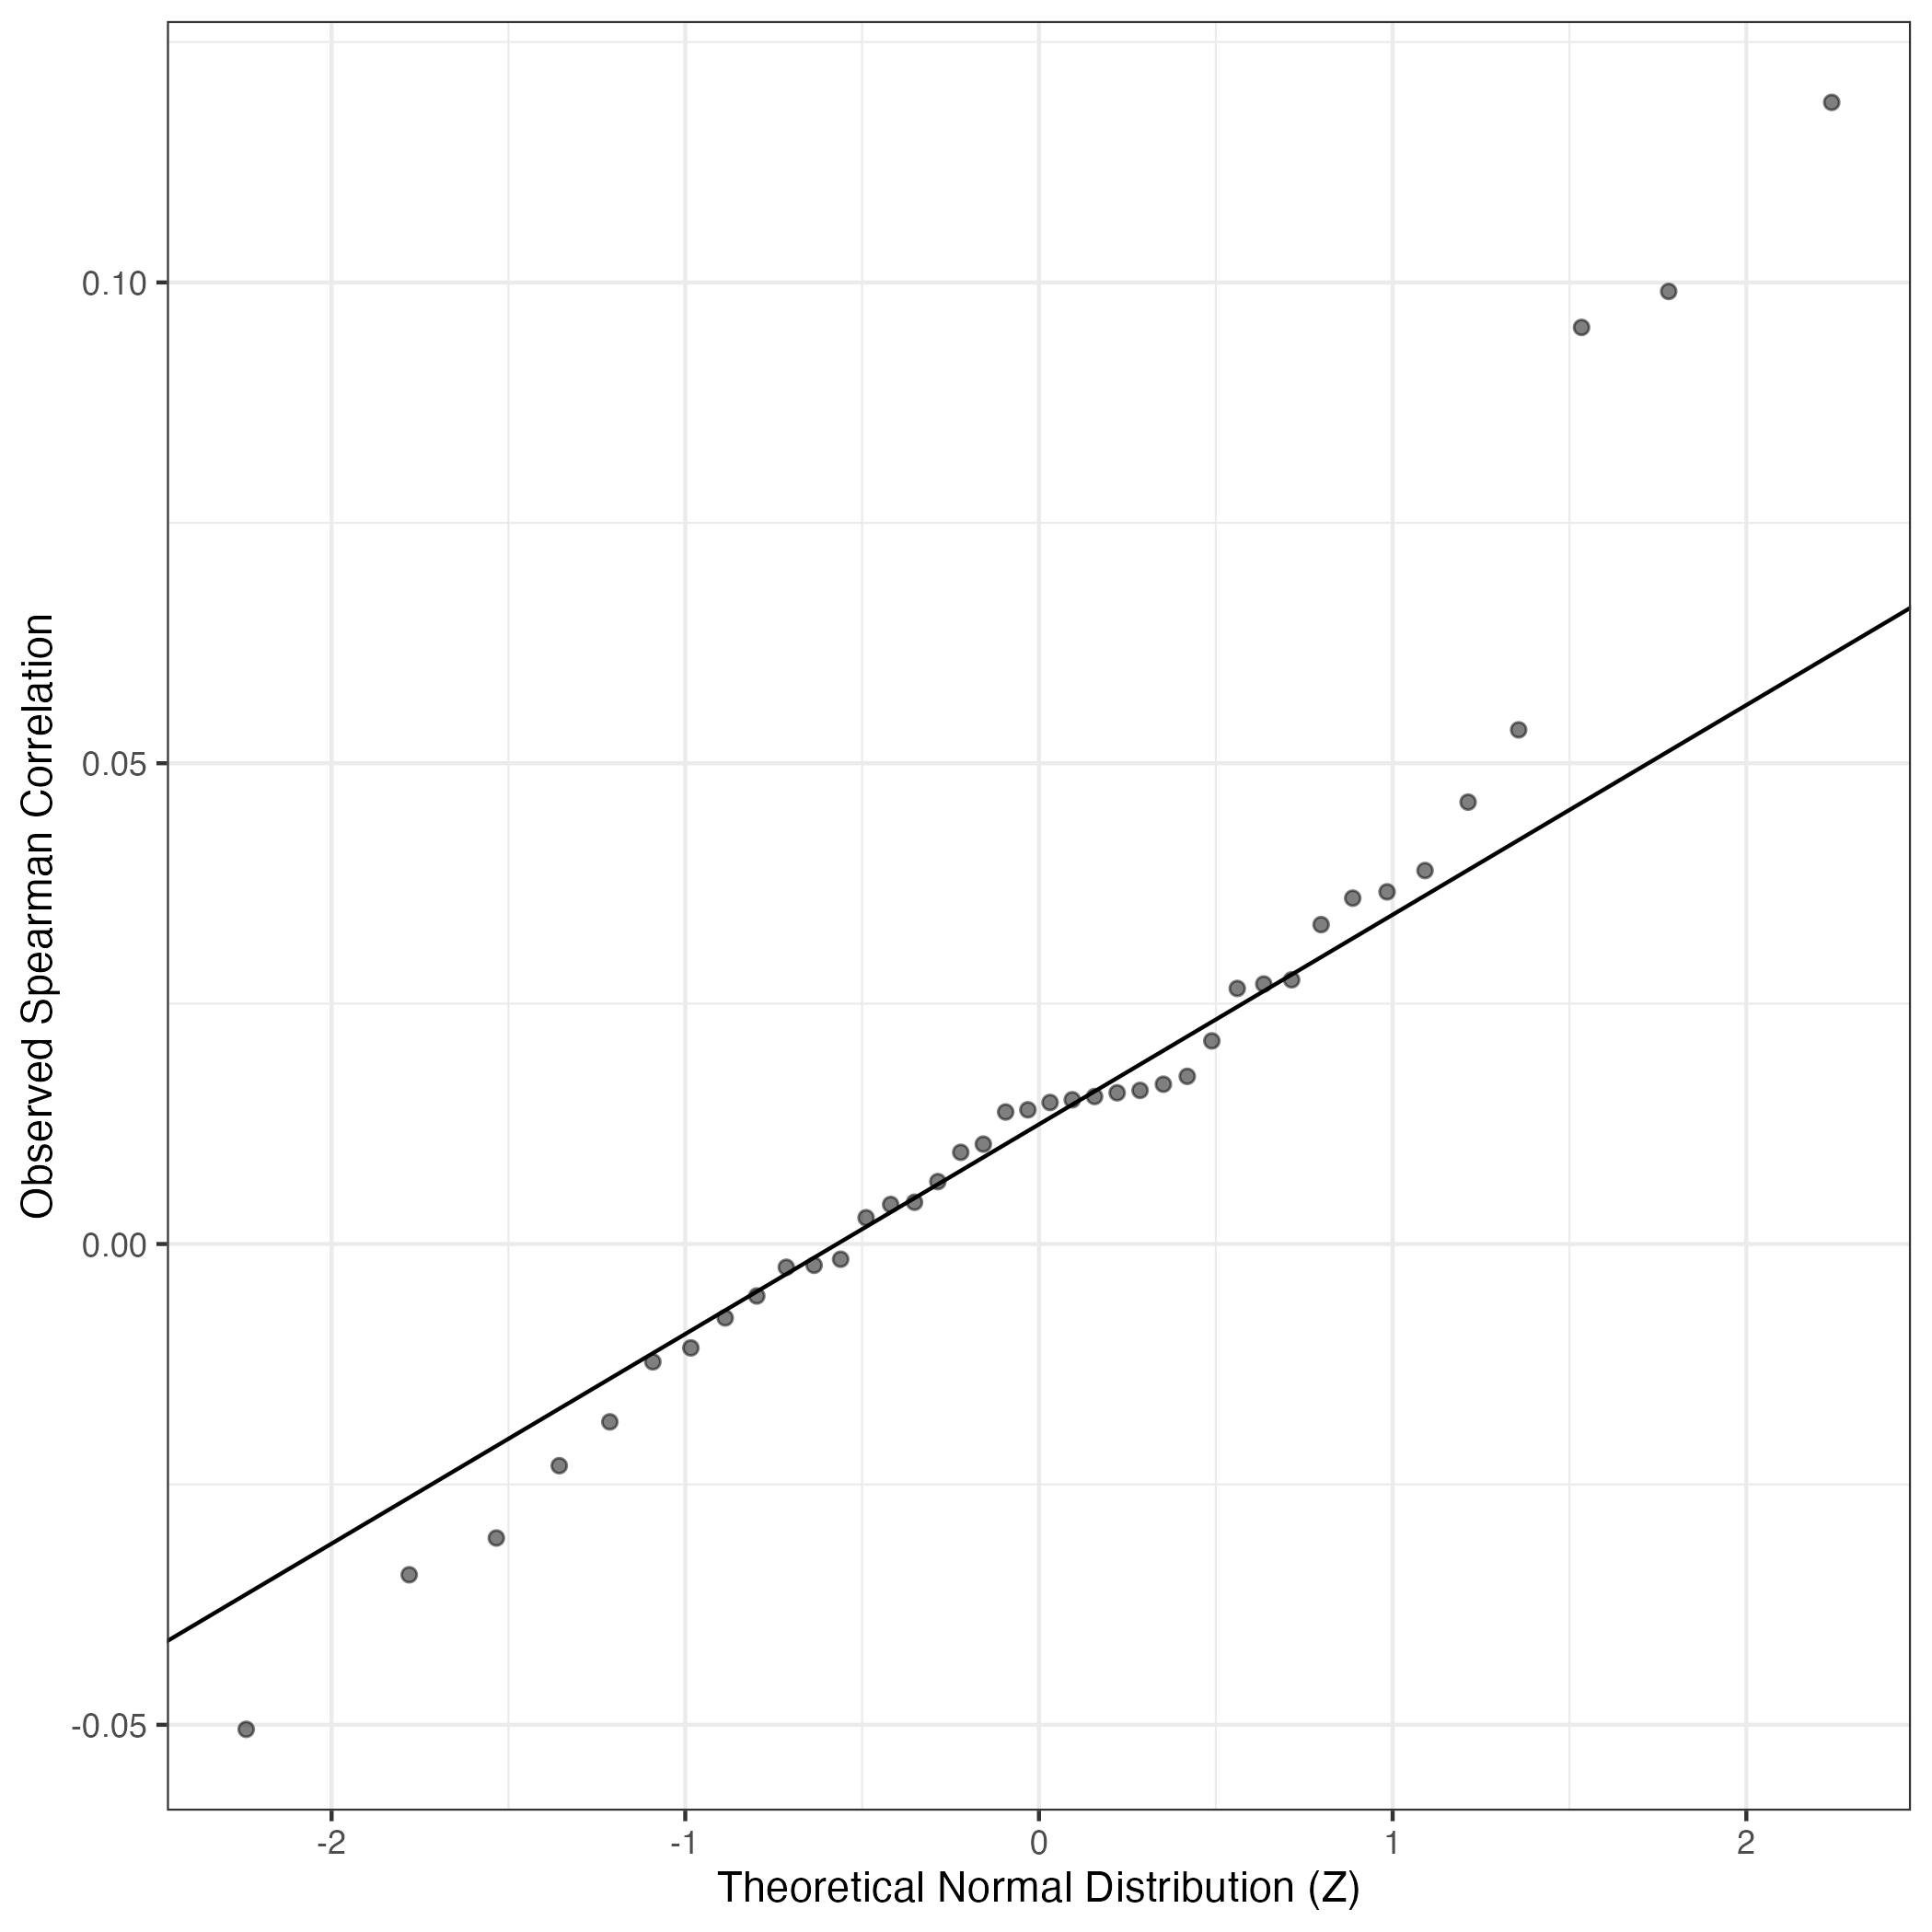
QQ Plot showing correlations with other GEPs in this dataset, calculated by Spearman correlation:
Interactive QQ-plot of gene loadings:
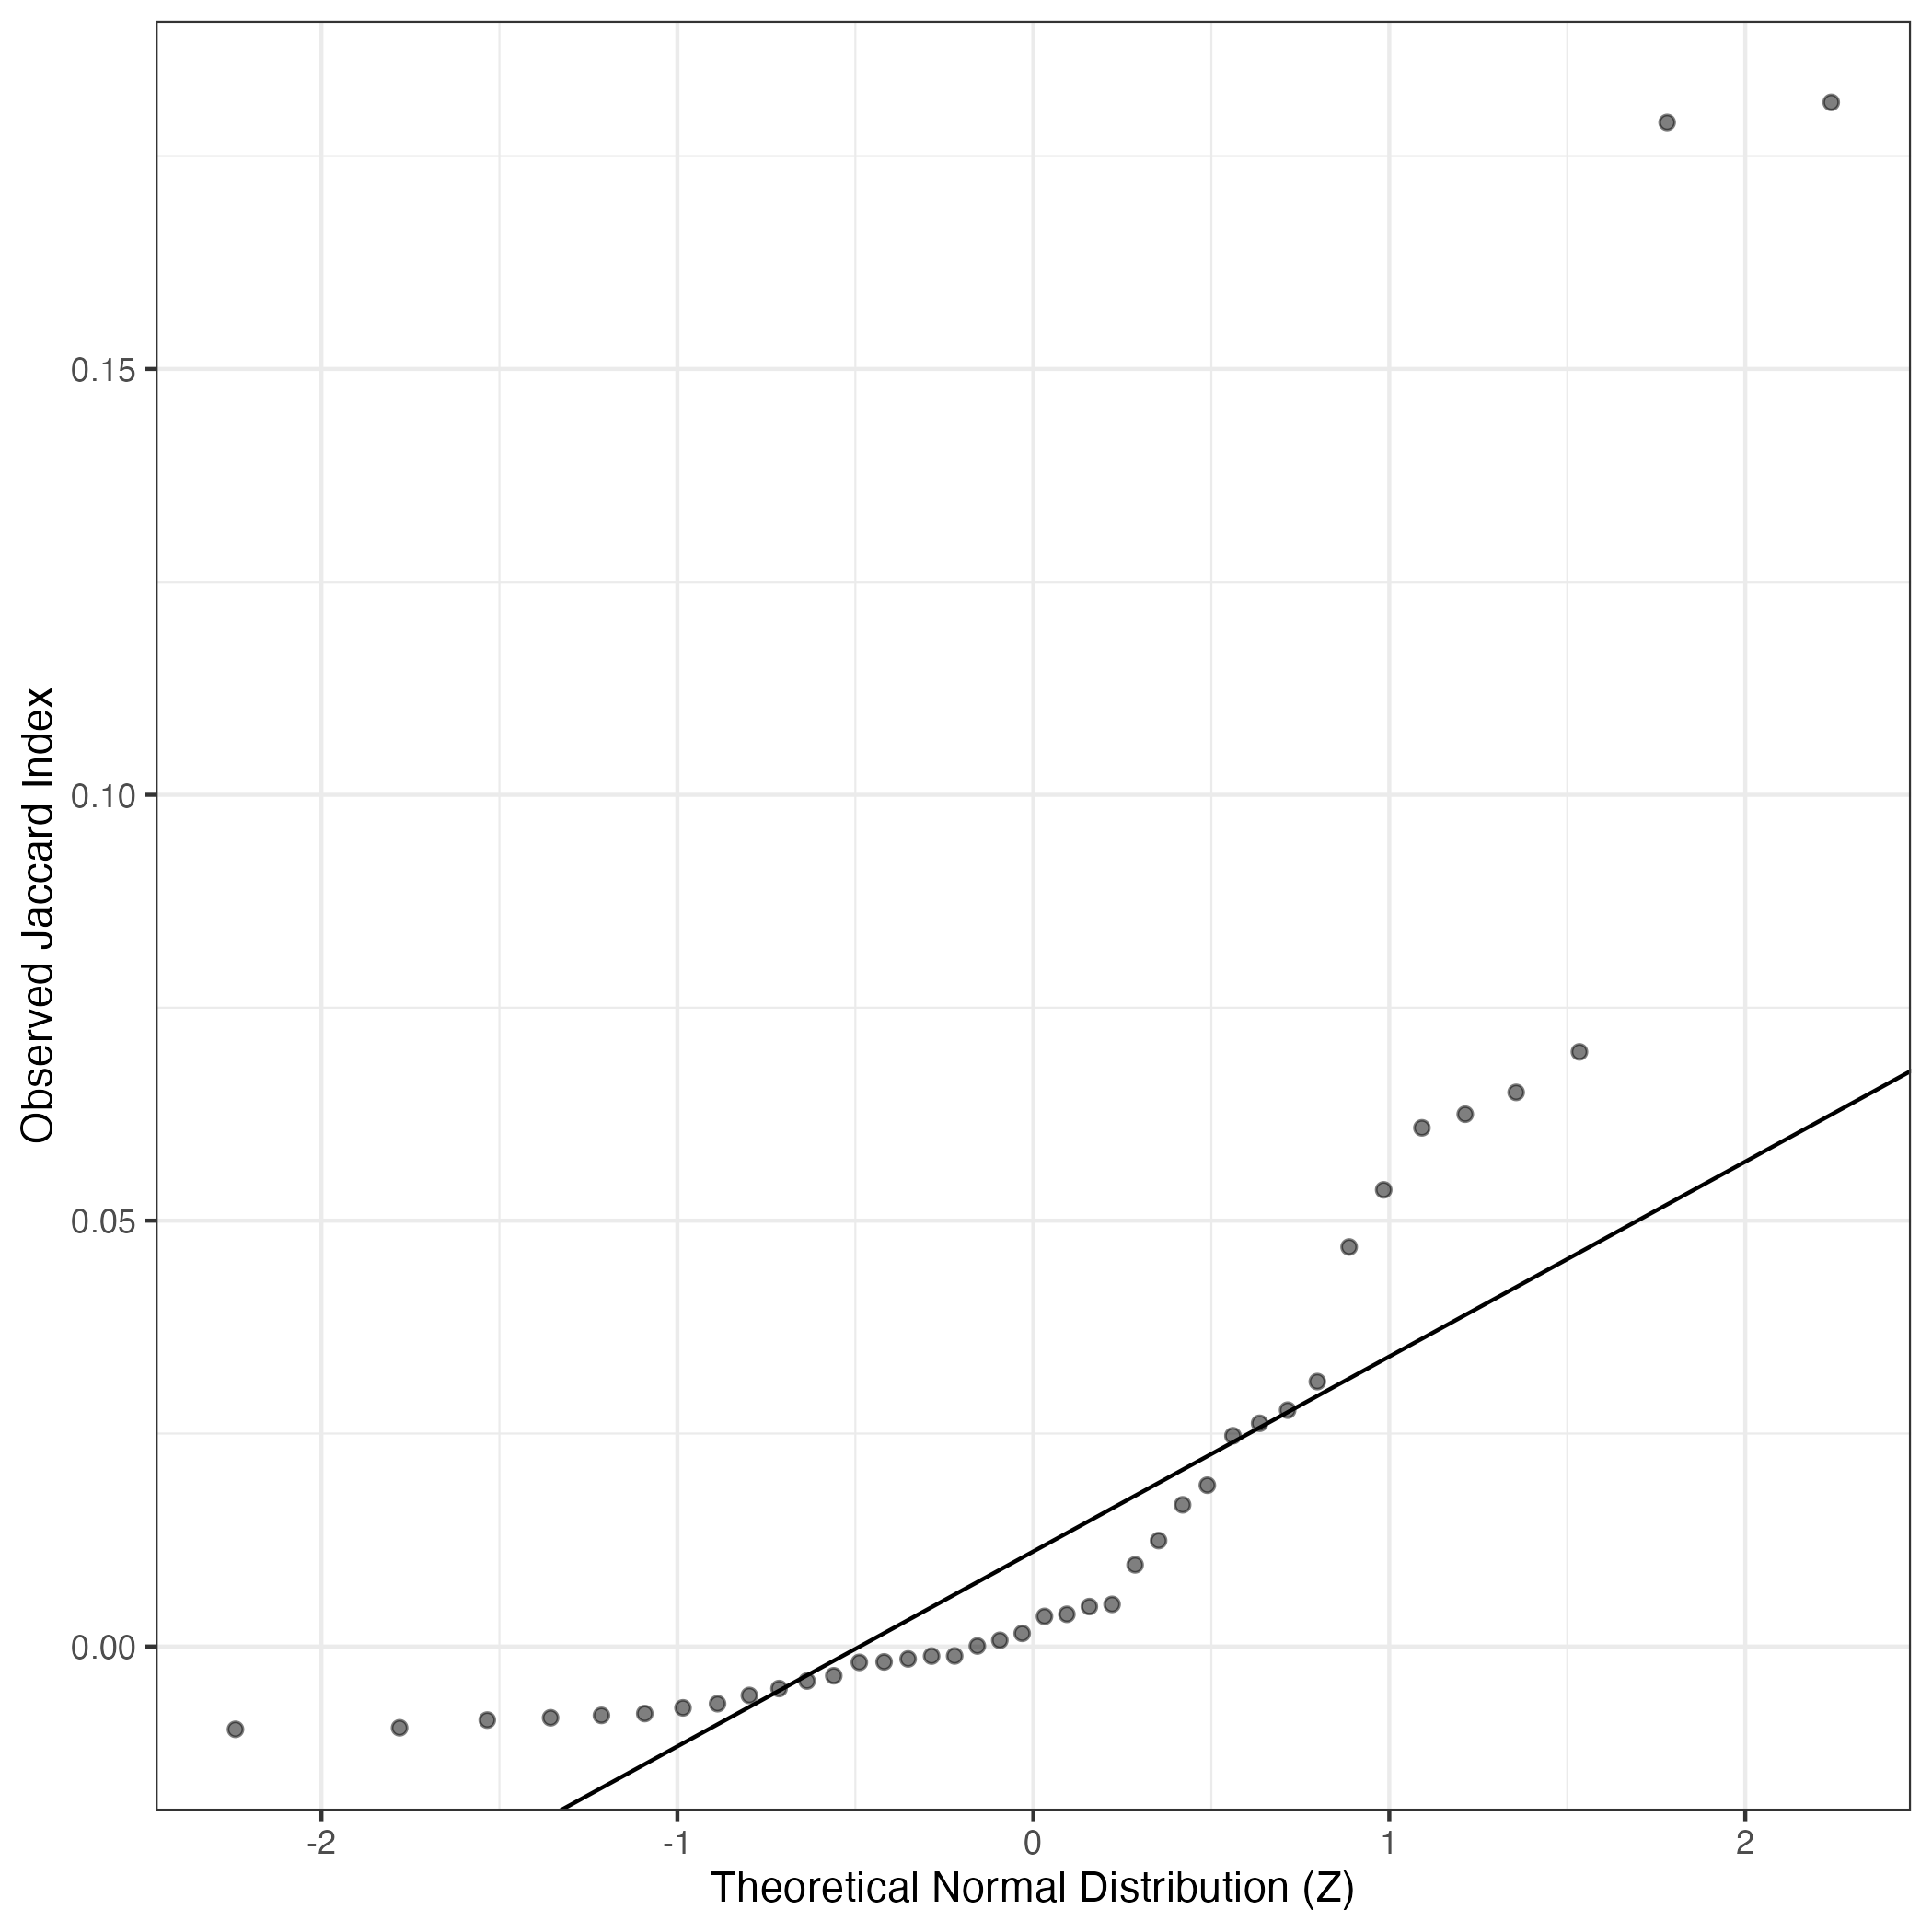
A similar QQ-plot as above, but only for instances where the H value is e.g. > 25, i.e. we are confident that the expression program is active above noise. Agreemenet between these binary vectors is tested using the Jaccard Index, with the P-values calculated by an exact test:
Interactive QQ-plot:
Singler cell type annotations for the top 50 cells on this program.
| Cell ID | Singler label | Singler Delta | Activity Score | Top Singler Raw Scores |
|---|---|---|---|---|
| T19_CCCTCCTAGCACGCCT.1 | Neurons:Schwann_cell | 0.18 | 1346.65 | Raw ScoresNeurons:Schwann_cell: 0.37, Fibroblasts:foreskin: 0.27, Fibroblasts:breast: 0.27, Tissue_stem_cells:BM_MSC:BMP2: 0.27, Smooth_muscle_cells:bronchial: 0.27, Astrocyte:Embryonic_stem_cell-derived: 0.26, Tissue_stem_cells:BM_MSC:TGFb3: 0.26, iPS_cells:foreskin_fibrobasts: 0.26, iPS_cells:adipose_stem_cells: 0.26, Smooth_muscle_cells:bronchial:vit_D: 0.26 |
| T19_CTACACCGTGTGGTTT.1 | Neurons:Schwann_cell | 0.16 | 1062.21 | Raw ScoresNeurons:Schwann_cell: 0.4, Fibroblasts:breast: 0.33, Tissue_stem_cells:BM_MSC:BMP2: 0.33, iPS_cells:adipose_stem_cells: 0.32, Smooth_muscle_cells:bronchial: 0.32, Chondrocytes:MSC-derived: 0.32, Fibroblasts:foreskin: 0.32, Tissue_stem_cells:BM_MSC:TGFb3: 0.32, Smooth_muscle_cells:bronchial:vit_D: 0.32, Tissue_stem_cells:BM_MSC: 0.32 |
| T19_ATTATCCTCCTTCAAT.1 | DC:monocyte-derived:LPS | 0.12 | 1046.28 | Raw ScoresDC:monocyte-derived:AEC-conditioned: 0.36, DC:monocyte-derived:LPS: 0.36, DC:monocyte-derived:Poly(IC): 0.36, Macrophage:monocyte-derived:M-CSF: 0.36, Monocyte:leukotriene_D4: 0.36, DC:monocyte-derived:Galectin-1: 0.36, DC:monocyte-derived:anti-DC-SIGN_2h: 0.36, Macrophage:monocyte-derived:IFNa: 0.35, DC:monocyte-derived:A._fumigatus_germ_tubes_6h: 0.35, Macrophage:monocyte-derived:S._aureus: 0.35 |
| T19_TGCCCTAAGCTAAACA.1 | Neurons:Schwann_cell | 0.14 | 1025.36 | Raw ScoresNeurons:Schwann_cell: 0.41, Fibroblasts:breast: 0.35, Fibroblasts:foreskin: 0.35, iPS_cells:adipose_stem_cells: 0.34, iPS_cells:foreskin_fibrobasts: 0.34, Smooth_muscle_cells:bronchial: 0.34, Tissue_stem_cells:BM_MSC:BMP2: 0.34, Smooth_muscle_cells:bronchial:vit_D: 0.33, Tissue_stem_cells:BM_MSC:TGFb3: 0.33, iPS_cells:CRL2097_foreskin: 0.33 |
| T19_ACACCGGAGCGAGAAA.1 | Neurons:Schwann_cell | 0.13 | 909.22 | Raw ScoresNeurons:Schwann_cell: 0.39, Smooth_muscle_cells:bronchial: 0.32, Fibroblasts:foreskin: 0.32, iPS_cells:adipose_stem_cells: 0.31, Fibroblasts:breast: 0.31, Endothelial_cells:HUVEC:IFNg: 0.31, Smooth_muscle_cells:bronchial:vit_D: 0.31, Tissue_stem_cells:BM_MSC:BMP2: 0.31, Endothelial_cells:lymphatic:TNFa_48h: 0.31, Tissue_stem_cells:BM_MSC:TGFb3: 0.3 |
| T19_CTCAGAATCAACGCTA.1 | Neurons:Schwann_cell | 0.15 | 819.29 | Raw ScoresNeurons:Schwann_cell: 0.36, Smooth_muscle_cells:bronchial: 0.3, Fibroblasts:foreskin: 0.29, Smooth_muscle_cells:bronchial:vit_D: 0.29, Fibroblasts:breast: 0.28, Tissue_stem_cells:BM_MSC:BMP2: 0.28, iPS_cells:adipose_stem_cells: 0.28, Tissue_stem_cells:BM_MSC:TGFb3: 0.28, Endothelial_cells:lymphatic:TNFa_48h: 0.27, Tissue_stem_cells:iliac_MSC: 0.27 |
| T19_GGATTACTCCTGCCAT.1 | Neurons:Schwann_cell | 0.14 | 794.15 | Raw ScoresNeurons:Schwann_cell: 0.37, Fibroblasts:foreskin: 0.3, Smooth_muscle_cells:bronchial: 0.3, Smooth_muscle_cells:bronchial:vit_D: 0.3, Endothelial_cells:lymphatic:TNFa_48h: 0.3, Tissue_stem_cells:BM_MSC:BMP2: 0.29, Fibroblasts:breast: 0.29, Endothelial_cells:HUVEC:IFNg: 0.29, iPS_cells:adipose_stem_cells: 0.29, Tissue_stem_cells:BM_MSC:osteogenic: 0.29 |
| T19_ACACCGGAGGGAAACA.1 | Neurons:Schwann_cell | 0.13 | 756.30 | Raw ScoresNeurons:Schwann_cell: 0.37, Fibroblasts:breast: 0.3, iPS_cells:adipose_stem_cells: 0.3, Tissue_stem_cells:BM_MSC:BMP2: 0.3, Smooth_muscle_cells:bronchial: 0.3, Smooth_muscle_cells:bronchial:vit_D: 0.29, Tissue_stem_cells:BM_MSC:TGFb3: 0.29, Smooth_muscle_cells:vascular: 0.29, Smooth_muscle_cells:vascular:IL-17: 0.29, Fibroblasts:foreskin: 0.29 |
| T19_TGCTACCCAGACACTT.1 | Neurons:Schwann_cell | 0.14 | 749.50 | Raw ScoresNeurons:Schwann_cell: 0.37, Fibroblasts:breast: 0.3, Smooth_muscle_cells:bronchial: 0.29, iPS_cells:adipose_stem_cells: 0.29, Smooth_muscle_cells:bronchial:vit_D: 0.29, Tissue_stem_cells:iliac_MSC: 0.29, Tissue_stem_cells:BM_MSC:BMP2: 0.29, Tissue_stem_cells:BM_MSC:TGFb3: 0.29, Chondrocytes:MSC-derived: 0.29, Tissue_stem_cells:BM_MSC: 0.29 |
| T19_GAATAAGCAGGACCCT.1 | Neurons:Schwann_cell | 0.16 | 732.34 | Raw ScoresNeurons:Schwann_cell: 0.38, Fibroblasts:breast: 0.31, Smooth_muscle_cells:bronchial: 0.31, Fibroblasts:foreskin: 0.31, Smooth_muscle_cells:bronchial:vit_D: 0.31, iPS_cells:adipose_stem_cells: 0.31, Tissue_stem_cells:BM_MSC: 0.31, Tissue_stem_cells:BM_MSC:BMP2: 0.31, Smooth_muscle_cells:vascular:IL-17: 0.3, Tissue_stem_cells:BM_MSC:TGFb3: 0.3 |
| T19_TTTACTGAGACAAAGG.1 | Neurons:Schwann_cell | 0.15 | 730.45 | Raw ScoresNeurons:Schwann_cell: 0.36, Fibroblasts:breast: 0.3, Smooth_muscle_cells:bronchial: 0.29, iPS_cells:adipose_stem_cells: 0.29, Fibroblasts:foreskin: 0.29, Tissue_stem_cells:BM_MSC:TGFb3: 0.29, Smooth_muscle_cells:bronchial:vit_D: 0.29, Tissue_stem_cells:BM_MSC:BMP2: 0.28, Tissue_stem_cells:iliac_MSC: 0.28, iPS_cells:foreskin_fibrobasts: 0.28 |
| T19_CAGCGACGTGGCGAAT.1 | Neurons:Schwann_cell | 0.14 | 718.73 | Raw ScoresNeurons:Schwann_cell: 0.36, Fibroblasts:foreskin: 0.3, Fibroblasts:breast: 0.29, Tissue_stem_cells:BM_MSC:BMP2: 0.29, iPS_cells:adipose_stem_cells: 0.29, Tissue_stem_cells:BM_MSC:TGFb3: 0.28, Smooth_muscle_cells:bronchial: 0.28, Smooth_muscle_cells:bronchial:vit_D: 0.28, Tissue_stem_cells:iliac_MSC: 0.28, Osteoblasts: 0.28 |
| T19_GGCGACTGTTTGTGTG.1 | Neurons:Schwann_cell | 0.14 | 716.56 | Raw ScoresNeurons:Schwann_cell: 0.36, Smooth_muscle_cells:bronchial: 0.3, Smooth_muscle_cells:bronchial:vit_D: 0.3, Fibroblasts:breast: 0.3, iPS_cells:adipose_stem_cells: 0.29, Tissue_stem_cells:BM_MSC:BMP2: 0.29, Tissue_stem_cells:BM_MSC:TGFb3: 0.29, Fibroblasts:foreskin: 0.29, iPS_cells:foreskin_fibrobasts: 0.29, Tissue_stem_cells:BM_MSC: 0.29 |
| T19_TCGTAGAAGCAGGTCA.1 | Neurons:Schwann_cell | 0.15 | 682.96 | Raw ScoresNeurons:Schwann_cell: 0.37, Smooth_muscle_cells:bronchial: 0.3, Smooth_muscle_cells:bronchial:vit_D: 0.29, Endothelial_cells:HUVEC:IFNg: 0.28, Fibroblasts:breast: 0.28, Fibroblasts:foreskin: 0.28, iPS_cells:adipose_stem_cells: 0.28, Tissue_stem_cells:BM_MSC:BMP2: 0.28, Smooth_muscle_cells:vascular: 0.28, Smooth_muscle_cells:vascular:IL-17: 0.28 |
| T19_TTCTCCTCAACGCACC.1 | Neurons:Schwann_cell | 0.14 | 663.07 | Raw ScoresNeurons:Schwann_cell: 0.36, Smooth_muscle_cells:bronchial: 0.29, Fibroblasts:foreskin: 0.29, Smooth_muscle_cells:bronchial:vit_D: 0.29, Fibroblasts:breast: 0.29, Tissue_stem_cells:iliac_MSC: 0.29, iPS_cells:adipose_stem_cells: 0.28, Tissue_stem_cells:BM_MSC:BMP2: 0.28, iPS_cells:foreskin_fibrobasts: 0.28, Tissue_stem_cells:BM_MSC:TGFb3: 0.28 |
| T19_CTGATAGCAGCCTTTC.1 | Neurons:Schwann_cell | 0.13 | 661.73 | Raw ScoresNeurons:Schwann_cell: 0.38, Fibroblasts:foreskin: 0.32, Smooth_muscle_cells:bronchial: 0.31, iPS_cells:adipose_stem_cells: 0.31, Endothelial_cells:HUVEC:IFNg: 0.31, Smooth_muscle_cells:bronchial:vit_D: 0.31, Tissue_stem_cells:BM_MSC:BMP2: 0.3, Fibroblasts:breast: 0.3, Endothelial_cells:lymphatic:TNFa_48h: 0.3, iPS_cells:foreskin_fibrobasts: 0.3 |
| T19_TACCTTAAGACTGTAA.1 | Neurons:Schwann_cell | 0.15 | 656.48 | Raw ScoresNeurons:Schwann_cell: 0.34, Smooth_muscle_cells:bronchial: 0.29, Smooth_muscle_cells:bronchial:vit_D: 0.28, Tissue_stem_cells:BM_MSC:BMP2: 0.28, Tissue_stem_cells:BM_MSC:TGFb3: 0.28, Fibroblasts:foreskin: 0.27, Tissue_stem_cells:iliac_MSC: 0.27, Chondrocytes:MSC-derived: 0.27, Osteoblasts: 0.27, Fibroblasts:breast: 0.27 |
| T19_CATATTCTCGGCTACG.1 | Neurons:Schwann_cell | 0.14 | 655.53 | Raw ScoresNeurons:Schwann_cell: 0.34, Fibroblasts:breast: 0.28, Smooth_muscle_cells:bronchial: 0.28, Smooth_muscle_cells:bronchial:vit_D: 0.27, iPS_cells:adipose_stem_cells: 0.27, Smooth_muscle_cells:vascular: 0.27, Fibroblasts:foreskin: 0.27, Smooth_muscle_cells:vascular:IL-17: 0.27, Tissue_stem_cells:BM_MSC:TGFb3: 0.26, Tissue_stem_cells:BM_MSC:BMP2: 0.26 |
| T19_CTAGTGATCTTCCTTC.1 | Neurons:Schwann_cell | 0.13 | 619.45 | Raw ScoresNeurons:Schwann_cell: 0.37, Tissue_stem_cells:BM_MSC:BMP2: 0.29, Tissue_stem_cells:BM_MSC:TGFb3: 0.29, Tissue_stem_cells:iliac_MSC: 0.29, Fibroblasts:breast: 0.29, Smooth_muscle_cells:bronchial: 0.28, iPS_cells:adipose_stem_cells: 0.28, Astrocyte:Embryonic_stem_cell-derived: 0.28, Smooth_muscle_cells:bronchial:vit_D: 0.28, Endothelial_cells:lymphatic:TNFa_48h: 0.28 |
| T19_AGGCCGTGTGCCTTGG.1 | Neurons:Schwann_cell | 0.16 | 619.18 | Raw ScoresNeurons:Schwann_cell: 0.36, Tissue_stem_cells:iliac_MSC: 0.28, Smooth_muscle_cells:bronchial: 0.27, Fibroblasts:breast: 0.27, Smooth_muscle_cells:bronchial:vit_D: 0.27, Astrocyte:Embryonic_stem_cell-derived: 0.27, Tissue_stem_cells:BM_MSC:BMP2: 0.27, iPS_cells:adipose_stem_cells: 0.27, Tissue_stem_cells:BM_MSC:TGFb3: 0.27, Endothelial_cells:lymphatic:TNFa_48h: 0.27 |
| T19_CCGTGGAAGAGGTAGA.1 | Neurons:Schwann_cell | 0.14 | 615.36 | Raw ScoresNeurons:Schwann_cell: 0.34, Smooth_muscle_cells:bronchial: 0.27, Smooth_muscle_cells:bronchial:vit_D: 0.27, Fibroblasts:foreskin: 0.27, Tissue_stem_cells:BM_MSC:BMP2: 0.27, Tissue_stem_cells:BM_MSC:TGFb3: 0.26, Tissue_stem_cells:iliac_MSC: 0.26, Fibroblasts:breast: 0.26, Endothelial_cells:HUVEC:IFNg: 0.26, iPS_cells:adipose_stem_cells: 0.26 |
| T19_GGACATTCACGGCCAT.1 | Neurons:Schwann_cell | 0.15 | 612.98 | Raw ScoresNeurons:Schwann_cell: 0.34, Smooth_muscle_cells:bronchial: 0.28, Smooth_muscle_cells:bronchial:vit_D: 0.28, Tissue_stem_cells:BM_MSC:BMP2: 0.27, Tissue_stem_cells:BM_MSC:TGFb3: 0.26, Tissue_stem_cells:iliac_MSC: 0.26, iPS_cells:adipose_stem_cells: 0.26, Chondrocytes:MSC-derived: 0.26, Fibroblasts:breast: 0.26, Fibroblasts:foreskin: 0.26 |
| T19_CCAGCGACATCGGTTA.1 | Neurons:Schwann_cell | 0.13 | 605.70 | Raw ScoresNeurons:Schwann_cell: 0.35, Smooth_muscle_cells:bronchial: 0.29, Smooth_muscle_cells:bronchial:vit_D: 0.29, Fibroblasts:foreskin: 0.29, Tissue_stem_cells:BM_MSC:TGFb3: 0.29, Tissue_stem_cells:iliac_MSC: 0.29, Tissue_stem_cells:BM_MSC:BMP2: 0.28, Astrocyte:Embryonic_stem_cell-derived: 0.28, Chondrocytes:MSC-derived: 0.28, Fibroblasts:breast: 0.28 |
| T19_GATGAGGTCTGCGACG.1 | Neurons:Schwann_cell | 0.15 | 598.31 | Raw ScoresNeurons:Schwann_cell: 0.36, Fibroblasts:foreskin: 0.29, Fibroblasts:breast: 0.29, iPS_cells:adipose_stem_cells: 0.28, Smooth_muscle_cells:bronchial: 0.28, iPS_cells:foreskin_fibrobasts: 0.28, Smooth_muscle_cells:bronchial:vit_D: 0.28, Tissue_stem_cells:BM_MSC:TGFb3: 0.28, iPS_cells:CRL2097_foreskin: 0.28, iPS_cells:skin_fibroblast: 0.28 |
| T19_ACTGATGGTCTAGCGC.1 | Neurons:Schwann_cell | 0.13 | 574.97 | Raw ScoresNeurons:Schwann_cell: 0.33, Tissue_stem_cells:BM_MSC:BMP2: 0.26, Smooth_muscle_cells:bronchial: 0.26, iPS_cells:adipose_stem_cells: 0.26, Chondrocytes:MSC-derived: 0.26, Tissue_stem_cells:BM_MSC:TGFb3: 0.26, Tissue_stem_cells:iliac_MSC: 0.26, Fibroblasts:breast: 0.26, Osteoblasts: 0.26, Smooth_muscle_cells:bronchial:vit_D: 0.26 |
| T19_AAAGATGTCACGGTTA.1 | Macrophage:monocyte-derived:IL-4/Dex/TGFb | 0.08 | 572.53 | Raw ScoresMacrophage:monocyte-derived:M-CSF: 0.35, Monocyte:leukotriene_D4: 0.34, Monocyte: 0.34, Monocyte:CD16-: 0.34, Monocyte:anti-FcgRIIB: 0.34, Monocyte:CD14+: 0.34, DC:monocyte-derived:AEC-conditioned: 0.33, Macrophage:monocyte-derived:M-CSF/IFNg: 0.33, Macrophage:monocyte-derived:IL-4/Dex/TGFb: 0.33, DC:monocyte-derived:anti-DC-SIGN_2h: 0.33 |
| T19_GATCGATGTTCACGGC.1 | Neurons:Schwann_cell | 0.13 | 569.82 | Raw ScoresNeurons:Schwann_cell: 0.35, Smooth_muscle_cells:bronchial: 0.28, Smooth_muscle_cells:bronchial:vit_D: 0.28, Fibroblasts:foreskin: 0.28, Fibroblasts:breast: 0.27, iPS_cells:adipose_stem_cells: 0.27, Tissue_stem_cells:iliac_MSC: 0.27, Tissue_stem_cells:BM_MSC:BMP2: 0.27, iPS_cells:CRL2097_foreskin: 0.27, Tissue_stem_cells:BM_MSC:TGFb3: 0.27 |
| T19_ATTGGACAGTACGTAA.1 | Neurons:Schwann_cell | 0.13 | 557.90 | Raw ScoresNeurons:Schwann_cell: 0.32, Smooth_muscle_cells:bronchial: 0.25, Smooth_muscle_cells:bronchial:vit_D: 0.25, Fibroblasts:foreskin: 0.24, Fibroblasts:breast: 0.24, iPS_cells:adipose_stem_cells: 0.24, Tissue_stem_cells:BM_MSC:TGFb3: 0.24, Astrocyte:Embryonic_stem_cell-derived: 0.24, Tissue_stem_cells:iliac_MSC: 0.24, Tissue_stem_cells:BM_MSC:BMP2: 0.24 |
| T19_TGCACCTTCAAGAAGT.1 | Neurons:Schwann_cell | 0.11 | 545.07 | Raw ScoresNeurons:Schwann_cell: 0.36, Smooth_muscle_cells:bronchial: 0.33, Tissue_stem_cells:BM_MSC:BMP2: 0.32, Smooth_muscle_cells:bronchial:vit_D: 0.32, Fibroblasts:foreskin: 0.32, iPS_cells:adipose_stem_cells: 0.32, Fibroblasts:breast: 0.32, Tissue_stem_cells:BM_MSC:TGFb3: 0.31, Chondrocytes:MSC-derived: 0.31, Osteoblasts: 0.31 |
| T19_CTAGTGAAGAAACGCC.1 | Neurons:Schwann_cell | 0.13 | 543.75 | Raw ScoresNeurons:Schwann_cell: 0.34, Tissue_stem_cells:BM_MSC:BMP2: 0.28, Smooth_muscle_cells:bronchial: 0.28, Fibroblasts:breast: 0.28, Tissue_stem_cells:BM_MSC:TGFb3: 0.28, Chondrocytes:MSC-derived: 0.27, Fibroblasts:foreskin: 0.27, Smooth_muscle_cells:bronchial:vit_D: 0.27, iPS_cells:adipose_stem_cells: 0.27, Tissue_stem_cells:BM_MSC: 0.27 |
| T19_AGATTGCCAGTAAGAT.1 | Neurons:Schwann_cell | 0.16 | 542.38 | Raw ScoresNeurons:Schwann_cell: 0.39, Smooth_muscle_cells:bronchial: 0.36, Fibroblasts:breast: 0.36, Smooth_muscle_cells:bronchial:vit_D: 0.36, iPS_cells:adipose_stem_cells: 0.36, Chondrocytes:MSC-derived: 0.35, Tissue_stem_cells:BM_MSC:BMP2: 0.35, Smooth_muscle_cells:vascular: 0.35, Osteoblasts: 0.35, iPS_cells:fibroblasts: 0.34 |
| T19_TGGCTGGCACCACCAG.1 | Neurons:Schwann_cell | 0.15 | 540.46 | Raw ScoresNeurons:Schwann_cell: 0.36, Smooth_muscle_cells:bronchial: 0.3, Smooth_muscle_cells:bronchial:vit_D: 0.29, Fibroblasts:breast: 0.29, iPS_cells:adipose_stem_cells: 0.29, Tissue_stem_cells:BM_MSC:BMP2: 0.29, Fibroblasts:foreskin: 0.28, Tissue_stem_cells:BM_MSC:TGFb3: 0.28, iPS_cells:foreskin_fibrobasts: 0.28, Astrocyte:Embryonic_stem_cell-derived: 0.28 |
| T19_GTCCTCACAGTATGCT.1 | Neurons:Schwann_cell | 0.15 | 538.04 | Raw ScoresNeurons:Schwann_cell: 0.38, Smooth_muscle_cells:bronchial: 0.31, Tissue_stem_cells:BM_MSC:BMP2: 0.31, Smooth_muscle_cells:bronchial:vit_D: 0.31, Tissue_stem_cells:BM_MSC:TGFb3: 0.3, Fibroblasts:foreskin: 0.3, Fibroblasts:breast: 0.3, iPS_cells:adipose_stem_cells: 0.3, Chondrocytes:MSC-derived: 0.3, iPS_cells:foreskin_fibrobasts: 0.29 |
| T19_GCGACCACATCCAACA.1 | Neurons:Schwann_cell | 0.14 | 508.41 | Raw ScoresNeurons:Schwann_cell: 0.38, Fibroblasts:breast: 0.36, Smooth_muscle_cells:bronchial: 0.36, iPS_cells:adipose_stem_cells: 0.36, Smooth_muscle_cells:bronchial:vit_D: 0.35, Tissue_stem_cells:BM_MSC:TGFb3: 0.35, Tissue_stem_cells:iliac_MSC: 0.35, Tissue_stem_cells:BM_MSC:BMP2: 0.35, Smooth_muscle_cells:vascular: 0.35, Osteoblasts: 0.35 |
| T19_AGAATAGCAGCGATCC.1 | Neurons:Schwann_cell | 0.12 | 508.30 | Raw ScoresNeurons:Schwann_cell: 0.32, Fibroblasts:foreskin: 0.27, Smooth_muscle_cells:bronchial: 0.27, iPS_cells:adipose_stem_cells: 0.26, Fibroblasts:breast: 0.26, Endothelial_cells:HUVEC:IFNg: 0.26, Smooth_muscle_cells:bronchial:vit_D: 0.26, Tissue_stem_cells:BM_MSC:BMP2: 0.26, Astrocyte:Embryonic_stem_cell-derived: 0.26, Tissue_stem_cells:BM_MSC:TGFb3: 0.26 |
| T19_TCTCTAAAGTACGATA.1 | Neurons:Schwann_cell | 0.13 | 500.41 | Raw ScoresNeurons:Schwann_cell: 0.33, Fibroblasts:foreskin: 0.27, Fibroblasts:breast: 0.27, Smooth_muscle_cells:bronchial: 0.27, Smooth_muscle_cells:bronchial:vit_D: 0.27, iPS_cells:adipose_stem_cells: 0.26, iPS_cells:foreskin_fibrobasts: 0.26, Tissue_stem_cells:BM_MSC:BMP2: 0.26, Tissue_stem_cells:BM_MSC:TGFb3: 0.26, Chondrocytes:MSC-derived: 0.26 |
| T19_CTAGTGAAGGCATTGG.1 | Monocyte:leukotriene_D4 | 0.11 | 490.10 | Raw ScoresMacrophage:monocyte-derived:M-CSF: 0.37, Monocyte:anti-FcgRIIB: 0.37, Monocyte:leukotriene_D4: 0.37, DC:monocyte-derived:AEC-conditioned: 0.36, Macrophage:monocyte-derived:M-CSF/IFNg: 0.36, Macrophage:monocyte-derived:M-CSF/IFNg/Pam3Cys: 0.36, Macrophage:monocyte-derived:IFNa: 0.36, Macrophage:monocyte-derived:S._aureus: 0.36, Monocyte: 0.36, Monocyte:CD16-: 0.36 |
| T19_CGAGAAGGTTATGCGT.1 | Neurons:Schwann_cell | 0.11 | 488.65 | Raw ScoresNeurons:Schwann_cell: 0.34, Fibroblasts:foreskin: 0.3, Endothelial_cells:HUVEC:IFNg: 0.29, Smooth_muscle_cells:bronchial: 0.28, Endothelial_cells:HUVEC:PR8-infected: 0.28, Smooth_muscle_cells:bronchial:vit_D: 0.28, DC:monocyte-derived:mature: 0.28, Tissue_stem_cells:BM_MSC:BMP2: 0.28, iPS_cells:adipose_stem_cells: 0.28, Endothelial_cells:lymphatic:TNFa_48h: 0.28 |
| T19_ATCACGAAGCTGAAAT.1 | Neurons:Schwann_cell | 0.13 | 478.63 | Raw ScoresNeurons:Schwann_cell: 0.32, Fibroblasts:breast: 0.26, Tissue_stem_cells:BM_MSC:TGFb3: 0.26, iPS_cells:adipose_stem_cells: 0.26, Tissue_stem_cells:BM_MSC:BMP2: 0.26, Smooth_muscle_cells:bronchial: 0.26, Fibroblasts:foreskin: 0.26, Smooth_muscle_cells:bronchial:vit_D: 0.25, Tissue_stem_cells:iliac_MSC: 0.25, Chondrocytes:MSC-derived: 0.25 |
| T19_GCCAAATGTCCGTGAC.1 | Neurons:Schwann_cell | 0.16 | 477.12 | Raw ScoresNeurons:Schwann_cell: 0.37, Smooth_muscle_cells:bronchial: 0.37, Fibroblasts:breast: 0.37, Smooth_muscle_cells:bronchial:vit_D: 0.37, iPS_cells:adipose_stem_cells: 0.36, Chondrocytes:MSC-derived: 0.36, Osteoblasts: 0.36, Tissue_stem_cells:BM_MSC:BMP2: 0.36, Tissue_stem_cells:BM_MSC:TGFb3: 0.35, Tissue_stem_cells:iliac_MSC: 0.35 |
| T19_GTTCTCGCAAGGACTG.1 | Neurons:Schwann_cell | 0.13 | 473.61 | Raw ScoresNeurons:Schwann_cell: 0.32, Fibroblasts:breast: 0.25, iPS_cells:adipose_stem_cells: 0.25, Tissue_stem_cells:BM_MSC:TGFb3: 0.25, Smooth_muscle_cells:bronchial: 0.24, Smooth_muscle_cells:bronchial:vit_D: 0.24, Tissue_stem_cells:BM_MSC: 0.24, Tissue_stem_cells:BM_MSC:BMP2: 0.24, Chondrocytes:MSC-derived: 0.24, Fibroblasts:foreskin: 0.24 |
| T19_CCAATCCCAAGCGTAG.1 | Neurons:Schwann_cell | 0.11 | 471.81 | Raw ScoresNeurons:Schwann_cell: 0.33, Astrocyte:Embryonic_stem_cell-derived: 0.27, Fibroblasts:foreskin: 0.27, iPS_cells:adipose_stem_cells: 0.26, Chondrocytes:MSC-derived: 0.26, Fibroblasts:breast: 0.26, Endothelial_cells:HUVEC:IFNg: 0.26, Tissue_stem_cells:BM_MSC:BMP2: 0.26, Tissue_stem_cells:BM_MSC:TGFb3: 0.26, Smooth_muscle_cells:bronchial: 0.26 |
| T19_CTCTACGCATTCTTAC.1 | Neurons:Schwann_cell | 0.11 | 469.71 | Raw ScoresNeurons:Schwann_cell: 0.31, Fibroblasts:foreskin: 0.24, Astrocyte:Embryonic_stem_cell-derived: 0.23, Smooth_muscle_cells:bronchial: 0.23, Endothelial_cells:HUVEC:IFNg: 0.23, Fibroblasts:breast: 0.23, iPS_cells:adipose_stem_cells: 0.23, Smooth_muscle_cells:bronchial:vit_D: 0.23, Tissue_stem_cells:BM_MSC:TGFb3: 0.23, Tissue_stem_cells:BM_MSC:BMP2: 0.23 |
| T19_CGTCTACGTACAGCAG.1 | Neurons:Schwann_cell | 0.13 | 467.14 | Raw ScoresNeurons:Schwann_cell: 0.32, Smooth_muscle_cells:bronchial: 0.24, Fibroblasts:breast: 0.24, Tissue_stem_cells:BM_MSC:BMP2: 0.24, iPS_cells:adipose_stem_cells: 0.24, Astrocyte:Embryonic_stem_cell-derived: 0.24, Smooth_muscle_cells:bronchial:vit_D: 0.24, Tissue_stem_cells:BM_MSC:TGFb3: 0.24, Endothelial_cells:HUVEC:IFNg: 0.24, Tissue_stem_cells:iliac_MSC: 0.24 |
| T19_CAAGGCCGTCACCTAA.1 | Neurons:Schwann_cell | 0.13 | 465.52 | Raw ScoresNeurons:Schwann_cell: 0.33, Astrocyte:Embryonic_stem_cell-derived: 0.26, Fibroblasts:foreskin: 0.26, Tissue_stem_cells:BM_MSC:BMP2: 0.26, Tissue_stem_cells:BM_MSC:TGFb3: 0.26, Smooth_muscle_cells:bronchial: 0.26, Fibroblasts:breast: 0.25, Smooth_muscle_cells:bronchial:vit_D: 0.25, Chondrocytes:MSC-derived: 0.25, Tissue_stem_cells:iliac_MSC: 0.25 |
| T19_CGAGCCACAGCTTAAC.1 | Neurons:Schwann_cell | 0.12 | 463.71 | Raw ScoresNeurons:Schwann_cell: 0.31, Smooth_muscle_cells:bronchial: 0.26, Smooth_muscle_cells:bronchial:vit_D: 0.26, Tissue_stem_cells:BM_MSC:BMP2: 0.26, Fibroblasts:breast: 0.25, Tissue_stem_cells:BM_MSC:TGFb3: 0.25, Fibroblasts:foreskin: 0.25, Tissue_stem_cells:iliac_MSC: 0.25, iPS_cells:adipose_stem_cells: 0.25, Astrocyte:Embryonic_stem_cell-derived: 0.25 |
| T19_CGAGCCAAGCCAGGAT.1 | Neurons:Schwann_cell | 0.12 | 451.07 | Raw ScoresNeurons:Schwann_cell: 0.33, Smooth_muscle_cells:bronchial: 0.27, Astrocyte:Embryonic_stem_cell-derived: 0.27, Smooth_muscle_cells:bronchial:vit_D: 0.27, Fibroblasts:breast: 0.27, Tissue_stem_cells:iliac_MSC: 0.26, Fibroblasts:foreskin: 0.26, iPS_cells:adipose_stem_cells: 0.26, iPS_cells:foreskin_fibrobasts: 0.26, Endothelial_cells:HUVEC:IFNg: 0.26 |
| T19_TCTCTAACACATGTGT.1 | Neurons:Schwann_cell | 0.13 | 445.75 | Raw ScoresNeurons:Schwann_cell: 0.32, Astrocyte:Embryonic_stem_cell-derived: 0.26, Smooth_muscle_cells:bronchial: 0.25, Smooth_muscle_cells:bronchial:vit_D: 0.25, Fibroblasts:breast: 0.25, Chondrocytes:MSC-derived: 0.24, Fibroblasts:foreskin: 0.24, Tissue_stem_cells:BM_MSC:TGFb3: 0.24, iPS_cells:adipose_stem_cells: 0.24, Tissue_stem_cells:BM_MSC: 0.24 |
| T19_AAGCCGCAGGCGATAC.1 | Neurons:Schwann_cell | 0.13 | 445.01 | Raw ScoresNeurons:Schwann_cell: 0.31, Smooth_muscle_cells:bronchial: 0.26, Smooth_muscle_cells:bronchial:vit_D: 0.26, Fibroblasts:foreskin: 0.26, Fibroblasts:breast: 0.25, Tissue_stem_cells:BM_MSC:BMP2: 0.25, iPS_cells:adipose_stem_cells: 0.24, Tissue_stem_cells:BM_MSC:TGFb3: 0.24, iPS_cells:foreskin_fibrobasts: 0.24, Tissue_stem_cells:iliac_MSC: 0.24 |
| T19_GGACGTCGTACCTACA.1 | Neurons:Schwann_cell | 0.14 | 442.89 | Raw ScoresNeurons:Schwann_cell: 0.36, Smooth_muscle_cells:bronchial: 0.29, Fibroblasts:foreskin: 0.29, Tissue_stem_cells:BM_MSC:BMP2: 0.28, Smooth_muscle_cells:bronchial:vit_D: 0.28, Fibroblasts:breast: 0.28, iPS_cells:adipose_stem_cells: 0.28, iPS_cells:foreskin_fibrobasts: 0.28, Tissue_stem_cells:BM_MSC:TGFb3: 0.28, iPS_cells:CRL2097_foreskin: 0.28 |
Below shows the significant enrichments of this GEP for literature curated gene lists
This data was procured from existing single cell RNA-seq maps of neuroblastoma or related relevant data.
High ranks indicate this gene is a driver of this GEP.
These curated gene list are ranked by the P-value (on this GEP) of their constituent genes.
The Mean Count column shows the mean read count in cells scoring highly (H > 50) on this gene expression program.
SCPs mouse and neuroblastoma (Olsen)
Similar to above, but for genes common to neuroblastoma SCP-like cells (as determined from their UMAP plot) and mouse SCP cells.:
Wilcoxon ranksum test P-value for gene set overrepresentation: 9.33e-09
Mean rank of genes in gene set: 134.55
Rank on gene expression program of genes in gene set:
| Genes | Weight | Rank | GTEx | DepMap | Decartes | Mean.Counts | Mean.TPM |
|---|---|---|---|---|---|---|---|
| S100B | 0.0259059 | 1 | GTEx | DepMap | Descartes | 21.89 | 9074.86 |
| PLP1 | 0.0233658 | 2 | GTEx | DepMap | Descartes | 4.44 | 653.76 |
| LGI4 | 0.0220981 | 3 | GTEx | DepMap | Descartes | 2.78 | 437.06 |
| FXYD1 | 0.0218314 | 4 | GTEx | DepMap | Descartes | 3.71 | 1797.47 |
| SEMA3B | 0.0213777 | 5 | GTEx | DepMap | Descartes | 3.61 | 511.41 |
| GPM6B | 0.0193109 | 10 | GTEx | DepMap | Descartes | 4.63 | 521.26 |
| MPZ | 0.0130732 | 21 | GTEx | DepMap | Descartes | 2.96 | 710.50 |
| ERBB3 | 0.0127857 | 23 | GTEx | DepMap | Descartes | 0.87 | 62.27 |
| CNN3 | 0.0084416 | 54 | GTEx | DepMap | Descartes | 3.31 | 663.27 |
| NRXN1 | 0.0046309 | 147 | GTEx | DepMap | Descartes | 2.20 | 105.92 |
| DST | 0.0007515 | 1210 | GTEx | DepMap | Descartes | 1.81 | 26.87 |
Schwann cell Precursor (Hanemaaijer)
Marker genes obtained from Supplementary Table SD of Hanemaaijer et al (PMID 33500353). The authors generated single-cell RNA-seq data (sort-seq, 2,229 cells total) from mouse adrenal glads at E13.5, E14.5, E17.5, E18.5, P1 and P5. These were marker genes that matched with a similar dataset generated by Furlan et al (PMID 28684471). This particular set of markers are for the SCP subcluster, which is part of the Adrenal Medulla cluster:
Wilcoxon ranksum test P-value for gene set overrepresentation: 4.98e-08
Mean rank of genes in gene set: 458.27
Rank on gene expression program of genes in gene set:
| Genes | Weight | Rank | GTEx | DepMap | Decartes | Mean.Counts | Mean.TPM |
|---|---|---|---|---|---|---|---|
| PLP1 | 0.0233658 | 2 | GTEx | DepMap | Descartes | 4.44 | 653.76 |
| ERBB3 | 0.0127857 | 23 | GTEx | DepMap | Descartes | 0.87 | 62.27 |
| TTYH1 | 0.0116816 | 30 | GTEx | DepMap | Descartes | 0.85 | 95.20 |
| CHL1 | 0.0083947 | 55 | GTEx | DepMap | Descartes | 1.12 | 63.87 |
| NGFR | 0.0080208 | 58 | GTEx | DepMap | Descartes | 1.20 | 129.85 |
| CNP | 0.0068866 | 77 | GTEx | DepMap | Descartes | 1.71 | 139.66 |
| CST3 | 0.0041104 | 172 | GTEx | DepMap | Descartes | 18.54 | 1771.14 |
| PTPRZ1 | 0.0034294 | 224 | GTEx | DepMap | Descartes | 0.27 | 12.74 |
| SERPINE2 | 0.0016862 | 507 | GTEx | DepMap | Descartes | 0.93 | 56.85 |
| LMO4 | 0.0007937 | 1143 | GTEx | DepMap | Descartes | 0.89 | 53.81 |
| DAGLA | 0.0002456 | 2750 | GTEx | DepMap | Descartes | 0.06 | 3.25 |
SCPs neuroblastoma unique (Olsen)
Similar to above, but for genes unique to neuroblastoma SCP-like cells. Note FN1 is often used as a mesenchymal marker gene.:
Wilcoxon ranksum test P-value for gene set overrepresentation: 2.32e-05
Mean rank of genes in gene set: 252.33
Rank on gene expression program of genes in gene set:
| Genes | Weight | Rank | GTEx | DepMap | Decartes | Mean.Counts | Mean.TPM |
|---|---|---|---|---|---|---|---|
| ITGB8 | 0.0208961 | 7 | GTEx | DepMap | Descartes | 2.60 | 134.09 |
| IFITM3 | 0.0126861 | 24 | GTEx | DepMap | Descartes | 20.43 | 11724.91 |
| TIMP3 | 0.0089899 | 49 | GTEx | DepMap | Descartes | 3.69 | 295.24 |
| GFRA3 | 0.0064768 | 86 | GTEx | DepMap | Descartes | 1.50 | 332.45 |
| ANXA1 | 0.0047934 | 139 | GTEx | DepMap | Descartes | 5.58 | 1043.81 |
| FN1 | 0.0007530 | 1209 | GTEx | DepMap | Descartes | 3.35 | 123.95 |
Below shows ranks on this GEP for literature curated gene lists for large gene sets
These include those reported as mesenchymal/adrenergic by Van Groningen et al.
High ranks indicate this gene is a driver of this GEP (note these results are not ordered).
The Mean Count column shows the mean read count in cells scoring highly (H > 50) on this gene expression program.
VanGroningen Adrenergic Genes
Adrenergic marker genes from Supplementary Table 2 of Van Groningen et al. Nature Genetics 2017. These genes were identified by differential expression analysis of mesenchymal-like and adrenergic-like neuroblastoma cell lines.
Wilcoxon ranksum test P-value for gene set overrepresentation: 1.00e+00
Mean rank of genes in gene set: 10375.28
Median rank of genes in gene set: 11536
Rank on gene expression program of top 30 genes in gene set:
| Genes | Weight | Rank | GTEx | DepMap | Descartes | Mean.Counts | Mean.TPM |
|---|---|---|---|---|---|---|---|
| AP1S2 | 0.0061818 | 92 | GTEx | DepMap | Descartes | 2.33 | 254.22 |
| L1CAM | 0.0024755 | 330 | GTEx | DepMap | Descartes | 0.80 | 69.47 |
| CELF2 | 0.0018775 | 456 | GTEx | DepMap | Descartes | 0.94 | 42.75 |
| HEY1 | 0.0014305 | 602 | GTEx | DepMap | Descartes | 0.18 | 18.62 |
| TMOD2 | 0.0012929 | 672 | GTEx | DepMap | Descartes | 0.43 | 19.28 |
| CDKN2C | 0.0010719 | 827 | GTEx | DepMap | Descartes | 0.38 | 47.08 |
| GAP43 | 0.0010126 | 886 | GTEx | DepMap | Descartes | 2.72 | 420.71 |
| GLDC | 0.0004997 | 1725 | GTEx | DepMap | Descartes | 0.03 | 2.99 |
| POPDC3 | 0.0004153 | 1971 | GTEx | DepMap | Descartes | 0.09 | 16.02 |
| PPP1R9A | 0.0003988 | 2036 | GTEx | DepMap | Descartes | 0.16 | 5.22 |
| PHPT1 | 0.0003803 | 2103 | GTEx | DepMap | Descartes | 2.24 | 521.13 |
| CETN3 | 0.0003545 | 2214 | GTEx | DepMap | Descartes | 0.22 | 26.68 |
| SETD7 | 0.0003529 | 2225 | GTEx | DepMap | Descartes | 0.14 | 5.14 |
| ST3GAL6 | 0.0003283 | 2323 | GTEx | DepMap | Descartes | 0.15 | 15.68 |
| FBXO8 | 0.0003230 | 2353 | GTEx | DepMap | Descartes | 0.15 | 24.58 |
| PPP2R3C | 0.0003023 | 2428 | GTEx | DepMap | Descartes | 0.36 | 53.56 |
| REC8 | 0.0002875 | 2505 | GTEx | DepMap | Descartes | 0.25 | 30.16 |
| MYO5A | 0.0002567 | 2692 | GTEx | DepMap | Descartes | 0.19 | 5.17 |
| GGCT | 0.0002216 | 2892 | GTEx | DepMap | Descartes | 0.58 | 124.48 |
| GRB10 | 0.0002196 | 2907 | GTEx | DepMap | Descartes | 0.07 | 3.54 |
| EXOC5 | 0.0001878 | 3150 | GTEx | DepMap | Descartes | 0.20 | 6.85 |
| FHOD3 | 0.0001749 | 3254 | GTEx | DepMap | Descartes | 0.12 | 6.80 |
| LSM3 | 0.0001419 | 3563 | GTEx | DepMap | Descartes | 1.38 | 115.76 |
| THSD7A | 0.0001197 | 3801 | GTEx | DepMap | Descartes | 0.20 | 6.20 |
| SYNPO2 | 0.0001031 | 3969 | GTEx | DepMap | Descartes | 0.47 | 7.88 |
| CADM1 | 0.0000924 | 4076 | GTEx | DepMap | Descartes | 0.81 | 27.84 |
| NPTX2 | 0.0000761 | 4236 | GTEx | DepMap | Descartes | 0.04 | 2.58 |
| ABCA3 | 0.0000574 | 4464 | GTEx | DepMap | Descartes | 0.15 | 6.63 |
| DUSP4 | 0.0000466 | 4588 | GTEx | DepMap | Descartes | 0.17 | 8.94 |
| BMP7 | -0.0000098 | 5366 | GTEx | DepMap | Descartes | 0.10 | 7.26 |
VanGroningen Mesenchymal Genes
Mesenchymal marker genes from Supplementary Table 2 of Van Groningen et al. Nature Genetics 2017. These genes were identified by differential expression analysis of mesenchymal-like and adrenergic-like neuroblastoma cell lines.
Wilcoxon ranksum test P-value for gene set overrepresentation: 1.68e-49
Mean rank of genes in gene set: 3758.78
Median rank of genes in gene set: 1921
Rank on gene expression program of top 30 genes in gene set:
| Genes | Weight | Rank | GTEx | DepMap | Descartes | Mean.Counts | Mean.TPM |
|---|---|---|---|---|---|---|---|
| PON2 | 0.0132064 | 20 | GTEx | DepMap | Descartes | 0.95 | 221.05 |
| IFITM3 | 0.0126861 | 24 | GTEx | DepMap | Descartes | 20.43 | 11724.91 |
| LGALS1 | 0.0099273 | 42 | GTEx | DepMap | Descartes | 22.85 | 13754.31 |
| CNN3 | 0.0084416 | 54 | GTEx | DepMap | Descartes | 3.31 | 663.27 |
| CSRP1 | 0.0078957 | 60 | GTEx | DepMap | Descartes | 1.72 | 79.21 |
| SPARC | 0.0077700 | 63 | GTEx | DepMap | Descartes | 9.14 | 958.42 |
| VIM | 0.0075168 | 67 | GTEx | DepMap | Descartes | 26.71 | 3434.20 |
| RHOC | 0.0071720 | 71 | GTEx | DepMap | Descartes | 2.66 | 451.65 |
| CLIC4 | 0.0069724 | 73 | GTEx | DepMap | Descartes | 1.17 | 112.75 |
| ZCCHC24 | 0.0065856 | 84 | GTEx | DepMap | Descartes | 0.43 | 32.65 |
| PLSCR4 | 0.0061123 | 93 | GTEx | DepMap | Descartes | 0.33 | 42.69 |
| LAMC1 | 0.0058604 | 101 | GTEx | DepMap | Descartes | 0.85 | 40.20 |
| S1PR3 | 0.0056350 | 110 | GTEx | DepMap | Descartes | 0.31 | 13.03 |
| B2M | 0.0056256 | 112 | GTEx | DepMap | Descartes | 98.10 | 14686.51 |
| ANXA1 | 0.0047934 | 139 | GTEx | DepMap | Descartes | 5.58 | 1043.81 |
| PTN | 0.0047874 | 141 | GTEx | DepMap | Descartes | 1.94 | 489.15 |
| SDC4 | 0.0047743 | 142 | GTEx | DepMap | Descartes | 0.27 | 38.32 |
| TNFRSF12A | 0.0044315 | 157 | GTEx | DepMap | Descartes | 1.03 | 210.12 |
| ANXA2 | 0.0044016 | 159 | GTEx | DepMap | Descartes | 6.56 | 690.99 |
| WLS | 0.0040976 | 174 | GTEx | DepMap | Descartes | 0.22 | 34.70 |
| ARPC1B | 0.0040264 | 178 | GTEx | DepMap | Descartes | 3.03 | 600.02 |
| CYBRD1 | 0.0039389 | 184 | GTEx | DepMap | Descartes | 0.35 | 30.34 |
| GPR137B | 0.0038017 | 193 | GTEx | DepMap | Descartes | 0.35 | 69.94 |
| DKK3 | 0.0037807 | 197 | GTEx | DepMap | Descartes | 0.91 | 37.36 |
| IFITM2 | 0.0037679 | 198 | GTEx | DepMap | Descartes | 3.44 | 1424.48 |
| NID2 | 0.0037550 | 200 | GTEx | DepMap | Descartes | 0.17 | 13.66 |
| ID3 | 0.0035940 | 206 | GTEx | DepMap | Descartes | 3.06 | 1260.03 |
| PHLDA3 | 0.0035858 | 207 | GTEx | DepMap | Descartes | 0.64 | 88.97 |
| LAMP1 | 0.0035472 | 210 | GTEx | DepMap | Descartes | 1.43 | 93.89 |
| CD63 | 0.0035432 | 212 | GTEx | DepMap | Descartes | 11.40 | 2919.01 |
Descartes adrenocortical markers
Top 50 marker genes of adrenocortical cells in the Decartes fetal adrenal single cell map (https://atlas.brotmanbaty.org/bbi/human-gene-expression-during-development/cell/adrenocortical/in/adrenal)
Wilcoxon ranksum test P-value for gene set overrepresentation: 7.02e-01
Mean rank of genes in gene set: 6594.5
Median rank of genes in gene set: 7509.5
Rank on gene expression program of top 30 genes in gene set:
| Genes | Weight | Rank | GTEx | DepMap | Descartes | Mean.Counts | Mean.TPM |
|---|---|---|---|---|---|---|---|
| CLU | 0.0059024 | 99 | GTEx | DepMap | Descartes | 3.59 | 586.79 |
| FREM2 | 0.0048730 | 136 | GTEx | DepMap | Descartes | 0.09 | 2.31 |
| SH3PXD2B | 0.0007633 | 1193 | GTEx | DepMap | Descartes | 0.12 | 4.04 |
| FRMD5 | 0.0006849 | 1327 | GTEx | DepMap | Descartes | 0.10 | 5.47 |
| SH3BP5 | 0.0005880 | 1494 | GTEx | DepMap | Descartes | 0.46 | 41.90 |
| CYB5B | 0.0004867 | 1761 | GTEx | DepMap | Descartes | 0.36 | 25.12 |
| FDXR | 0.0004097 | 1987 | GTEx | DepMap | Descartes | 0.11 | 16.30 |
| LDLR | 0.0002596 | 2674 | GTEx | DepMap | Descartes | 0.09 | 4.49 |
| GRAMD1B | 0.0002245 | 2875 | GTEx | DepMap | Descartes | 0.07 | 2.26 |
| NPC1 | 0.0001901 | 3127 | GTEx | DepMap | Descartes | 0.06 | 2.84 |
| POR | 0.0001471 | 3505 | GTEx | DepMap | Descartes | 0.28 | 33.76 |
| SCAP | 0.0001388 | 3605 | GTEx | DepMap | Descartes | 0.20 | 15.60 |
| PAPSS2 | 0.0001198 | 3798 | GTEx | DepMap | Descartes | 0.03 | 2.47 |
| HMGCS1 | 0.0000942 | 4053 | GTEx | DepMap | Descartes | 0.14 | 7.64 |
| FDX1 | -0.0000405 | 6130 | GTEx | DepMap | Descartes | 0.41 | 34.41 |
| BAIAP2L1 | -0.0000488 | 6358 | GTEx | DepMap | Descartes | 0.00 | 0.00 |
| FDPS | -0.0000687 | 6830 | GTEx | DepMap | Descartes | 0.57 | 74.23 |
| MSMO1 | -0.0000831 | 7201 | GTEx | DepMap | Descartes | 0.17 | 19.47 |
| ERN1 | -0.0001093 | 7818 | GTEx | DepMap | Descartes | 0.13 | 3.01 |
| SGCZ | -0.0001151 | 7941 | GTEx | DepMap | Descartes | 0.00 | 0.00 |
| STAR | -0.0001160 | 7962 | GTEx | DepMap | Descartes | 0.01 | 0.41 |
| INHA | -0.0001388 | 8478 | GTEx | DepMap | Descartes | 0.00 | 0.00 |
| SCARB1 | -0.0001819 | 9334 | GTEx | DepMap | Descartes | 0.09 | 2.96 |
| PDE10A | -0.0001820 | 9336 | GTEx | DepMap | Descartes | 0.05 | 1.28 |
| DHCR7 | -0.0001933 | 9558 | GTEx | DepMap | Descartes | 0.02 | 2.89 |
| GSTA4 | -0.0002045 | 9746 | GTEx | DepMap | Descartes | 0.38 | 72.25 |
| APOC1 | -0.0002308 | 10166 | GTEx | DepMap | Descartes | 6.17 | 1722.55 |
| IGF1R | -0.0002373 | 10288 | GTEx | DepMap | Descartes | 0.10 | 1.99 |
| JAKMIP2 | -0.0002383 | 10299 | GTEx | DepMap | Descartes | 0.11 | 3.59 |
| DHCR24 | -0.0002527 | 10470 | GTEx | DepMap | Descartes | 0.03 | 1.40 |
Descartes chromaffin markers
Top 50 marker genes of chromaffin cells in the Decartes fetal adrenal single cell map (https://atlas.brotmanbaty.org/bbi/human-gene-expression-during-development/cell/chromaffin/in/adrenal)
Wilcoxon ranksum test P-value for gene set overrepresentation: 1.00e+00
Mean rank of genes in gene set: 10921.46
Median rank of genes in gene set: 12031
Rank on gene expression program of top 30 genes in gene set:
| Genes | Weight | Rank | GTEx | DepMap | Descartes | Mean.Counts | Mean.TPM |
|---|---|---|---|---|---|---|---|
| GAP43 | 0.0010126 | 886 | GTEx | DepMap | Descartes | 2.72 | 420.71 |
| SYNPO2 | 0.0001031 | 3969 | GTEx | DepMap | Descartes | 0.47 | 7.88 |
| ALK | -0.0001348 | 8392 | GTEx | DepMap | Descartes | 0.04 | 1.76 |
| EPHA6 | -0.0001460 | 8625 | GTEx | DepMap | Descartes | 0.00 | 0.00 |
| SLC44A5 | -0.0001494 | 8708 | GTEx | DepMap | Descartes | 0.01 | 0.39 |
| RPH3A | -0.0001716 | 9137 | GTEx | DepMap | Descartes | 0.00 | 0.00 |
| ANKFN1 | -0.0001756 | 9209 | GTEx | DepMap | Descartes | 0.01 | 0.44 |
| RGMB | -0.0001878 | 9458 | GTEx | DepMap | Descartes | 0.19 | 8.12 |
| CNKSR2 | -0.0002052 | 9767 | GTEx | DepMap | Descartes | 0.02 | 0.92 |
| PLXNA4 | -0.0002202 | 10008 | GTEx | DepMap | Descartes | 0.03 | 0.54 |
| HS3ST5 | -0.0002462 | 10398 | GTEx | DepMap | Descartes | 0.02 | 1.76 |
| RYR2 | -0.0002556 | 10495 | GTEx | DepMap | Descartes | 0.02 | 0.05 |
| GREM1 | -0.0002655 | 10612 | GTEx | DepMap | Descartes | 0.00 | 0.00 |
| FAT3 | -0.0002708 | 10676 | GTEx | DepMap | Descartes | 0.01 | 0.05 |
| EYA4 | -0.0002717 | 10689 | GTEx | DepMap | Descartes | 0.01 | 0.25 |
| EYA1 | -0.0002979 | 10969 | GTEx | DepMap | Descartes | 0.04 | 1.20 |
| KCNB2 | -0.0003154 | 11115 | GTEx | DepMap | Descartes | 0.01 | 0.21 |
| PTCHD1 | -0.0003361 | 11267 | GTEx | DepMap | Descartes | 0.01 | 0.05 |
| TMEM132C | -0.0003939 | 11646 | GTEx | DepMap | Descartes | 0.02 | 0.39 |
| SLC6A2 | -0.0004385 | 11860 | GTEx | DepMap | Descartes | 0.01 | 0.37 |
| RBFOX1 | -0.0004866 | 12031 | GTEx | DepMap | Descartes | 0.04 | 1.30 |
| TMEFF2 | -0.0005213 | 12123 | GTEx | DepMap | Descartes | 0.05 | 1.67 |
| GAL | -0.0005482 | 12185 | GTEx | DepMap | Descartes | 0.23 | 49.31 |
| REEP1 | -0.0005672 | 12212 | GTEx | DepMap | Descartes | 0.07 | 1.81 |
| TUBB2A | -0.0006175 | 12286 | GTEx | DepMap | Descartes | 1.09 | 145.28 |
| MAB21L2 | -0.0006399 | 12310 | GTEx | DepMap | Descartes | 0.18 | 5.47 |
| MAB21L1 | -0.0006636 | 12335 | GTEx | DepMap | Descartes | 0.28 | 14.83 |
| IL7 | -0.0006888 | 12356 | GTEx | DepMap | Descartes | 0.07 | 5.44 |
| NTRK1 | -0.0007003 | 12364 | GTEx | DepMap | Descartes | 0.09 | 2.94 |
| ELAVL2 | -0.0007268 | 12384 | GTEx | DepMap | Descartes | 0.18 | 6.10 |
Descartes Vascular_endothelial markers
Top 50 marker genes of Vascular_endothelial cells in the Decartes fetal adrenal single cell map (https://atlas.brotmanbaty.org/bbi/human-gene-expression-during-development/cell/vascular_endothelial/in/adrenal)
Wilcoxon ranksum test P-value for gene set overrepresentation: 9.63e-01
Mean rank of genes in gene set: 7322.66
Median rank of genes in gene set: 7560.5
Rank on gene expression program of top 30 genes in gene set:
| Genes | Weight | Rank | GTEx | DepMap | Descartes | Mean.Counts | Mean.TPM |
|---|---|---|---|---|---|---|---|
| GALNT15 | 0.0003838 | 2093 | GTEx | DepMap | Descartes | 0.01 | NA |
| ID1 | 0.0003082 | 2405 | GTEx | DepMap | Descartes | 0.38 | 102.73 |
| CDH13 | 0.0002537 | 2715 | GTEx | DepMap | Descartes | 0.07 | 1.44 |
| F8 | 0.0001916 | 3109 | GTEx | DepMap | Descartes | 0.02 | 0.86 |
| SHE | 0.0000742 | 4261 | GTEx | DepMap | Descartes | 0.02 | 0.90 |
| CEACAM1 | 0.0000735 | 4272 | GTEx | DepMap | Descartes | 0.01 | 0.60 |
| BTNL9 | 0.0000566 | 4474 | GTEx | DepMap | Descartes | 0.01 | 0.20 |
| KANK3 | 0.0000561 | 4483 | GTEx | DepMap | Descartes | 0.04 | 4.45 |
| CRHBP | 0.0000126 | 5006 | GTEx | DepMap | Descartes | 0.04 | 3.60 |
| TIE1 | 0.0000094 | 5050 | GTEx | DepMap | Descartes | 0.02 | 0.83 |
| NOTCH4 | 0.0000017 | 5159 | GTEx | DepMap | Descartes | 0.09 | 4.28 |
| RASIP1 | -0.0000016 | 5217 | GTEx | DepMap | Descartes | 0.02 | 0.71 |
| SLCO2A1 | -0.0000041 | 5258 | GTEx | DepMap | Descartes | 0.02 | 1.43 |
| NR5A2 | -0.0000072 | 5321 | GTEx | DepMap | Descartes | 0.01 | 0.22 |
| ESM1 | -0.0000357 | 6012 | GTEx | DepMap | Descartes | 0.00 | 0.00 |
| PTPRB | -0.0000505 | 6390 | GTEx | DepMap | Descartes | 0.08 | 0.90 |
| NPR1 | -0.0000703 | 6865 | GTEx | DepMap | Descartes | 0.01 | 1.10 |
| HYAL2 | -0.0000817 | 7174 | GTEx | DepMap | Descartes | 0.31 | 18.70 |
| KDR | -0.0000857 | 7260 | GTEx | DepMap | Descartes | 0.02 | 0.40 |
| FLT4 | -0.0001114 | 7861 | GTEx | DepMap | Descartes | 0.01 | 0.19 |
| TMEM88 | -0.0001316 | 8328 | GTEx | DepMap | Descartes | 0.10 | 20.61 |
| IRX3 | -0.0001390 | 8483 | GTEx | DepMap | Descartes | 0.02 | 1.95 |
| MYRIP | -0.0001408 | 8527 | GTEx | DepMap | Descartes | 0.02 | 0.48 |
| PLVAP | -0.0001512 | 8756 | GTEx | DepMap | Descartes | 0.07 | 4.47 |
| CYP26B1 | -0.0001713 | 9132 | GTEx | DepMap | Descartes | 0.09 | 2.13 |
| EHD3 | -0.0001883 | 9469 | GTEx | DepMap | Descartes | 0.03 | 0.97 |
| SHANK3 | -0.0001939 | 9572 | GTEx | DepMap | Descartes | 0.02 | 0.27 |
| CDH5 | -0.0002083 | 9823 | GTEx | DepMap | Descartes | 0.02 | 0.93 |
| PODXL | -0.0002087 | 9827 | GTEx | DepMap | Descartes | 0.05 | 1.11 |
| EFNB2 | -0.0002134 | 9915 | GTEx | DepMap | Descartes | 0.14 | 5.68 |
Descartes stromal markers
Top 50 marker genes of stromal cells in the Decartes fetal adrenal single cell map (https://atlas.brotmanbaty.org/bbi/human-gene-expression-during-development/cell/stromal/in/adrenal)
Wilcoxon ranksum test P-value for gene set overrepresentation: 8.06e-01
Mean rank of genes in gene set: 6745.18
Median rank of genes in gene set: 7432
Rank on gene expression program of top 30 genes in gene set:
| Genes | Weight | Rank | GTEx | DepMap | Descartes | Mean.Counts | Mean.TPM |
|---|---|---|---|---|---|---|---|
| CLDN11 | 0.0021695 | 378 | GTEx | DepMap | Descartes | 0.06 | 5.86 |
| COL1A2 | 0.0020028 | 420 | GTEx | DepMap | Descartes | 5.06 | 280.41 |
| COL27A1 | 0.0016951 | 503 | GTEx | DepMap | Descartes | 0.09 | 3.11 |
| COL12A1 | 0.0016814 | 508 | GTEx | DepMap | Descartes | 0.37 | 10.77 |
| RSPO3 | 0.0015454 | 553 | GTEx | DepMap | Descartes | 0.05 | NA |
| COL3A1 | 0.0013487 | 647 | GTEx | DepMap | Descartes | 2.98 | 184.36 |
| ABCA6 | 0.0011679 | 750 | GTEx | DepMap | Descartes | 0.30 | 14.11 |
| ISLR | 0.0009140 | 980 | GTEx | DepMap | Descartes | 0.45 | 64.41 |
| FREM1 | 0.0003766 | 2123 | GTEx | DepMap | Descartes | 0.05 | 1.40 |
| ADAMTS2 | 0.0002318 | 2836 | GTEx | DepMap | Descartes | 0.09 | 3.29 |
| GLI2 | 0.0002289 | 2851 | GTEx | DepMap | Descartes | 0.02 | 1.00 |
| PAMR1 | 0.0001912 | 3113 | GTEx | DepMap | Descartes | 0.28 | 22.26 |
| BICC1 | 0.0000856 | 4141 | GTEx | DepMap | Descartes | 0.25 | 10.32 |
| ACTA2 | 0.0000570 | 4467 | GTEx | DepMap | Descartes | 1.20 | 207.80 |
| PRRX1 | 0.0000242 | 4860 | GTEx | DepMap | Descartes | 0.23 | 14.32 |
| ADAMTSL3 | -0.0000586 | 6583 | GTEx | DepMap | Descartes | 0.00 | 0.00 |
| LOX | -0.0000673 | 6797 | GTEx | DepMap | Descartes | 0.05 | 2.70 |
| CDH11 | -0.0000742 | 6961 | GTEx | DepMap | Descartes | 0.14 | 5.72 |
| EDNRA | -0.0000819 | 7178 | GTEx | DepMap | Descartes | 0.05 | 3.53 |
| LRRC17 | -0.0000870 | 7293 | GTEx | DepMap | Descartes | 0.06 | 6.18 |
| ABCC9 | -0.0000872 | 7300 | GTEx | DepMap | Descartes | 0.04 | 0.93 |
| GAS2 | -0.0000910 | 7393 | GTEx | DepMap | Descartes | 0.00 | 0.00 |
| ITGA11 | -0.0000942 | 7471 | GTEx | DepMap | Descartes | 0.01 | 0.38 |
| COL6A3 | -0.0001057 | 7728 | GTEx | DepMap | Descartes | 0.48 | 12.84 |
| LAMC3 | -0.0001183 | 8019 | GTEx | DepMap | Descartes | 0.00 | 0.00 |
| DKK2 | -0.0001293 | 8269 | GTEx | DepMap | Descartes | 0.00 | 0.00 |
| IGFBP3 | -0.0001456 | 8619 | GTEx | DepMap | Descartes | 0.12 | 9.27 |
| C7 | -0.0001482 | 8676 | GTEx | DepMap | Descartes | 0.22 | 11.50 |
| CD248 | -0.0001531 | 8787 | GTEx | DepMap | Descartes | 0.07 | 6.88 |
| SCARA5 | -0.0001538 | 8807 | GTEx | DepMap | Descartes | 0.07 | 4.35 |
Descartes sympathoblasts markers
Top 50 marker genes of sympathoblasts cells in the Decartes fetal adrenal single cell map (https://atlas.brotmanbaty.org/bbi/human-gene-expression-during-development/cell/sympathoblasts/in/adrenal)
Wilcoxon ranksum test P-value for gene set overrepresentation: 1.00e+00
Mean rank of genes in gene set: 9092.92
Median rank of genes in gene set: 9678.5
Rank on gene expression program of top 30 genes in gene set:
| Genes | Weight | Rank | GTEx | DepMap | Descartes | Mean.Counts | Mean.TPM |
|---|---|---|---|---|---|---|---|
| PENK | 0.0042416 | 167 | GTEx | DepMap | Descartes | 0.37 | 83.03 |
| SLC35F3 | 0.0001735 | 3265 | GTEx | DepMap | Descartes | 0.01 | 1.47 |
| GRM7 | 0.0001113 | 3878 | GTEx | DepMap | Descartes | 0.01 | 0.70 |
| PCSK2 | 0.0000374 | 4693 | GTEx | DepMap | Descartes | 0.04 | 2.65 |
| NTNG1 | -0.0000246 | 5726 | GTEx | DepMap | Descartes | 0.05 | 2.85 |
| PACRG | -0.0000422 | 6176 | GTEx | DepMap | Descartes | 0.02 | 6.93 |
| LAMA3 | -0.0000505 | 6391 | GTEx | DepMap | Descartes | 0.00 | 0.00 |
| ST18 | -0.0000987 | 7578 | GTEx | DepMap | Descartes | 0.00 | 0.00 |
| SORCS3 | -0.0001005 | 7609 | GTEx | DepMap | Descartes | 0.00 | 0.00 |
| CDH12 | -0.0001025 | 7656 | GTEx | DepMap | Descartes | 0.01 | 0.53 |
| TENM1 | -0.0001108 | 7848 | GTEx | DepMap | Descartes | 0.06 | NA |
| TBX20 | -0.0001131 | 7905 | GTEx | DepMap | Descartes | 0.00 | 0.00 |
| DGKK | -0.0001134 | 7911 | GTEx | DepMap | Descartes | 0.03 | 0.81 |
| CNTN3 | -0.0001172 | 7990 | GTEx | DepMap | Descartes | 0.00 | 0.00 |
| CDH18 | -0.0001182 | 8017 | GTEx | DepMap | Descartes | 0.01 | 0.36 |
| SLC24A2 | -0.0001277 | 8239 | GTEx | DepMap | Descartes | 0.01 | 0.08 |
| MGAT4C | -0.0001469 | 8644 | GTEx | DepMap | Descartes | 0.09 | 0.76 |
| CCSER1 | -0.0001746 | 9191 | GTEx | DepMap | Descartes | 0.01 | NA |
| EML6 | -0.0001852 | 9401 | GTEx | DepMap | Descartes | 0.00 | 0.00 |
| GALNTL6 | -0.0002160 | 9956 | GTEx | DepMap | Descartes | 0.01 | 0.21 |
| AGBL4 | -0.0002172 | 9969 | GTEx | DepMap | Descartes | 0.01 | 0.41 |
| GRID2 | -0.0002358 | 10250 | GTEx | DepMap | Descartes | 0.01 | 0.03 |
| FGF14 | -0.0002521 | 10464 | GTEx | DepMap | Descartes | 0.07 | 0.90 |
| KSR2 | -0.0002758 | 10742 | GTEx | DepMap | Descartes | 0.02 | 0.22 |
| SPOCK3 | -0.0002846 | 10834 | GTEx | DepMap | Descartes | 0.02 | 1.29 |
| UNC80 | -0.0003475 | 11357 | GTEx | DepMap | Descartes | 0.06 | 0.36 |
| FAM155A | -0.0003534 | 11390 | GTEx | DepMap | Descartes | 0.06 | 1.12 |
| ROBO1 | -0.0003622 | 11451 | GTEx | DepMap | Descartes | 0.08 | 1.81 |
| TIAM1 | -0.0003913 | 11633 | GTEx | DepMap | Descartes | 0.10 | 3.60 |
| ARC | -0.0004043 | 11699 | GTEx | DepMap | Descartes | 0.36 | 32.37 |
Descartes erythroblasts markers
Top 50 marker genes of erythroblasts cells in the Decartes fetal adrenal single cell map (https://atlas.brotmanbaty.org/bbi/human-gene-expression-during-development/cell/erythroblasts/in/adrenal)
Wilcoxon ranksum test P-value for gene set overrepresentation: 2.37e-01
Mean rank of genes in gene set: 5793.55
Median rank of genes in gene set: 5745
Rank on gene expression program of top 30 genes in gene set:
| Genes | Weight | Rank | GTEx | DepMap | Descartes | Mean.Counts | Mean.TPM |
|---|---|---|---|---|---|---|---|
| SNCA | 0.0057711 | 105 | GTEx | DepMap | Descartes | 1.28 | 186.22 |
| CAT | 0.0020490 | 412 | GTEx | DepMap | Descartes | 0.47 | 84.69 |
| BLVRB | 0.0007440 | 1223 | GTEx | DepMap | Descartes | 0.79 | 176.32 |
| SELENBP1 | 0.0006087 | 1464 | GTEx | DepMap | Descartes | 0.13 | 8.92 |
| TSPAN5 | 0.0005507 | 1597 | GTEx | DepMap | Descartes | 0.43 | 35.92 |
| SLC25A21 | 0.0003412 | 2279 | GTEx | DepMap | Descartes | 0.00 | 0.00 |
| RGS6 | 0.0002634 | 2649 | GTEx | DepMap | Descartes | 0.02 | 1.72 |
| SPECC1 | 0.0002143 | 2953 | GTEx | DepMap | Descartes | 0.06 | 2.81 |
| MARCH3 | 0.0001774 | 3231 | GTEx | DepMap | Descartes | 0.07 | NA |
| XPO7 | 0.0000882 | 4120 | GTEx | DepMap | Descartes | 0.10 | 6.47 |
| SOX6 | 0.0000610 | 4416 | GTEx | DepMap | Descartes | 0.10 | 3.92 |
| SLC4A1 | -0.0000002 | 5192 | GTEx | DepMap | Descartes | 0.01 | 0.18 |
| RAPGEF2 | -0.0000102 | 5373 | GTEx | DepMap | Descartes | 0.12 | 3.23 |
| RHD | -0.0000240 | 5712 | GTEx | DepMap | Descartes | 0.00 | 0.00 |
| ABCB10 | -0.0000255 | 5745 | GTEx | DepMap | Descartes | 0.06 | 3.13 |
| TRAK2 | -0.0000290 | 5833 | GTEx | DepMap | Descartes | 0.10 | 4.36 |
| SLC25A37 | -0.0000373 | 6045 | GTEx | DepMap | Descartes | 0.31 | 14.76 |
| ALAS2 | -0.0000508 | 6400 | GTEx | DepMap | Descartes | 0.00 | 0.00 |
| GYPC | -0.0000841 | 7227 | GTEx | DepMap | Descartes | 0.77 | 114.09 |
| TMCC2 | -0.0000920 | 7427 | GTEx | DepMap | Descartes | 0.04 | 0.96 |
| FECH | -0.0001065 | 7748 | GTEx | DepMap | Descartes | 0.07 | 2.41 |
| CPOX | -0.0001564 | 8846 | GTEx | DepMap | Descartes | 0.04 | 3.02 |
| ANK1 | -0.0001828 | 9353 | GTEx | DepMap | Descartes | 0.02 | 0.26 |
| SPTB | -0.0001979 | 9649 | GTEx | DepMap | Descartes | 0.01 | 0.25 |
| DENND4A | -0.0002238 | 10061 | GTEx | DepMap | Descartes | 0.07 | 2.60 |
| TFR2 | -0.0002252 | 10086 | GTEx | DepMap | Descartes | 0.01 | 0.25 |
| MICAL2 | -0.0002503 | 10446 | GTEx | DepMap | Descartes | 0.03 | 0.56 |
| GCLC | -0.0002534 | 10480 | GTEx | DepMap | Descartes | 0.04 | 1.98 |
| EPB41 | -0.0004585 | 11941 | GTEx | DepMap | Descartes | 0.06 | 1.76 |
| NA | NA | NA | NA | NA | NA | NA | NA |
Descartes myeloid markers
Top 50 marker genes of myeloid cells in the Decartes fetal adrenal single cell map (https://atlas.brotmanbaty.org/bbi/human-gene-expression-during-development/cell/myeloid/in/adrenal)
Wilcoxon ranksum test P-value for gene set overrepresentation: 3.22e-01
Mean rank of genes in gene set: 6003.42
Median rank of genes in gene set: 6136
Rank on gene expression program of top 30 genes in gene set:
| Genes | Weight | Rank | GTEx | DepMap | Descartes | Mean.Counts | Mean.TPM |
|---|---|---|---|---|---|---|---|
| CST3 | 0.0041104 | 172 | GTEx | DepMap | Descartes | 18.54 | 1771.14 |
| WWP1 | 0.0027183 | 292 | GTEx | DepMap | Descartes | 0.33 | 31.59 |
| CD74 | 0.0022745 | 360 | GTEx | DepMap | Descartes | 24.49 | 2543.74 |
| AXL | 0.0021069 | 397 | GTEx | DepMap | Descartes | 0.58 | 34.18 |
| CTSC | 0.0019269 | 443 | GTEx | DepMap | Descartes | 2.90 | 114.16 |
| ABCA1 | 0.0015499 | 550 | GTEx | DepMap | Descartes | 0.37 | 12.55 |
| FGL2 | 0.0013593 | 643 | GTEx | DepMap | Descartes | 0.73 | 47.94 |
| PTPRE | 0.0009522 | 942 | GTEx | DepMap | Descartes | 0.49 | 22.82 |
| CTSD | 0.0007587 | 1203 | GTEx | DepMap | Descartes | 5.17 | 637.05 |
| RGL1 | 0.0006303 | 1422 | GTEx | DepMap | Descartes | 0.22 | 14.67 |
| FGD2 | 0.0002032 | 3034 | GTEx | DepMap | Descartes | 0.03 | 1.60 |
| ATP8B4 | 0.0001364 | 3637 | GTEx | DepMap | Descartes | 0.05 | 2.62 |
| MARCH1 | 0.0000935 | 4061 | GTEx | DepMap | Descartes | 0.17 | NA |
| MERTK | 0.0000891 | 4106 | GTEx | DepMap | Descartes | 0.09 | 5.15 |
| IFNGR1 | 0.0000854 | 4146 | GTEx | DepMap | Descartes | 0.49 | 52.04 |
| MS4A4A | -0.0000044 | 5264 | GTEx | DepMap | Descartes | 0.76 | 72.78 |
| SLC1A3 | -0.0000268 | 5778 | GTEx | DepMap | Descartes | 0.11 | 5.32 |
| CD14 | -0.0000282 | 5813 | GTEx | DepMap | Descartes | 1.83 | 197.54 |
| CSF1R | -0.0000285 | 5824 | GTEx | DepMap | Descartes | 0.32 | 18.80 |
| SLC9A9 | -0.0000528 | 6448 | GTEx | DepMap | Descartes | 0.09 | 8.98 |
| LGMN | -0.0000944 | 7474 | GTEx | DepMap | Descartes | 0.90 | 80.25 |
| HCK | -0.0001151 | 7940 | GTEx | DepMap | Descartes | 0.09 | 9.02 |
| SPP1 | -0.0001328 | 8353 | GTEx | DepMap | Descartes | 3.08 | 256.31 |
| CD163 | -0.0001437 | 8586 | GTEx | DepMap | Descartes | 0.16 | 8.03 |
| CTSB | -0.0001484 | 8681 | GTEx | DepMap | Descartes | 2.82 | 107.34 |
| SFMBT2 | -0.0001523 | 8773 | GTEx | DepMap | Descartes | 0.06 | 2.51 |
| MSR1 | -0.0001585 | 8898 | GTEx | DepMap | Descartes | 0.26 | 15.48 |
| HRH1 | -0.0001610 | 8949 | GTEx | DepMap | Descartes | 0.02 | 1.55 |
| ADAP2 | -0.0001849 | 9393 | GTEx | DepMap | Descartes | 0.24 | 15.96 |
| RBPJ | -0.0001950 | 9598 | GTEx | DepMap | Descartes | 0.60 | 23.80 |
Descartes Schwann markers
Top 50 marker genes of Schwann cells in the Decartes fetal adrenal single cell map (https://atlas.brotmanbaty.org/bbi/human-gene-expression-during-development/cell/schwann/in/adrenal)
Wilcoxon ranksum test P-value for gene set overrepresentation: 2.97e-15
Mean rank of genes in gene set: 2019.66
Median rank of genes in gene set: 387
Rank on gene expression program of top 30 genes in gene set:
| Genes | Weight | Rank | GTEx | DepMap | Descartes | Mean.Counts | Mean.TPM |
|---|---|---|---|---|---|---|---|
| PLP1 | 0.0233658 | 2 | GTEx | DepMap | Descartes | 4.44 | 653.76 |
| MPZ | 0.0130732 | 21 | GTEx | DepMap | Descartes | 2.96 | 710.50 |
| ERBB3 | 0.0127857 | 23 | GTEx | DepMap | Descartes | 0.87 | 62.27 |
| SCN7A | 0.0095106 | 47 | GTEx | DepMap | Descartes | 1.28 | 82.15 |
| VIM | 0.0075168 | 67 | GTEx | DepMap | Descartes | 26.71 | 3434.20 |
| EDNRB | 0.0074048 | 68 | GTEx | DepMap | Descartes | 0.64 | 51.59 |
| PMP22 | 0.0069335 | 75 | GTEx | DepMap | Descartes | 4.84 | 1243.69 |
| GFRA3 | 0.0064768 | 86 | GTEx | DepMap | Descartes | 1.50 | 332.45 |
| LAMC1 | 0.0058604 | 101 | GTEx | DepMap | Descartes | 0.85 | 40.20 |
| NRXN3 | 0.0056148 | 113 | GTEx | DepMap | Descartes | 0.19 | 9.61 |
| STARD13 | 0.0054622 | 116 | GTEx | DepMap | Descartes | 0.36 | 23.09 |
| GAS7 | 0.0053815 | 121 | GTEx | DepMap | Descartes | 0.86 | 37.77 |
| PTN | 0.0047874 | 141 | GTEx | DepMap | Descartes | 1.94 | 489.15 |
| NRXN1 | 0.0046309 | 147 | GTEx | DepMap | Descartes | 2.20 | 105.92 |
| LAMA4 | 0.0042892 | 164 | GTEx | DepMap | Descartes | 0.67 | 41.75 |
| SLC35F1 | 0.0040849 | 175 | GTEx | DepMap | Descartes | 0.37 | 26.35 |
| PTPRZ1 | 0.0034294 | 224 | GTEx | DepMap | Descartes | 0.27 | 12.74 |
| XKR4 | 0.0033854 | 228 | GTEx | DepMap | Descartes | 0.25 | 4.54 |
| KCTD12 | 0.0031700 | 241 | GTEx | DepMap | Descartes | 0.89 | 47.25 |
| GRIK3 | 0.0031232 | 248 | GTEx | DepMap | Descartes | 0.09 | 3.19 |
| SORCS1 | 0.0025018 | 325 | GTEx | DepMap | Descartes | 0.27 | 15.65 |
| HMGA2 | 0.0021359 | 386 | GTEx | DepMap | Descartes | 0.02 | 1.27 |
| OLFML2A | 0.0021324 | 388 | GTEx | DepMap | Descartes | 0.66 | 28.69 |
| FIGN | 0.0019398 | 435 | GTEx | DepMap | Descartes | 0.35 | 12.28 |
| COL5A2 | 0.0019056 | 449 | GTEx | DepMap | Descartes | 0.75 | 34.38 |
| LAMB1 | 0.0017924 | 476 | GTEx | DepMap | Descartes | 0.40 | 26.58 |
| COL18A1 | 0.0016066 | 532 | GTEx | DepMap | Descartes | 1.90 | 93.60 |
| TRPM3 | 0.0012542 | 690 | GTEx | DepMap | Descartes | 0.04 | 1.36 |
| EGFLAM | 0.0009482 | 948 | GTEx | DepMap | Descartes | 0.14 | 14.80 |
| IL1RAPL1 | 0.0008392 | 1081 | GTEx | DepMap | Descartes | 0.04 | 5.42 |
Descartes Megakaryocytes markers
Top 50 marker genes of Megakaryocytes cells in the Decartes fetal adrenal single cell map (https://atlas.brotmanbaty.org/bbi/human-gene-expression-during-development/cell/megakaryocytes/in/adrenal)
Wilcoxon ranksum test P-value for gene set overrepresentation: 5.93e-01
Mean rank of genes in gene set: 6402.09
Median rank of genes in gene set: 6882
Rank on gene expression program of top 30 genes in gene set:
| Genes | Weight | Rank | GTEx | DepMap | Descartes | Mean.Counts | Mean.TPM |
|---|---|---|---|---|---|---|---|
| CD9 | 0.0048279 | 138 | GTEx | DepMap | Descartes | 2.60 | 625.42 |
| GSN | 0.0013953 | 622 | GTEx | DepMap | Descartes | 5.77 | 275.89 |
| THBS1 | 0.0013863 | 628 | GTEx | DepMap | Descartes | 0.74 | 28.19 |
| FLNA | 0.0007663 | 1187 | GTEx | DepMap | Descartes | 1.10 | 35.24 |
| TLN1 | 0.0006737 | 1345 | GTEx | DepMap | Descartes | 0.64 | 21.14 |
| VCL | 0.0004777 | 1784 | GTEx | DepMap | Descartes | 0.50 | 16.40 |
| TMSB4X | 0.0004631 | 1830 | GTEx | DepMap | Descartes | 65.56 | 10638.13 |
| STOM | 0.0004137 | 1976 | GTEx | DepMap | Descartes | 0.59 | 45.34 |
| TPM4 | 0.0003486 | 2248 | GTEx | DepMap | Descartes | 1.91 | 101.70 |
| UBASH3B | 0.0002124 | 2967 | GTEx | DepMap | Descartes | 0.06 | 2.82 |
| LTBP1 | 0.0002105 | 2977 | GTEx | DepMap | Descartes | 0.18 | 7.11 |
| DOK6 | 0.0002088 | 2994 | GTEx | DepMap | Descartes | 0.09 | 2.65 |
| MYH9 | 0.0001822 | 3195 | GTEx | DepMap | Descartes | 0.61 | 21.96 |
| ANGPT1 | 0.0001671 | 3309 | GTEx | DepMap | Descartes | 0.02 | 1.62 |
| ITGA2B | 0.0000849 | 4154 | GTEx | DepMap | Descartes | 0.01 | 0.64 |
| GP1BA | 0.0000593 | 4440 | GTEx | DepMap | Descartes | 0.00 | 0.00 |
| ITGB3 | 0.0000572 | 4465 | GTEx | DepMap | Descartes | 0.01 | 0.61 |
| SLC2A3 | 0.0000424 | 4639 | GTEx | DepMap | Descartes | 0.70 | 37.40 |
| PDE3A | 0.0000032 | 5132 | GTEx | DepMap | Descartes | 0.06 | 2.10 |
| ARHGAP6 | -0.0000072 | 5320 | GTEx | DepMap | Descartes | 0.02 | 0.59 |
| MED12L | -0.0000195 | 5607 | GTEx | DepMap | Descartes | 0.03 | 0.72 |
| CD84 | -0.0000702 | 6864 | GTEx | DepMap | Descartes | 0.09 | 2.60 |
| RAP1B | -0.0000712 | 6882 | GTEx | DepMap | Descartes | 0.53 | 11.24 |
| ZYX | -0.0000723 | 6908 | GTEx | DepMap | Descartes | 0.33 | 42.92 |
| SLC24A3 | -0.0000996 | 7591 | GTEx | DepMap | Descartes | 0.01 | 0.14 |
| P2RX1 | -0.0001227 | 8117 | GTEx | DepMap | Descartes | 0.01 | 0.71 |
| TGFB1 | -0.0001278 | 8240 | GTEx | DepMap | Descartes | 0.33 | 32.42 |
| STON2 | -0.0001394 | 8495 | GTEx | DepMap | Descartes | 0.04 | 1.65 |
| FLI1 | -0.0001560 | 8839 | GTEx | DepMap | Descartes | 0.05 | 3.21 |
| TRPC6 | -0.0001599 | 8918 | GTEx | DepMap | Descartes | 0.00 | 0.00 |
Descartes Lyphoid markers
Top 50 marker genes of Lyphoid cells in the Decartes fetal adrenal single cell map (https://atlas.brotmanbaty.org/bbi/human-gene-expression-during-development/cell/lymphoid/in/adrenal)
Wilcoxon ranksum test P-value for gene set overrepresentation: 9.53e-01
Mean rank of genes in gene set: 7210.14
Median rank of genes in gene set: 8589.5
Rank on gene expression program of top 30 genes in gene set:
| Genes | Weight | Rank | GTEx | DepMap | Descartes | Mean.Counts | Mean.TPM |
|---|---|---|---|---|---|---|---|
| ARHGAP15 | 0.0133487 | 18 | GTEx | DepMap | Descartes | 1.94 | 309.44 |
| B2M | 0.0056256 | 112 | GTEx | DepMap | Descartes | 98.10 | 14686.51 |
| GNG2 | 0.0023745 | 345 | GTEx | DepMap | Descartes | 0.85 | 86.76 |
| CELF2 | 0.0018775 | 456 | GTEx | DepMap | Descartes | 0.94 | 42.75 |
| CCND3 | 0.0015481 | 551 | GTEx | DepMap | Descartes | 0.55 | 83.58 |
| SP100 | 0.0013372 | 654 | GTEx | DepMap | Descartes | 0.64 | 32.61 |
| CD44 | 0.0007735 | 1171 | GTEx | DepMap | Descartes | 0.99 | 67.87 |
| ARID5B | 0.0005845 | 1505 | GTEx | DepMap | Descartes | 0.55 | 20.10 |
| WIPF1 | 0.0005432 | 1615 | GTEx | DepMap | Descartes | 0.44 | 32.38 |
| MSN | 0.0003648 | 2176 | GTEx | DepMap | Descartes | 0.54 | 40.16 |
| ITPKB | 0.0003516 | 2229 | GTEx | DepMap | Descartes | 0.06 | 3.63 |
| MBNL1 | 0.0001766 | 3238 | GTEx | DepMap | Descartes | 0.43 | 19.89 |
| ANKRD44 | 0.0001189 | 3806 | GTEx | DepMap | Descartes | 0.15 | 7.61 |
| PLEKHA2 | 0.0000224 | 4883 | GTEx | DepMap | Descartes | 0.13 | 6.92 |
| BCL2 | -0.0000095 | 5362 | GTEx | DepMap | Descartes | 0.20 | 10.49 |
| LEF1 | -0.0000374 | 6051 | GTEx | DepMap | Descartes | 0.19 | 18.40 |
| MCTP2 | -0.0000419 | 6168 | GTEx | DepMap | Descartes | 0.03 | 1.05 |
| ETS1 | -0.0000467 | 6299 | GTEx | DepMap | Descartes | 0.11 | 5.97 |
| TOX | -0.0000744 | 6971 | GTEx | DepMap | Descartes | 0.06 | 3.58 |
| BACH2 | -0.0000910 | 7395 | GTEx | DepMap | Descartes | 0.07 | 1.80 |
| DOCK10 | -0.0001406 | 8520 | GTEx | DepMap | Descartes | 0.10 | 3.73 |
| NCALD | -0.0001474 | 8659 | GTEx | DepMap | Descartes | 0.09 | 7.26 |
| SAMD3 | -0.0001615 | 8955 | GTEx | DepMap | Descartes | 0.01 | 1.57 |
| CCL5 | -0.0002038 | 9733 | GTEx | DepMap | Descartes | 0.31 | 66.08 |
| RCSD1 | -0.0002434 | 10361 | GTEx | DepMap | Descartes | 0.14 | 5.80 |
| SKAP1 | -0.0002551 | 10492 | GTEx | DepMap | Descartes | 0.01 | 0.66 |
| PRKCH | -0.0002556 | 10496 | GTEx | DepMap | Descartes | 0.01 | 0.18 |
| STK39 | -0.0002809 | 10793 | GTEx | DepMap | Descartes | 0.10 | 10.77 |
| PITPNC1 | -0.0003046 | 11027 | GTEx | DepMap | Descartes | 0.06 | 3.23 |
| IKZF1 | -0.0003134 | 11094 | GTEx | DepMap | Descartes | 0.06 | 2.18 |
Below shows the ranks on this GEP for immune marker gene lists curated by CellTypist (https://www.celltypist.org/encyclopedia).
High ranks indicate this gene is a driver of this GEP.
These curated gene list are ranked by P-value (on this GEP) of their constituent genes.
The Mean Count column shows the mean read count in cells scoring highly (H > 50) on this gene expression program.
B cells: Memory B cells (model markers)
long-lived mature B lymphocytes which are formed within germinal centers following primary infection and selected for higher-affinity immunoglobulin:
Wilcoxon ranksum test P-value for gene set overrepresentation: 1.18e-02
Mean rank of genes in gene set: 476.5
Rank on gene expression program of genes in gene set:
| Genes | Weight | Rank | GTEx | DepMap | Decartes | Mean.Counts | Mean.TPM |
|---|---|---|---|---|---|---|---|
| CD74 | 0.0022745 | 360 | GTEx | DepMap | Descartes | 24.49 | 2543.74 |
| HES1 | 0.0014551 | 593 | GTEx | DepMap | Descartes | 1.25 | 307.29 |
B cells: Naive B cells (model markers)
mature B lymphocytes which express cell-surface IgM and IgD and have not been exposed to/activated by antigens:
Wilcoxon ranksum test P-value for gene set overrepresentation: 2.27e-02
Mean rank of genes in gene set: 1148.5
Rank on gene expression program of genes in gene set:
| Genes | Weight | Rank | GTEx | DepMap | Decartes | Mean.Counts | Mean.TPM |
|---|---|---|---|---|---|---|---|
| CD74 | 0.0022745 | 360 | GTEx | DepMap | Descartes | 24.49 | 2543.74 |
| YBX3 | 0.0004251 | 1937 | GTEx | DepMap | Descartes | 0.98 | NA |
Macrophages: Kupffer cells (model markers)
resident macrophages in liver under non-inflammatory conditions which line the hepatic sinusoids and are involved in erythrocyte clearance:
Wilcoxon ranksum test P-value for gene set overrepresentation: 2.55e-02
Mean rank of genes in gene set: 2740.5
Rank on gene expression program of genes in gene set:
| Genes | Weight | Rank | GTEx | DepMap | Decartes | Mean.Counts | Mean.TPM |
|---|---|---|---|---|---|---|---|
| PENK | 0.0042416 | 167 | GTEx | DepMap | Descartes | 0.37 | 83.03 |
| EGR2 | 0.0009114 | 987 | GTEx | DepMap | Descartes | 0.43 | 40.54 |
| ARRDC3 | 0.0005042 | 1712 | GTEx | DepMap | Descartes | 0.70 | 47.09 |
| CD5L | -0.0001221 | 8096 | GTEx | DepMap | Descartes | 0.04 | 1.23 |