Program: 31. Myelocyte.
Submit a comment on this gene expression program’s interpretation: CLICK
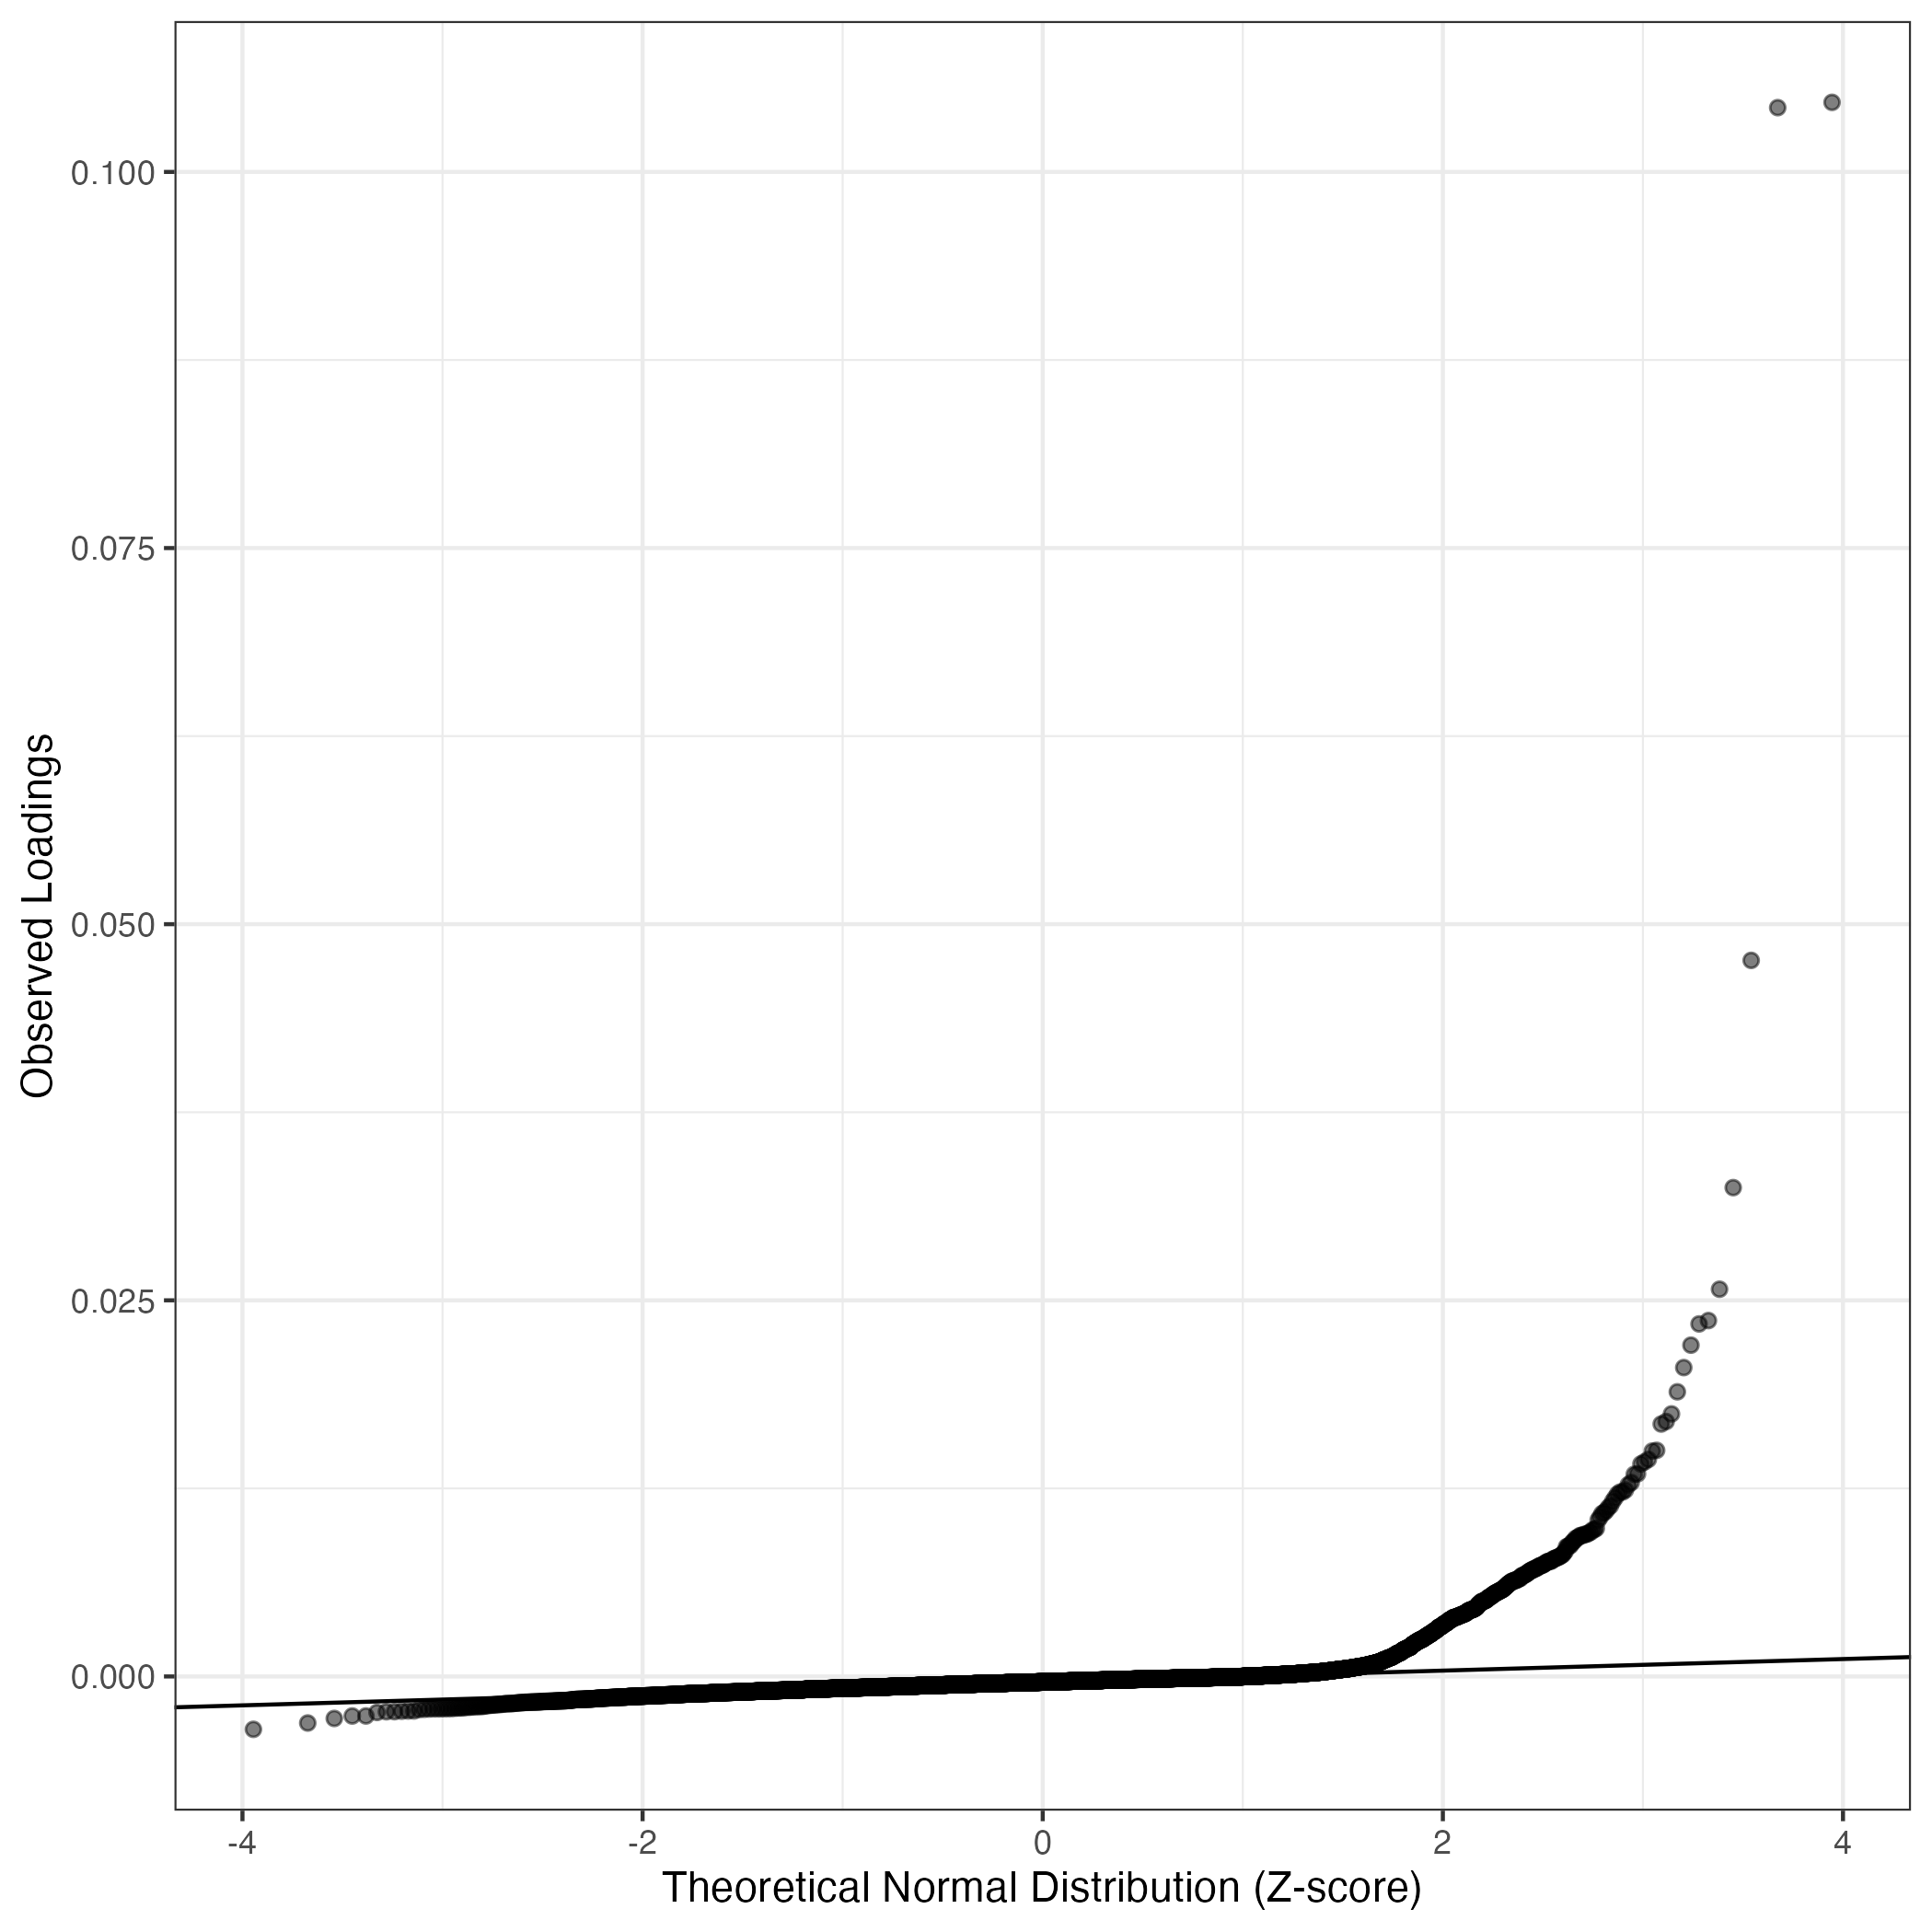
QQ-plot of gene loadings, averaged over both independent splits of the data
This plot highlights the relative contribution of each gene to the GEP
## Error in apply(allData[cellsHGreaterThan50, ], 2, mean): dim(X) must have a positive length
## Error in apply(allDataTpm[cellsHGreaterThan50, ], 2, mean): dim(X) must have a positive length
## Error in eval(expr, envir, enclos): object 'meanCountsHOver50' not found
## Error in eval(expr, envir, enclos): object 'meanTpmHOver50' not found
## Error in data.frame(Gene = geneCardsLink, Loading = dftoDisplay[, 2], : object 'countHighScoringCells' not found
## Error in rownames(dftForKable) <- rn: object 'dftForKable' not found
Top genes driving this program.
Note: Decartes website is buggy, try refreshing. Also, Decartes fetal adrenal data have been collected at specific time points (89-122 days), all possible cell types of interest may not be represented, do not overinterpret.
The Mean Count column shows the mean read count in cells scoring highly (H > 50) on this gene expression program.
## Error in kable(dftForKable[1:50, ], row.names = TRUE): object 'dftForKable' not found
## Error in eval(quote(list(...)), env): object 'countHighScoringCells' not found
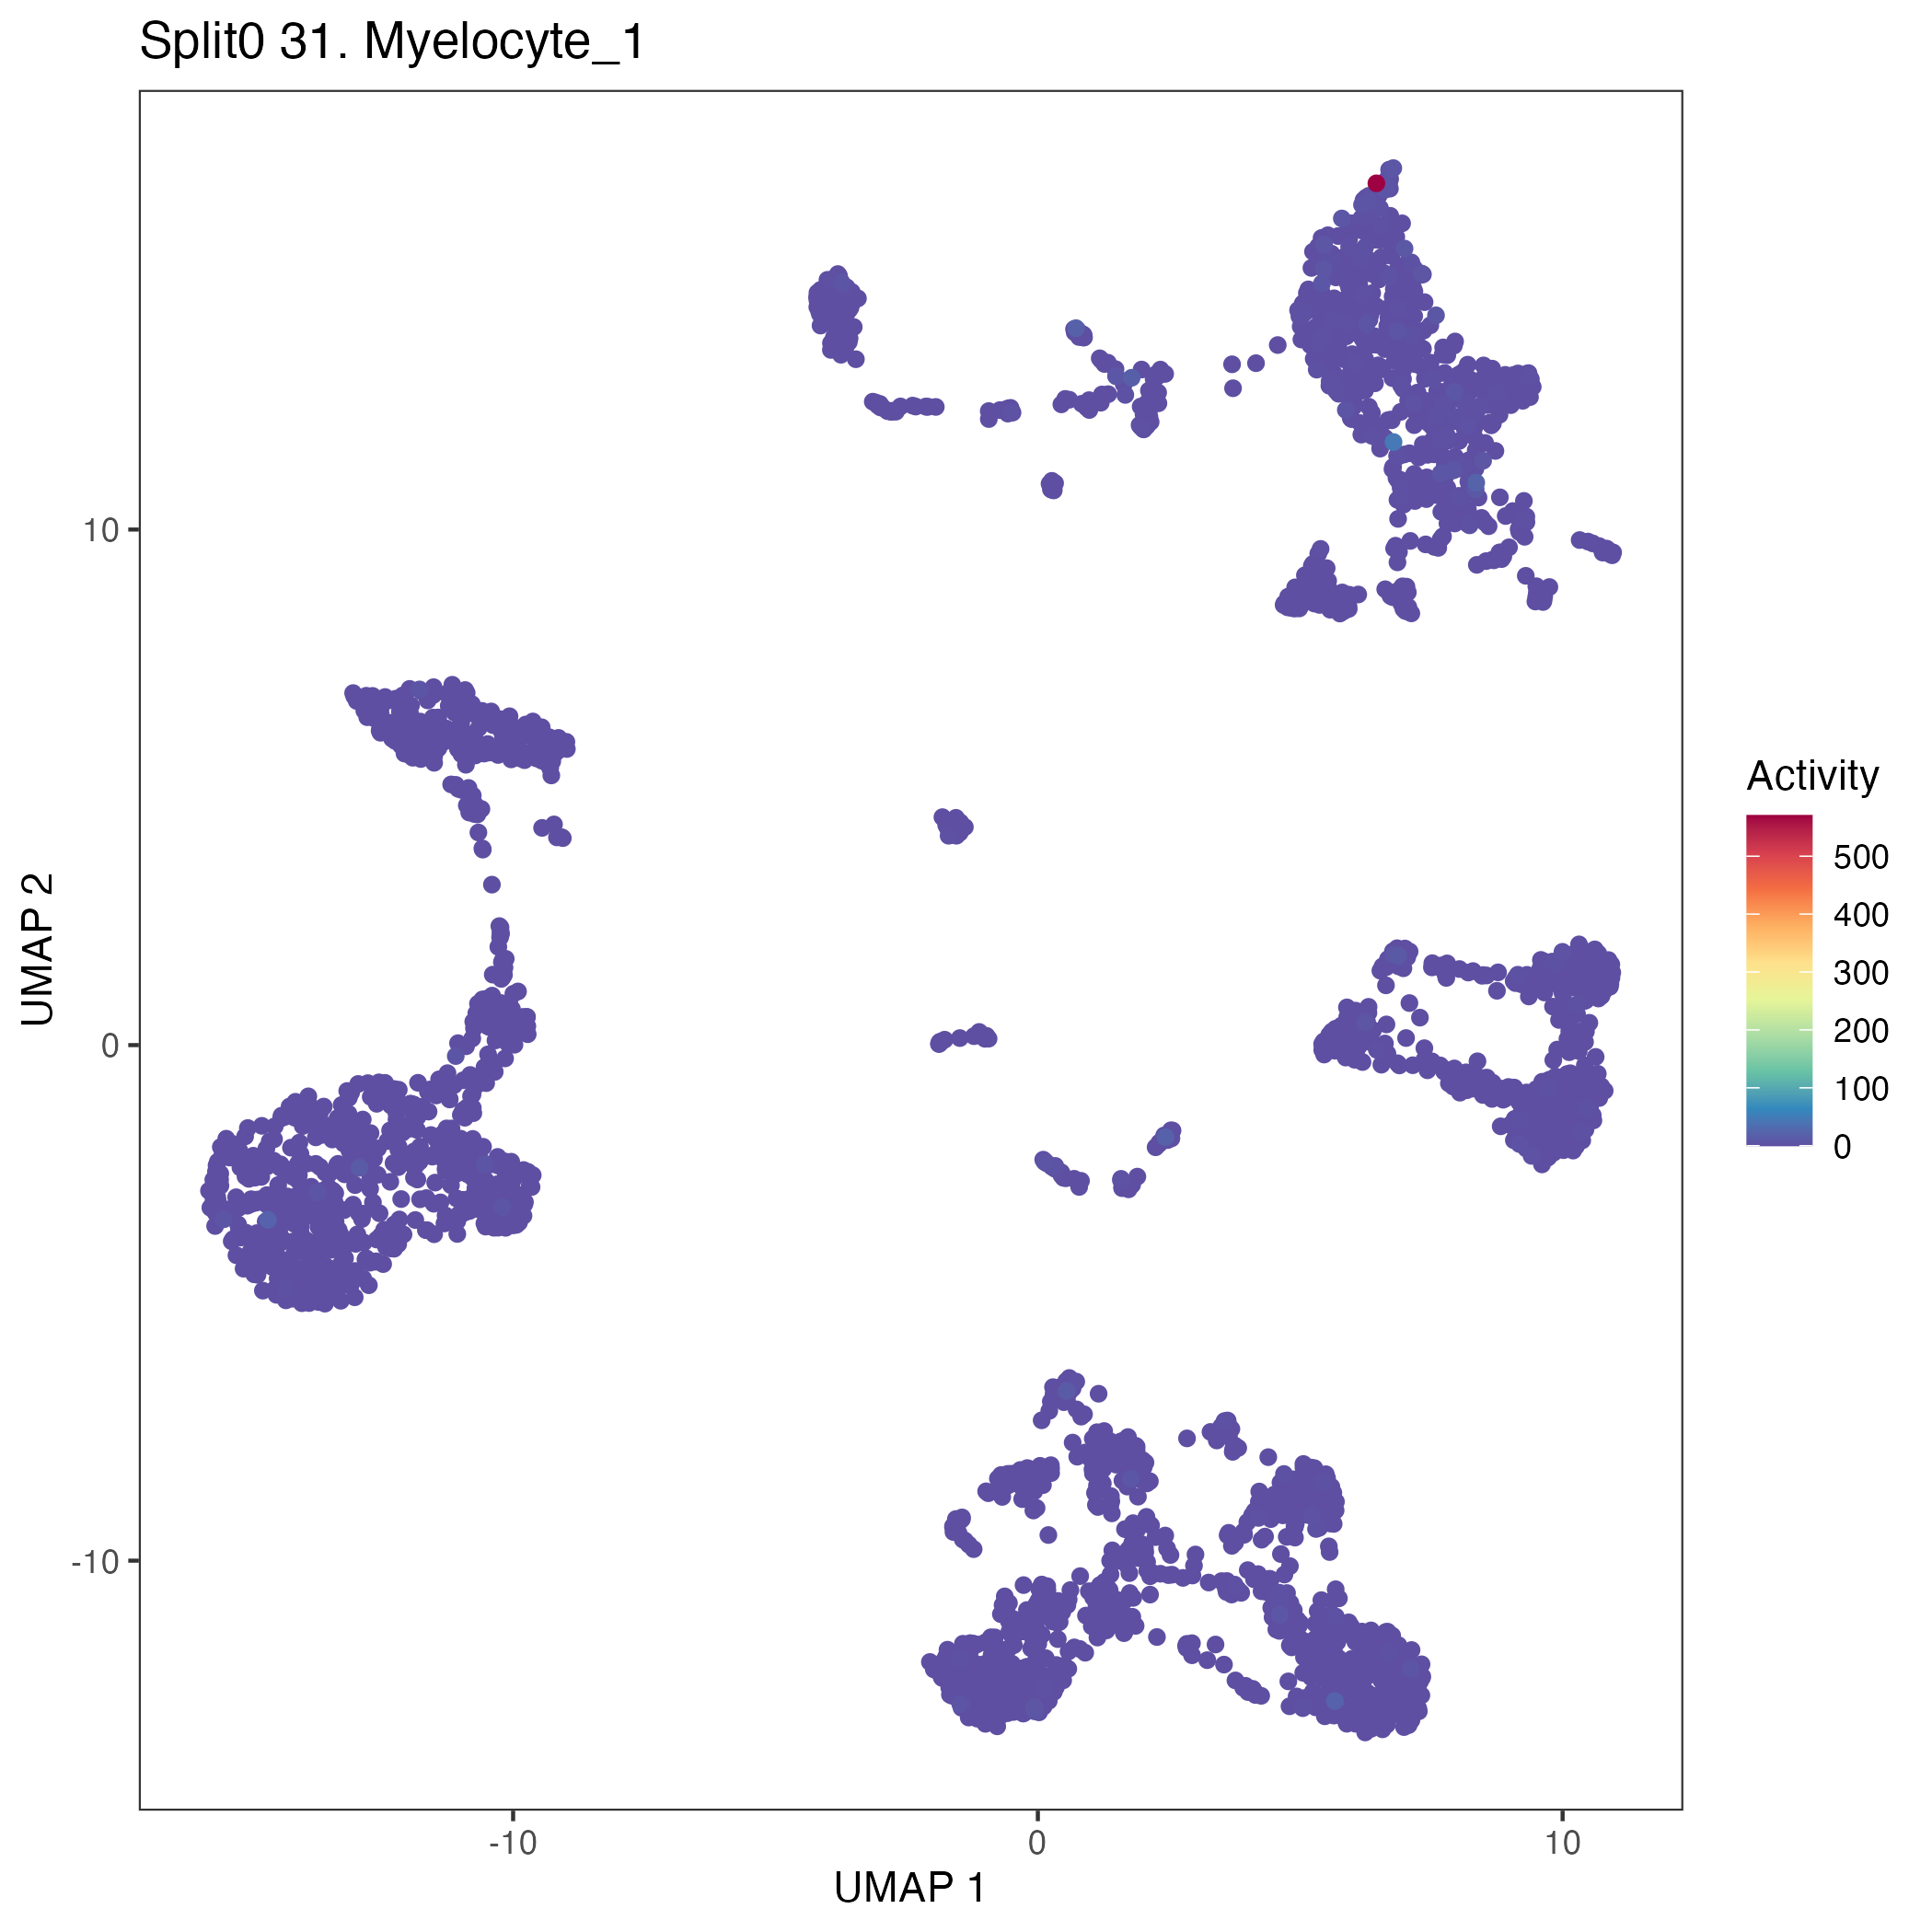
UMAP plots showing activity of gene expression program identified in GEP 31. Myelocyte:
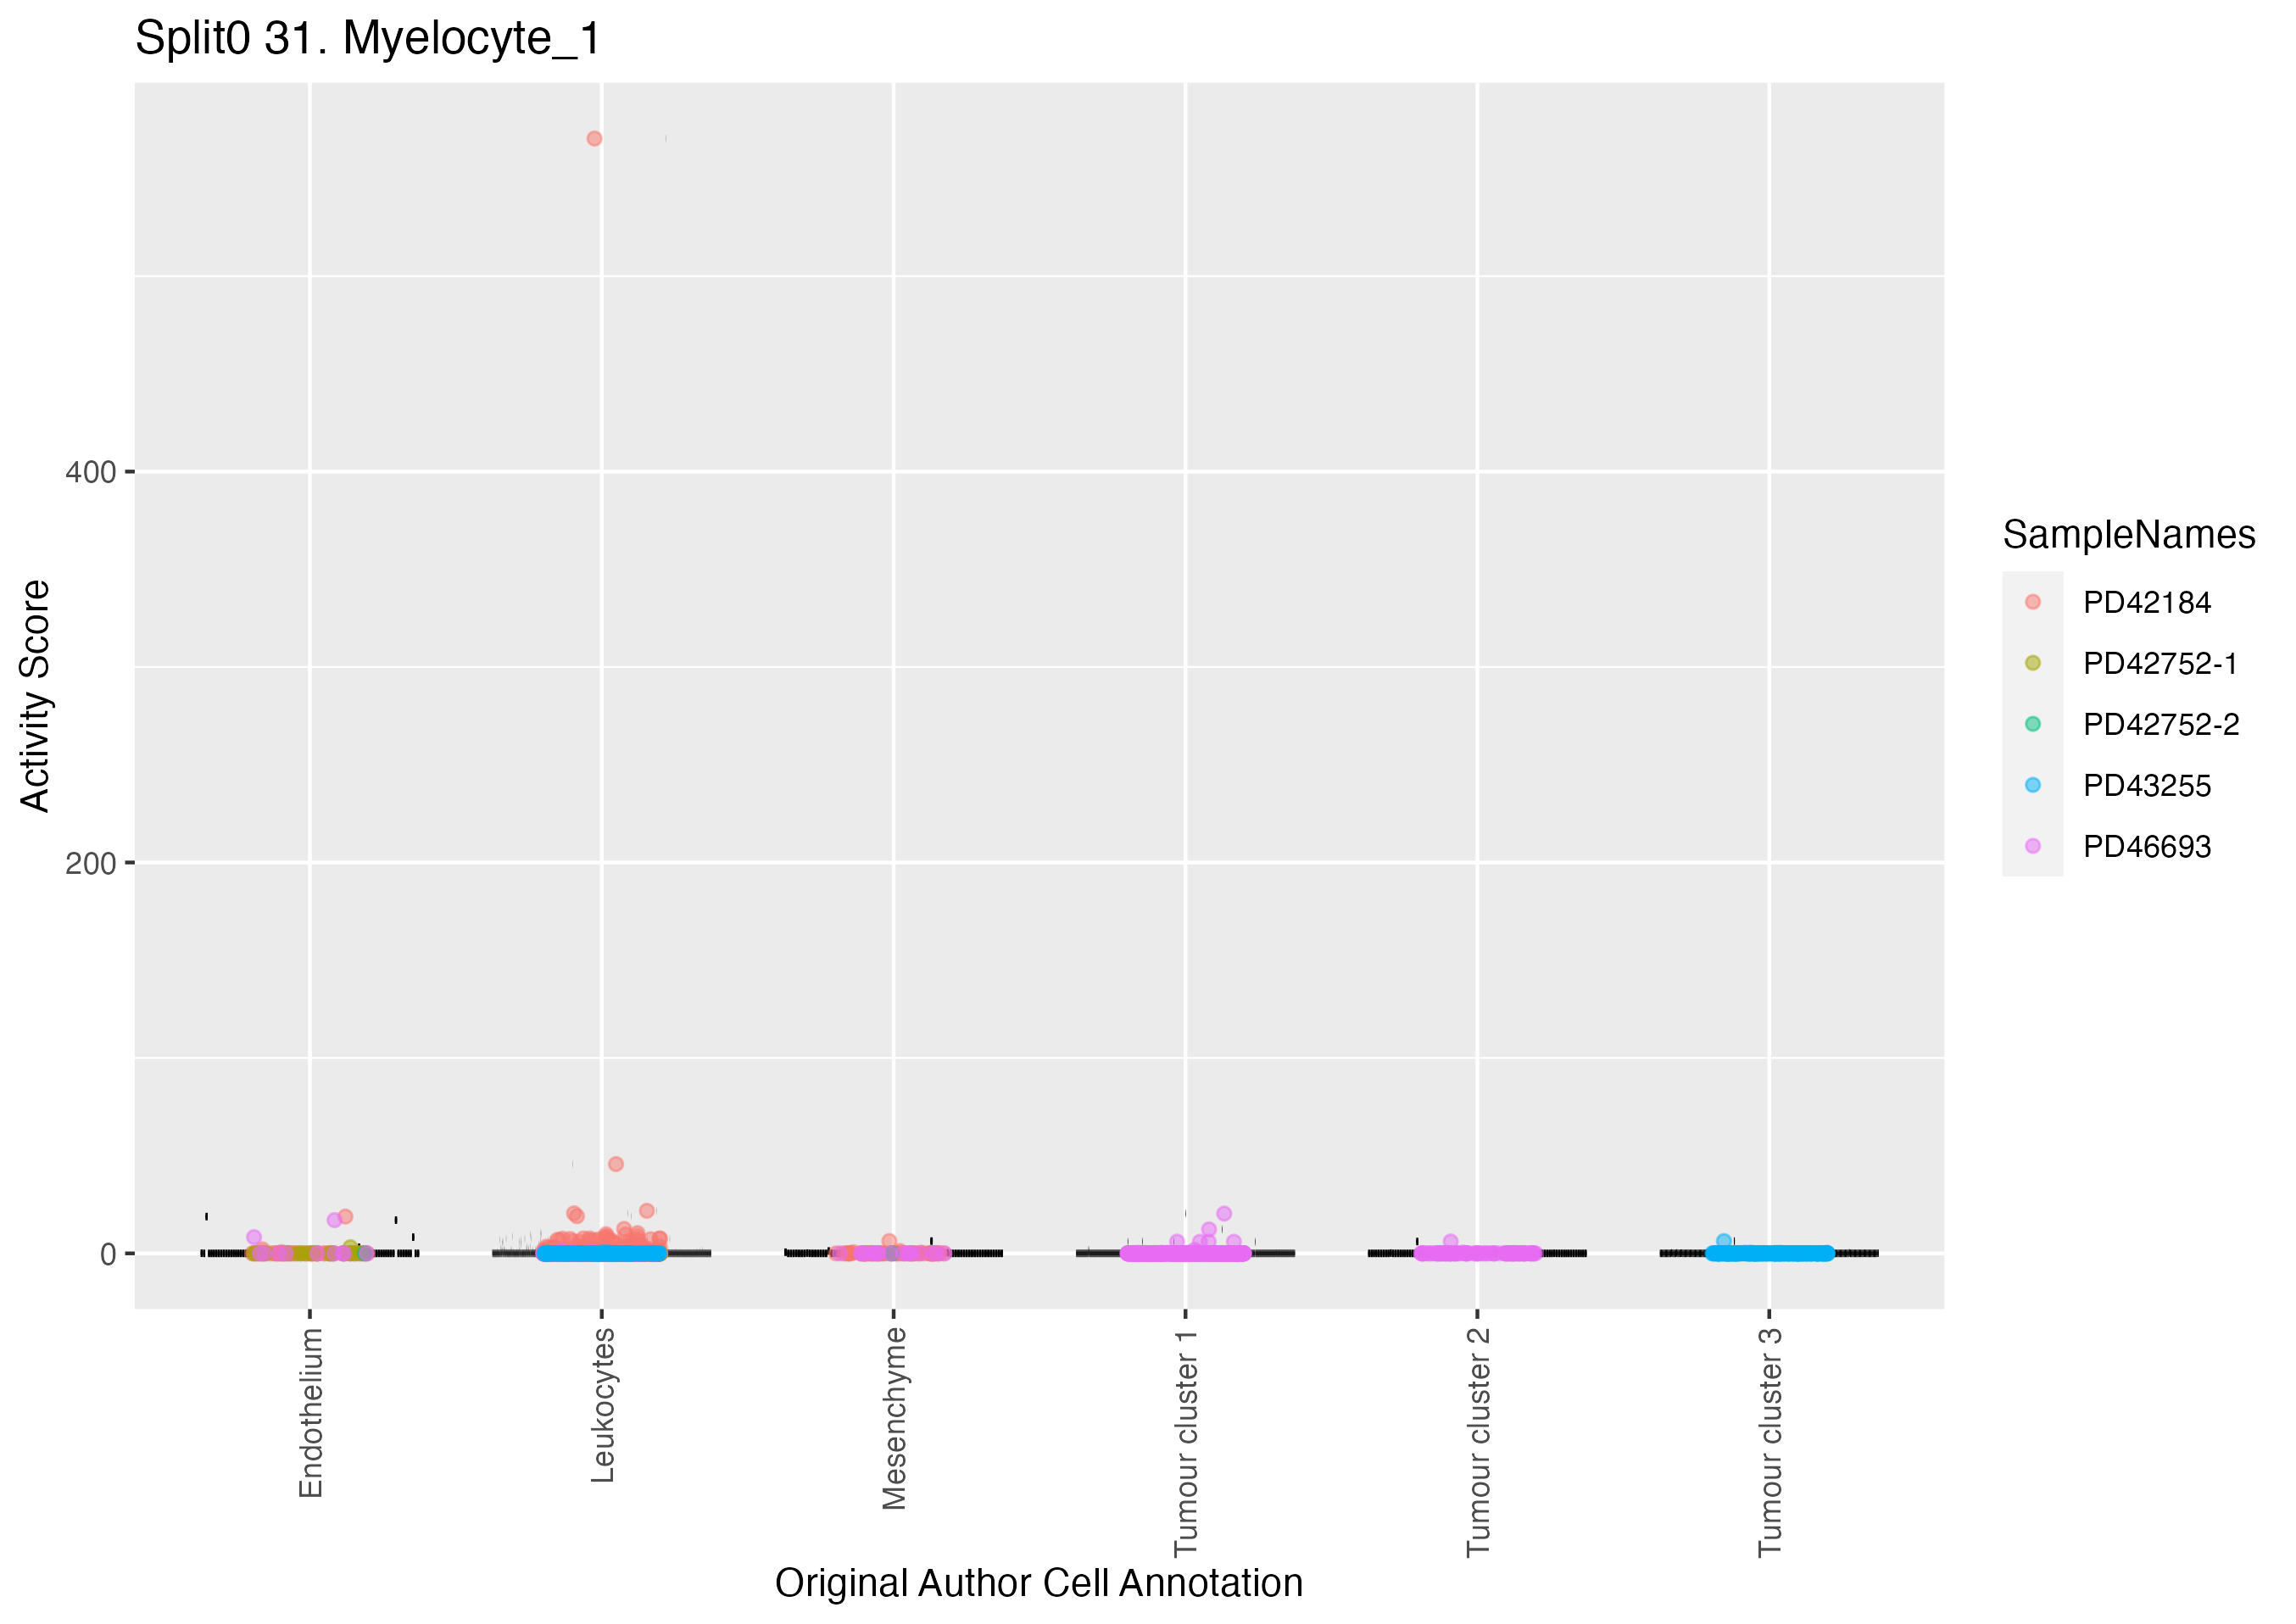
Boxlot showing activity of gene expression program identified in GEP 31. Myelocyte:
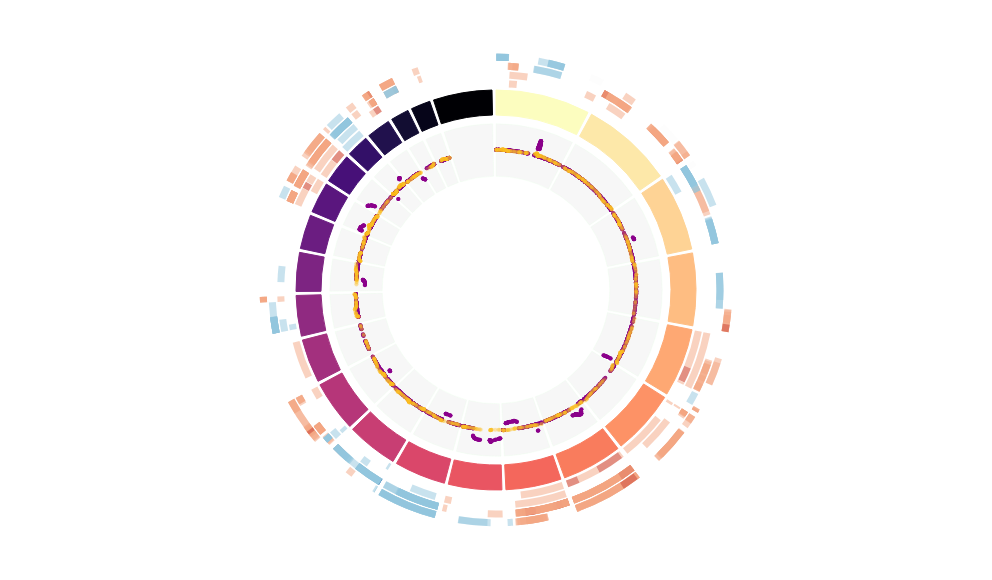
CNV Data procured from inferCNV.
Outer tracks are putative CNV regions (gains = red, losses = blue) for each patient
Inner track is expression data representing:
The top cells expressing this GEP (purple)
Random cells (n =50) from the reference set used in inferCNV (orange)
Gene set Enrichments for this program, caculated from top 50 genes
mSigDB Cell Types Gene Set:
| P-value | OR | Lower 95% CI | FDR | FWER | Genes Found | Gene Set Size | |
|---|---|---|---|---|---|---|---|
| DURANTE_ADULT_OLFACTORY_NEUROEPITHELIUM_BOWMANS_GLAND | 2.96e-04 | 26.56 | 5.01 | 1.68e-01 | 1.99e-01 | 3LCN2, LTF, SLPI |
33 |
| DURANTE_ADULT_OLFACTORY_NEUROEPITHELIUM_RESPIRATORY_EPITHELIAL_CELLS | 1.58e-03 | 39.95 | 4.27 | 3.53e-01 | 1.00e+00 | 2LTF, SLPI |
15 |
| TRAVAGLINI_LUNG_NEUTROPHIL_CELL | 5.00e-04 | 5.64 | 2.13 | 1.68e-01 | 3.36e-01 | 7PGLYRP1, HLX, GCA, B4GALT5, MSRB1, PGD, TMEM259 |
368 |
| BUSSLINGER_GASTRIC_REG3A_POSITIVE_CELLS | 1.31e-02 | 12.39 | 1.41 | 1.00e+00 | 1.00e+00 | 2LCN2, LTF |
44 |
| HAY_BONE_MARROW_NEUTROPHIL | 7.21e-03 | 3.85 | 1.33 | 1.00e+00 | 1.00e+00 | 6HLX, GCA, TMEM107, MSRB1, AGO4, PGD |
449 |
| TRAVAGLINI_LUNG_MUCOUS_CELL | 1.31e-02 | 6.54 | 1.28 | 1.00e+00 | 1.00e+00 | 3LCN2, LTF, SLPI |
125 |
| TRAVAGLINI_LUNG_GOBLET_CELL | 2.04e-02 | 5.50 | 1.08 | 1.00e+00 | 1.00e+00 | 3LCN2, SLPI, PGD |
148 |
| AIZARANI_LIVER_C24_EPCAM_POS_BILE_DUCT_CELLS_3 | 3.59e-02 | 4.38 | 0.86 | 1.00e+00 | 1.00e+00 | 3LCN2, SLPI, CYSTM1 |
185 |
| TRAVAGLINI_LUNG_BASOPHIL_MAST_2_CELL | 4.23e-02 | 2.80 | 0.86 | 1.00e+00 | 1.00e+00 | 5COL9A2, B4GALT5, GBE1, CYSTM1, RELB |
502 |
| DESCARTES_FETAL_MUSCLE_MEGAKARYOCYTES | 6.59e-02 | 3.40 | 0.67 | 1.00e+00 | 1.00e+00 | 3SIAE, SORT1, MADD |
238 |
| DESCARTES_FETAL_EYE_CORNEAL_AND_CONJUNCTIVAL_EPITHELIAL_CELLS | 6.92e-02 | 3.32 | 0.66 | 1.00e+00 | 1.00e+00 | 3LCN2, SLPI, B4GALT5 |
243 |
| TRAVAGLINI_LUNG_SEROUS_CELL | 5.42e-02 | 5.60 | 0.65 | 1.00e+00 | 1.00e+00 | 2LTF, SLPI |
95 |
| DESCARTES_FETAL_STOMACH_ERYTHROBLASTS | 5.93e-02 | 5.31 | 0.62 | 1.00e+00 | 1.00e+00 | 2YOD1, ABCB10 |
100 |
| TRAVAGLINI_LUNG_PROLIFERATING_MACROPHAGE_CELL | 1.70e-01 | 1.77 | 0.62 | 1.00e+00 | 1.00e+00 | 6GCA, TMEM107, SORT1, HAUS4, CNIH4, PGD |
968 |
| FAN_EMBRYONIC_CTX_OLIG | 2.06e-01 | 1.85 | 0.57 | 1.00e+00 | 1.00e+00 | 5SLC27A4, SORT1, LDLR, ENPP4, SETD7 |
754 |
| HU_FETAL_RETINA_BLOOD | 9.70e-02 | 2.86 | 0.57 | 1.00e+00 | 1.00e+00 | 3YOD1, FBN2, ABCB10 |
282 |
| DESCARTES_MAIN_FETAL_CORNEAL_AND_CONJUNCTIVAL_EPITHELIAL_CELLS | 1.03e-01 | 2.78 | 0.55 | 1.00e+00 | 1.00e+00 | 3LCN2, SLPI, B4GALT5 |
290 |
| MURARO_PANCREAS_DUCTAL_CELL | 4.61e-01 | 1.34 | 0.47 | 1.00e+00 | 1.00e+00 | 6LCN2, SIAE, SLPI, B4GALT5, LDLR, SETD7 |
1276 |
| DESCARTES_FETAL_PANCREAS_ERYTHROBLASTS | 9.90e-02 | 3.92 | 0.46 | 1.00e+00 | 1.00e+00 | 2YOD1, ABCB10 |
135 |
| BUSSLINGER_ESOPHAGEAL_LATE_SUPRABASAL_CELLS | 1.05e-01 | 3.77 | 0.44 | 1.00e+00 | 1.00e+00 | 2SLPI, SORT1 |
140 |
Dowload full table
mSigDB Hallmark Gene Sets:
| P-value | OR | Lower 95% CI | FDR | FWER | Genes Found | Gene Set Size | |
|---|---|---|---|---|---|---|---|
| HALLMARK_TNFA_SIGNALING_VIA_NFKB | 4.35e-02 | 4.05 | 0.80 | 1.00e+00 | 1.00e+00 | 3B4GALT5, LDLR, RELB |
200 |
| HALLMARK_COMPLEMENT | 4.35e-02 | 4.05 | 0.80 | 1.00e+00 | 1.00e+00 | 3LTF, GCA, MSRB1 |
200 |
| HALLMARK_DNA_REPAIR | 1.18e-01 | 3.52 | 0.41 | 1.00e+00 | 1.00e+00 | 2TK2, AGO4 |
150 |
| HALLMARK_MTORC1_SIGNALING | 1.85e-01 | 2.63 | 0.31 | 1.00e+00 | 1.00e+00 | 2LDLR, GBE1 |
200 |
| HALLMARK_EPITHELIAL_MESENCHYMAL_TRANSITION | 1.85e-01 | 2.63 | 0.31 | 1.00e+00 | 1.00e+00 | 2SNTB1, FBN2 |
200 |
| HALLMARK_XENOBIOTIC_METABOLISM | 1.85e-01 | 2.63 | 0.31 | 1.00e+00 | 1.00e+00 | 2ATOH8, PGD |
200 |
| HALLMARK_ANGIOGENESIS | 1.34e-01 | 7.29 | 0.18 | 1.00e+00 | 1.00e+00 | 1PGLYRP1 |
36 |
| HALLMARK_CHOLESTEROL_HOMEOSTASIS | 2.55e-01 | 3.49 | 0.09 | 1.00e+00 | 1.00e+00 | 1LDLR |
74 |
| HALLMARK_UV_RESPONSE_DN | 4.35e-01 | 1.78 | 0.04 | 1.00e+00 | 1.00e+00 | 1LDLR |
144 |
| HALLMARK_UV_RESPONSE_UP | 4.66e-01 | 1.62 | 0.04 | 1.00e+00 | 1.00e+00 | 1TGFBRAP1 |
158 |
| HALLMARK_APOPTOSIS | 4.72e-01 | 1.59 | 0.04 | 1.00e+00 | 1.00e+00 | 1MADD |
161 |
| HALLMARK_MITOTIC_SPINDLE | 5.45e-01 | 1.29 | 0.03 | 1.00e+00 | 1.00e+00 | 1CEP192 |
199 |
| HALLMARK_HYPOXIA | 5.47e-01 | 1.28 | 0.03 | 1.00e+00 | 1.00e+00 | 1GBE1 |
200 |
| HALLMARK_ADIPOGENESIS | 5.47e-01 | 1.28 | 0.03 | 1.00e+00 | 1.00e+00 | 1GBE1 |
200 |
| HALLMARK_ESTROGEN_RESPONSE_LATE | 5.47e-01 | 1.28 | 0.03 | 1.00e+00 | 1.00e+00 | 1LTF |
200 |
| HALLMARK_INFLAMMATORY_RESPONSE | 5.47e-01 | 1.28 | 0.03 | 1.00e+00 | 1.00e+00 | 1LDLR |
200 |
| HALLMARK_HEME_METABOLISM | 5.47e-01 | 1.28 | 0.03 | 1.00e+00 | 1.00e+00 | 1FOXJ2 |
200 |
| HALLMARK_ALLOGRAFT_REJECTION | 5.47e-01 | 1.28 | 0.03 | 1.00e+00 | 1.00e+00 | 1LY75 |
200 |
| HALLMARK_KRAS_SIGNALING_UP | 5.47e-01 | 1.28 | 0.03 | 1.00e+00 | 1.00e+00 | 1SLPI |
200 |
| HALLMARK_WNT_BETA_CATENIN_SIGNALING | 1.00e+00 | 0.00 | 0.00 | 1.00e+00 | 1.00e+00 | 0 |
42 |
Dowload full table
KEGG Pathways:
| P-value | OR | Lower 95% CI | FDR | FWER | Genes Found | Gene Set Size | |
|---|---|---|---|---|---|---|---|
| KEGG_LIMONENE_AND_PINENE_DEGRADATION | 3.91e-02 | 28.30 | 0.63 | 1.00e+00 | 1.00e+00 | 1YOD1 |
10 |
| KEGG_BIOSYNTHESIS_OF_UNSATURATED_FATTY_ACIDS | 8.40e-02 | 12.14 | 0.29 | 1.00e+00 | 1.00e+00 | 1YOD1 |
22 |
| KEGG_GLYCOSYLPHOSPHATIDYLINOSITOL_GPI_ANCHOR_BIOSYNTHESIS | 9.49e-02 | 10.62 | 0.25 | 1.00e+00 | 1.00e+00 | 1PIGN |
25 |
| KEGG_PENTOSE_PHOSPHATE_PATHWAY | 1.02e-01 | 9.80 | 0.23 | 1.00e+00 | 1.00e+00 | 1PGD |
27 |
| KEGG_HOMOLOGOUS_RECOMBINATION | 1.06e-01 | 9.44 | 0.23 | 1.00e+00 | 1.00e+00 | 1RAD51B |
28 |
| KEGG_O_GLYCAN_BIOSYNTHESIS | 1.13e-01 | 8.79 | 0.21 | 1.00e+00 | 1.00e+00 | 1B4GALT5 |
30 |
| KEGG_LYSINE_DEGRADATION | 1.61e-01 | 5.93 | 0.14 | 1.00e+00 | 1.00e+00 | 1SETD7 |
44 |
| KEGG_ABC_TRANSPORTERS | 1.61e-01 | 5.93 | 0.14 | 1.00e+00 | 1.00e+00 | 1ABCB10 |
44 |
| KEGG_GLUTATHIONE_METABOLISM | 1.81e-01 | 5.21 | 0.13 | 1.00e+00 | 1.00e+00 | 1PGD |
50 |
| KEGG_DRUG_METABOLISM_OTHER_ENZYMES | 1.84e-01 | 5.10 | 0.12 | 1.00e+00 | 1.00e+00 | 1TK2 |
51 |
| KEGG_STARCH_AND_SUCROSE_METABOLISM | 1.87e-01 | 5.00 | 0.12 | 1.00e+00 | 1.00e+00 | 1GBE1 |
52 |
| KEGG_PPAR_SIGNALING_PATHWAY | 2.40e-01 | 3.75 | 0.09 | 1.00e+00 | 1.00e+00 | 1SLC27A4 |
69 |
| KEGG_PYRIMIDINE_METABOLISM | 3.23e-01 | 2.63 | 0.06 | 1.00e+00 | 1.00e+00 | 1TK2 |
98 |
| KEGG_LYSOSOME | 3.82e-01 | 2.13 | 0.05 | 1.00e+00 | 1.00e+00 | 1SORT1 |
121 |
| KEGG_NEUROTROPHIN_SIGNALING_PATHWAY | 3.94e-01 | 2.04 | 0.05 | 1.00e+00 | 1.00e+00 | 1SORT1 |
126 |
| KEGG_ENDOCYTOSIS | 5.12e-01 | 1.42 | 0.03 | 1.00e+00 | 1.00e+00 | 1LDLR |
181 |
| KEGG_MAPK_SIGNALING_PATHWAY | 1.00e+00 | 0.96 | 0.02 | 1.00e+00 | 1.00e+00 | 1RELB |
267 |
| KEGG_N_GLYCAN_BIOSYNTHESIS | 1.00e+00 | 0.00 | 0.00 | 1.00e+00 | 1.00e+00 | 0 |
46 |
| KEGG_OTHER_GLYCAN_DEGRADATION | 1.00e+00 | 0.00 | 0.00 | 1.00e+00 | 1.00e+00 | 0 |
16 |
| KEGG_GLYCOSAMINOGLYCAN_DEGRADATION | 1.00e+00 | 0.00 | 0.00 | 1.00e+00 | 1.00e+00 | 0 |
21 |
Dowload full table
CHR Positional Gene Sets:
| P-value | OR | Lower 95% CI | FDR | FWER | Genes Found | Gene Set Size | |
|---|---|---|---|---|---|---|---|
| chr3p21 | 1.14e-01 | 2.65 | 0.52 | 1.00e+00 | 1.00e+00 | 3LTF, TCAIM, NEK4 |
304 |
| chr2q24 | 8.71e-02 | 4.23 | 0.49 | 1.00e+00 | 1.00e+00 | 2GCA, LY75 |
125 |
| chr20q13 | 2.00e-01 | 2.01 | 0.40 | 1.00e+00 | 1.00e+00 | 3SLPI, B4GALT5, SLC9A8 |
400 |
| chr11q24 | 1.61e-01 | 2.88 | 0.34 | 1.00e+00 | 1.00e+00 | 2SIAE, SLC37A2 |
183 |
| chr1q42 | 2.27e-01 | 2.28 | 0.27 | 1.00e+00 | 1.00e+00 | 2ABCB10, CNIH4 |
230 |
| chr1p34 | 2.91e-01 | 1.91 | 0.22 | 1.00e+00 | 1.00e+00 | 2COL9A2, AGO4 |
275 |
| chr9q34 | 3.42e-01 | 1.69 | 0.20 | 1.00e+00 | 1.00e+00 | 2LCN2, SLC27A4 |
311 |
| chr19q13 | 7.98e-01 | 0.69 | 0.14 | 1.00e+00 | 1.00e+00 | 3CD177, PGLYRP1, RELB |
1165 |
| chr6p21 | 7.00e-01 | 1.12 | 0.13 | 1.00e+00 | 1.00e+00 | 2CPNE5, ENPP4 |
467 |
| chr3p12 | 2.31e-01 | 3.92 | 0.10 | 1.00e+00 | 1.00e+00 | 1GBE1 |
66 |
| chr16q21 | 2.55e-01 | 3.49 | 0.09 | 1.00e+00 | 1.00e+00 | 1TK2 |
74 |
| chr2q12 | 2.70e-01 | 3.27 | 0.08 | 1.00e+00 | 1.00e+00 | 1TGFBRAP1 |
79 |
| chr19p13 | 1.00e+00 | 0.68 | 0.08 | 1.00e+00 | 1.00e+00 | 2LDLR, TMEM259 |
773 |
| chrXq24 | 2.73e-01 | 3.23 | 0.08 | 1.00e+00 | 1.00e+00 | 1ZBTB33 |
80 |
| chr1q41 | 3.06e-01 | 2.80 | 0.07 | 1.00e+00 | 1.00e+00 | 1HLX |
92 |
| chr5q23 | 3.57e-01 | 2.32 | 0.06 | 1.00e+00 | 1.00e+00 | 1FBN2 |
111 |
| chr15q24 | 3.69e-01 | 2.22 | 0.05 | 1.00e+00 | 1.00e+00 | 1CLK3 |
116 |
| chr11p11 | 4.38e-01 | 1.77 | 0.04 | 1.00e+00 | 1.00e+00 | 1MADD |
145 |
| chr2q11 | 4.40e-01 | 1.76 | 0.04 | 1.00e+00 | 1.00e+00 | 1UNC50 |
146 |
| chr4q31 | 4.64e-01 | 1.64 | 0.04 | 1.00e+00 | 1.00e+00 | 1SETD7 |
157 |
Dowload full table
Transcription Factor Targets:
| P-value | OR | Lower 95% CI | FDR | FWER | Genes Found | Gene Set Size | |
|---|---|---|---|---|---|---|---|
| TERT_TARGET_GENES | 1.37e-02 | 6.43 | 1.26 | 1.00e+00 | 1.00e+00 | 3SLC27A4, RELB, TMEM259 |
127 |
| ZA_UNIPROT_Q9UM89_UNREVIEWED_TARGET_GENES | 2.14e-02 | 9.46 | 1.09 | 1.00e+00 | 1.00e+00 | 2PGLYRP1, CLK3 |
57 |
| AML1_01 | 2.10e-02 | 4.07 | 1.06 | 1.00e+00 | 1.00e+00 | 4HLX, COL9A2, SLC37A2, MADD |
271 |
| AML1_Q6 | 2.10e-02 | 4.07 | 1.06 | 1.00e+00 | 1.00e+00 | 4HLX, COL9A2, SLC37A2, MADD |
271 |
| COREBINDINGFACTOR_Q6 | 2.23e-02 | 4.00 | 1.04 | 1.00e+00 | 1.00e+00 | 4HLX, COL9A2, SLC37A2, MADD |
276 |
| CEBP_01 | 2.25e-02 | 3.98 | 1.03 | 1.00e+00 | 1.00e+00 | 4SIAE, ORAI3, MSRB1, CNIH4 |
277 |
| MIF1_01 | 3.64e-02 | 4.36 | 0.86 | 1.00e+00 | 1.00e+00 | 3SIAE, ORAI3, MADD |
186 |
| MAFG_TARGET_GENES | 1.44e-01 | 1.66 | 0.74 | 1.00e+00 | 1.00e+00 | 10TMEM107, MSRB1, SORT1, TK2, DENND4C, GBE1, NEK4, HAUS4, SETD7, TMEM259 |
1893 |
| ZSCAN5B_TARGET_GENES | 4.36e-02 | 6.35 | 0.74 | 1.00e+00 | 1.00e+00 | 2SLC27A4, TMEM259 |
84 |
| ZNF33A_TARGET_GENES | 7.45e-02 | 3.22 | 0.64 | 1.00e+00 | 1.00e+00 | 3TGFBRAP1, CLK3, TK2 |
251 |
| RYBP_TARGET_GENES | 2.88e-01 | 1.48 | 0.63 | 1.00e+00 | 1.00e+00 | 9ATOH8, COL9A2, SLC27A4, FBN2, TK2, CPNE5, SETD7, PGD, TMEM259 |
1858 |
| NFE2L1_TARGET_GENES | 2.90e-01 | 1.47 | 0.63 | 1.00e+00 | 1.00e+00 | 9YOD1, MSRB1, PIGN, TCAIM, GBE1, NEK4, CNIH4, SETD7, PGD |
1875 |
| CREBP1CJUN_01 | 8.36e-02 | 3.06 | 0.60 | 1.00e+00 | 1.00e+00 | 3CYSTM1, RELB, MADD |
264 |
| GGGTGGRR_PAX4_03 | 3.26e-01 | 1.56 | 0.59 | 1.00e+00 | 1.00e+00 | 7ATOH8, SIAE, RAD51B, ORAI3, FOXJ2, CPNE5, HAUS4 |
1310 |
| BARX2_TARGET_GENES | 3.83e-01 | 1.39 | 0.56 | 1.00e+00 | 1.00e+00 | 8RAD51B, GCA, CLK3, SORT1, ENPP4, CEP192, PGD, TMEM259 |
1723 |
| TGACCTY_ERR1_Q2 | 2.82e-01 | 1.61 | 0.56 | 1.00e+00 | 1.00e+00 | 6LCN2, SLC27A4, SORT1, ZBTB33, SLC37A2, MADD |
1064 |
| CDC73_TARGET_GENES | 1.35e-01 | 2.12 | 0.55 | 1.00e+00 | 1.00e+00 | 4COL9A2, CLK3, ABCB10, SETD7 |
517 |
| SAFB2_TARGET_GENES | 2.27e-01 | 1.73 | 0.53 | 1.00e+00 | 1.00e+00 | 5GCA, CLK3, SORT1, TK2, HAUS4 |
808 |
| RYTGCNWTGGNR_UNKNOWN | 7.90e-02 | 4.49 | 0.52 | 1.00e+00 | 1.00e+00 | 2ORAI3, TMEM107 |
118 |
| FOXN3_TARGET_GENES | 4.87e-01 | 1.36 | 0.52 | 1.00e+00 | 1.00e+00 | 7ATOH8, TMEM107, CLK3, TK2, CPNE5, NEK4, ENPP4 |
1502 |
Dowload full table
GO Biological Processes:
| P-value | OR | Lower 95% CI | FDR | FWER | Genes Found | Gene Set Size | |
|---|---|---|---|---|---|---|---|
| GOBP_REGULATION_OF_RAB_PROTEIN_SIGNAL_TRANSDUCTION | 3.22e-04 | 103.49 | 9.64 | 6.03e-01 | 1.00e+00 | 2DENND4C, MADD |
7 |
| GOBP_IRON_COORDINATION_ENTITY_TRANSPORT | 1.37e-03 | 43.30 | 4.59 | 1.00e+00 | 1.00e+00 | 2LCN2, LTF |
14 |
| GOBP_T_HELPER_1_CELL_DIFFERENTIATION | 2.28e-03 | 32.49 | 3.53 | 1.00e+00 | 1.00e+00 | 2HLX, RELB |
18 |
| GOBP_RAB_PROTEIN_SIGNAL_TRANSDUCTION | 3.10e-03 | 27.37 | 3.01 | 1.00e+00 | 1.00e+00 | 2DENND4C, MADD |
21 |
| GOBP_MYELOID_LEUKOCYTE_ACTIVATION | 2.76e-05 | 5.44 | 2.50 | 2.06e-01 | 2.06e-01 | 11LCN2, LTF, CD177, PGLYRP1, SLPI, GCA, DNASE1L1, LDLR, CYSTM1, RELB, ENPP4 |
659 |
| GOBP_CELL_ACTIVATION_INVOLVED_IN_IMMUNE_RESPONSE | 6.09e-05 | 4.96 | 2.28 | 2.28e-01 | 4.56e-01 | 11LCN2, LTF, CD177, PGLYRP1, HLX, SLPI, GCA, DNASE1L1, CYSTM1, RELB, ENPP4 |
722 |
| GOBP_MYELOID_LEUKOCYTE_MEDIATED_IMMUNITY | 2.04e-04 | 5.07 | 2.16 | 5.09e-01 | 1.00e+00 | 9LCN2, LTF, CD177, PGLYRP1, SLPI, GCA, DNASE1L1, CYSTM1, ENPP4 |
550 |
| GOBP_ANTIMICROBIAL_HUMORAL_RESPONSE | 2.32e-03 | 7.87 | 2.03 | 1.00e+00 | 1.00e+00 | 4LCN2, LTF, PGLYRP1, SLPI |
142 |
| GOBP_POSITIVE_REGULATION_OF_BONE_MINERALIZATION | 1.04e-02 | 14.07 | 1.60 | 1.00e+00 | 1.00e+00 | 2LTF, FBN2 |
39 |
| GOBP_T_HELPER_1_TYPE_IMMUNE_RESPONSE | 1.15e-02 | 13.35 | 1.52 | 1.00e+00 | 1.00e+00 | 2HLX, RELB |
41 |
| GOBP_REGULATION_OF_ENDOTHELIAL_CELL_DIFFERENTIATION | 1.37e-02 | 12.10 | 1.38 | 1.00e+00 | 1.00e+00 | 2ATOH8, FOXJ2 |
45 |
| GOBP_LEUKOCYTE_MEDIATED_IMMUNITY | 4.48e-03 | 3.18 | 1.35 | 1.00e+00 | 1.00e+00 | 9LCN2, LTF, CD177, PGLYRP1, SLPI, GCA, DNASE1L1, CYSTM1, ENPP4 |
873 |
| GOBP_EXOCYTOSIS | 5.08e-03 | 3.11 | 1.33 | 1.00e+00 | 1.00e+00 | 9LCN2, LTF, CD177, PGLYRP1, SLPI, GCA, DNASE1L1, CYSTM1, ENPP4 |
891 |
| GOBP_POSITIVE_REGULATION_OF_OSSIFICATION | 1.55e-02 | 11.31 | 1.29 | 1.00e+00 | 1.00e+00 | 2LTF, FBN2 |
48 |
| GOBP_POSITIVE_REGULATION_OF_BIOMINERALIZATION | 1.55e-02 | 11.31 | 1.29 | 1.00e+00 | 1.00e+00 | 2LTF, FBN2 |
48 |
| GOBP_CELL_ACTIVATION | 4.46e-03 | 2.73 | 1.29 | 1.00e+00 | 1.00e+00 | 12LCN2, LTF, CD177, PGLYRP1, HLX, SLPI, GCA, DNASE1L1, LDLR, CYSTM1, RELB, ENPP4 |
1461 |
| GOBP_ANTIFUNGAL_HUMORAL_RESPONSE | 1.98e-02 | 63.54 | 1.27 | 1.00e+00 | 1.00e+00 | 1LTF |
5 |
| GOBP_PROTEIN_K29_LINKED_DEUBIQUITINATION | 1.98e-02 | 63.54 | 1.27 | 1.00e+00 | 1.00e+00 | 1YOD1 |
5 |
| GOBP_GLUCOSE_IMPORT_IN_RESPONSE_TO_INSULIN_STIMULUS | 1.98e-02 | 63.54 | 1.27 | 1.00e+00 | 1.00e+00 | 1SLC27A4 |
5 |
| GOBP_MICROTUBULE_NUCLEATION_BY_MICROTUBULE_ORGANIZING_CENTER | 1.98e-02 | 63.54 | 1.27 | 1.00e+00 | 1.00e+00 | 1CEP192 |
5 |
Dowload full table
Immunological Gene Sets:
| P-value | OR | Lower 95% CI | FDR | FWER | Genes Found | Gene Set Size | |
|---|---|---|---|---|---|---|---|
| GSE34205_HEALTHY_VS_RSV_INF_INFANT_PBMC_DN | 4.29e-09 | 16.45 | 7.22 | 2.09e-05 | 2.09e-05 | 10LCN2, LTF, CD177, PGLYRP1, HLX, SLPI, YOD1, LDLR, CYSTM1, SLC9A8 |
200 |
| GSE6269_E_COLI_VS_STREP_PNEUMO_INF_PBMC_DN | 4.47e-05 | 10.65 | 3.66 | 1.09e-01 | 2.18e-01 | 6LCN2, LTF, CD177, PGLYRP1, SLPI, PGD |
166 |
| GSE4748_CYANOBACTERIUM_LPSLIKE_VS_LPS_AND_CYANOBACTERIUM_LPSLIKE_STIM_DC_3H_DN | 9.44e-04 | 7.35 | 2.25 | 8.77e-01 | 1.00e+00 | 5LCN2, LTF, PGLYRP1, SLPI, CYSTM1 |
194 |
| GSE2770_IL12_VS_TGFB_AND_IL12_TREATED_ACT_CD4_TCELL_48H_DN | 1.06e-03 | 7.16 | 2.19 | 8.77e-01 | 1.00e+00 | 5SLPI, GCA, DENND4C, LY75, AGO4 |
199 |
| GSE17721_POLYIC_VS_CPG_16H_BMDC_UP | 1.08e-03 | 7.12 | 2.18 | 8.77e-01 | 1.00e+00 | 5FBN2, B4GALT5, MSRB1, CLK3, DENND4C |
200 |
| GSE22886_NAIVE_BCELL_VS_NEUTROPHIL_DN | 1.08e-03 | 7.12 | 2.18 | 8.77e-01 | 1.00e+00 | 5HLX, SLPI, GCA, B4GALT5, MSRB1 |
200 |
| GSE13547_CTRL_VS_ANTI_IGM_STIM_ZFX_KO_BCELL_2H_UP | 3.96e-03 | 6.75 | 1.74 | 9.88e-01 | 1.00e+00 | 4LCN2, LTF, PGLYRP1, SLPI |
165 |
| GSE6269_HEALTHY_VS_STAPH_PNEUMO_INF_PBMC_DN | 4.40e-03 | 6.55 | 1.69 | 9.88e-01 | 1.00e+00 | 4LCN2, LTF, SORT1, PGD |
170 |
| GSE4984_GALECTIN1_VS_VEHICLE_CTRL_TREATED_DC_UP | 6.83e-03 | 5.75 | 1.49 | 9.88e-01 | 1.00e+00 | 4TMEM107, CLK3, TK2, ZBTB33 |
193 |
| GSE11057_CD4_CENT_MEM_VS_PBMC_DN | 7.07e-03 | 5.69 | 1.47 | 9.88e-01 | 1.00e+00 | 4FBN2, SORT1, SLC37A2, CPNE5 |
195 |
| GSE37416_CTRL_VS_12H_F_TULARENSIS_LVS_NEUTROPHIL_UP | 7.07e-03 | 5.69 | 1.47 | 9.88e-01 | 1.00e+00 | 4MSRB1, LY75, HAUS4, AGO4 |
195 |
| GSE360_T_GONDII_VS_B_MALAYI_LOW_DOSE_DC_UP | 7.32e-03 | 5.63 | 1.46 | 9.88e-01 | 1.00e+00 | 4HLX, COL9A2, LY75, GBE1 |
197 |
| GSE7400_CTRL_VS_CSF3_IN_VIVO_TREATED_PBMC_DN | 7.45e-03 | 5.60 | 1.45 | 9.88e-01 | 1.00e+00 | 4CD177, SLPI, DNASE1L1, CYSTM1 |
198 |
| GSE36888_STAT5_AB_KNOCKIN_VS_WT_TCELL_IL2_TREATED_2H_DN | 7.45e-03 | 5.60 | 1.45 | 9.88e-01 | 1.00e+00 | 4HLX, SNTB1, GCA, FBN2 |
198 |
| GSE45382_UNTREATED_VS_TGFB_TREATED_MACROPHAGES_UP | 7.45e-03 | 5.60 | 1.45 | 9.88e-01 | 1.00e+00 | 4TK2, SLC37A2, DENND4C, SETD7 |
198 |
| GSE41176_UNSTIM_VS_ANTI_IGM_STIM_BCELL_24H_UP | 7.45e-03 | 5.60 | 1.45 | 9.88e-01 | 1.00e+00 | 4UEVLD, HLX, SIAE, CPNE5 |
198 |
| GSE17721_PAM3CSK4_VS_CPG_1H_BMDC_DN | 7.58e-03 | 5.57 | 1.44 | 9.88e-01 | 1.00e+00 | 4FOXJ2, UNC50, ABCB10, ZBTB33 |
199 |
| GSE24142_DN2_VS_DN3_THYMOCYTE_FETAL_DN | 7.58e-03 | 5.57 | 1.44 | 9.88e-01 | 1.00e+00 | 4ATOH8, CLK3, SLC37A2, RELB |
199 |
| GSE3982_NEUTROPHIL_VS_NKCELL_UP | 7.58e-03 | 5.57 | 1.44 | 9.88e-01 | 1.00e+00 | 4HLX, SLPI, B4GALT5, AGO4 |
199 |
| GSE5589_WT_VS_IL6_KO_LPS_AND_IL6_STIM_MACROPHAGE_45MIN_DN | 7.58e-03 | 5.57 | 1.44 | 9.88e-01 | 1.00e+00 | 4SLC27A4, TGFBRAP1, SORT1, SLC37A2 |
199 |
Top Ranked Transcription Factors for this Gene Expression Program:
| Gene Symbol | TF Rank | DNA Binding Domain | Motif Status | IUPAC PWM | GTEx | DepMap | Decartes |
|---|---|---|---|---|---|---|---|
| LTF | 2 | Yes | Known motif | Monomer or homomultimer | In vivo/Misc source | Only known motifs are from Transfac or HocoMoco - origin is uncertain | None |
| HLX | 6 | Yes | Known motif | Monomer or homomultimer | 100 perc ID - in vitro | None | None |
| ATOH8 | 7 | Yes | Inferred motif | Monomer or homomultimer | High-throughput in vitro | None | None |
| YOD1 | 14 | No | Unlikely to be sequence specific TF | Not a DNA binding protein | No motif | None | None |
| FOXJ2 | 24 | Yes | Known motif | Monomer or homomultimer | High-throughput in vitro | None | None |
| ZBTB33 | 32 | Yes | Known motif | Monomer or homomultimer | In vivo/Misc source | None | None |
| RELB | 40 | Yes | Known motif | Obligate heteromer | In vivo/Misc source | Only known motifs are from Transfac or HocoMoco - origin is uncertain | Likely an obligate heteromer (PMID: 22101729), pmid:17869269 forms heterodimer with NFKB1, citation is a crystal structure |
| ARID3B | 55 | Yes | Inferred motif | Monomer or homomultimer | High-throughput in vitro | None | None |
| UHRF2 | 57 | No | Unlikely to be sequence specific TF | Low specificity DNA-binding protein | No motif | None | Binds DNA in the crystal structure contacting the minor groove and backbone (PDB: 4PW5). Recognizes 5hmC-containing DNA (PDB: 4PW5) |
| NCOA2 | 64 | Yes | Likely to be sequence specific TF | Obligate heteromer | No motif | None | NCOA½/3 all have been tested on PBMs and HT-SELEX without yielding a motif. All are co-activators, collectively suggesting they might be obligate heteromers. |
| CUL1 | 77 | No | Unlikely to be sequence specific TF | Not a DNA binding protein | No motif | None | Component of the E3-ubiquitin ligase complex (PMID: 11961546) |
| CHURC1 | 92 | No | Unlikely to be sequence specific TF | Not a DNA binding protein | No motif | Only known motifs are from Transfac or HocoMoco - origin is uncertain | Most recent work has conclusively shown it does not bind DNA (PMID: 17610897), refuting a previous study (PMID: 14651851) |
| CREB3L2 | 100 | Yes | Known motif | Monomer or homomultimer | 100 perc ID - in vitro | None | None |
| DAP | 104 | No | Unlikely to be sequence specific TF | Not a DNA binding protein | No motif | None | Protein functions in apoptotic signaling |
| MAPK14 | 108 | No | Unlikely to be sequence specific TF | Not a DNA binding protein | No motif | None | Well characterized MAPK. Included because it as a regulator of several TFs and GO captures this. |
| TAF13 | 117 | No | Unlikely to be sequence specific TF | Low specificity DNA-binding protein | No motif | None | Forms heterodimer TAF11:TAF13, which has a histone-fold like structure and could thus bind DNA in a non- or low specific manner (PMID: 9695952) |
| MXI1 | 124 | Yes | Known motif | Obligate heteromer | In vivo/Misc source | Has a putative AT-hook | Obligate heteromer (PMID: 8425219). |
| NCOR2 | 128 | No | Unlikely to be sequence specific TF | Not a DNA binding protein | No motif | None | Contains 2 SANT domains, and no other putative DNA-binding domains |
| KDM5C | 131 | No | Unlikely to be sequence specific TF | Low specificity DNA-binding protein | No motif | None | None |
| MED17 | 151 | No | Unlikely to be sequence specific TF | Not a DNA binding protein | No motif | None | None |
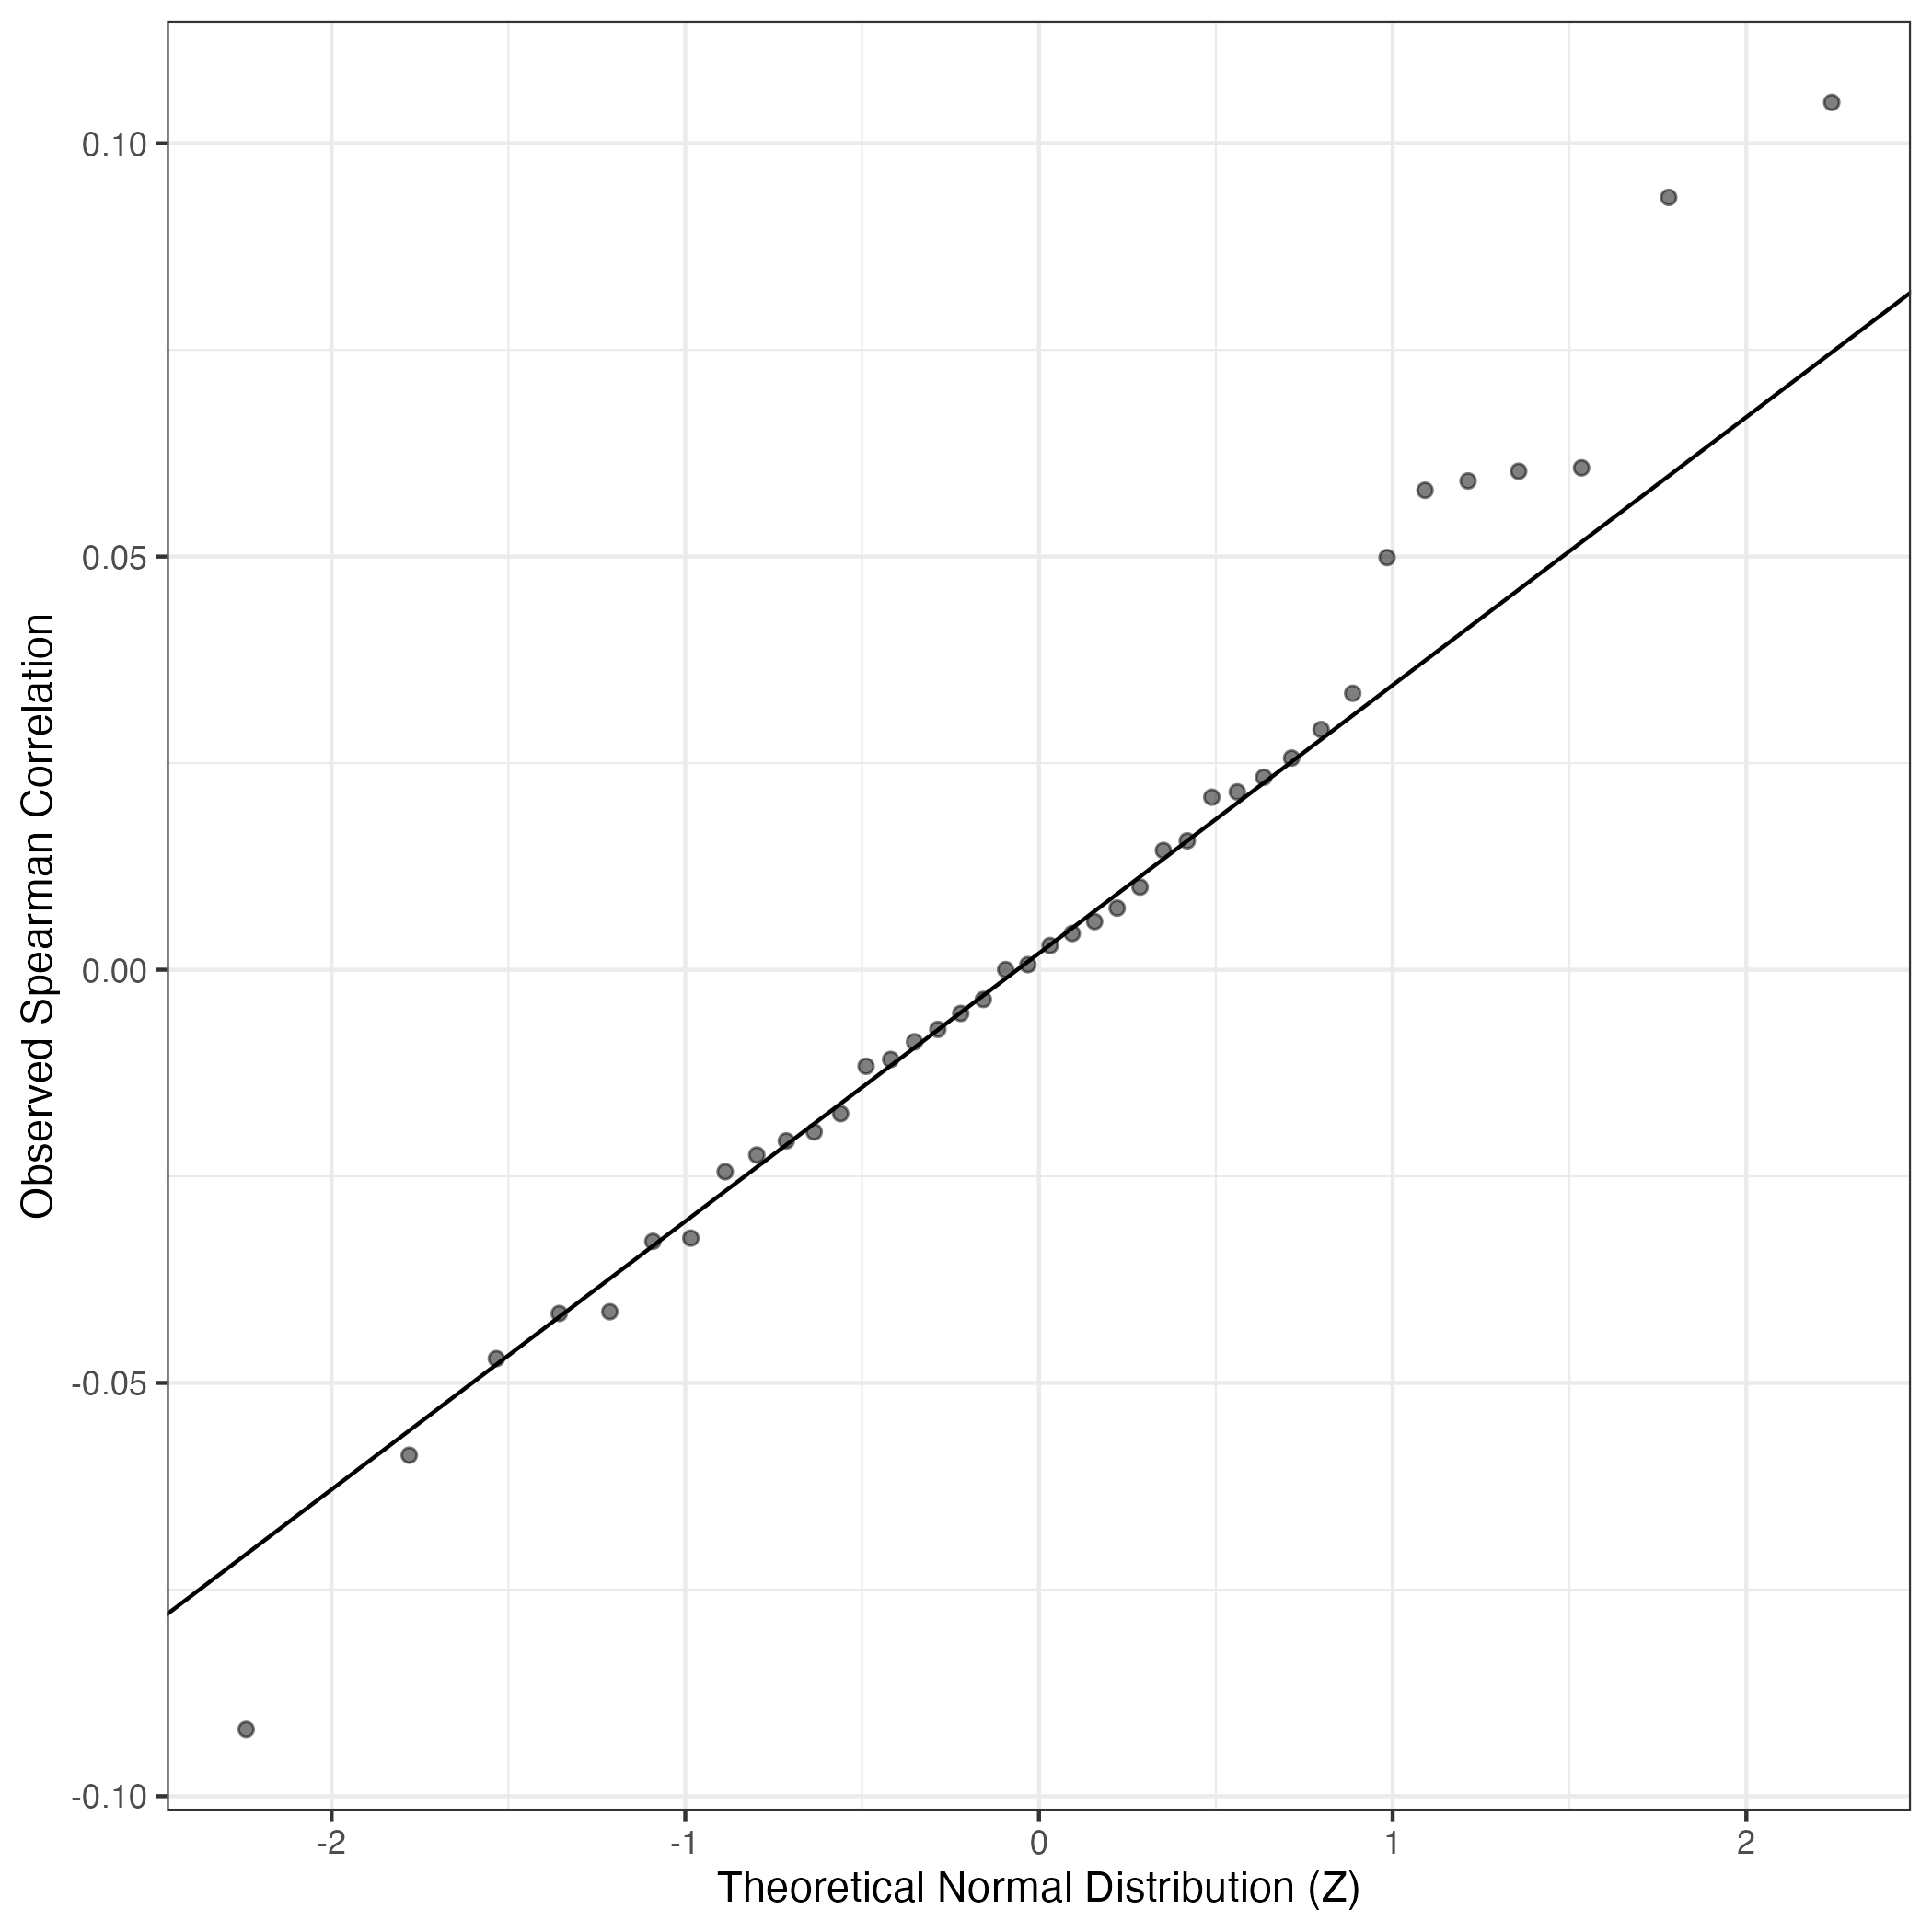
QQ Plot showing correlations with other GEPs in this dataset, calculated by Spearman correlation:
Interactive QQ-plot of gene loadings:
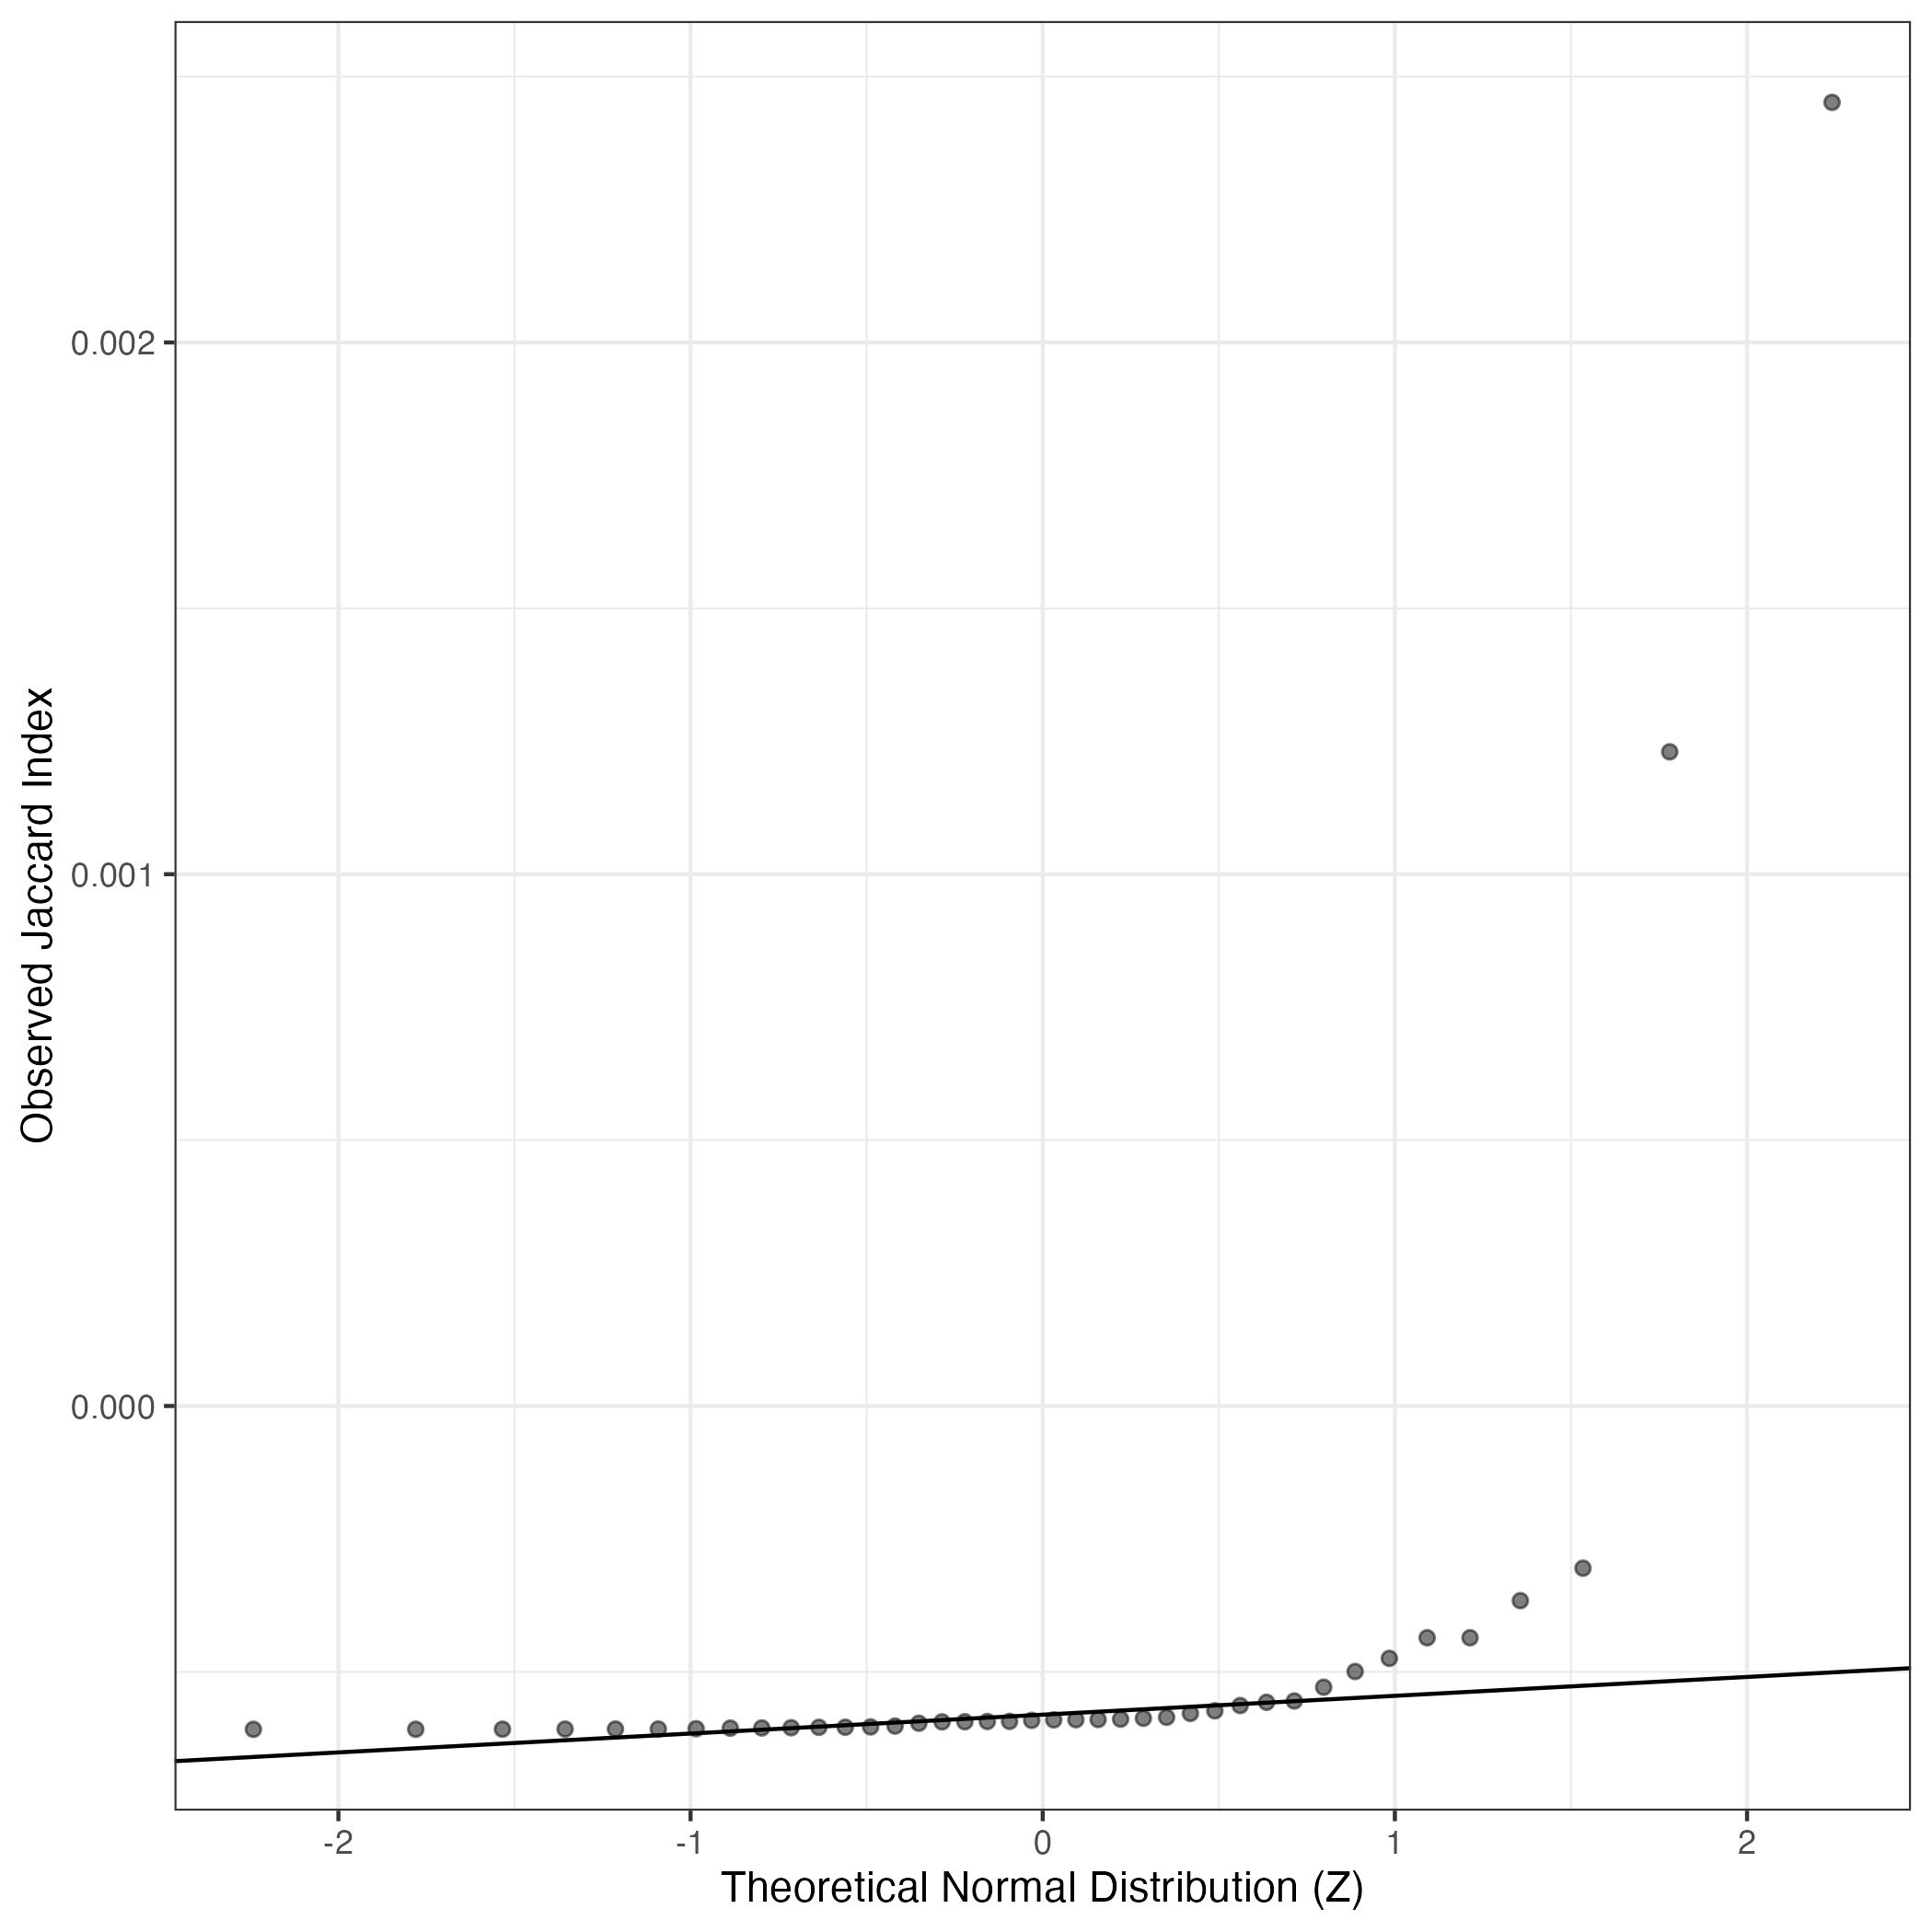
A similar QQ-plot as above, but only for instances where the H value is e.g. > 25, i.e. we are confident that the expression program is active above noise. Agreemenet between these binary vectors is tested using the Jaccard Index, with the P-values calculated by an exact test:
Interactive QQ-plot:
Singler cell type annotations for the top 50 cells on this program.
## Error in 1:nrow(topCellsAnnotMat): argument of length 0
| Cell ID | Singler label | Singler Delta | Activity Score | Top Singler Raw Scores |
|---|---|---|---|---|
| STDY7685342_TGTATTCCATGACATC | HSC_-G-CSF | 0.1 | 570.41 | Raw Scores |
Below shows the significant enrichments of this GEP for literature curated gene lists
This data was procured from existing single cell RNA-seq maps of neuroblastoma or related relevant data.
High ranks indicate this gene is a driver of this GEP.
These curated gene list are ranked by the P-value (on this GEP) of their constituent genes.
The Mean Count column shows the mean read count in cells scoring highly (H > 50) on this gene expression program.
Inflammatory CAF
These marker genes were curated across cancer subtypes in multiple organ systems as reviewed in Lavie et. al. (PMID 35883004) and contain inflammatory specific CAF genes:
Wilcoxon ranksum test P-value for gene set overrepresentation: 7.51e-04
Mean rank of genes in gene set: 3977.28
Rank on gene expression program of genes in gene set:
## Error in data.frame(Genes = geneCardsLinkSmallGsets, Weight = theseGenes, : object 'countHighScoringCells' not found