Program: 21. Mast Cells.
Submit a comment on this gene expression program’s interpretation: CLICK
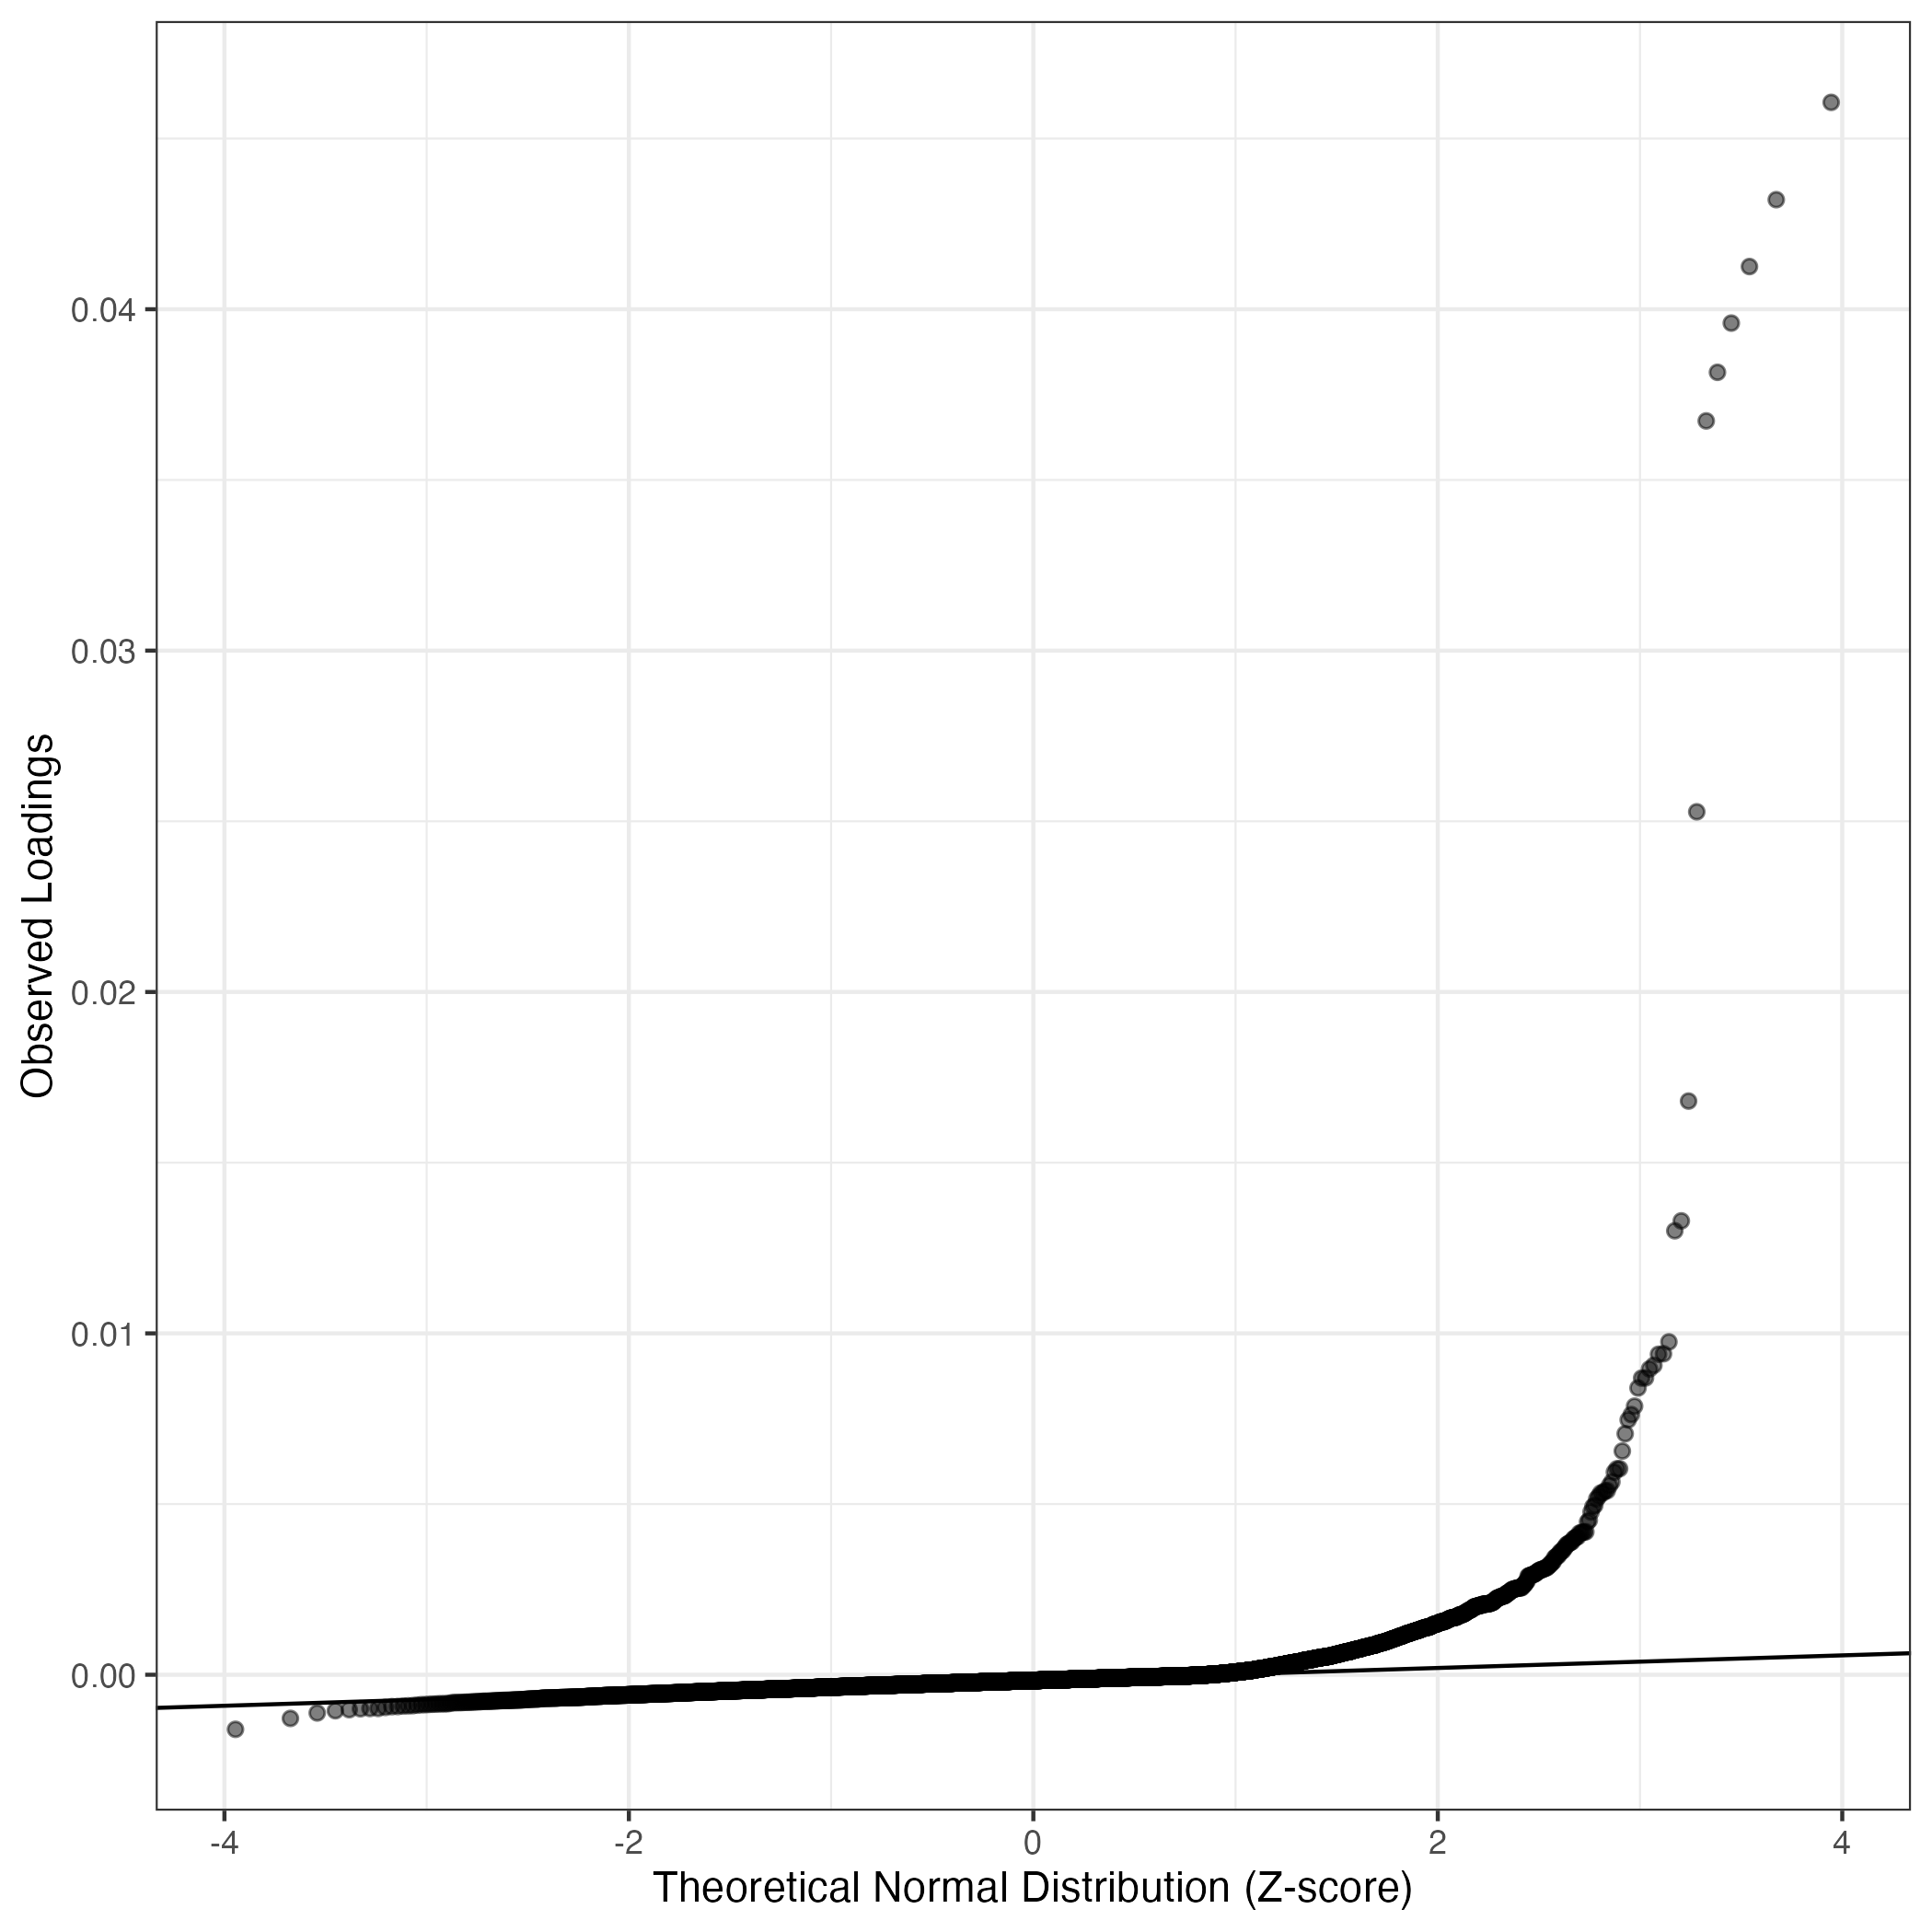
QQ-plot of gene loadings, averaged over both independent splits of the data
This plot highlights the relative contribution of each gene to the GEP
## Error in apply(allData[cellsHGreaterThan50, ], 2, mean): dim(X) must have a positive length
## Error in apply(allDataTpm[cellsHGreaterThan50, ], 2, mean): dim(X) must have a positive length
## Error in eval(expr, envir, enclos): object 'meanCountsHOver50' not found
## Error in eval(expr, envir, enclos): object 'meanTpmHOver50' not found
## Error in data.frame(Gene = geneCardsLink, Loading = dftoDisplay[, 2], : object 'countHighScoringCells' not found
## Error in rownames(dftForKable) <- rn: object 'dftForKable' not found
Top genes driving this program.
Note: Decartes website is buggy, try refreshing. Also, Decartes fetal adrenal data have been collected at specific time points (89-122 days), all possible cell types of interest may not be represented, do not overinterpret.
The Mean Count column shows the mean read count in cells scoring highly (H > 50) on this gene expression program.
## Error in kable(dftForKable[1:50, ], row.names = TRUE): object 'dftForKable' not found
## Error in eval(quote(list(...)), env): object 'countHighScoringCells' not found
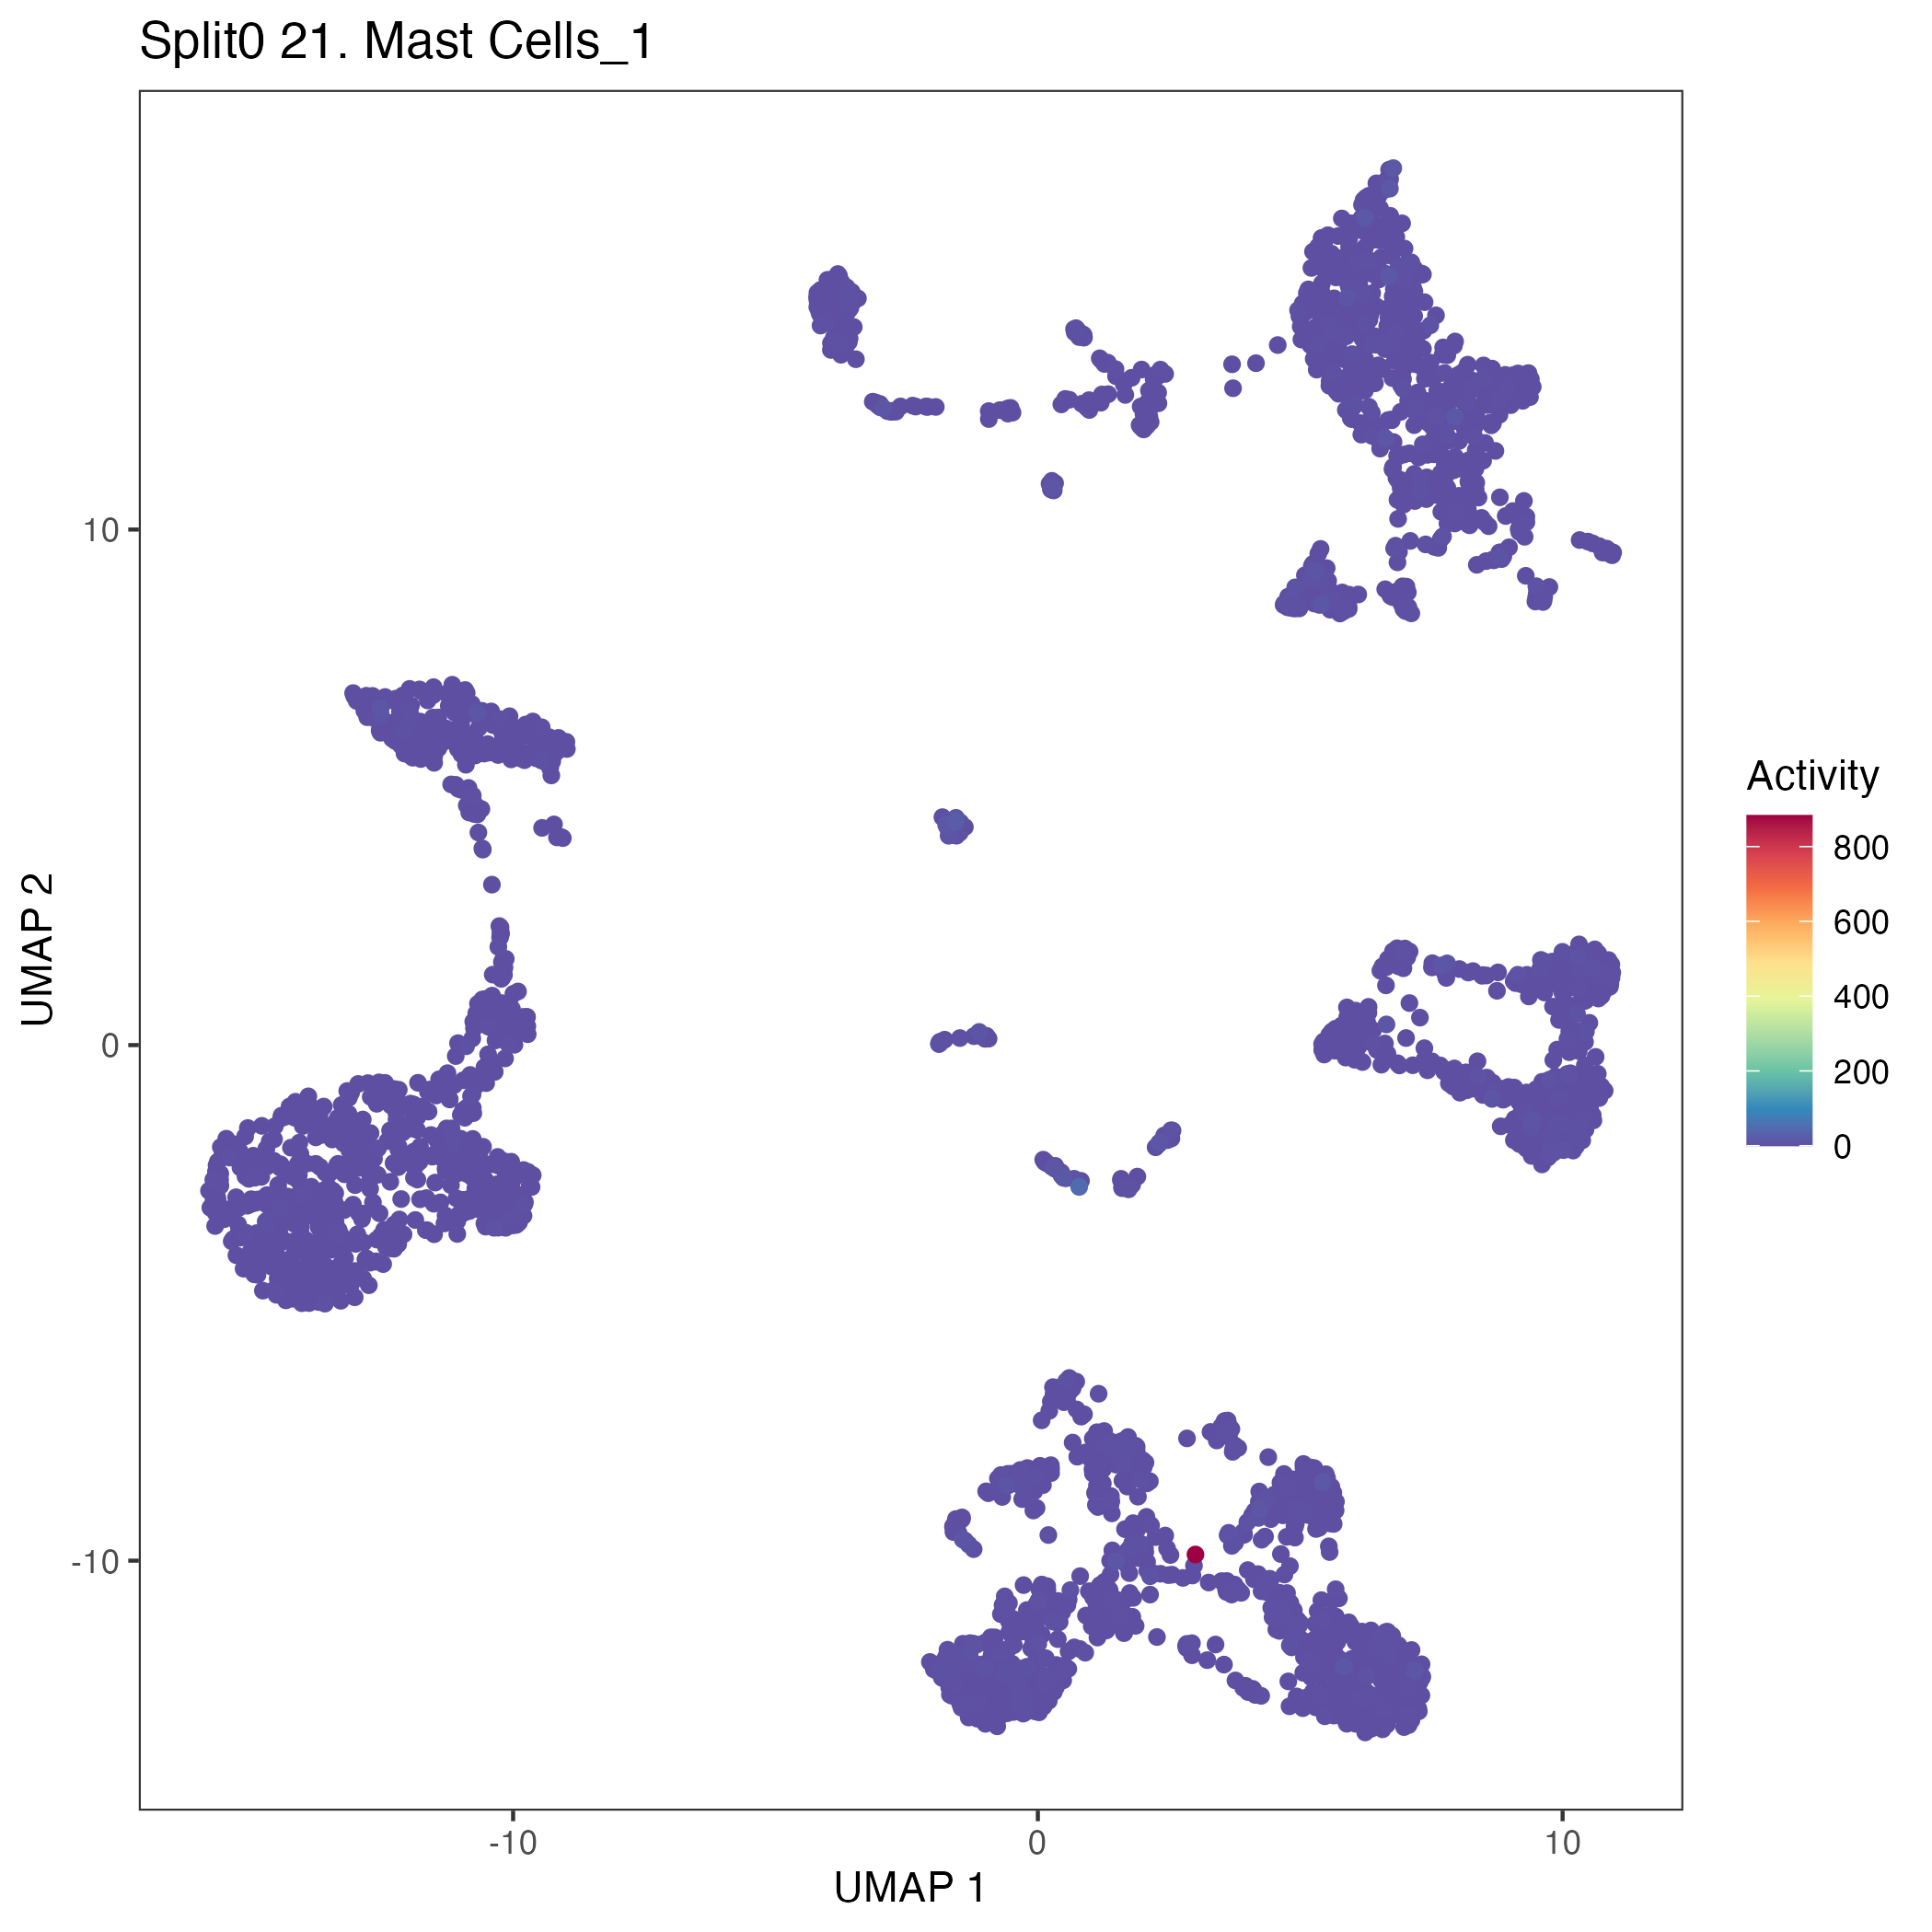
UMAP plots showing activity of gene expression program identified in GEP 21. Mast Cells:
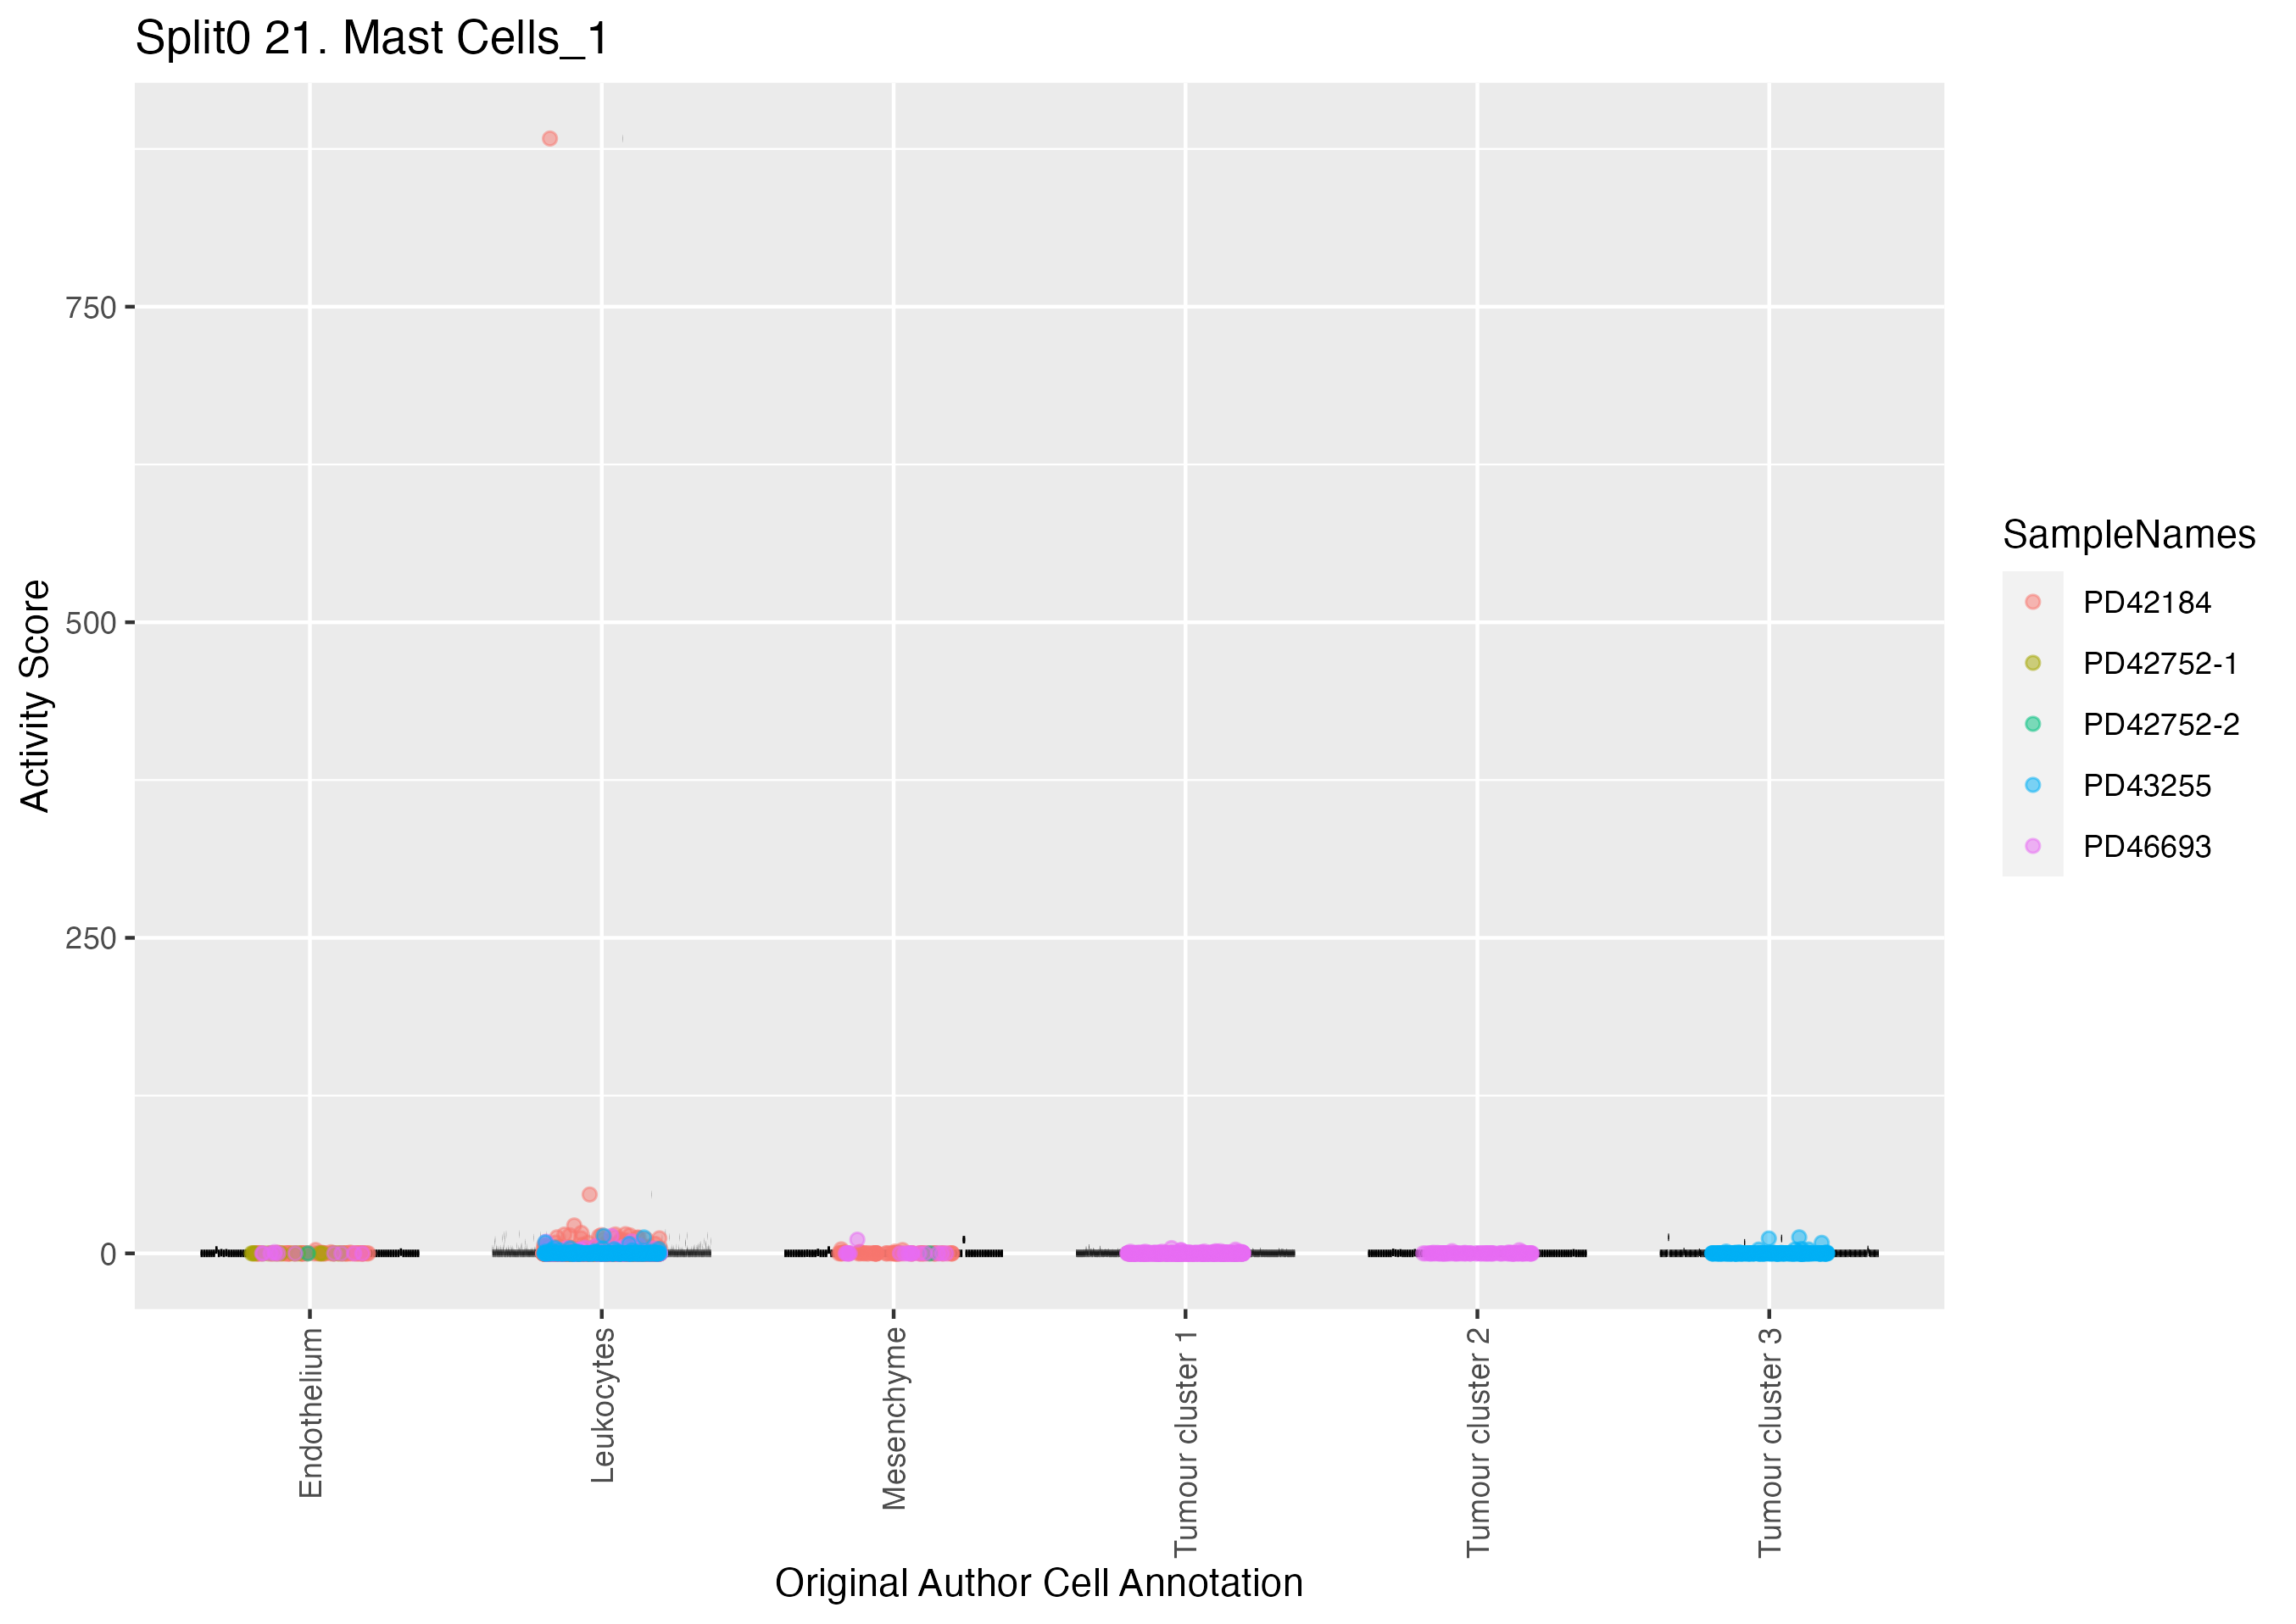
Boxlot showing activity of gene expression program identified in GEP 21. Mast Cells:
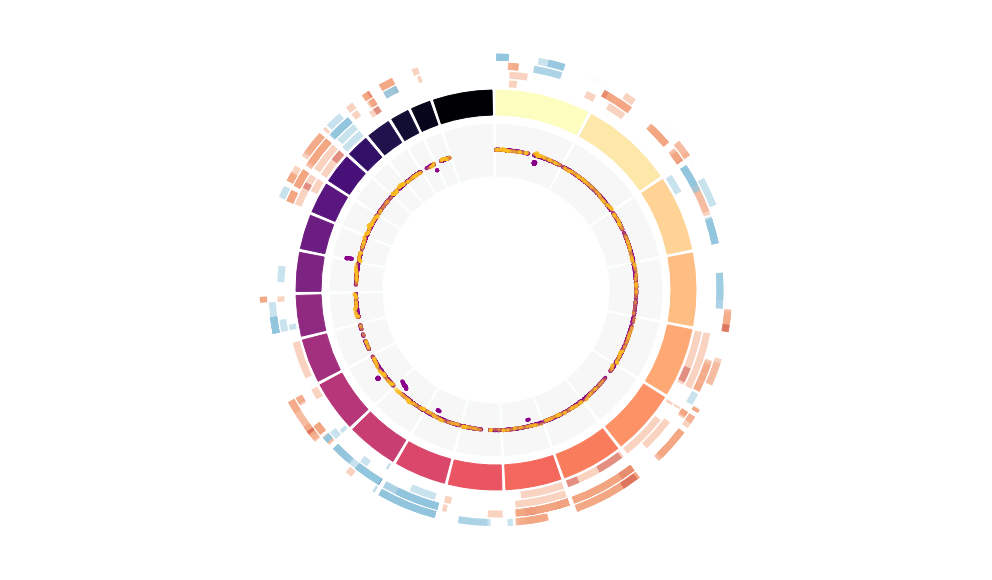
CNV Data procured from inferCNV.
Outer tracks are putative CNV regions (gains = red, losses = blue) for each patient
Inner track is expression data representing:
The top cells expressing this GEP (purple)
Random cells (n =50) from the reference set used in inferCNV (orange)
Gene set Enrichments for this program, caculated from top 50 genes
mSigDB Cell Types Gene Set:
| P-value | OR | Lower 95% CI | FDR | FWER | Genes Found | Gene Set Size | |
|---|---|---|---|---|---|---|---|
| DURANTE_ADULT_OLFACTORY_NEUROEPITHELIUM_MAST_CELLS | 1.47e-28 | 122.73 | 61.33 | 2.47e-26 | 9.87e-26 | 18TPSB2, CPA3, HPGDS, HPGD, VWA5A, GATA2, LIF, LMO4, RGS13, MAOB, KIT, RGS1, SLC18A2, TNFAIP3, ARHGAP18, ALOX5AP, SAMSN1, PPP1R15A |
75 |
| TRAVAGLINI_LUNG_BASOPHIL_MAST_1_CELL | 7.99e-40 | 83.06 | 44.85 | 5.36e-37 | 5.36e-37 | 31TPSB2, CPA3, HPGDS, HPGD, IL5RA, CDK15, VWA5A, GATA2, LIF, LMO4, RGS13, ENPP3, MAOB, BACE2, KIT, CNRIP1, RGS1, CD63, SLC18A2, CD82, RPS6KA5, SVOPL, LAX1, GALC, ANXA1, ARHGAP18, ALOX5AP, ALDH1A1, SAMSN1, SQSTM1, PPP1R15A |
276 |
| CUI_DEVELOPING_HEART_C7_MAST_CELL | 1.31e-29 | 73.07 | 38.81 | 2.94e-27 | 8.82e-27 | 22TPSB2, CPA3, HPGDS, HPGD, VWA5A, GATA2, LIF, RGS13, ENPP3, BACE2, KIT, CNRIP1, RGS1, SLC18A2, ANXA1, TNFAIP3, ARHGAP18, ALOX5AP, ALDH1A1, SAMSN1, SQSTM1, PPP1R15A |
156 |
| TRAVAGLINI_LUNG_BASOPHIL_MAST_2_CELL | 3.87e-35 | 51.87 | 27.80 | 1.30e-32 | 2.60e-32 | 33TPSB2, CPA3, HPGDS, HPGD, IL5RA, IL13, CDK15, VWA5A, GATA2, LIF, LMO4, RGS13, ENPP3, MAOB, BACE2, KIT, CNRIP1, RGS1, CD63, SLC18A2, CD82, KLF6, RPS6KA5, SVOPL, LAX1, GALC, ANXA1, TNFAIP3, ARHGAP18, ALDH1A1, SAMSN1, SQSTM1, PPP1R15A |
502 |
| HAY_BONE_MARROW_CD34_POS_EO_B_MAST | 9.05e-09 | 98.65 | 26.68 | 1.01e-06 | 6.07e-06 | 5TPSB2, HPGDS, HPGD, CDK15, LMO4 |
19 |
| ZHENG_CORD_BLOOD_C2_PUTATIVE_BASOPHIL_EOSINOPHIL_MAST_CELL_PROGENITOR | 3.15e-12 | 36.29 | 15.67 | 4.23e-10 | 2.11e-09 | 10HPGDS, GATA2, LMO4, BACE2, CNRIP1, CD63, CD82, ANXA1, ALOX5AP, PPP1R15A |
96 |
| ZHENG_CORD_BLOOD_C4_PUTATIVE_EARLY_ERYTHROID_COMMITMENT | 3.86e-05 | 15.09 | 4.57 | 2.85e-03 | 2.59e-02 | 5CPA3, HPGDS, GATA2, KIT, PSTPIP2 |
97 |
| AIZARANI_LIVER_C28_NK_NKT_CELLS_6 | 4.25e-05 | 14.77 | 4.47 | 2.85e-03 | 2.85e-02 | 5KIT, RGS1, ANXA1, TNFAIP3, SAMSN1 |
99 |
| DURANTE_ADULT_OLFACTORY_NEUROEPITHELIUM_CD8_T_CELLS | 1.94e-04 | 15.74 | 4.01 | 1.08e-02 | 1.30e-01 | 4RGS1, TNFAIP3, ALOX5AP, SAMSN1 |
73 |
| DESCARTES_FETAL_HEART_MEGAKARYOCYTES | 7.64e-05 | 12.97 | 3.94 | 4.66e-03 | 5.13e-02 | 5TPSB2, CPA3, VWA5A, KIT, PSTPIP2 |
112 |
| MURARO_PANCREAS_DUCTAL_CELL | 2.15e-07 | 5.60 | 2.95 | 2.06e-05 | 1.44e-04 | 18CPA3, LIF, LMO4, MAOB, CXCL3, BACE2, KIT, IGF2BP2, RGS1, CD63, KLF6, ANXA1, TNFAIP3, ARHGAP18, AMOTL1, ALOX5AP, SQSTM1, PON2 |
1276 |
| FAN_OVARY_CL12_T_LYMPHOCYTE_NK_CELL_2 | 4.10e-04 | 8.90 | 2.72 | 2.12e-02 | 2.75e-01 | 5KLF6, ANXA1, TNFAIP3, ALOX5AP, SAMSN1 |
161 |
| AIZARANI_LIVER_C25_KUPFFER_CELLS_4 | 5.82e-04 | 8.22 | 2.51 | 2.79e-02 | 3.90e-01 | 5CXCL3, RGS1, ANXA1, PSTPIP2, SAMSN1 |
174 |
| AIZARANI_LIVER_C39_EPCAM_POS_BILE_DUCT_CELLS_4 | 7.47e-04 | 7.76 | 2.38 | 3.13e-02 | 5.01e-01 | 5LIF, CXCL3, CD63, KLF6, SQSTM1 |
184 |
| CUI_DEVELOPING_HEART_VASCULAR_ENDOTHELIAL_CELL | 9.23e-04 | 7.39 | 2.26 | 3.64e-02 | 6.19e-01 | 5GATA2, CXCL3, TNFAIP3, ALDH1A1, PPP1R15A |
193 |
| CUI_DEVELOPING_HEART_C8_MACROPHAGE | 6.63e-04 | 6.34 | 2.19 | 2.96e-02 | 4.45e-01 | 6HPGDS, RGS1, KLF6, ARHGAP18, ALOX5AP, SAMSN1 |
275 |
| DURANTE_ADULT_OLFACTORY_NEUROEPITHELIUM_RESPIRATORY_SECRETORY_CELLS | 5.87e-03 | 19.27 | 2.16 | 1.42e-01 | 1.00e+00 | 2CXCL3, ANXA1 |
29 |
| BUSSLINGER_GASTRIC_IMMUNE_CELLS | 3.52e-05 | 3.99 | 2.05 | 2.85e-03 | 2.36e-02 | 16TPSB2, CPA3, VWA5A, GATA2, KIT, RGS1, SLC18A2, KLF6, RPS6KA5, LAX1, ANXA1, TNFAIP3, ALOX5AP, SAMSN1, FBXO11, PPP1R15A |
1490 |
| BUSSLINGER_DUODENAL_TUFT_CELLS | 4.01e-03 | 10.22 | 1.99 | 1.12e-01 | 1.00e+00 | 3HPGDS, ALOX5AP, PSTPIP2 |
81 |
| BUSSLINGER_GASTRIC_OXYNTIC_ENTEROCHROMAFFIN_LIKE_CELLS | 4.59e-03 | 9.72 | 1.90 | 1.23e-01 | 1.00e+00 | 3MAOB, SLC18A2, ALDH1A1 |
85 |
Dowload full table
mSigDB Hallmark Gene Sets:
| P-value | OR | Lower 95% CI | FDR | FWER | Genes Found | Gene Set Size | |
|---|---|---|---|---|---|---|---|
| HALLMARK_TNFA_SIGNALING_VIA_NFKB | 1.24e-04 | 8.78 | 3.02 | 6.18e-03 | 6.18e-03 | 6LIF, CXCL3, KLF6, TNFAIP3, SQSTM1, PPP1R15A |
200 |
| HALLMARK_INFLAMMATORY_RESPONSE | 7.71e-03 | 5.55 | 1.44 | 9.64e-02 | 3.85e-01 | 4LIF, RGS1, CD82, KLF6 |
200 |
| HALLMARK_P53_PATHWAY | 7.71e-03 | 5.55 | 1.44 | 9.64e-02 | 3.85e-01 | 4VWA5A, LIF, CD82, PPP1R15A |
200 |
| HALLMARK_KRAS_SIGNALING_UP | 7.71e-03 | 5.55 | 1.44 | 9.64e-02 | 3.85e-01 | 4VWA5A, LIF, TNFAIP3, PPP1R15A |
200 |
| HALLMARK_IL2_STAT5_SIGNALING | 4.30e-02 | 4.07 | 0.80 | 3.63e-01 | 1.00e+00 | 3IL13, LIF, KLF6 |
199 |
| HALLMARK_HYPOXIA | 4.35e-02 | 4.05 | 0.80 | 3.63e-01 | 1.00e+00 | 3KLF6, TNFAIP3, PPP1R15A |
200 |
| HALLMARK_PROTEIN_SECRETION | 5.52e-02 | 5.54 | 0.64 | 3.94e-01 | 1.00e+00 | 2CD63, GALC |
96 |
| HALLMARK_FATTY_ACID_METABOLISM | 1.28e-01 | 3.34 | 0.39 | 7.33e-01 | 1.00e+00 | 2HPGD, ALDH1A1 |
158 |
| HALLMARK_APOPTOSIS | 1.32e-01 | 3.28 | 0.38 | 7.33e-01 | 1.00e+00 | 2ANXA1, SQSTM1 |
161 |
| HALLMARK_MTORC1_SIGNALING | 1.85e-01 | 2.63 | 0.31 | 8.06e-01 | 1.00e+00 | 2SQSTM1, PPP1R15A |
200 |
| HALLMARK_ALLOGRAFT_REJECTION | 1.85e-01 | 2.63 | 0.31 | 8.06e-01 | 1.00e+00 | 2IL13, LIF |
200 |
| HALLMARK_TGF_BETA_SIGNALING | 1.94e-01 | 4.81 | 0.12 | 8.06e-01 | 1.00e+00 | 1PPP1R15A |
54 |
| HALLMARK_IL6_JAK_STAT3_SIGNALING | 2.93e-01 | 2.97 | 0.07 | 1.00e+00 | 1.00e+00 | 1CXCL3 |
87 |
| HALLMARK_ANDROGEN_RESPONSE | 3.28e-01 | 2.58 | 0.06 | 1.00e+00 | 1.00e+00 | 1HPGD |
100 |
| HALLMARK_PEROXISOME | 3.39e-01 | 2.48 | 0.06 | 1.00e+00 | 1.00e+00 | 1ALDH1A1 |
104 |
| HALLMARK_PI3K_AKT_MTOR_SIGNALING | 3.41e-01 | 2.45 | 0.06 | 1.00e+00 | 1.00e+00 | 1SQSTM1 |
105 |
| HALLMARK_BILE_ACID_METABOLISM | 3.59e-01 | 2.30 | 0.06 | 1.00e+00 | 1.00e+00 | 1ALDH1A1 |
112 |
| HALLMARK_COAGULATION | 4.22e-01 | 1.86 | 0.05 | 1.00e+00 | 1.00e+00 | 1ANXA1 |
138 |
| HALLMARK_UV_RESPONSE_DN | 4.35e-01 | 1.78 | 0.04 | 1.00e+00 | 1.00e+00 | 1KIT |
144 |
| HALLMARK_UV_RESPONSE_UP | 4.66e-01 | 1.62 | 0.04 | 1.00e+00 | 1.00e+00 | 1SQSTM1 |
158 |
Dowload full table
KEGG Pathways:
| P-value | OR | Lower 95% CI | FDR | FWER | Genes Found | Gene Set Size | |
|---|---|---|---|---|---|---|---|
| KEGG_CYTOKINE_CYTOKINE_RECEPTOR_INTERACTION | 3.61e-03 | 5.34 | 1.64 | 6.72e-01 | 6.72e-01 | 5IL5RA, IL13, LIF, CXCL3, KIT |
265 |
| KEGG_JAK_STAT_SIGNALING_PATHWAY | 2.30e-02 | 5.25 | 1.03 | 1.00e+00 | 1.00e+00 | 3IL5RA, IL13, LIF |
155 |
| KEGG_HEMATOPOIETIC_CELL_LINEAGE | 4.64e-02 | 6.13 | 0.71 | 1.00e+00 | 1.00e+00 | 2IL5RA, KIT |
87 |
| KEGG_LYSOSOME | 8.24e-02 | 4.38 | 0.51 | 1.00e+00 | 1.00e+00 | 2CD63, GALC |
121 |
| KEGG_RIBOFLAVIN_METABOLISM | 6.18e-02 | 16.98 | 0.40 | 1.00e+00 | 1.00e+00 | 1ENPP3 |
16 |
| KEGG_PANTOTHENATE_AND_COA_BIOSYNTHESIS | 6.18e-02 | 16.98 | 0.40 | 1.00e+00 | 1.00e+00 | 1ENPP3 |
16 |
| KEGG_RENIN_ANGIOTENSIN_SYSTEM | 6.56e-02 | 15.93 | 0.37 | 1.00e+00 | 1.00e+00 | 1CPA3 |
17 |
| KEGG_PHENYLALANINE_METABOLISM | 6.93e-02 | 14.99 | 0.35 | 1.00e+00 | 1.00e+00 | 1MAOB |
18 |
| KEGG_NICOTINATE_AND_NICOTINAMIDE_METABOLISM | 9.13e-02 | 11.08 | 0.26 | 1.00e+00 | 1.00e+00 | 1ENPP3 |
24 |
| KEGG_HISTIDINE_METABOLISM | 1.09e-01 | 9.11 | 0.22 | 1.00e+00 | 1.00e+00 | 1MAOB |
29 |
| KEGG_ASTHMA | 1.13e-01 | 8.79 | 0.21 | 1.00e+00 | 1.00e+00 | 1IL13 |
30 |
| KEGG_GLYCINE_SERINE_AND_THREONINE_METABOLISM | 1.16e-01 | 8.50 | 0.20 | 1.00e+00 | 1.00e+00 | 1MAOB |
31 |
| KEGG_SPHINGOLIPID_METABOLISM | 1.44e-01 | 6.71 | 0.16 | 1.00e+00 | 1.00e+00 | 1GALC |
39 |
| KEGG_TRYPTOPHAN_METABOLISM | 1.47e-01 | 6.54 | 0.16 | 1.00e+00 | 1.00e+00 | 1MAOB |
40 |
| KEGG_TYROSINE_METABOLISM | 1.54e-01 | 6.22 | 0.15 | 1.00e+00 | 1.00e+00 | 1MAOB |
42 |
| KEGG_BLADDER_CANCER | 1.54e-01 | 6.22 | 0.15 | 1.00e+00 | 1.00e+00 | 1RPS6KA5 |
42 |
| KEGG_STARCH_AND_SUCROSE_METABOLISM | 1.87e-01 | 5.00 | 0.12 | 1.00e+00 | 1.00e+00 | 1ENPP3 |
52 |
| KEGG_ARGININE_AND_PROLINE_METABOLISM | 1.94e-01 | 4.81 | 0.12 | 1.00e+00 | 1.00e+00 | 1MAOB |
54 |
| KEGG_INOSITOL_PHOSPHATE_METABOLISM | 1.94e-01 | 4.81 | 0.12 | 1.00e+00 | 1.00e+00 | 1ISYNA1 |
54 |
| KEGG_ACUTE_MYELOID_LEUKEMIA | 2.03e-01 | 4.55 | 0.11 | 1.00e+00 | 1.00e+00 | 1KIT |
57 |
Dowload full table
CHR Positional Gene Sets:
| P-value | OR | Lower 95% CI | FDR | FWER | Genes Found | Gene Set Size | |
|---|---|---|---|---|---|---|---|
| chr1q31 | 3.21e-02 | 7.55 | 0.87 | 1.00e+00 | 1.00e+00 | 2RGS13, RGS1 |
71 |
| chr6q23 | 6.57e-02 | 5.01 | 0.58 | 1.00e+00 | 1.00e+00 | 2ENPP3, TNFAIP3 |
106 |
| chr9q21 | 1.68e-01 | 2.80 | 0.33 | 1.00e+00 | 1.00e+00 | 2ANXA1, ALDH1A1 |
188 |
| chr2q33 | 1.78e-01 | 2.70 | 0.32 | 1.00e+00 | 1.00e+00 | 2CDK15, MDH1B |
195 |
| chr3p26 | 1.61e-01 | 5.93 | 0.14 | 1.00e+00 | 1.00e+00 | 1IL5RA |
44 |
| chr21q11 | 1.67e-01 | 5.67 | 0.14 | 1.00e+00 | 1.00e+00 | 1SAMSN1 |
46 |
| chr14q31 | 2.00e-01 | 4.64 | 0.11 | 1.00e+00 | 1.00e+00 | 1GALC |
56 |
| chr2p14 | 2.06e-01 | 4.47 | 0.11 | 1.00e+00 | 1.00e+00 | 1CNRIP1 |
58 |
| chr4q22 | 2.43e-01 | 3.70 | 0.09 | 1.00e+00 | 1.00e+00 | 1HPGDS |
70 |
| chr4q12 | 2.70e-01 | 3.27 | 0.08 | 1.00e+00 | 1.00e+00 | 1KIT |
79 |
| chr2q36 | 2.78e-01 | 3.15 | 0.08 | 1.00e+00 | 1.00e+00 | 1FAM124B |
82 |
| chrXp21 | 2.78e-01 | 3.15 | 0.08 | 1.00e+00 | 1.00e+00 | 1IL1RAPL1 |
82 |
| chr10p15 | 2.90e-01 | 3.00 | 0.07 | 1.00e+00 | 1.00e+00 | 1KLF6 |
86 |
| chr14q22 | 3.01e-01 | 2.87 | 0.07 | 1.00e+00 | 1.00e+00 | 1TMEM260 |
90 |
| chr2p16 | 3.64e-01 | 2.26 | 0.06 | 1.00e+00 | 1.00e+00 | 1FBXO11 |
114 |
| chr3q27 | 3.67e-01 | 2.24 | 0.06 | 1.00e+00 | 1.00e+00 | 1IGF2BP2 |
115 |
| chr6q22 | 3.77e-01 | 2.16 | 0.05 | 1.00e+00 | 1.00e+00 | 1ARHGAP18 |
119 |
| chr10q25 | 3.94e-01 | 2.04 | 0.05 | 1.00e+00 | 1.00e+00 | 1SLC18A2 |
126 |
| chr1p22 | 4.01e-01 | 1.99 | 0.05 | 1.00e+00 | 1.00e+00 | 1LMO4 |
129 |
| chr3q21 | 4.22e-01 | 1.86 | 0.05 | 1.00e+00 | 1.00e+00 | 1GATA2 |
138 |
Dowload full table
Transcription Factor Targets:
| P-value | OR | Lower 95% CI | FDR | FWER | Genes Found | Gene Set Size | |
|---|---|---|---|---|---|---|---|
| PXR_Q2 | 4.96e-04 | 6.71 | 2.32 | 5.62e-01 | 5.62e-01 | 6CDK15, LMO4, SLC18A2, RPS6KA5, ARHGAP18, IL1RAPL1 |
260 |
| HOX13_01 | 1.43e-02 | 11.83 | 1.35 | 1.00e+00 | 1.00e+00 | 2LMO4, FBXO11 |
46 |
| HNF6_Q6 | 1.40e-02 | 4.63 | 1.20 | 1.00e+00 | 1.00e+00 | 4LMO4, FAM83F, IL1RAPL1, FBXO11 |
239 |
| YATGNWAAT_OCT_C | 1.34e-02 | 3.84 | 1.18 | 1.00e+00 | 1.00e+00 | 5LMO4, BACE2, SLC24A3, ALDH1A1, IL1RAPL1 |
367 |
| FOXO1_02 | 1.60e-02 | 4.44 | 1.15 | 1.00e+00 | 1.00e+00 | 4LMO4, MOBP, IL1RAPL1, SQSTM1 |
249 |
| TGGAAA_NFAT_Q4_01 | 1.89e-02 | 2.29 | 1.11 | 1.00e+00 | 1.00e+00 | 13IL13, LIF, LMO4, ENPP3, MOBP, RGS1, CD82, ARHGAP18, AMOTL1, ALDH1A1, IL1RAPL1, ISYNA1, FBXO11 |
1934 |
| SRY_02 | 1.82e-02 | 4.26 | 1.11 | 1.00e+00 | 1.00e+00 | 4IL5RA, GATA2, LMO4, MOBP |
259 |
| PBX1_01 | 1.84e-02 | 4.25 | 1.10 | 1.00e+00 | 1.00e+00 | 4LIF, SLC18A2, IL1RAPL1, FBXO11 |
260 |
| ATF_01 | 2.00e-02 | 4.13 | 1.07 | 1.00e+00 | 1.00e+00 | 4LMO4, SLC18A2, AMOTL1, PPP1R15A |
267 |
| NFAT_Q4_01 | 2.00e-02 | 4.13 | 1.07 | 1.00e+00 | 1.00e+00 | 4IL13, AMOTL1, IL1RAPL1, ISYNA1 |
267 |
| AFP1_Q6 | 2.03e-02 | 4.12 | 1.07 | 1.00e+00 | 1.00e+00 | 4LMO4, BACE2, SLC18A2, IL1RAPL1 |
268 |
| HTF_01 | 3.21e-02 | 7.55 | 0.87 | 1.00e+00 | 1.00e+00 | 2RGS1, IL1RAPL1 |
71 |
| TGCTGAY_UNKNOWN | 5.66e-02 | 2.56 | 0.79 | 1.00e+00 | 1.00e+00 | 5CDK15, LMO4, MAOB, FBXO11, PPP1R15A |
547 |
| TFIII_Q6 | 4.73e-02 | 3.91 | 0.77 | 1.00e+00 | 1.00e+00 | 3CDK15, LMO4, RPS6KA5 |
207 |
| FOX_Q2 | 5.07e-02 | 3.80 | 0.75 | 1.00e+00 | 1.00e+00 | 3LMO4, RPS6KA5, FBXO11 |
213 |
| CREB_Q4_01 | 5.30e-02 | 3.73 | 0.74 | 1.00e+00 | 1.00e+00 | 3LMO4, SLC18A2, PPP1R15A |
217 |
| FOXJ2_TARGET_GENES | 7.30e-02 | 2.37 | 0.73 | 1.00e+00 | 1.00e+00 | 5IL5RA, RPS6KA5, ISYNA1, PSTPIP2, PPP1R15A |
591 |
| TFEB_TARGET_GENES | 1.54e-01 | 1.73 | 0.70 | 1.00e+00 | 1.00e+00 | 8CPA3, FAM124B, CNRIP1, CD63, KLF6, TNFAIP3, ALOX5AP, SQSTM1 |
1387 |
| VDR_Q3 | 6.21e-02 | 3.48 | 0.69 | 1.00e+00 | 1.00e+00 | 3LIF, LMO4, JAKMIP3 |
232 |
| OCT1_03 | 6.46e-02 | 3.42 | 0.68 | 1.00e+00 | 1.00e+00 | 3LMO4, IL1RAPL1, FBXO11 |
236 |
Dowload full table
GO Biological Processes:
| P-value | OR | Lower 95% CI | FDR | FWER | Genes Found | Gene Set Size | |
|---|---|---|---|---|---|---|---|
| GOBP_MAST_CELL_PROLIFERATION | 1.54e-04 | 172.68 | 14.09 | 2.31e-01 | 1.00e+00 | 2ENPP3, KIT |
5 |
| GOBP_LIPOXYGENASE_PATHWAY | 3.20e-05 | 61.17 | 10.83 | 1.29e-01 | 2.40e-01 | 3HPGD, ALOX5AP, PON2 |
16 |
| GOBP_LIPOXIN_METABOLIC_PROCESS | 4.28e-04 | 86.37 | 8.33 | 4.01e-01 | 1.00e+00 | 2HPGD, ALOX5AP |
8 |
| GOBP_MAST_CELL_ACTIVATION_INVOLVED_IN_IMMUNE_RESPONSE | 3.46e-05 | 25.26 | 6.32 | 1.29e-01 | 2.58e-01 | 4IL13, GATA2, ENPP3, KIT |
47 |
| GOBP_REGULATION_OF_MAST_CELL_ACTIVATION_INVOLVED_IN_IMMUNE_RESPONSE | 2.22e-04 | 29.50 | 5.54 | 2.77e-01 | 1.00e+00 | 3IL13, GATA2, ENPP3 |
30 |
| GOBP_VENTRAL_SPINAL_CORD_INTERNEURON_DIFFERENTIATION | 1.18e-03 | 47.19 | 4.96 | 6.18e-01 | 1.00e+00 | 2GATA2, LMO4 |
13 |
| GOBP_POSITIVE_REGULATION_OF_MAST_CELL_ACTIVATION_INVOLVED_IN_IMMUNE_RESPONSE | 1.18e-03 | 47.19 | 4.96 | 6.18e-01 | 1.00e+00 | 2IL13, GATA2 |
13 |
| GOBP_MAST_CELL_ACTIVATION | 9.06e-05 | 19.39 | 4.91 | 2.22e-01 | 6.78e-01 | 4IL13, GATA2, ENPP3, KIT |
60 |
| GOBP_NEGATIVE_REGULATION_OF_ENDOTHELIAL_CELL_APOPTOTIC_PROCESS | 3.24e-04 | 25.71 | 4.86 | 3.46e-01 | 1.00e+00 | 3IL13, GATA2, TNFAIP3 |
34 |
| GOBP_REGULATION_OF_MAST_CELL_ACTIVATION | 5.65e-04 | 20.97 | 4.00 | 4.70e-01 | 1.00e+00 | 3IL13, GATA2, ENPP3 |
41 |
| GOBP_ICOSANOID_METABOLIC_PROCESS | 1.19e-04 | 11.77 | 3.58 | 2.22e-01 | 8.88e-01 | 5HPGDS, HPGD, ANXA1, ALOX5AP, PON2 |
123 |
| GOBP_PROSTANOID_METABOLIC_PROCESS | 8.97e-04 | 17.71 | 3.40 | 6.18e-01 | 1.00e+00 | 3HPGDS, HPGD, ANXA1 |
48 |
| GOBP_POSITIVE_REGULATION_OF_MAST_CELL_ACTIVATION | 2.54e-03 | 30.58 | 3.34 | 8.03e-01 | 1.00e+00 | 2IL13, GATA2 |
19 |
| GOBP_NEGATIVE_REGULATION_OF_EPITHELIAL_CELL_APOPTOTIC_PROCESS | 1.01e-03 | 16.95 | 3.26 | 6.18e-01 | 1.00e+00 | 3IL13, GATA2, TNFAIP3 |
50 |
| GOBP_SEROTONIN_TRANSPORT | 2.81e-03 | 28.89 | 3.17 | 8.03e-01 | 1.00e+00 | 2MAOB, SLC18A2 |
20 |
| GOBP_VASCULAR_WOUND_HEALING | 3.10e-03 | 27.37 | 3.01 | 8.03e-01 | 1.00e+00 | 2GATA2, TNFAIP3 |
21 |
| GOBP_ICOSANOID_BIOSYNTHETIC_PROCESS | 1.40e-03 | 15.04 | 2.91 | 6.18e-01 | 1.00e+00 | 3HPGDS, ANXA1, ALOX5AP |
56 |
| GOBP_REGULATION_OF_MACROPHAGE_DIFFERENTIATION | 3.40e-03 | 26.01 | 2.87 | 8.18e-01 | 1.00e+00 | 2GATA2, LIF |
22 |
| GOBP_EMBRYONIC_HEMOPOIESIS | 3.72e-03 | 24.78 | 2.74 | 8.18e-01 | 1.00e+00 | 2GATA2, KIT |
23 |
| GOBP_POSITIVE_REGULATION_OF_LEUKOCYTE_DEGRANULATION | 3.72e-03 | 24.78 | 2.74 | 8.18e-01 | 1.00e+00 | 2IL13, GATA2 |
23 |
Dowload full table
Immunological Gene Sets:
| P-value | OR | Lower 95% CI | FDR | FWER | Genes Found | Gene Set Size | |
|---|---|---|---|---|---|---|---|
| GSE24671_CTRL_VS_BAKIMULC_INFECTED_MOUSE_SPLENOCYTES_DN | 4.15e-06 | 12.48 | 4.67 | 2.02e-02 | 2.02e-02 | 7CPA3, CXCL3, SLC18A2, KLF6, TNFAIP3, SAMSN1, PPP1R15A |
170 |
| GSE3982_BASOPHIL_VS_CENT_MEMORY_CD4_TCELL_UP | 1.19e-05 | 10.54 | 3.95 | 2.89e-02 | 5.79e-02 | 7FAM124B, BACE2, KIT, GALC, ANXA1, PSTPIP2, SQSTM1 |
200 |
| GSE25085_FETAL_BM_VS_ADULT_BM_SP4_THYMIC_IMPLANT_DN | 1.20e-04 | 8.83 | 3.04 | 1.00e-01 | 5.86e-01 | 6CXCL3, IGF2BP2, CD82, KLF6, TNFAIP3, PSTPIP2 |
199 |
| GSE14769_UNSTIM_VS_40MIN_LPS_BMDM_DN | 1.24e-04 | 8.78 | 3.02 | 1.00e-01 | 6.03e-01 | 6CXCL3, RGS1, KLF6, TNFAIP3, SQSTM1, PPP1R15A |
200 |
| GSE7852_TREG_VS_TCONV_FAT_UP | 1.24e-04 | 8.78 | 3.02 | 1.00e-01 | 6.03e-01 | 6HPGD, BACE2, GALC, ANXA1, SAMSN1, SQSTM1 |
200 |
| GSE32986_CURDLAN_HIGHDOSE_VS_GMCSF_AND_CURDLAN_HIGHDOSE_STIM_DC_DN | 1.24e-04 | 8.78 | 3.02 | 1.00e-01 | 6.03e-01 | 6LMO4, CXCL3, TNFAIP3, PSTPIP2, SAMSN1, PPP1R15A |
200 |
| GSE27241_CTRL_VS_DIGOXIN_TREATED_CD4_TCELL_IN_TH17_POLARIZING_CONDITIONS_UP | 4.22e-04 | 8.84 | 2.70 | 1.64e-01 | 1.00e+00 | 5IL13, FAM124B, TNFAIP3, SAMSN1, PPP1R15A |
162 |
| GSE6259_33D1_POS_DC_VS_CD4_TCELL_DN | 6.12e-04 | 8.12 | 2.49 | 1.64e-01 | 1.00e+00 | 5HPGDS, HPGD, FAM83F, GALC, TNFAIP3 |
176 |
| GSE37301_HEMATOPOIETIC_STEM_CELL_VS_GRAN_MONO_PROGENITOR_DN | 6.12e-04 | 8.12 | 2.49 | 1.64e-01 | 1.00e+00 | 5KIT, KLF6, RPS6KA5, GALC, SQSTM1 |
176 |
| GSE37301_MULTIPOTENT_PROGENITOR_VS_LYMPHOID_PRIMED_MPP_DN | 6.94e-04 | 7.89 | 2.42 | 1.64e-01 | 1.00e+00 | 5IL13, LIF, RPS6KA5, ANXA1, SAMSN1 |
181 |
| GSE2706_R848_VS_R848_AND_LPS_2H_STIM_DC_DN | 8.61e-04 | 7.51 | 2.30 | 1.64e-01 | 1.00e+00 | 5CXCL3, KLF6, TNFAIP3, AMOTL1, PPP1R15A |
190 |
| GSE46606_UNSTIM_VS_CD40L_IL2_IL5_DAY3_STIMULATED_BCELL_UP | 9.66e-04 | 7.31 | 2.24 | 1.64e-01 | 1.00e+00 | 5LMO4, ENPP3, LAX1, GALC, SLC24A3 |
195 |
| GSE2706_2H_VS_8H_LPS_STIM_DC_UP | 9.88e-04 | 7.27 | 2.23 | 1.64e-01 | 1.00e+00 | 5LIF, SLC18A2, GALC, PPP1R15A, PON2 |
196 |
| GSE24026_PD1_LIGATION_VS_CTRL_IN_ACT_TCELL_LINE_UP | 1.01e-03 | 7.23 | 2.22 | 1.64e-01 | 1.00e+00 | 5CD63, SLC18A2, LAX1, ANXA1, ALOX5AP |
197 |
| GSE26290_CTRL_VS_AKT_INHIBITOR_TREATED_ANTI_CD3_AND_IL2_STIM_CD8_TCELL_DN | 1.01e-03 | 7.23 | 2.22 | 1.64e-01 | 1.00e+00 | 5LIF, CD82, RPS6KA5, PSTPIP2, SAMSN1 |
197 |
| GSE28408_LY6G_POS_VS_NEG_DC_UP | 1.01e-03 | 7.23 | 2.22 | 1.64e-01 | 1.00e+00 | 5RGS1, RPS6KA5, LAX1, TNFAIP3, PSTPIP2 |
197 |
| GSE17721_0.5H_VS_12H_LPS_BMDC_DN | 1.06e-03 | 7.16 | 2.19 | 1.64e-01 | 1.00e+00 | 5ENPP3, ANXA1, SAMSN1, FBXO11, SQSTM1 |
199 |
| GSE8621_UNSTIM_VS_LPS_PRIMED_AND_LPS_STIM_MACROPHAGE_UP | 1.06e-03 | 7.16 | 2.19 | 1.64e-01 | 1.00e+00 | 5CPA3, SLC18A2, KLF6, TNFAIP3, ALDH1A1 |
199 |
| GSE16385_ROSIGLITAZONE_IL4_VS_IL4_ALONE_STIM_MACROPHAGE_12H_DN | 1.06e-03 | 7.16 | 2.19 | 1.64e-01 | 1.00e+00 | 5HPGDS, IGF2BP2, ANXA1, ISYNA1, SAMSN1 |
199 |
| GSE41176_UNSTIM_VS_ANTI_IGM_STIM_TAK1_KO_BCELL_24H_DN | 1.06e-03 | 7.16 | 2.19 | 1.64e-01 | 1.00e+00 | 5CD82, TNFAIP3, SLC24A3, PSTPIP2, SAMSN1 |
199 |
Top Ranked Transcription Factors for this Gene Expression Program:
| Gene Symbol | TF Rank | DNA Binding Domain | Motif Status | IUPAC PWM | GTEx | DepMap | Decartes |
|---|---|---|---|---|---|---|---|
| GATA2 | 9 | Yes | Known motif | Monomer or homomultimer | High-throughput in vitro | None | None |
| LMO4 | 11 | No | Unlikely to be sequence specific TF | Not a DNA binding protein | No motif | None | None |
| KIT | 19 | No | Unlikely to be sequence specific TF | Not a DNA binding protein | No motif | None | None |
| KLF6 | 28 | Yes | Known motif | Monomer or homomultimer | High-throughput in vitro | None | None |
| RPS6KA5 | 29 | No | Unlikely to be sequence specific TF | Not a DNA binding protein | No motif | None | No DBD - its a kinase. Included only because GO says its an upstream regulator of CREB and NF-kappaB |
| TNFAIP3 | 34 | No | Unlikely to be sequence specific TF | Not a DNA binding protein | No motif | None | Inhibits NFKB-activation. No evidence for direct binding to DNA |
| NFKBIZ | 56 | No | Unlikely to be sequence specific TF | Not a DNA binding protein | No motif | None | None |
| TSC22D1 | 60 | Yes | Likely to be sequence specific TF | Monomer or homomultimer | No motif | None | TSC22D1 appears to homo- and heterodimerize with other TFs to affect transcription (PMID: 10488076). In vitro, it has been shown to bind GC-rich DNA sequences (PMID: 9022669) |
| JUN | 64 | Yes | Known motif | Monomer or homomultimer | High-throughput in vitro | None | None |
| NR4A1 | 65 | Yes | Known motif | Monomer or homomultimer | High-throughput in vitro | None | None |
| BHLHE40 | 75 | Yes | Known motif | Monomer or homomultimer | High-throughput in vitro | None | None |
| POLA1 | 81 | No | Unlikely to be sequence specific TF | Low specificity DNA-binding protein | No motif | None | Binds DNA in the crystal structure (PDB: 4Q5V) |
| PBX1 | 82 | Yes | Known motif | Monomer or homomultimer | High-throughput in vitro | None | None |
| LARP1B | 91 | No | ssDNA/RNA binding | Not a DNA binding protein | No motif | None | None |
| FANK1 | 93 | No | Unlikely to be sequence specific TF | Not a DNA binding protein | No motif | None | Binds JUN to control its activity (PMID: 20978819), but there is no evidence that it binds DNA itself |
| TBX1 | 98 | Yes | Known motif | Monomer or homomultimer | High-throughput in vitro | None | None |
| KLF10 | 102 | Yes | Known motif | Monomer or homomultimer | High-throughput in vitro | None | None |
| CHD4 | 103 | No | Unlikely to be sequence specific TF | Low specificity DNA-binding protein | No motif | None | CHD4 is likely not a sequence-specific DNA-binding protein despite having a partial match to an HMG box. This protein binds to the DNA backbone, but binds poly(ADP-ribose) with higher affinity (PMID: 26565020). |
| NFKB1 | 115 | Yes | Known motif | Monomer or homomultimer | High-throughput in vitro | None | None |
| TCEAL8 | 119 | No | Unlikely to be sequence specific TF | Not a DNA binding protein | No motif | None | Lacks a canonical DBD |
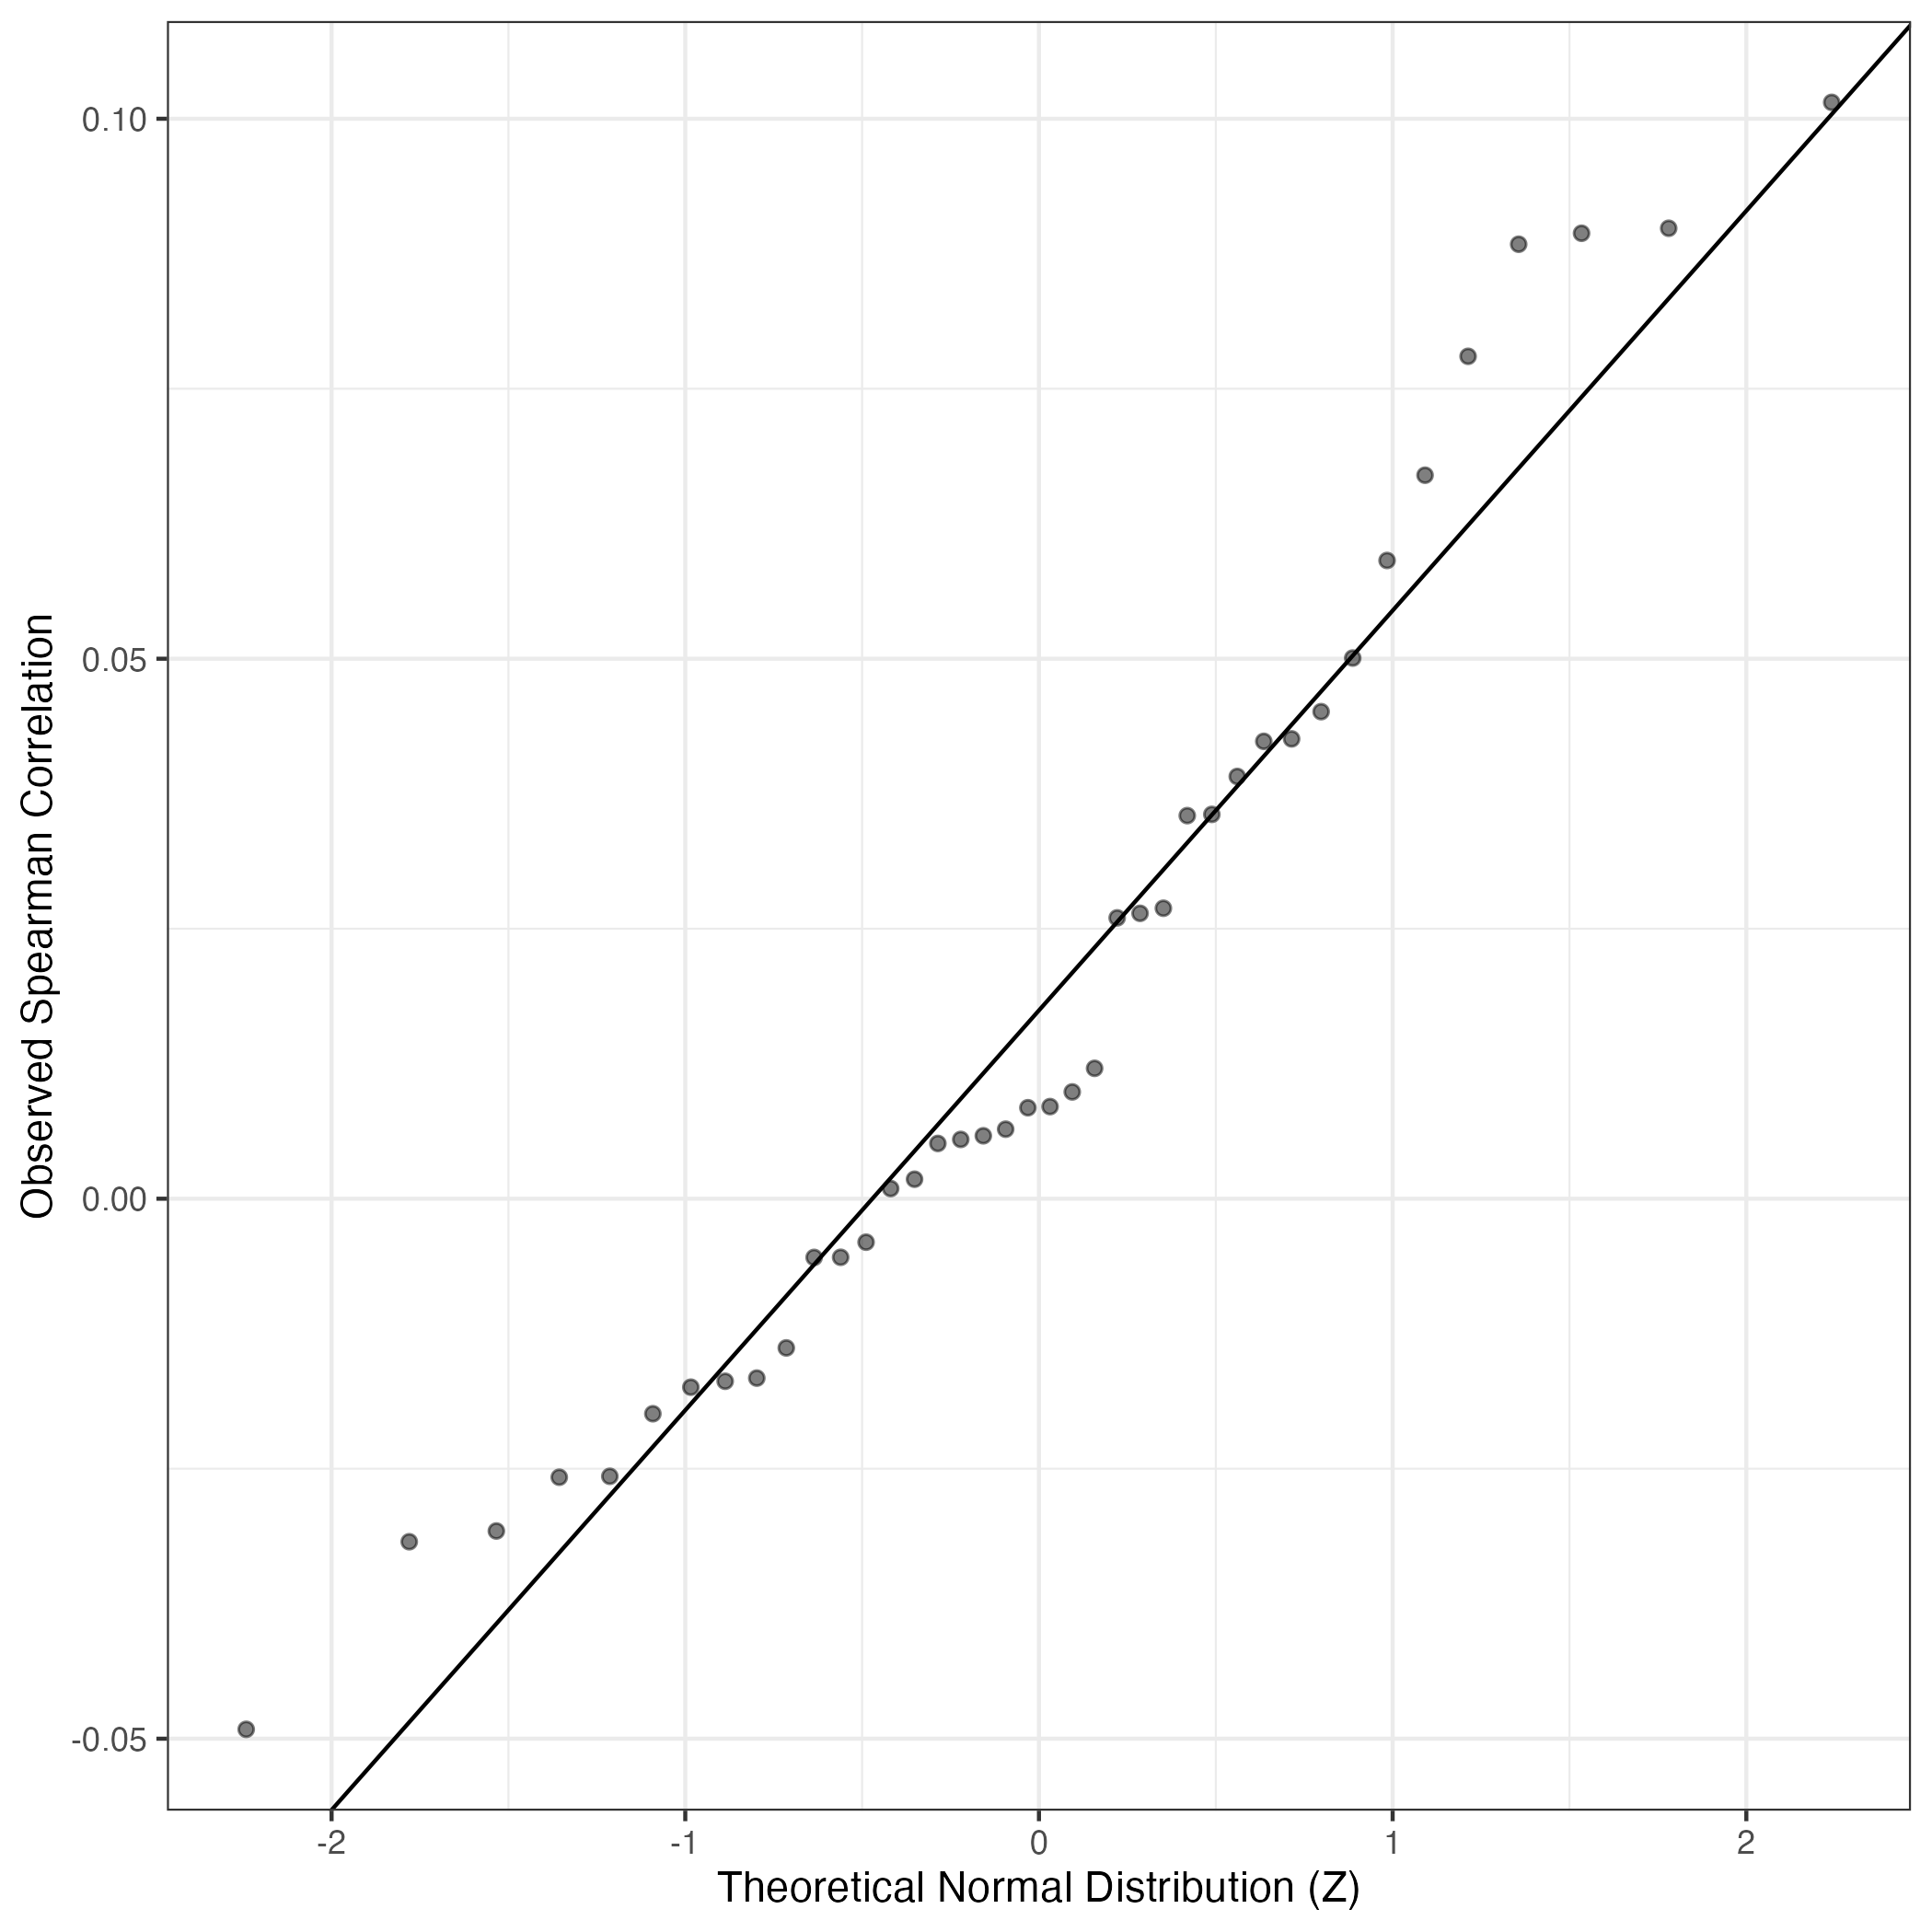
QQ Plot showing correlations with other GEPs in this dataset, calculated by Spearman correlation:
Interactive QQ-plot of gene loadings:
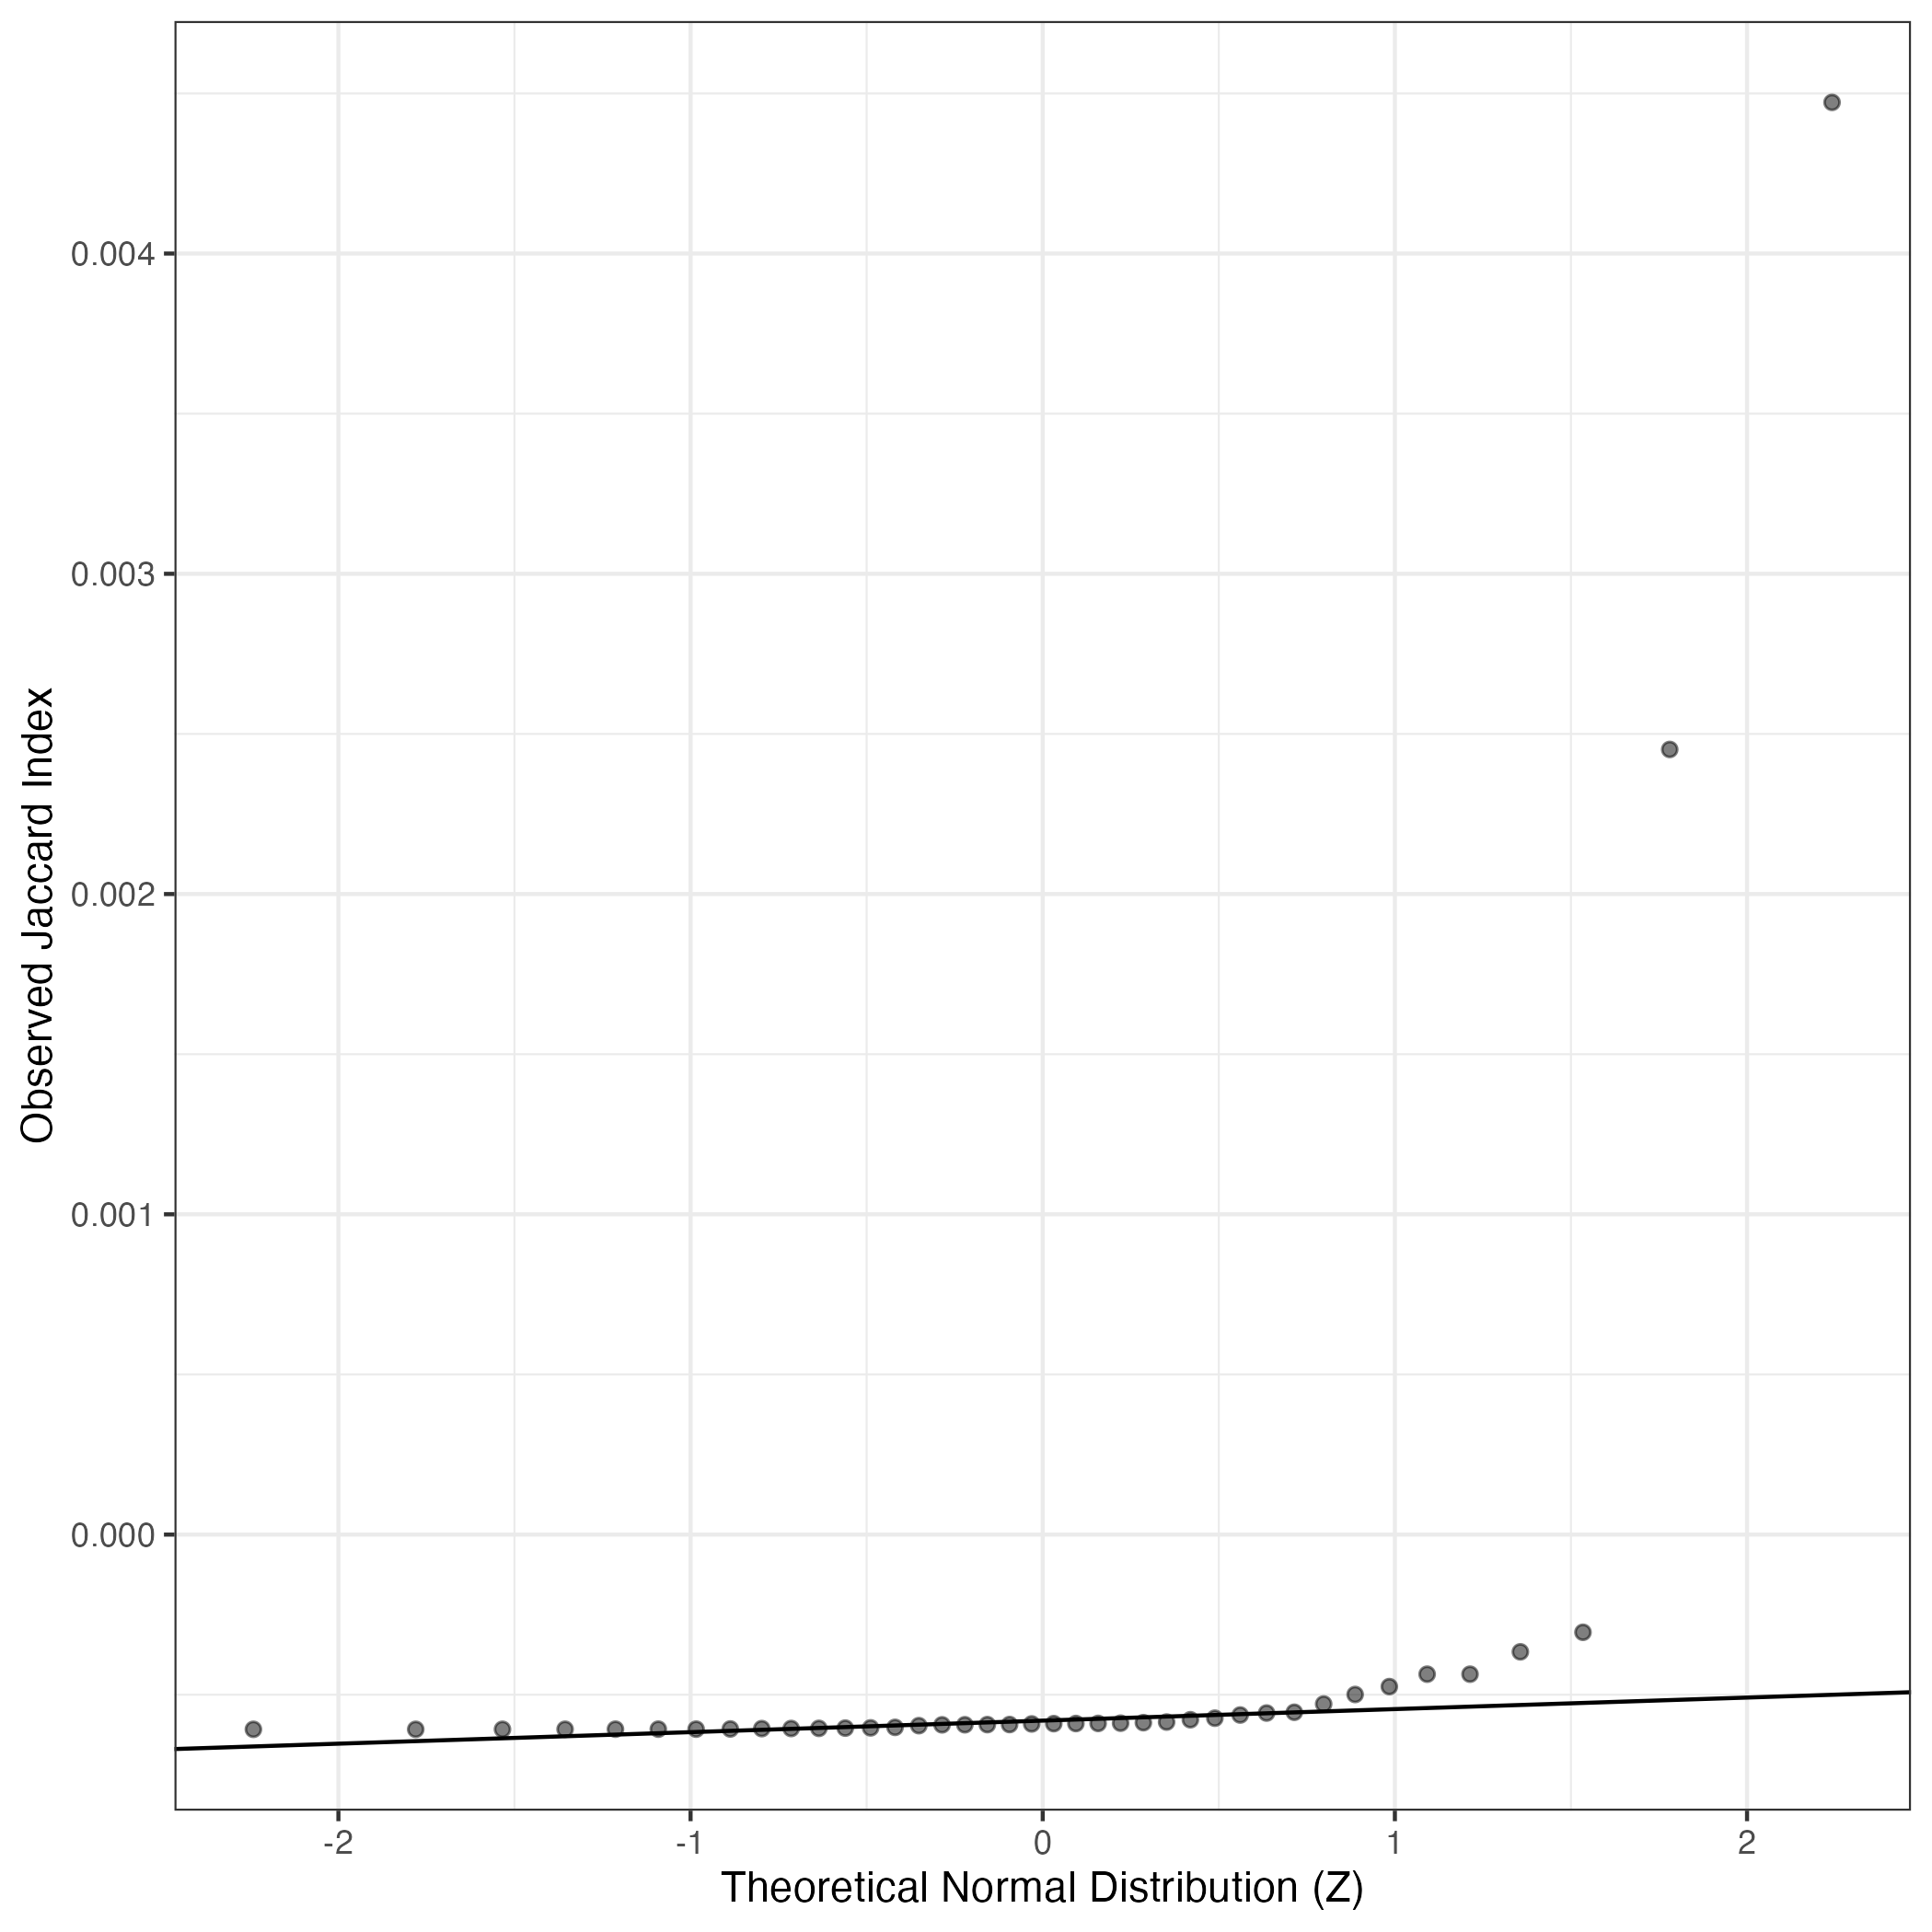
A similar QQ-plot as above, but only for instances where the H value is e.g. > 25, i.e. we are confident that the expression program is active above noise. Agreemenet between these binary vectors is tested using the Jaccard Index, with the P-values calculated by an exact test:
Interactive QQ-plot:
Singler cell type annotations for the top 50 cells on this program.
## Error in 1:nrow(topCellsAnnotMat): argument of length 0
| Cell ID | Singler label | Singler Delta | Activity Score | Top Singler Raw Scores |
|---|---|---|---|---|
| STDY7685342_CGGACACCACCTATCC | CMP | 0.08 | 883.25 | Raw Scores |
Below shows the significant enrichments of this GEP for literature curated gene lists
This data was procured from existing single cell RNA-seq maps of neuroblastoma or related relevant data.
High ranks indicate this gene is a driver of this GEP.
These curated gene list are ranked by the P-value (on this GEP) of their constituent genes.
The Mean Count column shows the mean read count in cells scoring highly (H > 50) on this gene expression program.
Stress response (Dong)
Markers obtained in computationally inferred meta program (by NMF applied to their neuroblastoma sc-RNA-seq data) from Fig. 5(a) of Dong et al. (PMID 32946775).:
Wilcoxon ranksum test P-value for gene set overrepresentation: 1.92e-03
Mean rank of genes in gene set: 229.33
Rank on gene expression program of genes in gene set:
## Error in data.frame(Genes = geneCardsLinkSmallGsets, Weight = theseGenes, : object 'countHighScoringCells' not found