Program: 7. Hepatocyte-like Cells.
Program description and justification of annotation generated by GPT5: Hepatocytes/Liver parenchyma with acute-phase complement-coagulation and xenobiotic metabolism (non-malignant liver tissue admixture).
Submit a comment on this gene expression program's interpretation: CLICK
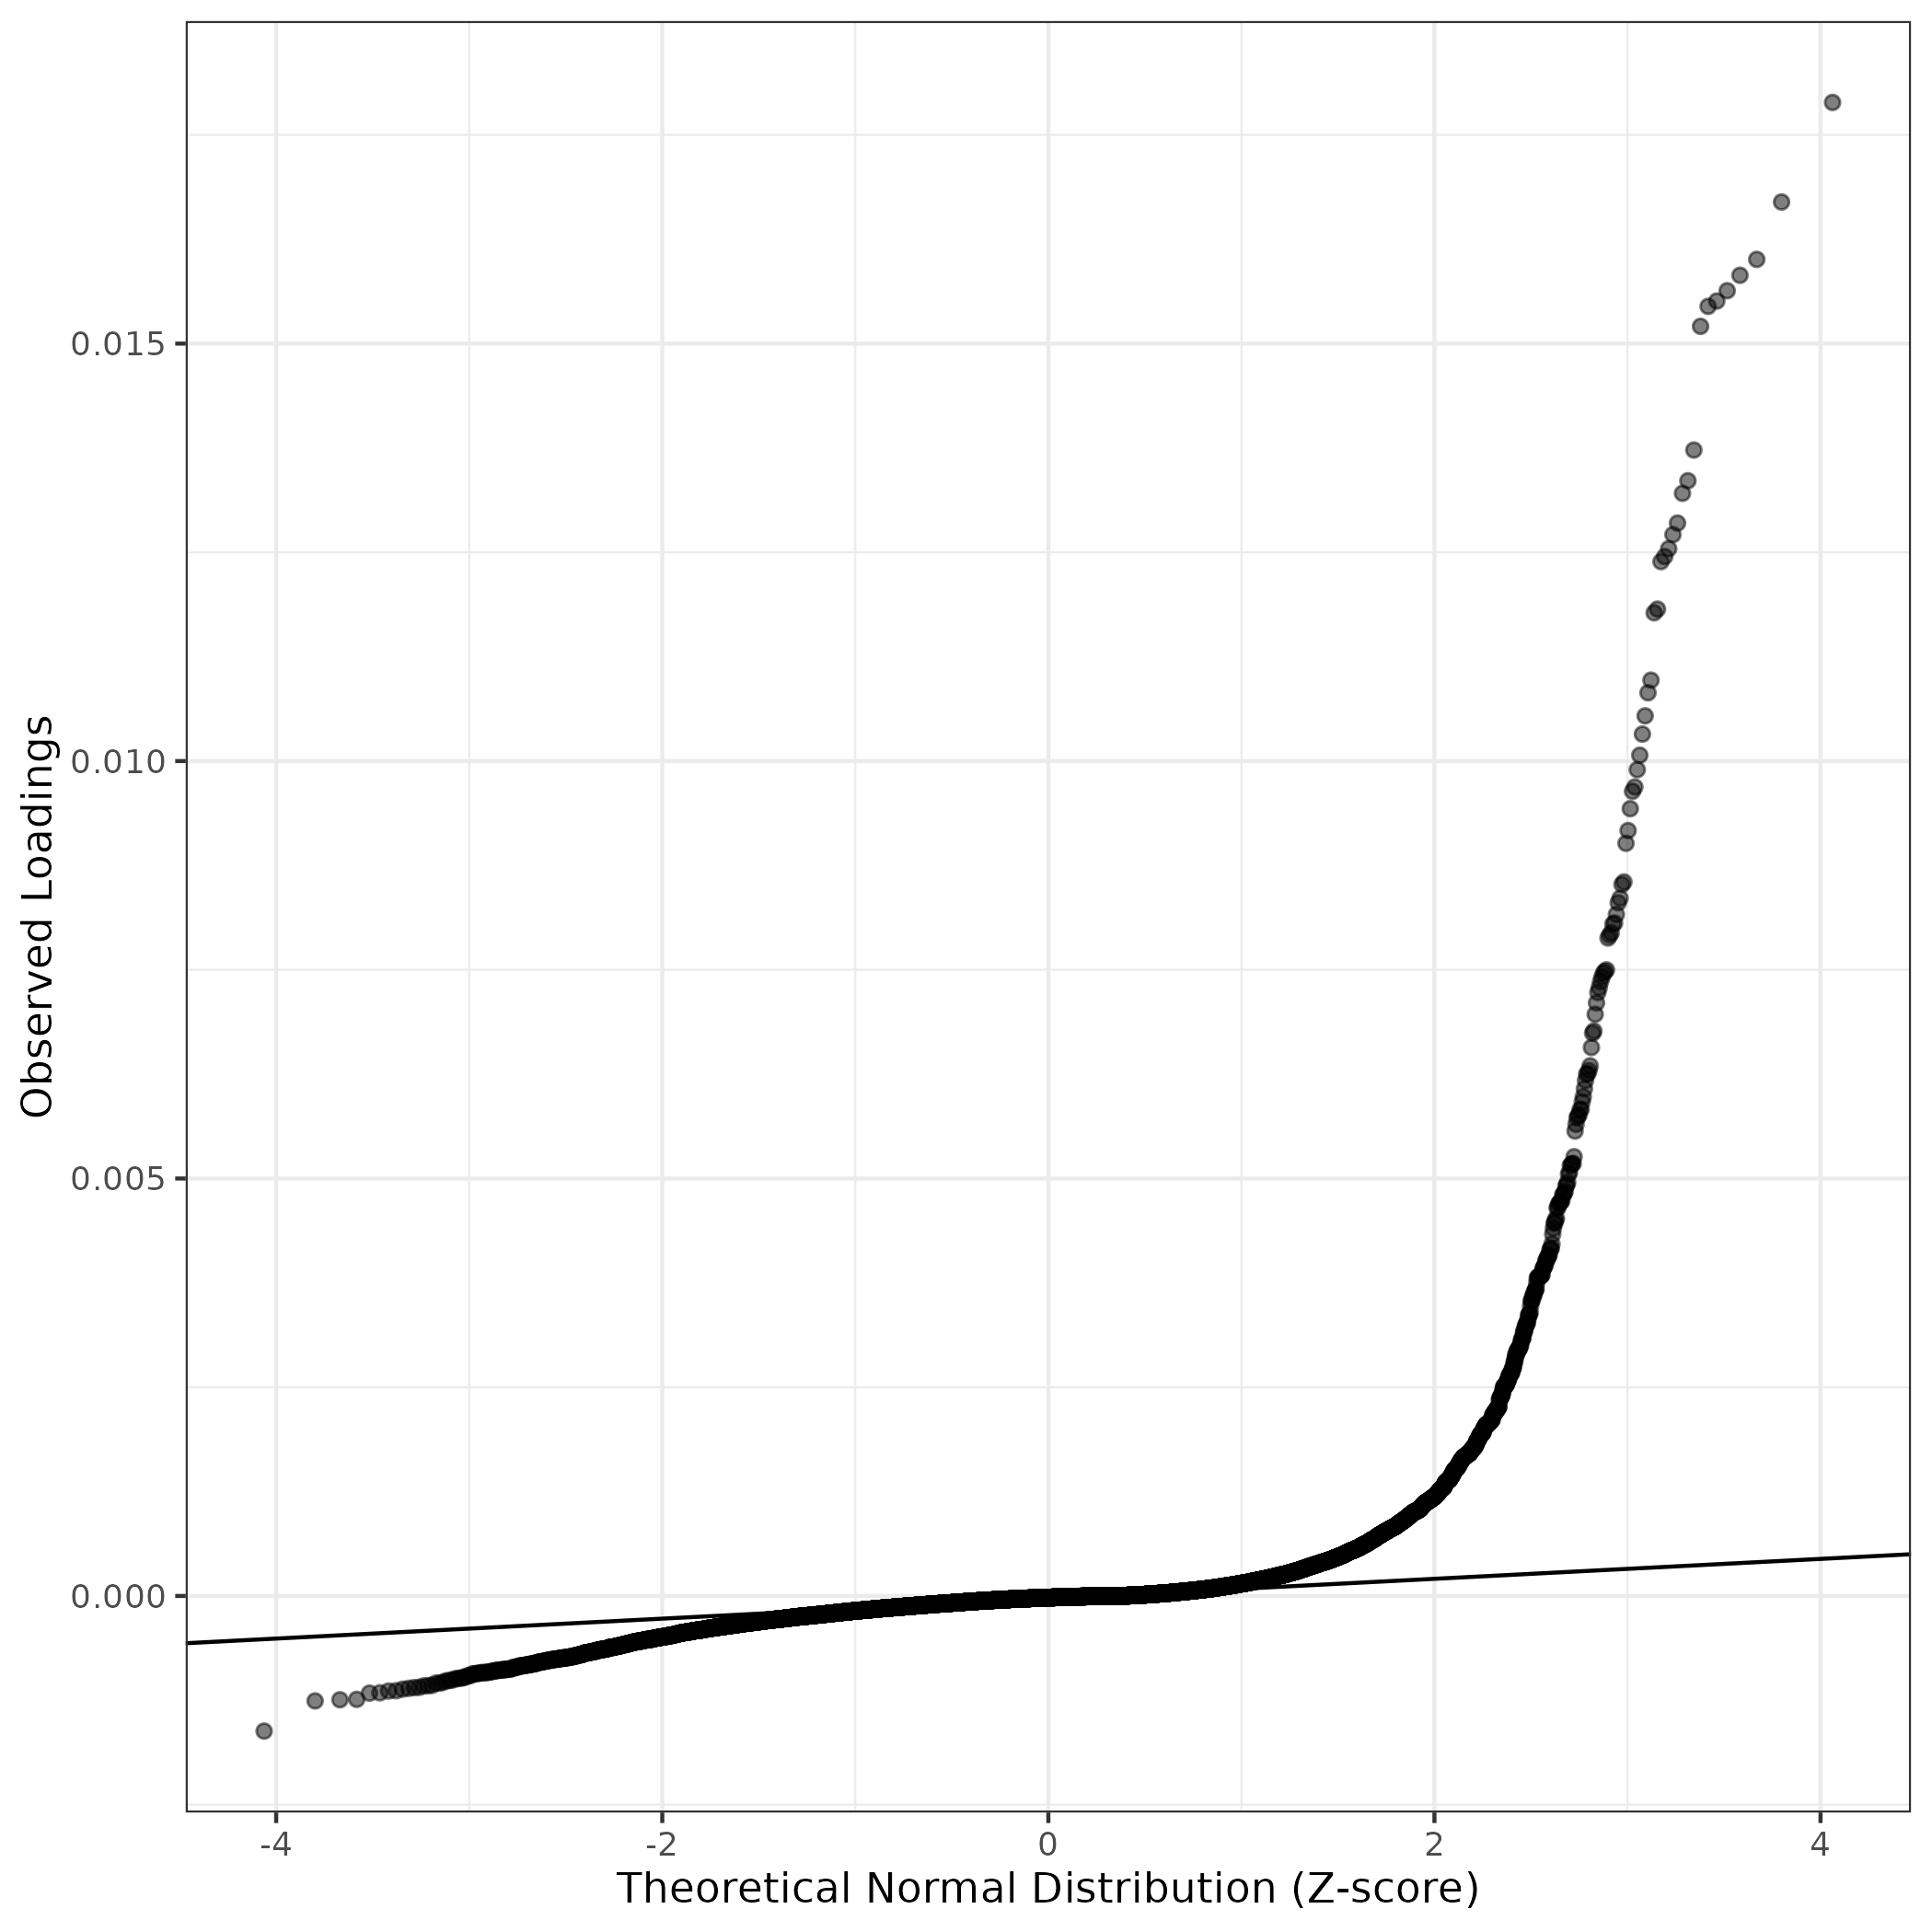
QQ-plot of gene loadings, averaged over both independent splits of the data
This plot highlights the relative contribution of each gene to the GEP
Top genes driving this program.
Note: Decartes website is buggy, try refreshing. Also, Decartes fetal adrenal data have been collected at specific time points (89-122 days), all possible cell types of interest may not be represented, do not overinterpret.
The Mean Count column shows the mean read count in cells scoring highly (H > 50) on this gene expression program.
| Gene | Loading | Gene.Name | GTEx | DepMap | Descartes | Mean.Counts | Mean.Tpm | |
|---|---|---|---|---|---|---|---|---|
| 1 | TTR | 0.0178884 | transthyretin | GTEx | DepMap | Descartes | 2.23 | 1552.58 |
| 2 | APOC3 | 0.0166959 | apolipoprotein C3 | GTEx | DepMap | Descartes | 6.56 | 8028.29 |
| 3 | APOA2 | 0.0160086 | apolipoprotein A2 | GTEx | DepMap | Descartes | 6.86 | 5323.87 |
| 4 | APOA1 | 0.0158184 | apolipoprotein A1 | GTEx | DepMap | Descartes | 9.94 | 6362.97 |
| 5 | ALB | 0.0156337 | albumin | GTEx | DepMap | Descartes | 65.43 | 22211.27 |
| 6 | APOC1 | 0.0155098 | apolipoprotein C1 | GTEx | DepMap | Descartes | 6.17 | 6328.76 |
| 7 | AMBP | 0.0154460 | alpha-1-microglobulin/bikunin precursor | GTEx | DepMap | Descartes | 3.09 | 1706.35 |
| 8 | RBP4 | 0.0152068 | retinol binding protein 4 | GTEx | DepMap | Descartes | 3.19 | 1652.31 |
| 9 | ORM1 | 0.0137252 | orosomucoid 1 | GTEx | DepMap | Descartes | 0.97 | 833.89 |
| 10 | TF | 0.0133573 | transferrin | GTEx | DepMap | Descartes | 5.13 | 181.22 |
| 11 | MT1G | 0.0132070 | metallothionein 1G | GTEx | DepMap | Descartes | 1.72 | 1933.33 |
| 12 | ORM2 | 0.0128501 | orosomucoid 2 | GTEx | DepMap | Descartes | 0.56 | 508.66 |
| 13 | FABP1 | 0.0127124 | fatty acid binding protein 1 | GTEx | DepMap | Descartes | 2.01 | 693.92 |
| 14 | SERPINC1 | 0.0125430 | serpin family C member 1 | GTEx | DepMap | Descartes | 0.87 | 424.55 |
| 15 | SERPINA1 | 0.0124490 | serpin family A member 1 | GTEx | DepMap | Descartes | 9.24 | 1689.58 |
| 16 | APOH | 0.0123889 | apolipoprotein H | GTEx | DepMap | Descartes | 2.74 | 1589.06 |
| 17 | HP | 0.0118195 | haptoglobin | GTEx | DepMap | Descartes | 2.60 | 575.11 |
| 18 | HRG | 0.0117758 | histidine rich glycoprotein | GTEx | DepMap | Descartes | 1.58 | 261.88 |
| 19 | GC | 0.0109686 | GC vitamin D binding protein | GTEx | DepMap | Descartes | 1.32 | 554.33 |
| 20 | ALDOB | 0.0108179 | aldolase, fructose-bisphosphate B | GTEx | DepMap | Descartes | 2.71 | 744.29 |
| 21 | APOB | 0.0105415 | apolipoprotein B | GTEx | DepMap | Descartes | 8.78 | 357.33 |
| 22 | AHSG | 0.0103227 | alpha 2-HS glycoprotein | GTEx | DepMap | Descartes | 5.64 | 2000.95 |
| 23 | FGA | 0.0100699 | fibrinogen alpha chain | GTEx | DepMap | Descartes | 8.10 | 1260.14 |
| 24 | CES1 | 0.0098968 | carboxylesterase 1 | GTEx | DepMap | Descartes | 0.86 | 290.11 |
| 25 | MT1E | 0.0096892 | metallothionein 1E | GTEx | DepMap | Descartes | 1.95 | 1572.31 |
| 26 | KNG1 | 0.0096380 | kininogen 1 | GTEx | DepMap | Descartes | 1.58 | 261.20 |
| 27 | A1BG | 0.0094293 | alpha-1-B glycoprotein | GTEx | DepMap | Descartes | 1.74 | 335.32 |
| 28 | IGFBP1 | 0.0091676 | insulin like growth factor binding protein 1 | GTEx | DepMap | Descartes | 5.92 | 2044.25 |
| 29 | AGT | 0.0090146 | angiotensinogen | GTEx | DepMap | Descartes | 1.37 | 437.06 |
| 30 | ADH1B | 0.0085518 | alcohol dehydrogenase 1B (class I), beta polypeptide | GTEx | DepMap | Descartes | 3.42 | 376.23 |
| 31 | MT2A | 0.0085217 | metallothionein 2A | GTEx | DepMap | Descartes | 10.62 | 6102.94 |
| 32 | FGB | 0.0083576 | fibrinogen beta chain | GTEx | DepMap | Descartes | 10.38 | 2714.10 |
| 33 | MT1H | 0.0083026 | metallothionein 1H | GTEx | DepMap | Descartes | 0.67 | 569.26 |
| 34 | CYP2E1 | 0.0081639 | cytochrome P450 family 2 subfamily E member 1 | GTEx | DepMap | Descartes | 3.32 | 251.93 |
| 35 | VTN | 0.0080599 | vitronectin | GTEx | DepMap | Descartes | 0.46 | 197.98 |
| 36 | TAT | 0.0080485 | tyrosine aminotransferase | GTEx | DepMap | Descartes | 0.70 | 118.78 |
| 37 | HPX | 0.0079439 | hemopexin | GTEx | DepMap | Descartes | 1.46 | 532.67 |
| 38 | PLG | 0.0079146 | plasminogen | GTEx | DepMap | Descartes | 2.19 | 446.13 |
| 39 | HAMP | 0.0078801 | hepcidin antimicrobial peptide | GTEx | DepMap | Descartes | 0.85 | 197.20 |
| 40 | ADH1A | 0.0074989 | alcohol dehydrogenase 1A (class I), alpha polypeptide | GTEx | DepMap | Descartes | 0.59 | 304.00 |
| 41 | AGXT | 0.0074805 | alanine–glyoxylate aminotransferase | GTEx | DepMap | Descartes | 1.42 | 268.49 |
| 42 | ITIH1 | 0.0074593 | inter-alpha-trypsin inhibitor heavy chain 1 | GTEx | DepMap | Descartes | 0.66 | 137.49 |
| 43 | SPP2 | 0.0074142 | secreted phosphoprotein 2 | GTEx | DepMap | Descartes | 1.45 | 812.62 |
| 44 | CFHR2 | 0.0073599 | complement factor H related 2 | GTEx | DepMap | Descartes | 0.60 | 293.10 |
| 45 | ITIH2 | 0.0072864 | inter-alpha-trypsin inhibitor heavy chain 2 | GTEx | DepMap | Descartes | 0.85 | 196.69 |
| 46 | APCS | 0.0072276 | amyloid P component, serum | GTEx | DepMap | Descartes | 0.87 | 595.29 |
| 47 | ISG15 | 0.0071035 | ISG15 ubiquitin like modifier | GTEx | DepMap | Descartes | 0.75 | 698.87 |
| 48 | ANGPTL3 | 0.0069669 | angiopoietin like 3 | GTEx | DepMap | Descartes | 0.92 | 176.41 |
| 49 | AZGP1 | 0.0067667 | alpha-2-glycoprotein 1, zinc-binding | GTEx | DepMap | Descartes | 1.23 | 338.46 |
| 50 | MT1M | 0.0067411 | metallothionein 1M | GTEx | DepMap | Descartes | 0.32 | 500.73 |
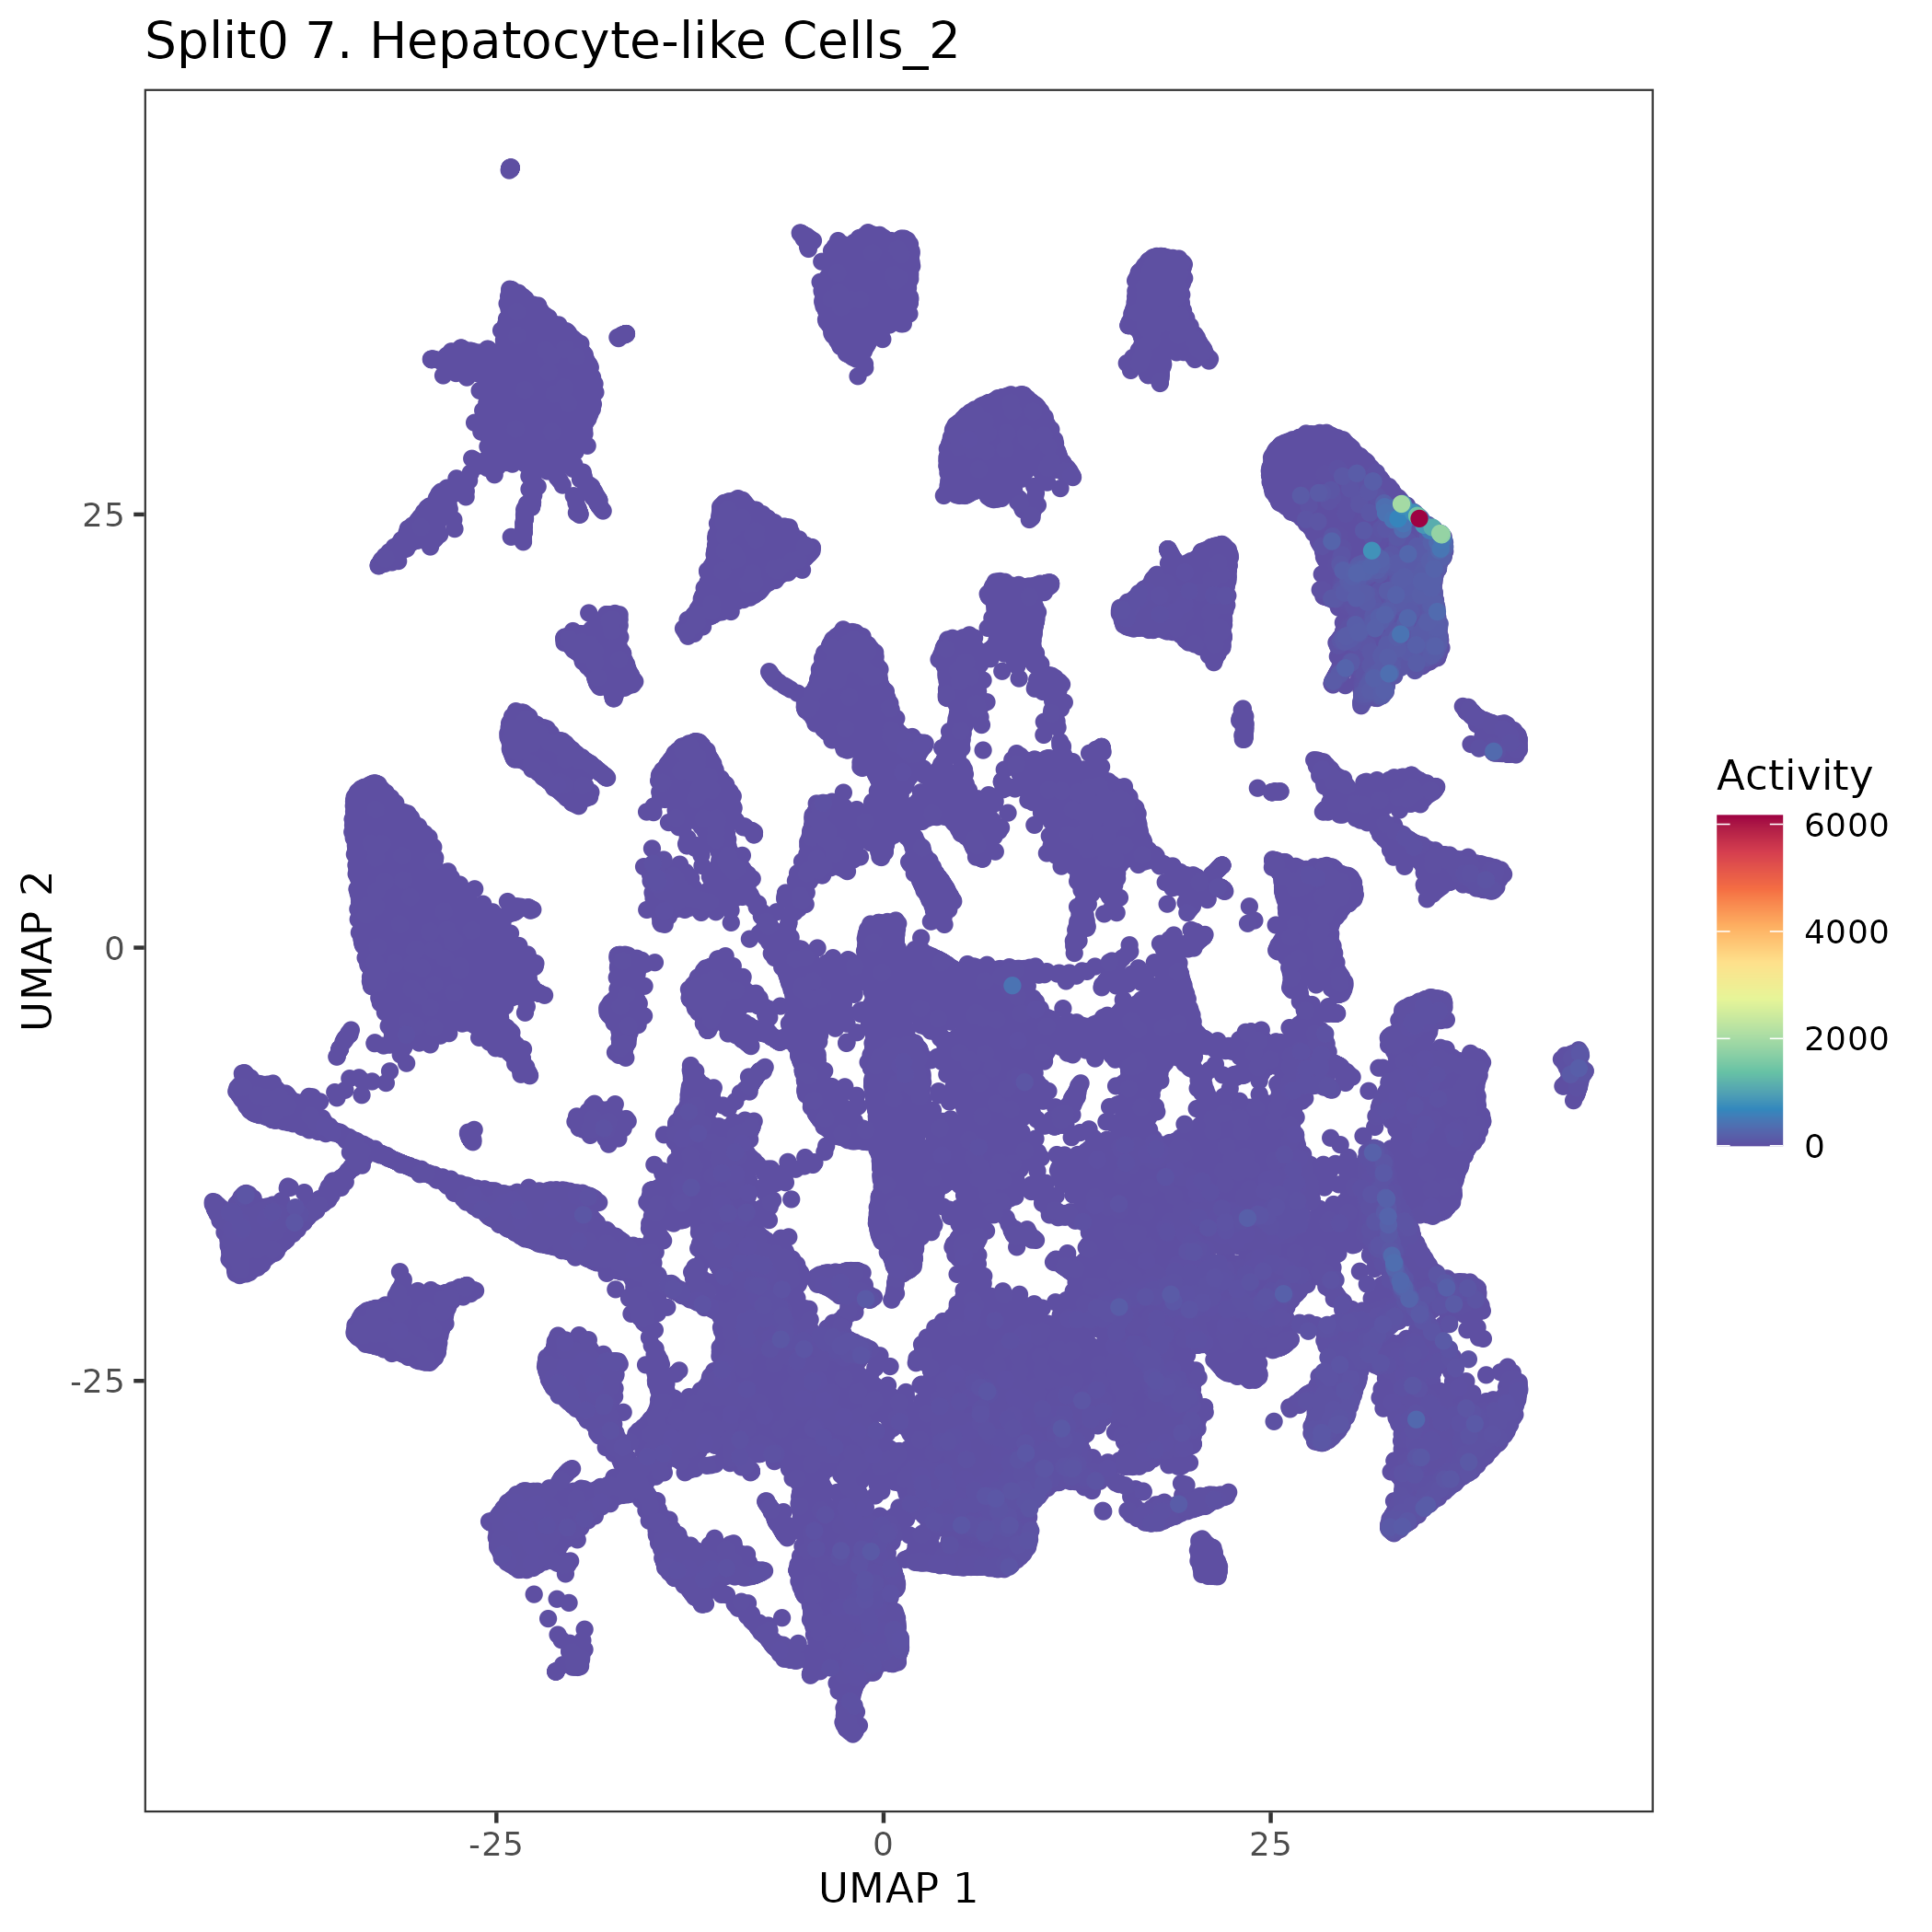
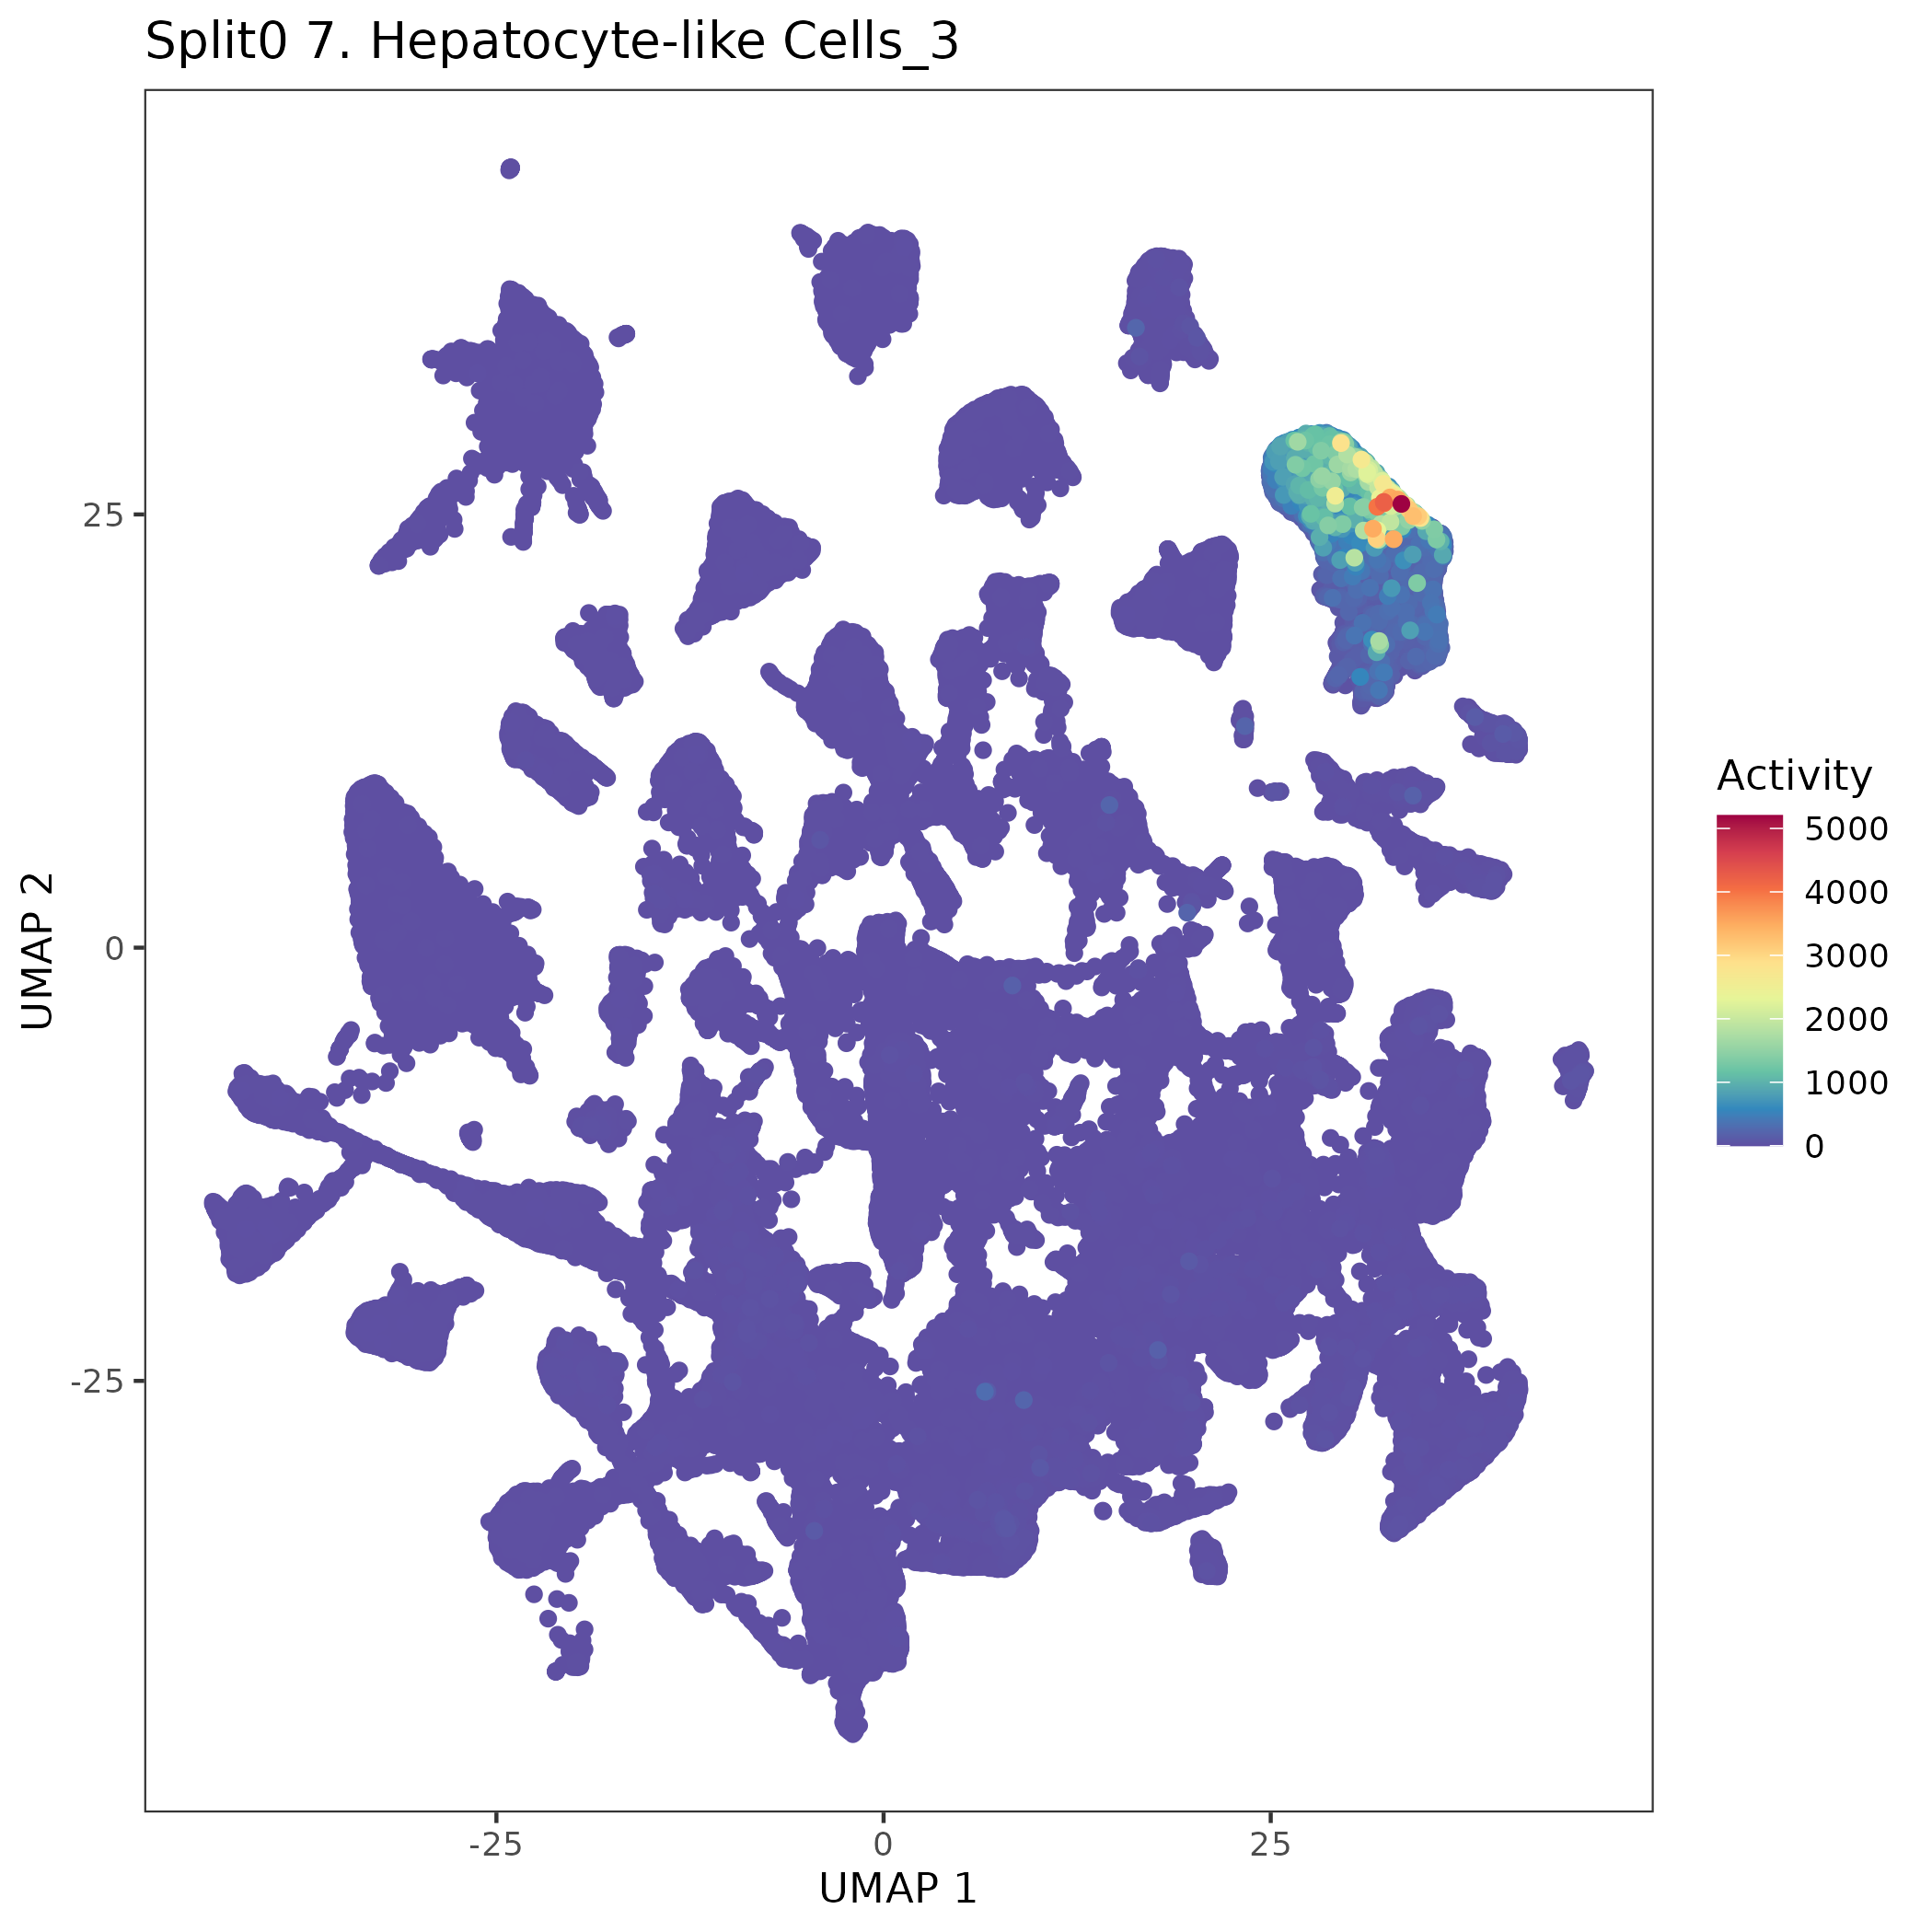
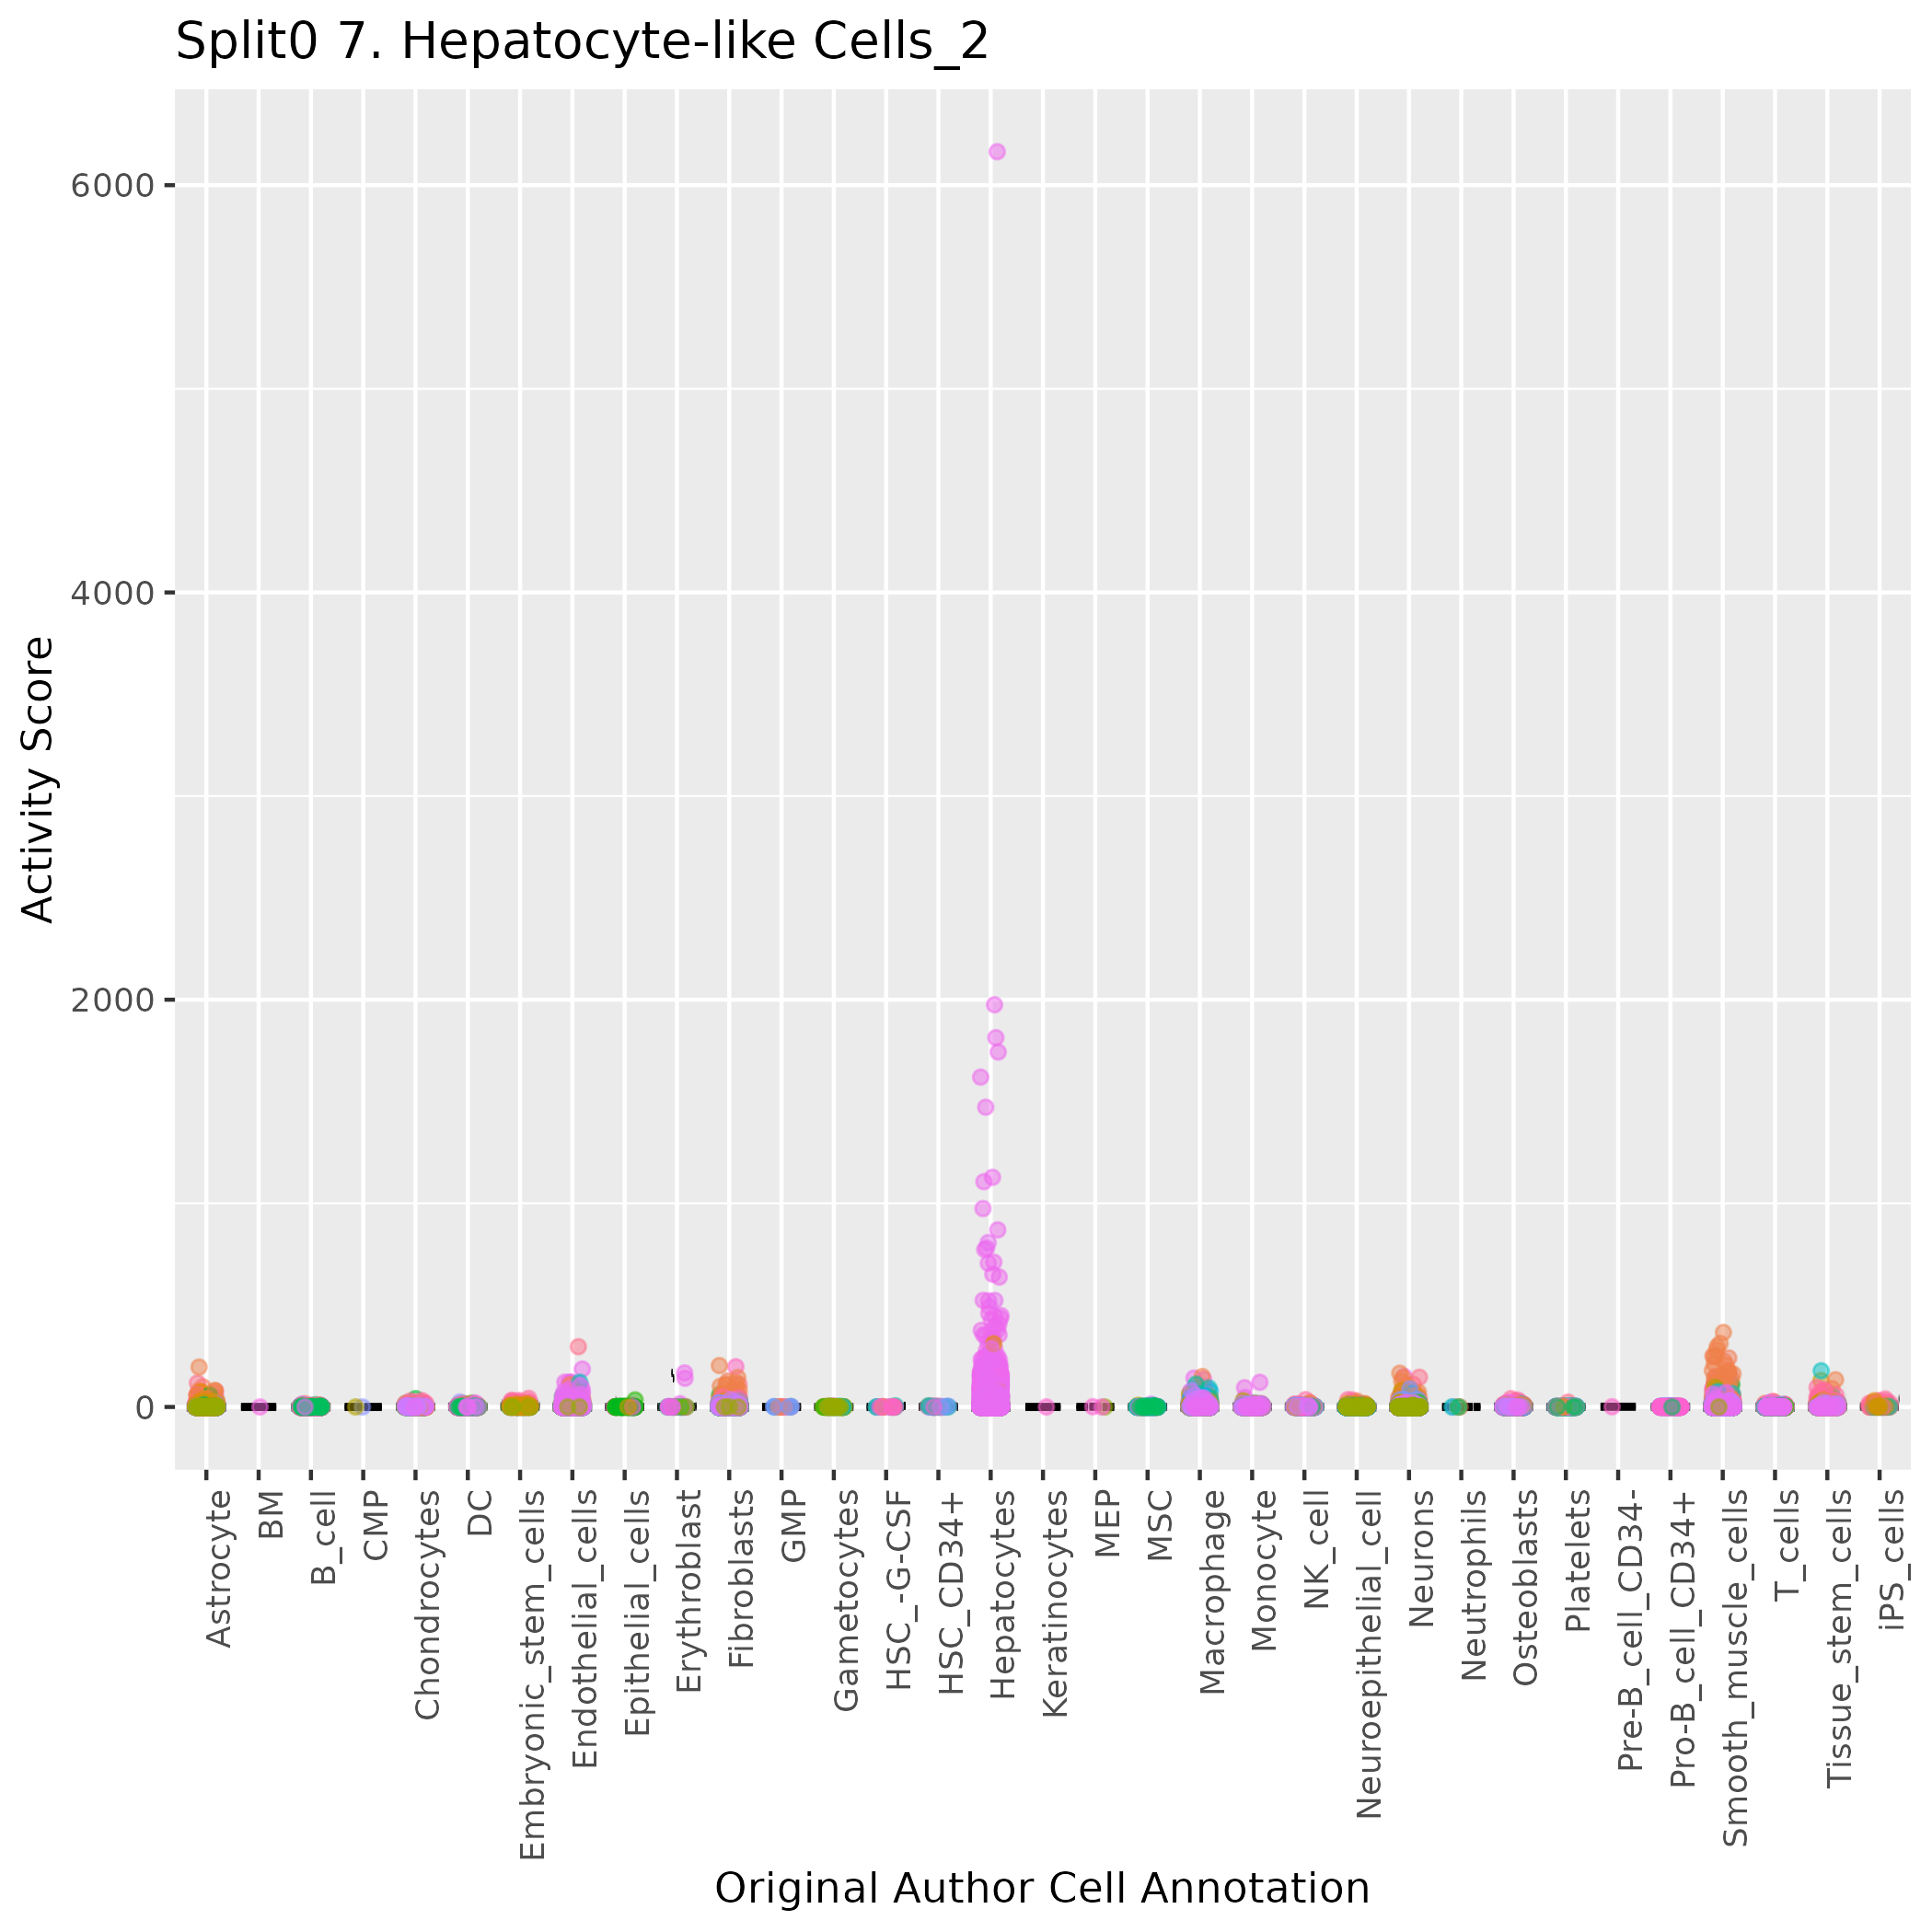
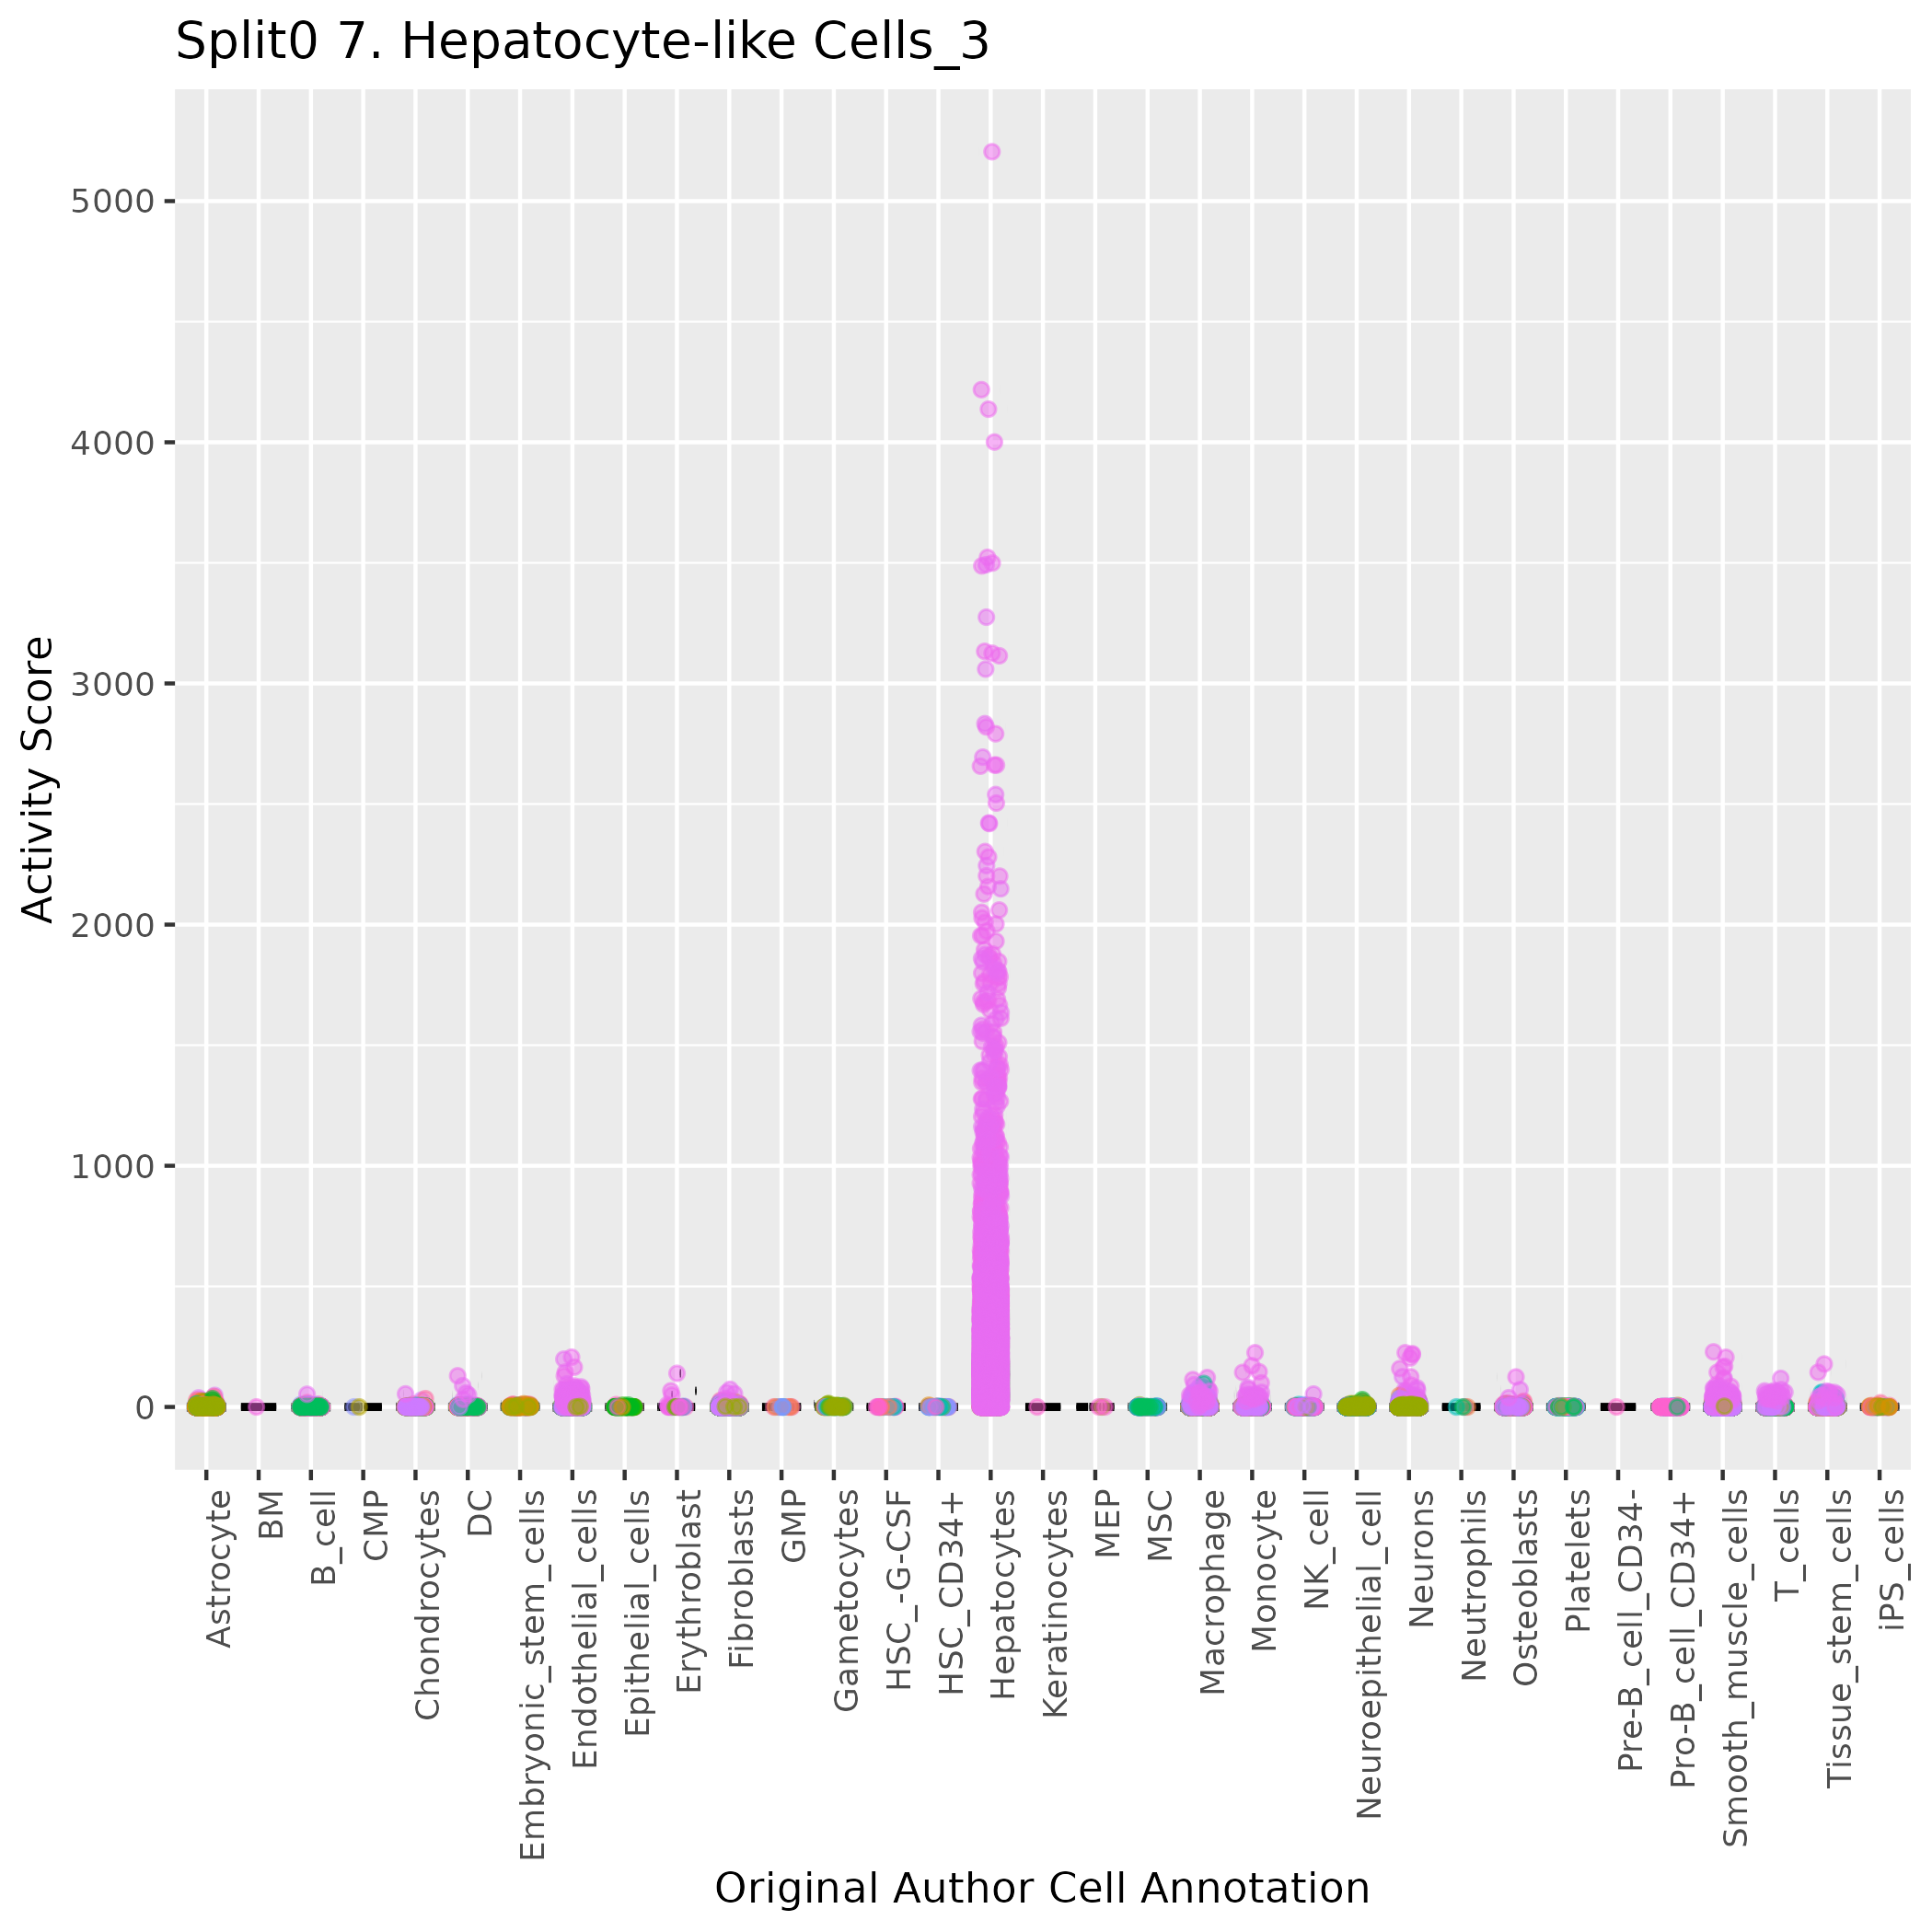
UMAP plots showing activity of gene expression program identified in GEP 7. Hepatocyte-like Cells:

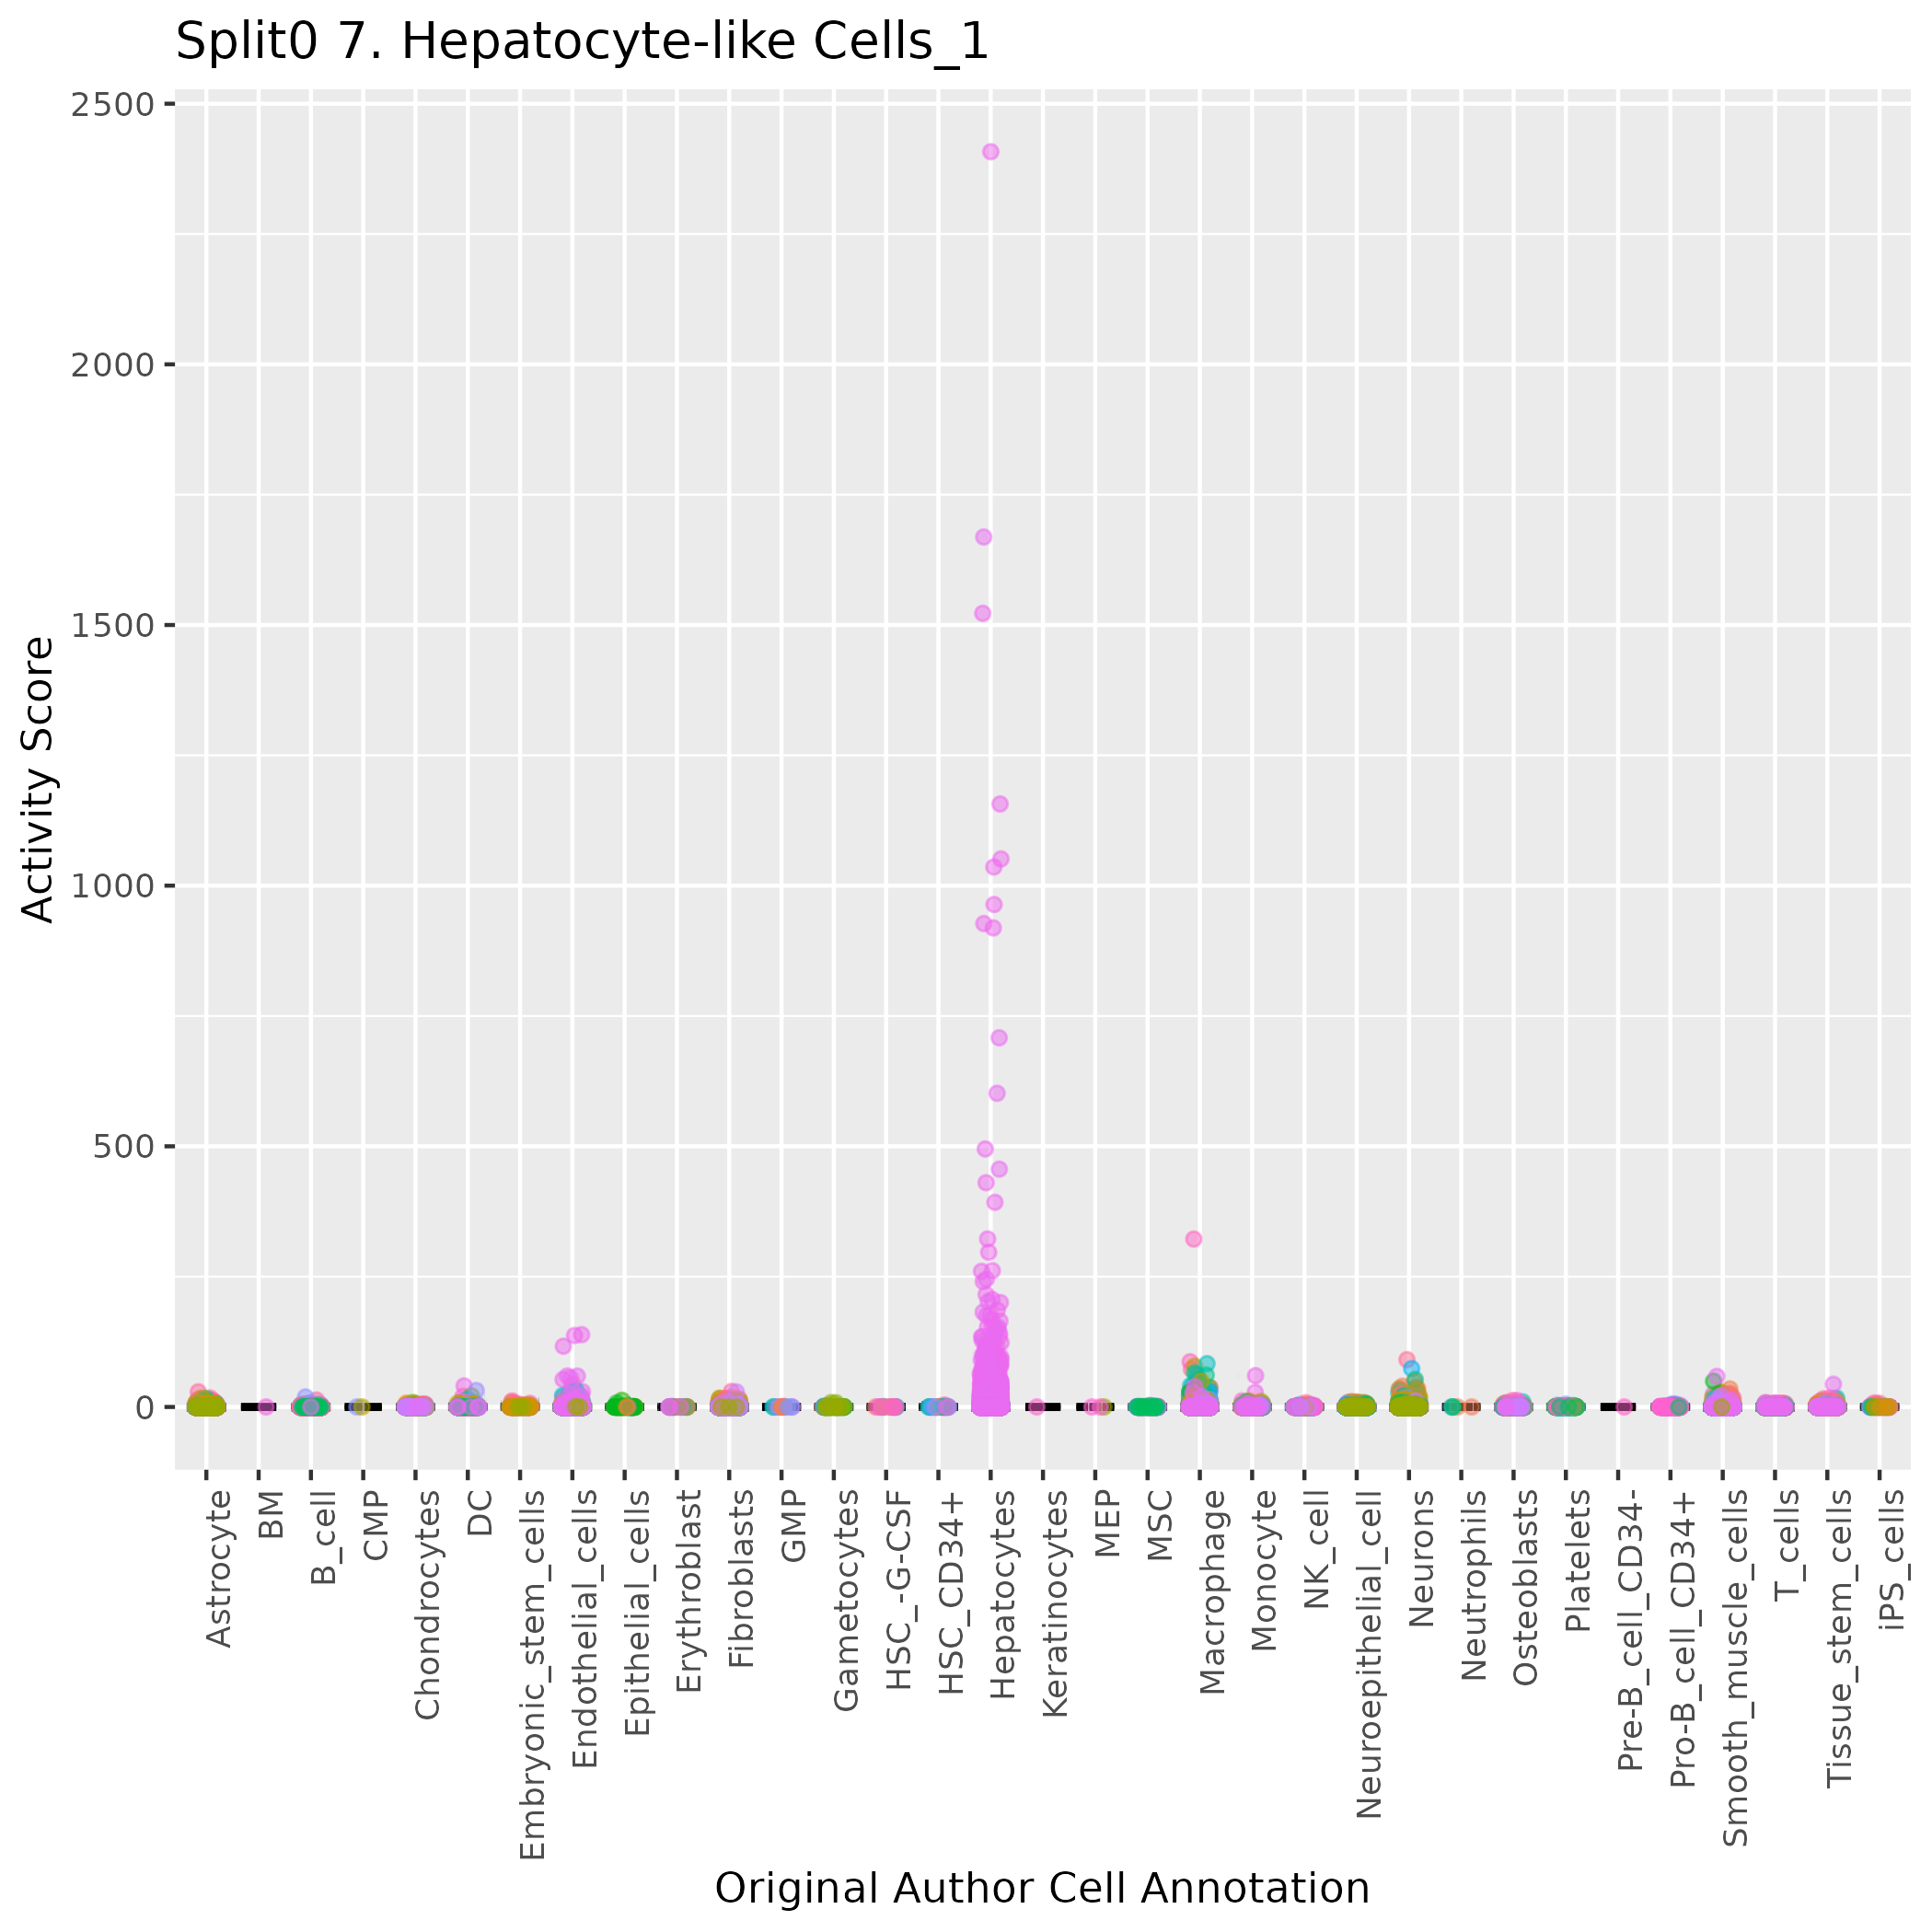
Boxlot showing activity of gene expression program identified in GEP 7. Hepatocyte-like Cells:
Gene set Enrichments for this program, caculated from top 50 genes
mSigDB Cell Types Gene Set:
| P-value | OR | Lower 95% CI | FDR | FWER | Genes Found | Gene Set Size | |
|---|---|---|---|---|---|---|---|
| AIZARANI_LIVER_C11_HEPATOCYTES_1 | 7.79e-85 | 1251.71 | 405.35 | 5.23e-82 | 5.23e-82 | 47TTR, APOC3, APOA2, APOA1, ALB, APOC1, AMBP, RBP4, ORM1, TF, MT1G, ORM2, FABP1, SERPINC1, SERPINA1, APOH, HP, HRG, GC, ALDOB, APOB, AHSG, FGA, CES1, MT1E, KNG1, A1BG, IGFBP1, AGT, ADH1B, MT2A, FGB, CYP2E1, VTN, TAT, HPX, PLG, HAMP, ADH1A, AGXT, ITIH1, SPP2, ITIH2, APCS, ANGPTL3, AZGP1, MT1M |
298 |
| AIZARANI_LIVER_C14_HEPATOCYTES_2 | 6.70e-82 | 841.20 | 342.17 | 2.25e-79 | 4.50e-79 | 44TTR, APOC3, APOA2, APOA1, APOC1, AMBP, RBP4, ORM1, TF, MT1G, ORM2, FABP1, SERPINC1, SERPINA1, APOH, HP, HRG, GC, ALDOB, APOB, AHSG, FGA, CES1, MT1E, KNG1, A1BG, IGFBP1, ADH1B, MT2A, FGB, MT1H, CYP2E1, VTN, TAT, HPX, PLG, HAMP, ADH1A, AGXT, ITIH1, SPP2, APCS, ANGPTL3, AZGP1 |
226 |
| AIZARANI_LIVER_C17_HEPATOCYTES_3 | 1.10e-63 | 516.94 | 266.84 | 1.85e-61 | 7.40e-61 | 32APOC3, APOA2, APOA1, APOC1, AMBP, RBP4, ORM1, TF, ORM2, SERPINC1, SERPINA1, APOH, HP, HRG, APOB, AHSG, FGA, CES1, KNG1, A1BG, IGFBP1, ADH1B, MT2A, FGB, CYP2E1, VTN, HPX, PLG, ADH1A, AGXT, ITIH1, AZGP1 |
102 |
| DESCARTES_FETAL_SPLEEN_AFP_ALB_POSITIVE_CELLS | 4.68e-69 | 430.27 | 215.94 | 1.05e-66 | 3.14e-66 | 38TTR, APOC3, APOA2, APOA1, ALB, APOC1, AMBP, RBP4, TF, MT1G, FABP1, SERPINC1, SERPINA1, APOH, HRG, GC, ALDOB, APOB, AHSG, FGA, MT1E, KNG1, IGFBP1, AGT, MT2A, FGB, MT1H, VTN, HPX, PLG, HAMP, ADH1A, AGXT, ITIH1, SPP2, ITIH2, ANGPTL3, AZGP1 |
188 |
| DESCARTES_FETAL_PLACENTA_AFP_ALB_POSITIVE_CELLS | 5.54e-58 | 287.00 | 151.69 | 6.20e-56 | 3.72e-55 | 33TTR, APOC3, APOA2, APOA1, ALB, AMBP, RBP4, TF, MT1G, FABP1, SERPINC1, SERPINA1, APOH, HRG, GC, ALDOB, APOB, AHSG, FGA, MT1E, KNG1, AGT, MT2A, FGB, MT1H, VTN, HPX, PLG, ADH1A, AGXT, ITIH1, ITIH2, ANGPTL3 |
171 |
| DESCARTES_FETAL_LIVER_HEPATOBLASTS | 1.02e-58 | 202.89 | 96.72 | 1.37e-56 | 6.86e-56 | 41TTR, APOC3, APOA2, APOA1, ALB, APOC1, AMBP, RBP4, TF, MT1G, FABP1, SERPINC1, SERPINA1, APOH, HRG, GC, ALDOB, APOB, AHSG, FGA, MT1E, KNG1, A1BG, IGFBP1, AGT, MT2A, FGB, MT1H, VTN, TAT, HPX, PLG, HAMP, ADH1A, AGXT, ITIH1, SPP2, ITIH2, ANGPTL3, AZGP1, MT1M |
501 |
| DESCARTES_MAIN_FETAL_AFP_ALB_POSITIVE_CELLS | 4.43e-20 | 69.95 | 33.90 | 4.25e-18 | 2.97e-17 | 14ALB, MT1G, FABP1, SERPINC1, SERPINA1, HRG, AHSG, FGA, KNG1, FGB, VTN, ANGPTL3, AZGP1, MT1M |
128 |
| DESCARTES_FETAL_PANCREAS_ACINAR_CELLS | 6.55e-13 | 56.99 | 23.54 | 5.49e-11 | 4.39e-10 | 9ALB, AMBP, MT1G, FABP1, APOB, MT1E, MT2A, MT1H, MT1M |
88 |
| GAO_SMALL_INTESTINE_24W_C4_ENTEROCYTE_PROGENITOR_SUBTYPE_2 | 3.39e-09 | 37.15 | 13.71 | 2.07e-07 | 2.28e-06 | 7APOC3, APOA1, RBP4, ALDOB, APOB, AGT, VTN |
97 |
| DESCARTES_FETAL_STOMACH_MUC13_DMBT1_POSITIVE_CELLS | 3.39e-09 | 37.15 | 13.71 | 2.07e-07 | 2.28e-06 | 7APOC3, APOA1, MT1G, ALDOB, APOB, MT2A, MT1H |
97 |
| DESCARTES_FETAL_STOMACH_PARIETAL_AND_CHIEF_CELLS | 3.19e-06 | 46.89 | 11.69 | 1.65e-04 | 2.14e-03 | 4ALB, FGA, FGB, ANGPTL3 |
42 |
| DESCARTES_FETAL_INTESTINE_INTESTINAL_EPITHELIAL_CELLS | 1.76e-12 | 24.56 | 11.55 | 1.31e-10 | 1.18e-09 | 12APOC3, APOA2, APOA1, RBP4, MT1G, FABP1, ALDOB, APOB, FGA, MT1E, AGT, MT1H |
276 |
| BUSSLINGER_DUODENAL_BCHE_CELLS | 3.51e-06 | 45.69 | 11.41 | 1.68e-04 | 2.36e-03 | 4MT1G, MT1E, MT2A, MT1H |
43 |
| BUSSLINGER_DUODENAL_EC_CELLS | 5.75e-05 | 46.70 | 8.79 | 2.03e-03 | 3.86e-02 | 3TTR, GC, CES1 |
31 |
| BUSSLINGER_GASTRIC_METALLOTHIONEIN_CELLS | 4.26e-06 | 23.98 | 7.28 | 1.90e-04 | 2.86e-03 | 5ALB, MT1G, MT1E, MT2A, MT1H |
100 |
| MURARO_PANCREAS_EPSILON_CELL | 1.65e-04 | 31.93 | 6.11 | 4.99e-03 | 1.11e-01 | 3SERPINA1, AGT, VTN |
44 |
| BUSSLINGER_DUODENAL_TUFT_CELLS | 4.40e-05 | 23.19 | 5.91 | 1.64e-03 | 2.95e-02 | 4MT1G, SERPINA1, MT2A, AZGP1 |
81 |
| AIZARANI_LIVER_C4_EPCAM_POS_BILE_DUCT_CELLS_1 | 6.33e-06 | 15.13 | 5.20 | 2.66e-04 | 4.25e-03 | 6AMBP, GC, APOB, AGT, VTN, ITIH2 |
191 |
| TRAVAGLINI_LUNG_MACROPHAGE_CELL | 8.46e-06 | 14.36 | 4.94 | 3.34e-04 | 5.68e-03 | 6APOC1, RBP4, SERPINA1, MT1E, ISG15, MT1M |
201 |
| BUSSLINGER_GASTRIC_CHIEF_CELLS | 3.39e-04 | 24.72 | 4.77 | 9.09e-03 | 2.27e-01 | 3MT1G, MT2A, AZGP1 |
56 |
Dowload full table
mSigDB Hallmark Gene Sets:
| P-value | OR | Lower 95% CI | FDR | FWER | Genes Found | Gene Set Size | |
|---|---|---|---|---|---|---|---|
| HALLMARK_COAGULATION | 1.01e-12 | 40.07 | 17.48 | 2.52e-11 | 5.04e-11 | 10APOC3, APOA1, APOC1, TF, SERPINC1, SERPINA1, HRG, FGA, PLG, ITIH1 |
138 |
| HALLMARK_XENOBIOTIC_METABOLISM | 3.98e-14 | 34.48 | 16.13 | 1.99e-12 | 1.99e-12 | 12RBP4, FABP1, HRG, CES1, IGFBP1, MT2A, CYP2E1, VTN, TAT, PLG, ITIH1, ANGPTL3 |
200 |
| HALLMARK_BILE_ACID_METABOLISM | 1.54e-04 | 16.53 | 4.25 | 1.93e-03 | 7.72e-03 | 4TTR, APOA1, GC, AGXT |
112 |
| HALLMARK_COMPLEMENT | 1.17e-04 | 11.70 | 3.59 | 1.93e-03 | 5.85e-03 | 5APOC1, SERPINC1, SERPINA1, PLG, ITIH1 |
200 |
| HALLMARK_ANGIOGENESIS | 3.44e-03 | 25.16 | 2.85 | 2.87e-02 | 1.72e-01 | 2APOH, VTN |
36 |
| HALLMARK_HYPOXIA | 1.36e-03 | 9.11 | 2.36 | 1.36e-02 | 6.78e-02 | 4ALDOB, MT1E, IGFBP1, MT2A |
200 |
| HALLMARK_PEROXISOME | 2.62e-02 | 8.39 | 0.97 | 1.87e-01 | 1.00e+00 | 2TTR, ALB |
104 |
| HALLMARK_INTERFERON_GAMMA_RESPONSE | 8.36e-02 | 4.32 | 0.51 | 4.19e-01 | 1.00e+00 | 2MT2A, ISG15 |
200 |
| HALLMARK_KRAS_SIGNALING_UP | 8.36e-02 | 4.32 | 0.51 | 4.19e-01 | 1.00e+00 | 2RBP4, CFHR2 |
200 |
| HALLMARK_HEDGEHOG_SIGNALING | 8.37e-02 | 11.97 | 0.29 | 4.19e-01 | 1.00e+00 | 1PLG |
36 |
| HALLMARK_INTERFERON_ALPHA_RESPONSE | 2.10e-01 | 4.37 | 0.11 | 8.98e-01 | 1.00e+00 | 1ISG15 |
97 |
| HALLMARK_ANDROGEN_RESPONSE | 2.15e-01 | 4.23 | 0.10 | 8.98e-01 | 1.00e+00 | 1AZGP1 |
100 |
| HALLMARK_UNFOLDED_PROTEIN_RESPONSE | 2.40e-01 | 3.74 | 0.09 | 9.22e-01 | 1.00e+00 | 1IGFBP1 |
113 |
| HALLMARK_UV_RESPONSE_DN | 2.95e-01 | 2.93 | 0.07 | 9.59e-01 | 1.00e+00 | 1MT1E |
144 |
| HALLMARK_FATTY_ACID_METABOLISM | 3.18e-01 | 2.67 | 0.07 | 9.59e-01 | 1.00e+00 | 1FABP1 |
158 |
| HALLMARK_IL2_STAT5_SIGNALING | 3.82e-01 | 2.12 | 0.05 | 9.59e-01 | 1.00e+00 | 1SERPINC1 |
199 |
| HALLMARK_G2M_CHECKPOINT | 3.84e-01 | 2.11 | 0.05 | 9.59e-01 | 1.00e+00 | 1MT2A |
200 |
| HALLMARK_ADIPOGENESIS | 3.84e-01 | 2.11 | 0.05 | 9.59e-01 | 1.00e+00 | 1ORM1 |
200 |
| HALLMARK_ESTROGEN_RESPONSE_LATE | 3.84e-01 | 2.11 | 0.05 | 9.59e-01 | 1.00e+00 | 1SERPINA1 |
200 |
| HALLMARK_GLYCOLYSIS | 3.84e-01 | 2.11 | 0.05 | 9.59e-01 | 1.00e+00 | 1ALDOB |
200 |
Dowload full table
KEGG Pathways:
| P-value | OR | Lower 95% CI | FDR | FWER | Genes Found | Gene Set Size | |
|---|---|---|---|---|---|---|---|
| KEGG_COMPLEMENT_AND_COAGULATION_CASCADES | 1.58e-08 | 44.33 | 14.93 | 2.93e-06 | 2.93e-06 | 6SERPINC1, SERPINA1, FGA, KNG1, FGB, PLG |
69 |
| KEGG_PPAR_SIGNALING_PATHWAY | 2.34e-05 | 27.46 | 6.97 | 2.18e-03 | 4.35e-03 | 4APOC3, APOA2, APOA1, FABP1 |
69 |
| KEGG_TYROSINE_METABOLISM | 1.44e-04 | 33.55 | 6.42 | 8.92e-03 | 2.68e-02 | 3ADH1B, TAT, ADH1A |
42 |
| KEGG_GLYCOLYSIS_GLUCONEOGENESIS | 4.57e-04 | 22.21 | 4.30 | 2.12e-02 | 8.50e-02 | 3ALDOB, ADH1B, ADH1A |
62 |
| KEGG_METABOLISM_OF_XENOBIOTICS_BY_CYTOCHROME_P450 | 6.52e-04 | 19.56 | 3.80 | 2.19e-02 | 1.21e-01 | 3ADH1B, CYP2E1, ADH1A |
70 |
| KEGG_DRUG_METABOLISM_CYTOCHROME_P450 | 7.07e-04 | 18.99 | 3.69 | 2.19e-02 | 1.32e-01 | 3ADH1B, CYP2E1, ADH1A |
72 |
| KEGG_FATTY_ACID_METABOLISM | 4.66e-03 | 21.38 | 2.43 | 1.24e-01 | 8.67e-01 | 2ADH1B, ADH1A |
42 |
| KEGG_RETINOL_METABOLISM | 1.05e-02 | 13.80 | 1.59 | 2.45e-01 | 1.00e+00 | 2ADH1B, ADH1A |
64 |
| KEGG_RENIN_ANGIOTENSIN_SYSTEM | 4.05e-02 | 26.18 | 0.61 | 7.96e-01 | 1.00e+00 | 1AGT |
17 |
| KEGG_PHENYLALANINE_METABOLISM | 4.28e-02 | 24.63 | 0.58 | 7.96e-01 | 1.00e+00 | 1TAT |
18 |
| KEGG_PENTOSE_PHOSPHATE_PATHWAY | 6.35e-02 | 16.11 | 0.39 | 9.22e-01 | 1.00e+00 | 1ALDOB |
27 |
| KEGG_LINOLEIC_ACID_METABOLISM | 6.80e-02 | 14.96 | 0.36 | 9.22e-01 | 1.00e+00 | 1CYP2E1 |
29 |
| KEGG_GLYCINE_SERINE_AND_THREONINE_METABOLISM | 7.26e-02 | 13.97 | 0.34 | 9.22e-01 | 1.00e+00 | 1AGXT |
31 |
| KEGG_ALANINE_ASPARTATE_AND_GLUTAMATE_METABOLISM | 7.48e-02 | 13.52 | 0.33 | 9.22e-01 | 1.00e+00 | 1AGXT |
32 |
| KEGG_FRUCTOSE_AND_MANNOSE_METABOLISM | 7.93e-02 | 12.69 | 0.31 | 9.22e-01 | 1.00e+00 | 1ALDOB |
34 |
| KEGG_CYSTEINE_AND_METHIONINE_METABOLISM | 7.93e-02 | 12.69 | 0.31 | 9.22e-01 | 1.00e+00 | 1TAT |
34 |
| KEGG_DRUG_METABOLISM_OTHER_ENZYMES | 1.17e-01 | 8.38 | 0.20 | 1.00e+00 | 1.00e+00 | 1CES1 |
51 |
| KEGG_ARACHIDONIC_ACID_METABOLISM | 1.31e-01 | 7.35 | 0.18 | 1.00e+00 | 1.00e+00 | 1CYP2E1 |
58 |
| KEGG_RIG_I_LIKE_RECEPTOR_SIGNALING_PATHWAY | 1.58e-01 | 5.99 | 0.15 | 1.00e+00 | 1.00e+00 | 1ISG15 |
71 |
| KEGG_PEROXISOME | 1.72e-01 | 5.44 | 0.13 | 1.00e+00 | 1.00e+00 | 1AGXT |
78 |
Dowload full table
CHR Positional Gene Sets:
| P-value | OR | Lower 95% CI | FDR | FWER | Genes Found | Gene Set Size | |
|---|---|---|---|---|---|---|---|
| chr16q13 | 4.21e-08 | 65.05 | 19.02 | 1.17e-05 | 1.17e-05 | 5MT1G, MT1E, MT2A, MT1H, MT1M |
40 |
| chr9q32 | 2.01e-04 | 29.76 | 5.71 | 2.80e-02 | 5.60e-02 | 3AMBP, ORM1, ORM2 |
47 |
| chr3q27 | 2.71e-03 | 11.70 | 2.30 | 2.51e-01 | 7.53e-01 | 3HRG, AHSG, KNG1 |
115 |
| chr6q26 | 3.35e-02 | 32.20 | 0.74 | 1.00e+00 | 1.00e+00 | 1PLG |
14 |
| chr4q31 | 5.51e-02 | 5.52 | 0.64 | 1.00e+00 | 1.00e+00 | 2FGA, FGB |
157 |
| chr16q22 | 6.92e-02 | 4.83 | 0.56 | 1.00e+00 | 1.00e+00 | 2HP, TAT |
179 |
| chr11q23 | 8.71e-02 | 4.21 | 0.49 | 1.00e+00 | 1.00e+00 | 2APOC3, APOA1 |
205 |
| chr1q23 | 9.58e-02 | 3.98 | 0.47 | 1.00e+00 | 1.00e+00 | 2APOA2, APCS |
217 |
| chr19q13 | 7.50e-01 | 1.13 | 0.22 | 1.00e+00 | 1.00e+00 | 3APOC1, A1BG, HAMP |
1165 |
| chr10p14 | 1.08e-01 | 9.11 | 0.22 | 1.00e+00 | 1.00e+00 | 1ITIH2 |
47 |
| chr7p12 | 1.31e-01 | 7.35 | 0.18 | 1.00e+00 | 1.00e+00 | 1IGFBP1 |
58 |
| chr1q31 | 1.58e-01 | 5.99 | 0.15 | 1.00e+00 | 1.00e+00 | 1CFHR2 |
71 |
| chr2p24 | 1.64e-01 | 5.74 | 0.14 | 1.00e+00 | 1.00e+00 | 1APOB |
74 |
| chr17q24 | 2.04e-01 | 4.51 | 0.11 | 1.00e+00 | 1.00e+00 | 1APOH |
94 |
| chr16q12 | 2.08e-01 | 4.41 | 0.11 | 1.00e+00 | 1.00e+00 | 1CES1 |
96 |
| chr18q12 | 2.08e-01 | 4.41 | 0.11 | 1.00e+00 | 1.00e+00 | 1TTR |
96 |
| chr3q22 | 2.47e-01 | 3.61 | 0.09 | 1.00e+00 | 1.00e+00 | 1TF |
117 |
| chr9q31 | 2.67e-01 | 3.30 | 0.08 | 1.00e+00 | 1.00e+00 | 1ALDOB |
128 |
| chr1q25 | 3.21e-01 | 2.64 | 0.07 | 1.00e+00 | 1.00e+00 | 1SERPINC1 |
160 |
| chr17q11 | 3.23e-01 | 2.62 | 0.06 | 1.00e+00 | 1.00e+00 | 1VTN |
161 |
Dowload full table
Transcription Factor Targets:
| P-value | OR | Lower 95% CI | FDR | FWER | Genes Found | Gene Set Size | |
|---|---|---|---|---|---|---|---|
| NR1H4_TARGET_GENES | 8.11e-12 | 21.39 | 10.08 | 9.19e-09 | 9.19e-09 | 12AMBP, RBP4, SERPINC1, SERPINA1, HRG, KNG1, AGT, ADH1B, CYP2E1, TAT, ADH1A, AGXT |
315 |
| RGTTAMWNATT_HNF1_01 | 9.60e-07 | 33.03 | 9.94 | 2.72e-04 | 1.09e-03 | 5TTR, GC, IGFBP1, AGT, PLG |
74 |
| HNF1_Q6 | 1.60e-07 | 15.77 | 6.33 | 6.03e-05 | 1.81e-04 | 8ALB, GC, FGA, IGFBP1, FGB, CYP2E1, PLG, ANGPTL3 |
256 |
| HNF1_01 | 1.91e-06 | 13.99 | 5.25 | 4.22e-04 | 2.16e-03 | 7ALB, GC, FGA, IGFBP1, CYP2E1, PLG, APCS |
246 |
| ZSCAN2_TARGET_GENES | 1.18e-08 | 8.94 | 4.44 | 6.70e-06 | 1.34e-05 | 14APOC3, APOA2, APOA1, AMBP, TF, FABP1, SERPINA1, APOH, HP, AHSG, FGA, CES1, AGT, VTN |
908 |
| HHEX_TARGET_GENES | 3.05e-06 | 6.34 | 3.01 | 4.94e-04 | 3.46e-03 | 12TTR, APOC3, APOA2, APOA1, AMBP, TF, HRG, AHSG, FGA, AGT, VTN, PLG |
1035 |
| HNF1_C | 3.20e-04 | 9.35 | 2.87 | 3.63e-02 | 3.63e-01 | 5RBP4, GC, FGA, FGB, APCS |
249 |
| CDP_01 | 1.57e-03 | 14.24 | 2.79 | 1.49e-01 | 1.00e+00 | 3TTR, ALB, GC |
95 |
| HMG20B_TARGET_GENES | 2.23e-06 | 5.07 | 2.61 | 4.22e-04 | 2.53e-03 | 16APOC3, APOA2, APOA1, AMBP, RBP4, TF, SERPINA1, APOB, AHSG, FGA, MT1E, KNG1, AGT, HPX, PLG, AZGP1 |
1922 |
| TGTTTGY_HNF3_Q6 | 3.21e-04 | 5.29 | 2.14 | 3.63e-02 | 3.63e-01 | 8TF, FABP1, SERPINA1, AHSG, FGA, A1BG, IGFBP1, ITIH1 |
748 |
| TTCYNRGAA_STAT5B_01 | 1.30e-03 | 6.79 | 2.09 | 1.33e-01 | 1.00e+00 | 5FGA, A1BG, AGT, VTN, HAMP |
341 |
| TCF7_TARGET_GENES | 7.19e-05 | 4.05 | 2.01 | 1.02e-02 | 8.15e-02 | 14APOA2, RBP4, TF, FABP1, SERPINA1, APOB, AHSG, FGA, CES1, A1BG, IGFBP1, MT2A, AGXT, ITIH2 |
1987 |
| TGCCAAR_NF1_Q6 | 6.84e-03 | 3.88 | 1.35 | 5.96e-01 | 1.00e+00 | 6APOA2, ALB, RBP4, AHSG, ITIH2, ISG15 |
727 |
| STAT5B_01 | 2.33e-02 | 5.20 | 1.03 | 1.00e+00 | 1.00e+00 | 3FGA, VTN, HAMP |
255 |
| STAT_01 | 2.40e-02 | 5.14 | 1.02 | 1.00e+00 | 1.00e+00 | 3FGA, AGT, VTN |
258 |
| STAT5A_01 | 2.42e-02 | 5.12 | 1.01 | 1.00e+00 | 1.00e+00 | 3FGA, VTN, HAMP |
259 |
| DBP_Q6 | 2.57e-02 | 5.00 | 0.99 | 1.00e+00 | 1.00e+00 | 3FABP1, SERPINA1, ITIH1 |
265 |
| CDP_02 | 2.95e-02 | 7.85 | 0.91 | 1.00e+00 | 1.00e+00 | 2GC, A1BG |
111 |
| TATAAA_TATA_01 | 1.23e-01 | 2.14 | 0.74 | 1.00e+00 | 1.00e+00 | 6RBP4, ORM2, FABP1, ALDOB, AGT, CYP2E1 |
1317 |
| ARP1_01 | 6.13e-02 | 5.19 | 0.61 | 1.00e+00 | 1.00e+00 | 2SERPINC1, CYP2E1 |
167 |
Dowload full table
GO Biological Processes:
| P-value | OR | Lower 95% CI | FDR | FWER | Genes Found | Gene Set Size | |
|---|---|---|---|---|---|---|---|
| GOBP_POSITIVE_REGULATION_OF_CHOLESTEROL_ESTERIFICATION | 3.84e-09 | 350.91 | 68.02 | 6.68e-07 | 2.87e-05 | 4APOA2, APOA1, APOC1, AGT |
9 |
| GOBP_CHYLOMICRON_REMODELING | 3.84e-09 | 350.91 | 68.02 | 6.68e-07 | 2.87e-05 | 4APOC3, APOA2, APOA1, APOB |
9 |
| GOBP_REGULATION_OF_VERY_LOW_DENSITY_LIPOPROTEIN_PARTICLE_REMODELING | 2.68e-07 | 430.78 | 56.44 | 2.42e-05 | 2.01e-03 | 3APOC3, APOA2, APOA1 |
6 |
| GOBP_CHYLOMICRON_ASSEMBLY | 1.00e-08 | 252.63 | 52.52 | 1.36e-06 | 7.49e-05 | 4APOC3, APOA2, APOA1, APOB |
11 |
| GOBP_NEGATIVE_REGULATION_OF_LIPASE_ACTIVITY | 4.15e-10 | 188.92 | 50.06 | 1.11e-07 | 3.10e-06 | 5APOC3, APOA2, APOA1, APOC1, ANGPTL3 |
17 |
| GOBP_DETOXIFICATION_OF_INORGANIC_COMPOUND | 4.15e-10 | 188.92 | 50.06 | 1.11e-07 | 3.10e-06 | 5MT1G, MT1E, MT2A, MT1H, MT1M |
17 |
| GOBP_HIGH_DENSITY_LIPOPROTEIN_PARTICLE_REMODELING | 5.73e-10 | 173.11 | 46.73 | 1.34e-07 | 4.29e-06 | 5APOC3, APOA2, APOA1, ALB, APOC1 |
18 |
| GOBP_STRESS_RESPONSE_TO_METAL_ION | 5.73e-10 | 173.11 | 46.73 | 1.34e-07 | 4.29e-06 | 5MT1G, MT1E, MT2A, MT1H, MT1M |
18 |
| GOBP_NEGATIVE_REGULATION_OF_LIPOPROTEIN_LIPASE_ACTIVITY | 4.68e-07 | 327.81 | 46.27 | 3.78e-05 | 3.50e-03 | 3APOC3, APOC1, ANGPTL3 |
7 |
| GOBP_PHOSPHOLIPID_EFFLUX | 2.16e-08 | 196.88 | 42.85 | 2.79e-06 | 1.62e-04 | 4APOC3, APOA2, APOA1, APOC1 |
13 |
| GOBP_PROTEIN_CONTAINING_COMPLEX_REMODELING | 2.03e-12 | 118.97 | 41.61 | 1.76e-09 | 1.52e-08 | 7APOC3, APOA2, APOA1, ALB, APOC1, APOB, AGT |
35 |
| GOBP_TRIGLYCERIDE_RICH_LIPOPROTEIN_PARTICLE_CLEARANCE | 7.48e-07 | 259.50 | 39.26 | 5.71e-05 | 5.59e-03 | 3APOC3, APOC1, APOB |
8 |
| GOBP_REGULATION_OF_CHOLESTEROL_ESTERIFICATION | 3.02e-08 | 176.78 | 39.22 | 3.58e-06 | 2.26e-04 | 4APOA2, APOA1, APOC1, AGT |
14 |
| GOBP_TRIGLYCERIDE_RICH_LIPOPROTEIN_PARTICLE_REMODELING | 3.02e-08 | 176.78 | 39.22 | 3.58e-06 | 2.26e-04 | 4APOC3, APOA2, APOA1, APOB |
14 |
| GOBP_PLATELET_DEGRANULATION | 5.89e-22 | 77.76 | 38.30 | 4.41e-18 | 4.41e-18 | 15APOA1, ALB, ORM1, TF, ORM2, SERPINA1, APOH, HRG, AHSG, FGA, KNG1, A1BG, FGB, PLG, SPP2 |
128 |
| GOBP_REGULATION_OF_LIPOPROTEIN_LIPASE_ACTIVITY | 2.81e-09 | 119.64 | 33.45 | 5.53e-07 | 2.10e-05 | 5APOC3, APOA1, APOC1, APOH, ANGPTL3 |
24 |
| GOBP_CELLULAR_RESPONSE_TO_ZINC_ION | 2.81e-09 | 119.64 | 33.45 | 5.53e-07 | 2.10e-05 | 5MT1G, MT1E, MT2A, MT1H, MT1M |
24 |
| GOBP_FIBRINOLYSIS | 3.50e-09 | 113.57 | 31.93 | 6.68e-07 | 2.62e-05 | 5APOH, HRG, FGA, FGB, PLG |
25 |
| GOBP_ACUTE_PHASE_RESPONSE | 1.58e-11 | 85.40 | 30.57 | 8.43e-09 | 1.18e-07 | 7ORM1, ORM2, SERPINA1, HP, AHSG, HAMP, APCS |
46 |
| GOBP_VERY_LOW_DENSITY_LIPOPROTEIN_PARTICLE_CLEARANCE | 1.60e-06 | 185.92 | 30.16 | 1.15e-04 | 1.19e-02 | 3APOC3, APOC1, APOB |
10 |
Dowload full table
Immunological Gene Sets:
| P-value | OR | Lower 95% CI | FDR | FWER | Genes Found | Gene Set Size | |
|---|---|---|---|---|---|---|---|
| GSE37301_RAG2_KO_VS_RAG2_AND_ETS1_KO_NK_CELL_UP | 4.84e-07 | 17.32 | 6.49 | 2.36e-03 | 2.36e-03 | 7AMBP, ORM1, HRG, GC, FGB, ITIH1, CFHR2 |
200 |
| GSE41176_UNSTIM_VS_ANTI_IGM_STIM_TAK1_KO_BCELL_24H_DN | 7.99e-06 | 14.51 | 4.99 | 1.34e-02 | 3.89e-02 | 6ORM1, MT1G, MT1E, MT2A, MT1H, MT1M |
199 |
| GSE13484_UNSTIM_VS_YF17D_VACCINE_STIM_PBMC_DN | 8.22e-06 | 14.43 | 4.97 | 1.34e-02 | 4.01e-02 | 6MT1G, CES1, MT1E, MT2A, MT1H, ISG15 |
200 |
| GSE24634_IL4_VS_CTRL_TREATED_NAIVE_CD4_TCELL_DAY5_DN | 1.14e-04 | 11.76 | 3.60 | 5.70e-02 | 5.57e-01 | 5ORM1, MT1G, KNG1, MT2A, MT1H |
199 |
| GSE41176_UNSTIM_VS_ANTI_IGM_STIM_BCELL_3H_UP | 1.14e-04 | 11.76 | 3.60 | 5.70e-02 | 5.57e-01 | 5ALB, MT1G, MT1E, MT2A, MT1H |
199 |
| GSE360_HIGH_DOSE_B_MALAYI_VS_M_TUBERCULOSIS_DC_DN | 1.17e-04 | 11.70 | 3.59 | 5.70e-02 | 5.70e-01 | 5MT1G, SERPINA1, MT1E, MT2A, MT1H |
200 |
| GSE37301_GRANULOCYTE_MONOCYTE_PROGENITOR_VS_RAG2_KO_NK_CELL_DN | 1.17e-04 | 11.70 | 3.59 | 5.70e-02 | 5.70e-01 | 5TTR, AMBP, VTN, HPX, ITIH1 |
200 |
| GSE43955_TH0_VS_TGFB_IL6_TH17_ACT_CD4_TCELL_1H_UP | 1.17e-04 | 11.70 | 3.59 | 5.70e-02 | 5.70e-01 | 5AMBP, MT1E, IGFBP1, MT2A, TAT |
200 |
| GSE43955_TH0_VS_TGFB_IL6_TH17_ACT_CD4_TCELL_30H_UP | 1.17e-04 | 11.70 | 3.59 | 5.70e-02 | 5.70e-01 | 5AMBP, FABP1, APOB, MT1E, MT2A |
200 |
| GSE42088_UNINF_VS_LEISHMANIA_INF_DC_8H_UP | 1.17e-04 | 11.70 | 3.59 | 5.70e-02 | 5.70e-01 | 5MT1G, MT1E, MT2A, MT1H, MT1M |
200 |
| GSE43863_NAIVE_VS_TH1_EFF_CD4_TCELL_D6_LCMV_DN | 1.04e-03 | 9.81 | 2.54 | 1.78e-01 | 1.00e+00 | 4MT1G, MT2A, MT1H, MT1M |
186 |
| GSE10325_MYELOID_VS_LUPUS_MYELOID_UP | 1.26e-03 | 9.30 | 2.41 | 1.78e-01 | 1.00e+00 | 4APOA1, APOH, APOB, AGXT |
196 |
| GSE21546_WT_VS_SAP1A_KO_DP_THYMOCYTES_UP | 1.26e-03 | 9.30 | 2.41 | 1.78e-01 | 1.00e+00 | 4MT1G, MT2A, MT1H, ISG15 |
196 |
| GSE28130_ACTIVATED_VS_INDUCEED_TREG_UP | 1.26e-03 | 9.30 | 2.41 | 1.78e-01 | 1.00e+00 | 4ALB, SERPINC1, GC, APCS |
196 |
| GSE9988_ANTI_TREM1_VS_LOW_LPS_MONOCYTE_UP | 1.31e-03 | 9.20 | 2.38 | 1.78e-01 | 1.00e+00 | 4MT1G, MT1E, MT2A, MT1H |
198 |
| GSE24574_BCL6_HIGH_TFH_VS_TCONV_CD4_TCELL_DN | 1.31e-03 | 9.20 | 2.38 | 1.78e-01 | 1.00e+00 | 4ALB, SERPINC1, GC, APCS |
198 |
| GSE10325_CD4_TCELL_VS_LUPUS_CD4_TCELL_DN | 1.33e-03 | 9.16 | 2.37 | 1.78e-01 | 1.00e+00 | 4MT1E, MT2A, MT1H, ISG15 |
199 |
| GSE17721_CPG_VS_GARDIQUIMOD_6H_BMDC_UP | 1.33e-03 | 9.16 | 2.37 | 1.78e-01 | 1.00e+00 | 4SERPINC1, CES1, FGB, SPP2 |
199 |
| GSE360_L_DONOVANI_VS_B_MALAYI_LOW_DOSE_DC_UP | 1.33e-03 | 9.16 | 2.37 | 1.78e-01 | 1.00e+00 | 4MT1G, MT1E, MT2A, ISG15 |
199 |
| GSE360_LOW_DOSE_B_MALAYI_VS_M_TUBERCULOSIS_DC_DN | 1.33e-03 | 9.16 | 2.37 | 1.78e-01 | 1.00e+00 | 4MT1G, SERPINA1, MT1E, MT2A |
199 |
Top Ranked Transcription Factors for this Gene Expression Program:
| Gene Symbol | Gene Loading Rank | DNA Binding Domain | Motif Status | IUPAC PWM | GTEx | DepMap | Decartes |
|---|---|---|---|---|---|---|---|
| AGT | 29 | No | Unlikely to be sequence specific TF | Not a DNA binding protein | No motif | None | None |
| PRAP1 | 84 | No | Unlikely to be sequence specific TF | Not a DNA binding protein | No motif | None | None |
| DSP | 127 | No | Unlikely to be sequence specific TF | Not a DNA binding protein | No motif | None | None |
| KLF6 | 142 | Yes | Known motif | Monomer or homomultimer | High-throughput in vitro | None | None |
| FOS | 150 | Yes | Known motif | Monomer or homomultimer | High-throughput in vitro | None | None |
| ZFP36 | 151 | No | ssDNA/RNA binding | Not a DNA binding protein | No motif | None | RNA binding protein (PMID: 10330172). |
| ATF5 | 165 | Yes | Known motif | Obligate heteromer | In vivo/Misc source | Only known motifs are from Transfac or HocoMoco - origin is uncertain | Transfac motifs dont correspond to canonical bZIP binding sites. Annotated as obligate heteromer based on peptide array studies (PMID:12805554). |
| FOSB | 173 | Yes | Known motif | Monomer or homomultimer | High-throughput in vitro | None | None |
| ANXA4 | 180 | No | Unlikely to be sequence specific TF | Not a DNA binding protein | No motif | None | None |
| FOXA3 | 184 | Yes | Known motif | Monomer or homomultimer | High-throughput in vitro | None | None |
| NR0B2 | 192 | No | Unlikely to be sequence specific TF | Not a DNA binding protein | No motif | None | Transcription cofactor - lacks a conventional DNA binding domain and represses the transcriptional activity of various nuclear receptors (PMID: 14752053) |
| ONECUT1 | 193 | Yes | Known motif | Monomer or homomultimer | High-throughput in vitro | None | None |
| TRIB1 | 199 | No | Unlikely to be sequence specific TF | Not a DNA binding protein | No motif | None | Associates with CEBPB and CEBPA and inhibits their activities (PMID: 17724128). This is probably achieved through control of their proteosomal degradation (PMID: 17576771) |
| PKHD1 | 205 | No | Unlikely to be sequence specific TF | Not a DNA binding protein | No motif | None | The TIG domain is potentially DNA-binding but there is no literature evidence to suggest that PKHD1 is a TF. Membrane protein that operates upstream in the signaling cascade leading to NFKB (PMID: 21300060) |
| CEBPA | 211 | Yes | Known motif | Monomer or homomultimer | 100 perc ID - in vitro | None | None |
| ID2 | 214 | No | Unlikely to be sequence specific TF | Not a DNA binding protein | No motif | None | ID bHLH proteins lack the basic region and should not be able to bind DNA. The HT-SELEX motif for ID4 is likely by a co-precipitated protein or it is a contamination |
| EGR1 | 216 | Yes | Known motif | Monomer or homomultimer | High-throughput in vitro | None | None |
| LSR | 219 | No | Unlikely to be sequence specific TF | Not a DNA binding protein | No motif | None | Cell plasma membrane resident protein that functions in cell-cell junctions (PMID: 25753034) |
| HNF4G | 220 | Yes | Known motif | Monomer or homomultimer | In vivo/Misc source | None | None |
| CEBPB | 221 | Yes | Known motif | Monomer or homomultimer | High-throughput in vitro | None | None |
Druggable Genes for this Gene Expression Program:
| Gene Symbol | Gene Loading Rank | Drug Names | Drug Category | GTEx | DepMap |
|---|---|---|---|---|---|
| ADH1B | 30 | 1FOMEPIZOLE |
Small molecule | GTEx | DepMap |
| PLG | 38 | 2TRANEXAMIC ACID, AMINOCAPROIC ACID |
Small molecule | GTEx | DepMap |
| ADH1A | 40 | 1FOMEPIZOLE |
Small molecule | GTEx | DepMap |
| F2 | 61 | 2DABIGATRAN ETEXILATE, ARGATROBAN |
Small molecule | GTEx | DepMap |
| CYP3A4 | 70 | 1COBICISTAT |
Small molecule | GTEx | DepMap |
| HPD | 77 | 1NITISINONE |
Small molecule | GTEx | DepMap |
| MTTP | 98 | 1LOMITAPIDE |
Small molecule | GTEx | DepMap |
| ADH1C | 133 | 1FOMEPIZOLE |
Small molecule | GTEx | DepMap |
| ALDH2 | 136 | 1DISULFIRAM |
Small molecule | GTEx | DepMap |
| MCL1 | 176 | 1AMG176 |
Small molecule | GTEx | DepMap |
| BHMT2 | 177 | 1BETAINE |
Small molecule | GTEx | DepMap |
| CPS1 | 182 | 1CARGLUMIC ACID |
Small molecule | GTEx | DepMap |
| PAH | 194 | 1SAPROPTERIN |
Small molecule | GTEx | DepMap |
| CFTR | 198 | 4IVACAFTOR, CROFELEMER, LUMACAFTOR, LUMACAFTOR |
Small molecule | GTEx | DepMap |
| F10 | 213 | 3EDOXABAN, RIVAROXABAN, APIXABAN |
Small molecule | GTEx | DepMap |
| BHMT | 234 | 1BETAINE |
Small molecule | GTEx | DepMap |
| FGFR3 | 243 | 2PAZOPANIB, NINTEDANIB |
Small molecule | GTEx | DepMap |
| C5 | 262 | 1ECULIZUMAB |
Antibody | GTEx | DepMap |
| FGFR2 | 306 | 2REGORAFENIB, NINTEDANIB |
Small molecule | GTEx | DepMap |
| CYP3A5 | 329 | 1COBICISTAT |
Small molecule | GTEx | DepMap |
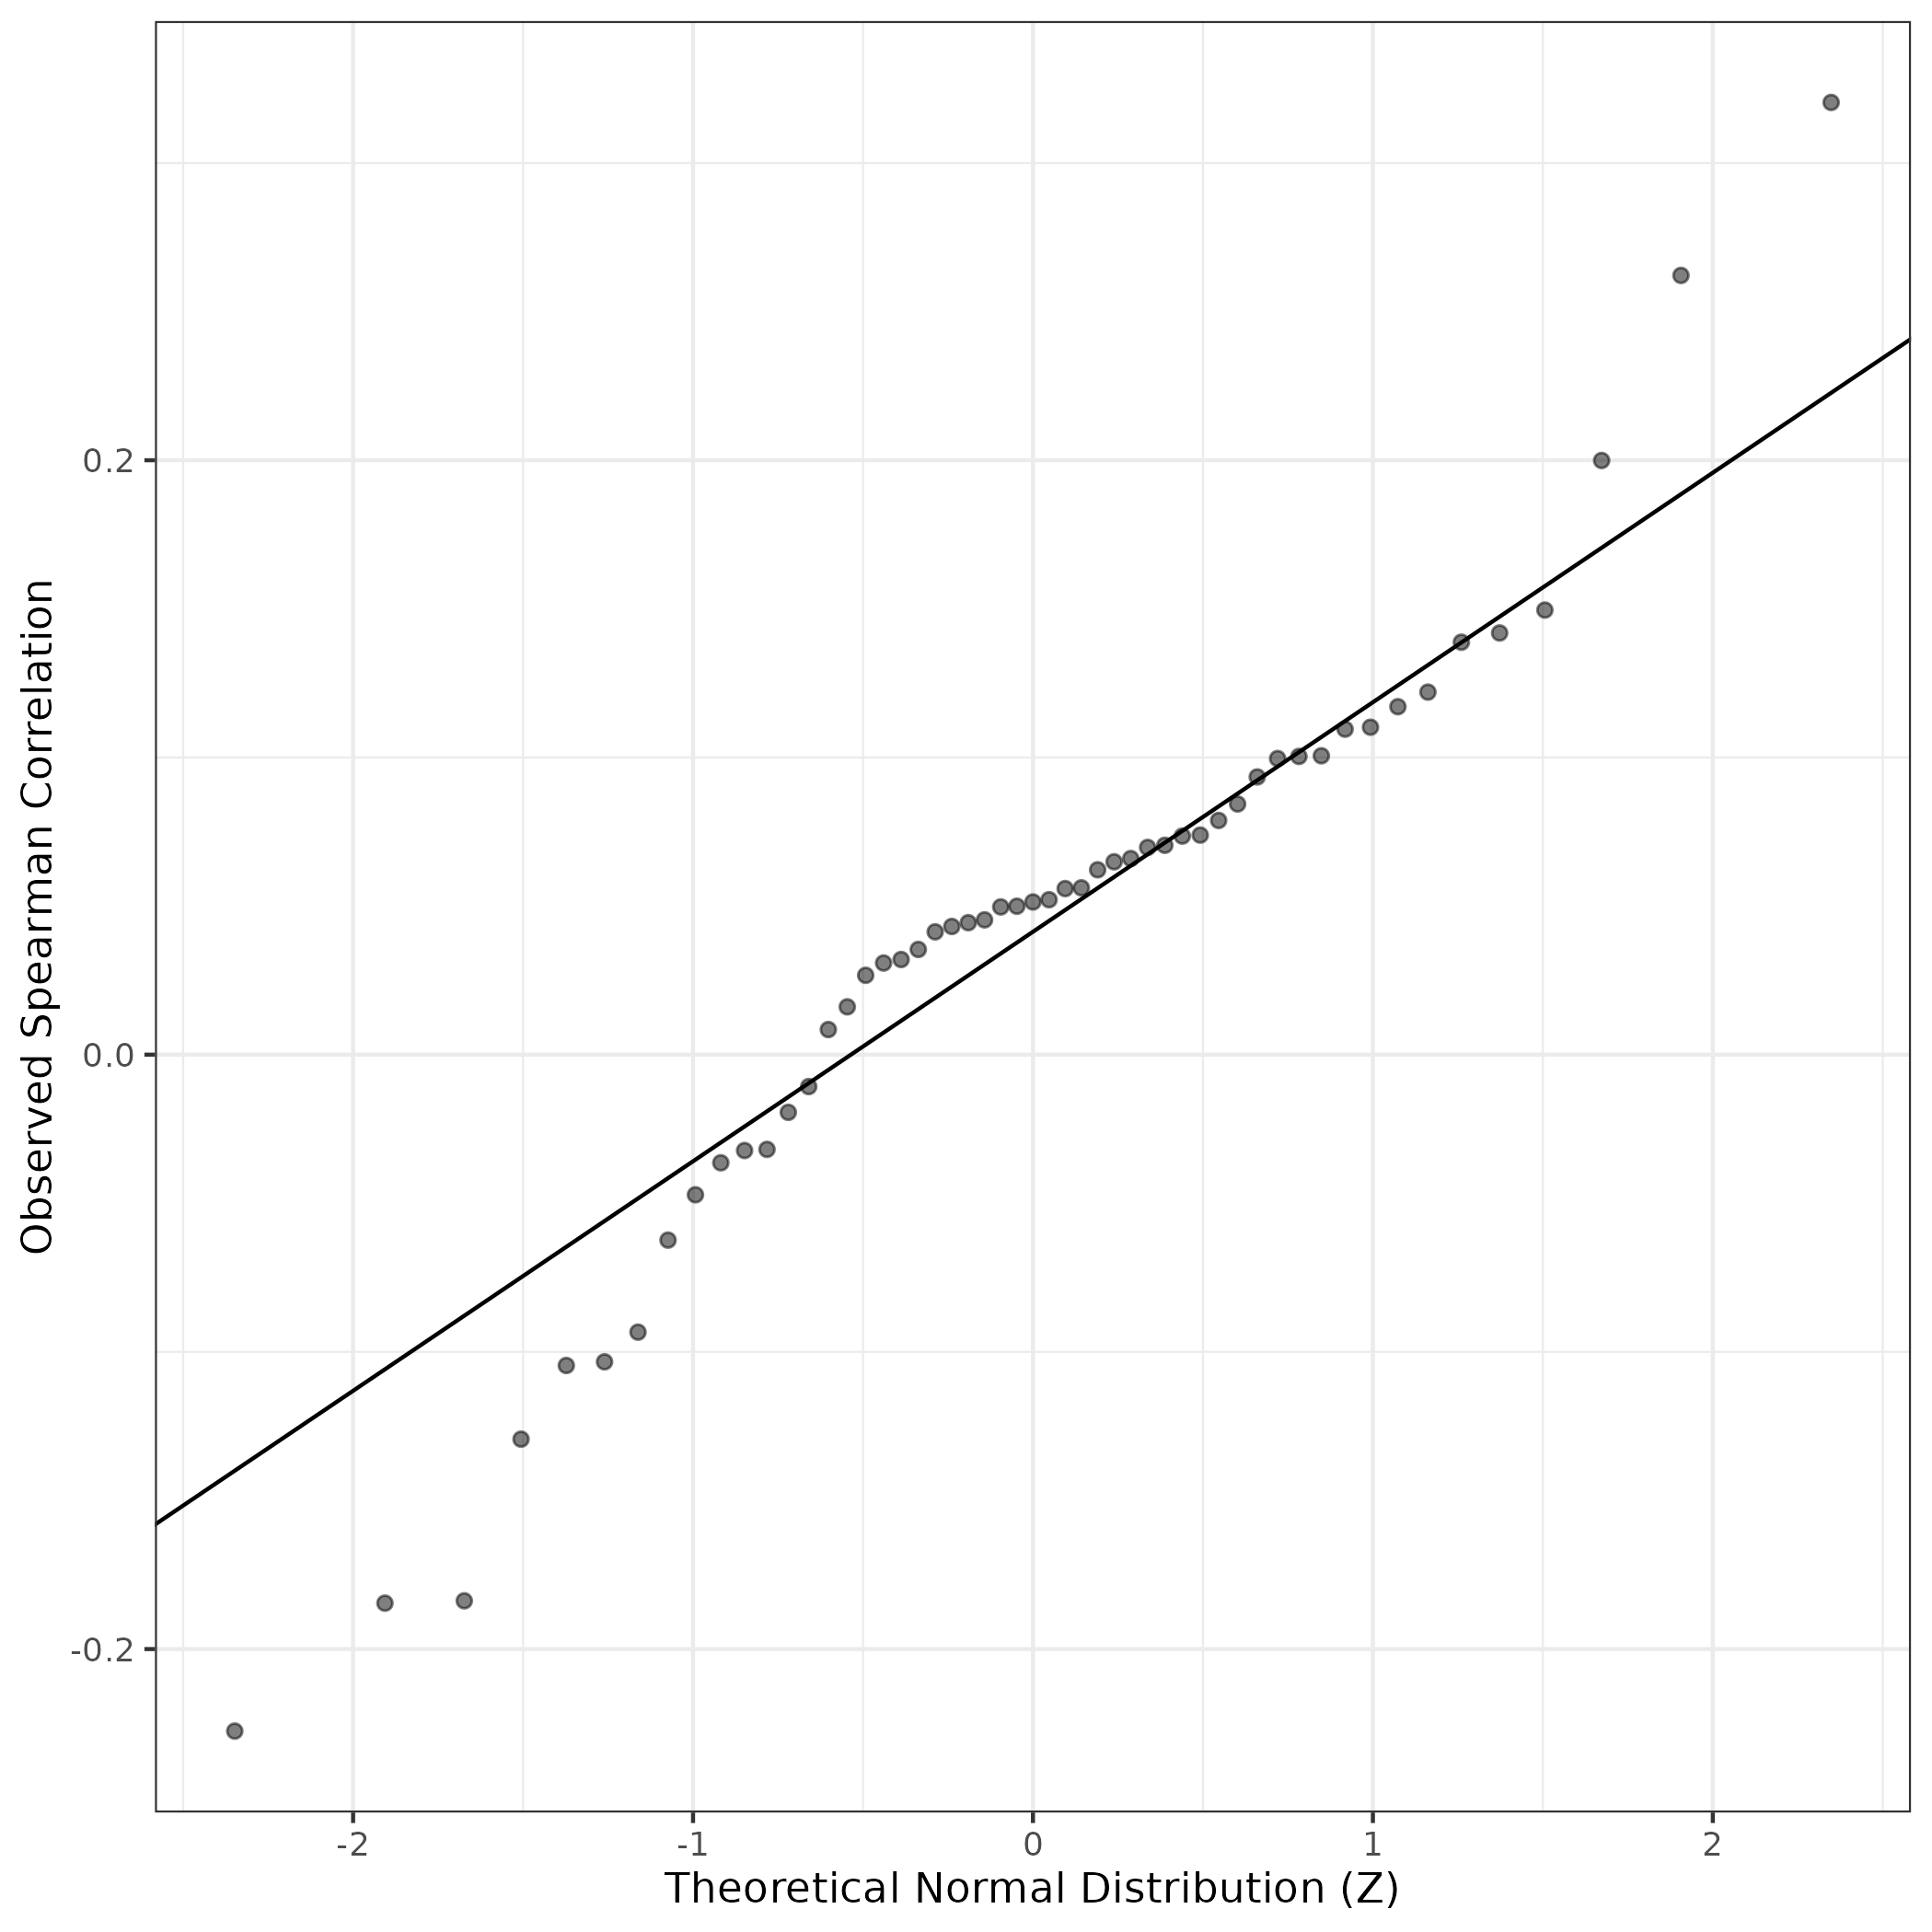
QQ Plot showing correlations with other GEPs in this dataset, calculated by Spearman correlation:
Interactive QQ-plot of gene loadings:
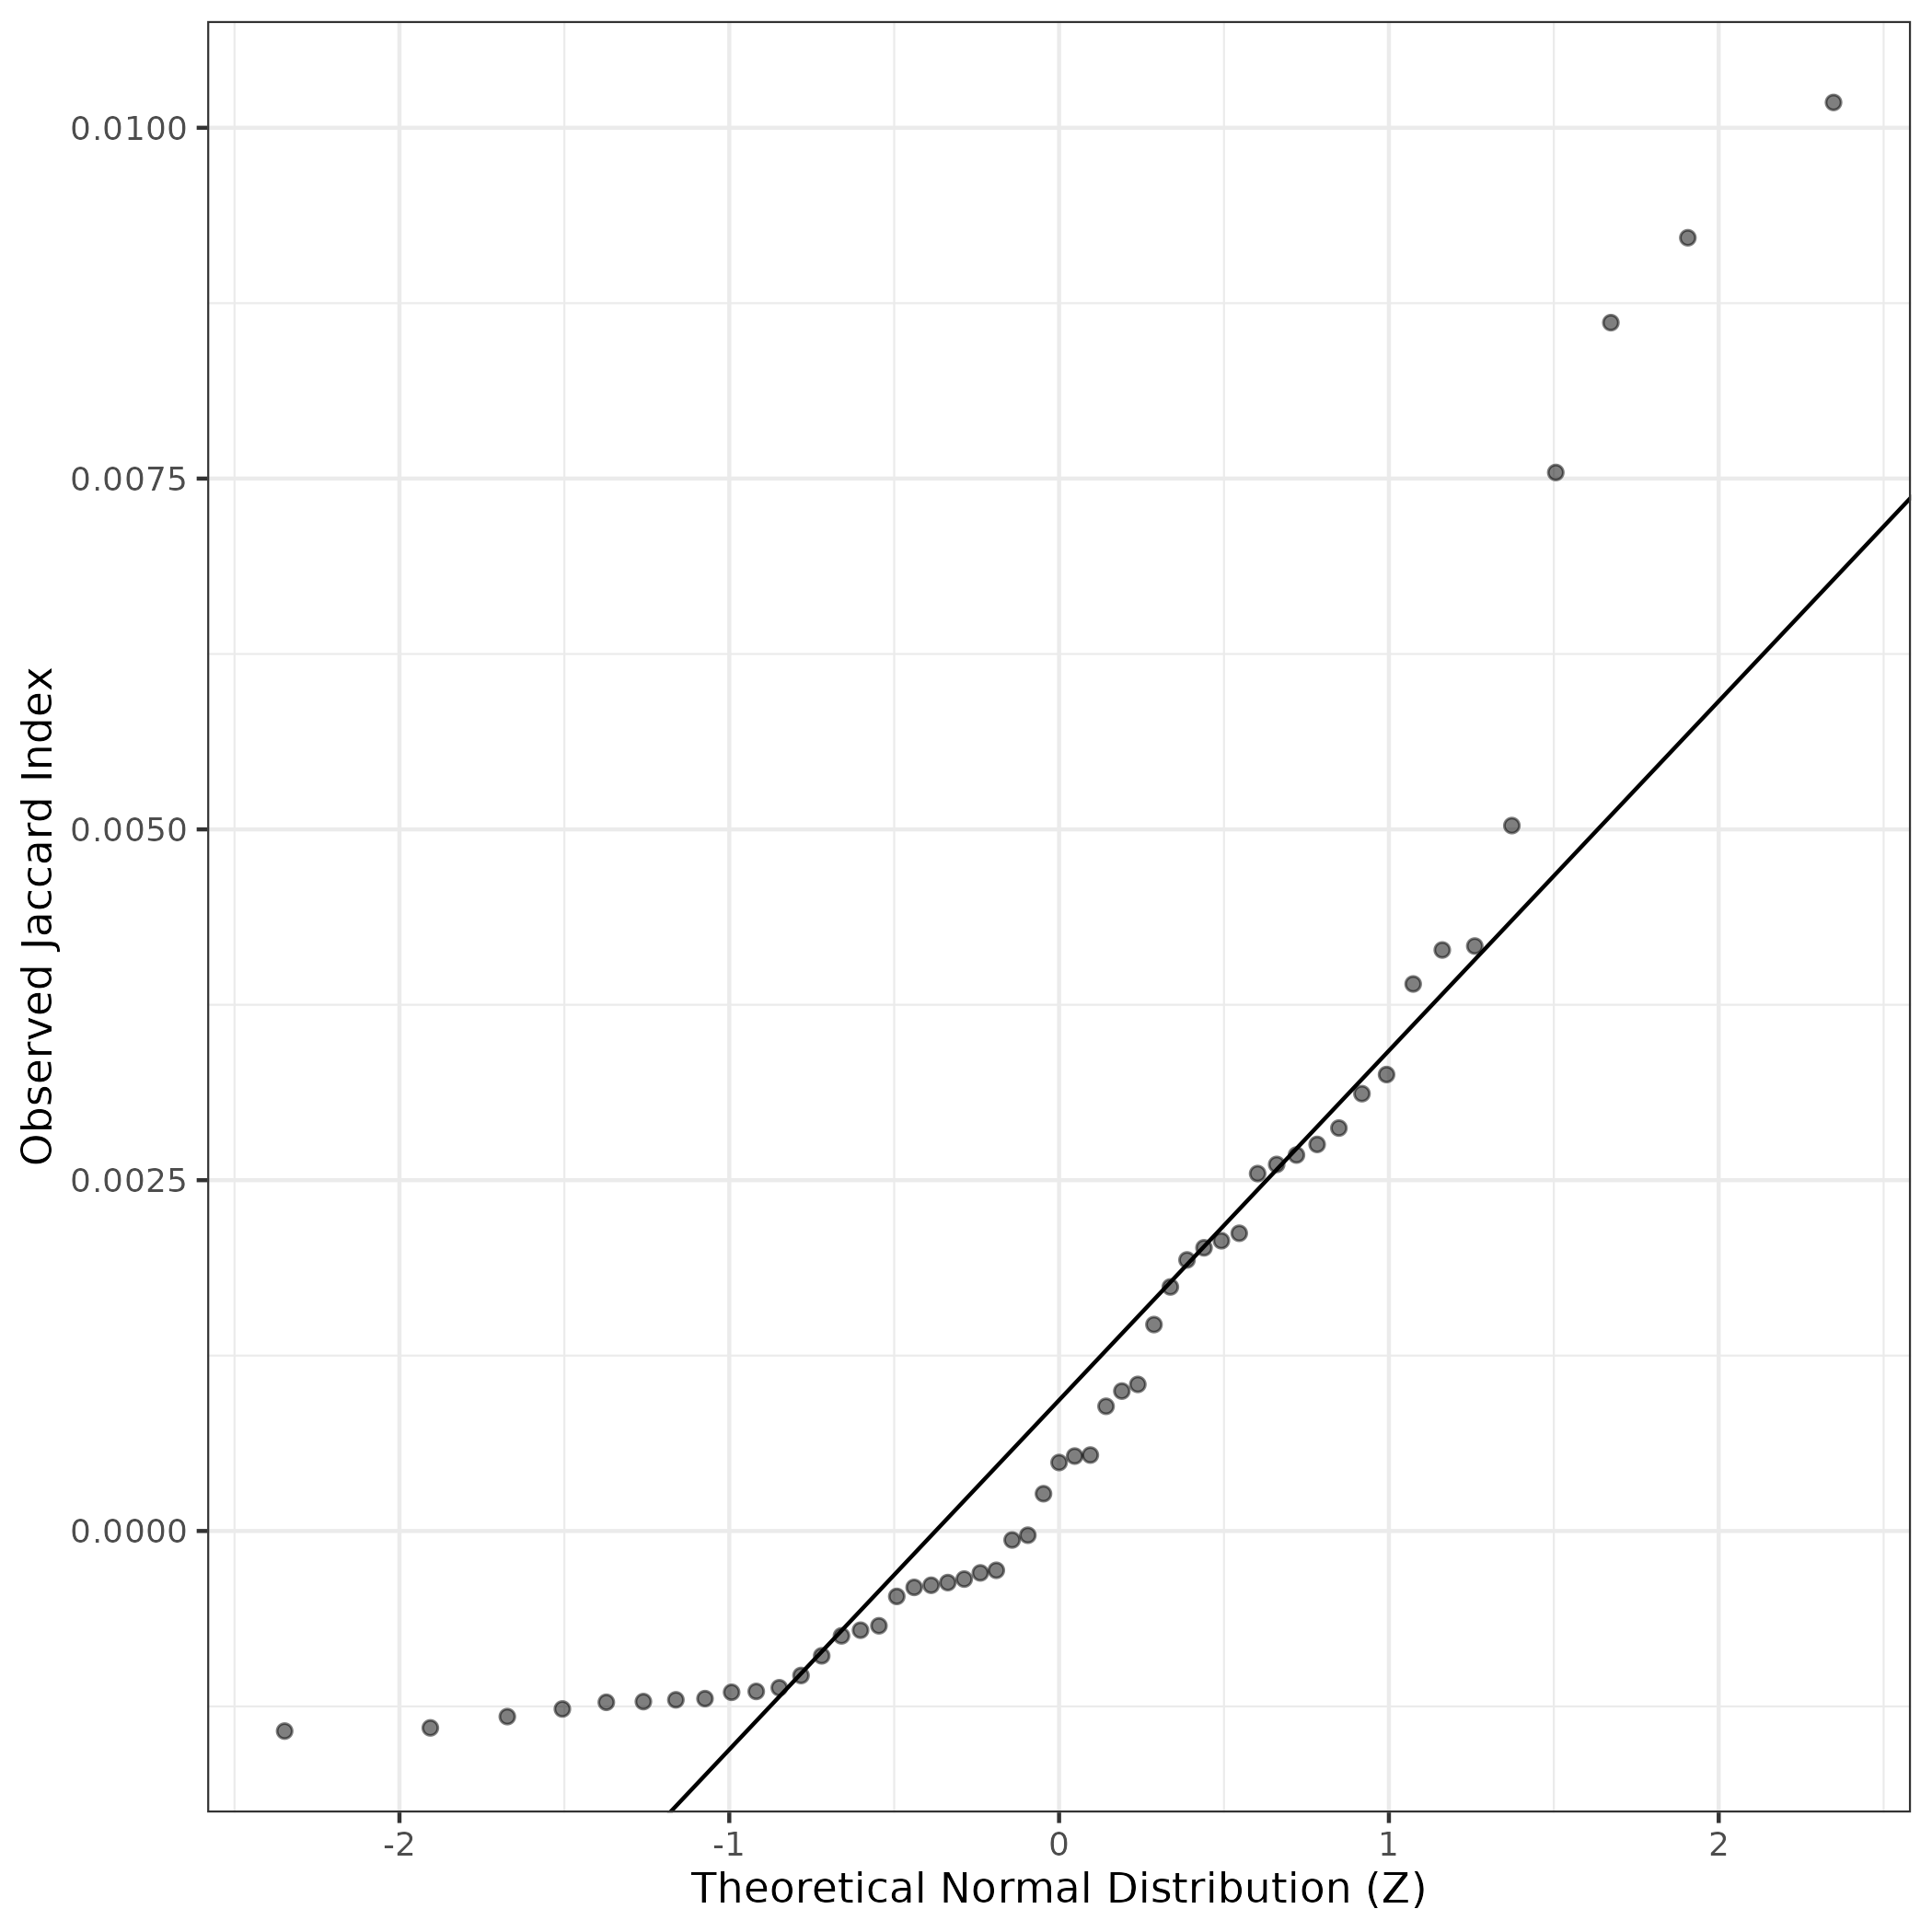
A similar QQ-plot as above, but only for instances where the H value is e.g. > 25, i.e. we are confident that the expression program is active above noise. Agreemenet between these binary vectors is tested using the Jaccard Index, with the P-values calculated by an exact test:
Interactive QQ-plot:
Singler cell type annotations for the top 50 cells on this program.
| Cell ID | Singler label | Singler Delta | Activity Score | Top Singler Raw Scores |
|---|---|---|---|---|
| ATCGGATAGTGGTTGG-1_HTA4_1019_4075 | Hepatocytes | 0.41 | 5204.69 | Raw ScoresHepatocytes: 0.62, Epithelial_cells: 0.31, Smooth_muscle_cells: 0.31, Tissue_stem_cells: 0.31, Osteoblasts: 0.3, Chondrocytes: 0.3, Fibroblasts: 0.3, Endothelial_cells: 0.28, iPS_cells: 0.27, Keratinocytes: 0.27 |
| TAACGACTCGATACAC-1_HTA4_1019_4075 | Hepatocytes | 0.27 | 4218.18 | Raw ScoresHepatocytes: 0.52, NK_cell: 0.29, Endothelial_cells: 0.29, Smooth_muscle_cells: 0.29, Osteoblasts: 0.29, Tissue_stem_cells: 0.29, Fibroblasts: 0.28, Macrophage: 0.28, Chondrocytes: 0.28, Platelets: 0.27 |
| TGTAAGCCAGGCGATA-1_HTA4_1019_4075 | Hepatocytes | 0.28 | 4137.24 | Raw ScoresHepatocytes: 0.53, Neurons: 0.31, Endothelial_cells: 0.31, iPS_cells: 0.3, Tissue_stem_cells: 0.3, Embryonic_stem_cells: 0.3, Astrocyte: 0.3, Fibroblasts: 0.3, Epithelial_cells: 0.3, Smooth_muscle_cells: 0.29 |
| GTCTACCCACTTCAGA-1_HTA4_1019_4075 | Hepatocytes | 0.36 | 4001.00 | Raw ScoresHepatocytes: 0.55, Endothelial_cells: 0.33, Smooth_muscle_cells: 0.33, Fibroblasts: 0.32, Osteoblasts: 0.32, Tissue_stem_cells: 0.32, Chondrocytes: 0.31, iPS_cells: 0.3, Epithelial_cells: 0.29, MSC: 0.28 |
| GTTGCTCCAGTCCCGA-1_HTA4_1019_4075 | Hepatocytes | 0.37 | 3522.76 | Raw ScoresHepatocytes: 0.54, Tissue_stem_cells: 0.26, Smooth_muscle_cells: 0.25, Epithelial_cells: 0.25, Chondrocytes: 0.25, Osteoblasts: 0.25, Fibroblasts: 0.25, Endothelial_cells: 0.24, iPS_cells: 0.24, Keratinocytes: 0.23 |
| ATTGTTCCATGCCATA-1_HTA4_1019_4075 | Hepatocytes | 0.35 | 3499.20 | Raw ScoresHepatocytes: 0.59, Epithelial_cells: 0.31, Endothelial_cells: 0.29, Embryonic_stem_cells: 0.29, Fibroblasts: 0.28, iPS_cells: 0.28, Smooth_muscle_cells: 0.28, Tissue_stem_cells: 0.28, Osteoblasts: 0.28, Neurons: 0.27 |
| AATTCCTTCTGTGCTC-1_HTA4_1019_4074 | Hepatocytes | 0.34 | 3492.35 | Raw ScoresHepatocytes: 0.53, Fibroblasts: 0.3, Astrocyte: 0.29, Smooth_muscle_cells: 0.29, Osteoblasts: 0.29, Embryonic_stem_cells: 0.29, Tissue_stem_cells: 0.28, iPS_cells: 0.28, Chondrocytes: 0.28, Epithelial_cells: 0.28 |
| GGATGTTCAAGTTCCA-1_HTA4_1019_4075 | Hepatocytes | 0.37 | 3487.40 | Raw ScoresHepatocytes: 0.56, Epithelial_cells: 0.32, Smooth_muscle_cells: 0.3, Tissue_stem_cells: 0.29, Fibroblasts: 0.29, Osteoblasts: 0.29, Embryonic_stem_cells: 0.29, iPS_cells: 0.28, Astrocyte: 0.28, Chondrocytes: 0.28 |
| CTGCCATAGCGATCGA-1_HTA4_1019_4074 | Hepatocytes | 0.35 | 3274.78 | Raw ScoresHepatocytes: 0.5, Epithelial_cells: 0.24, Tissue_stem_cells: 0.21, Smooth_muscle_cells: 0.2, Astrocyte: 0.2, Chondrocytes: 0.2, Fibroblasts: 0.2, Keratinocytes: 0.2, Osteoblasts: 0.2, iPS_cells: 0.19 |
| AGTCAACGTCCTCCAT-1_HTA4_1019_4075 | Hepatocytes | 0.32 | 3133.13 | Raw ScoresHepatocytes: 0.53, Macrophage: 0.29, DC: 0.28, Tissue_stem_cells: 0.27, Osteoblasts: 0.27, Smooth_muscle_cells: 0.26, Fibroblasts: 0.26, Endothelial_cells: 0.26, Epithelial_cells: 0.25, Monocyte: 0.25 |
| CACTTCGCACTTCAGA-1_HTA4_1019_4075 | Hepatocytes | 0.38 | 3125.22 | Raw ScoresHepatocytes: 0.57, Smooth_muscle_cells: 0.29, Tissue_stem_cells: 0.29, Osteoblasts: 0.28, Fibroblasts: 0.28, Epithelial_cells: 0.27, Chondrocytes: 0.27, Endothelial_cells: 0.27, iPS_cells: 0.26, MSC: 0.25 |
| GATTCTTTCAAGCTGT-1_HTA4_1019_4075 | Hepatocytes | 0.37 | 3114.78 | Raw ScoresHepatocytes: 0.54, Epithelial_cells: 0.25, Smooth_muscle_cells: 0.25, Osteoblasts: 0.24, Tissue_stem_cells: 0.24, Fibroblasts: 0.23, Chondrocytes: 0.22, Endothelial_cells: 0.22, iPS_cells: 0.22, Astrocyte: 0.21 |
| ATTCACTGTGAGTTGG-1_HTA4_1019_4074 | Hepatocytes | 0.34 | 3059.45 | Raw ScoresHepatocytes: 0.52, Epithelial_cells: 0.31, Osteoblasts: 0.31, Fibroblasts: 0.3, Smooth_muscle_cells: 0.3, Tissue_stem_cells: 0.29, Chondrocytes: 0.29, Astrocyte: 0.29, Embryonic_stem_cells: 0.28, Endothelial_cells: 0.28 |
| TACGTCCTCAAACTGC-1_HTA4_1019_4074 | Hepatocytes | 0.37 | 2833.16 | Raw ScoresHepatocytes: 0.55, Osteoblasts: 0.28, Tissue_stem_cells: 0.28, Chondrocytes: 0.27, Smooth_muscle_cells: 0.27, Fibroblasts: 0.27, Epithelial_cells: 0.27, Endothelial_cells: 0.25, iPS_cells: 0.25, Embryonic_stem_cells: 0.24 |
| TGACTCCTCAGAGCGA-1_HTA4_1019_4075 | Hepatocytes | 0.35 | 2819.96 | Raw ScoresHepatocytes: 0.54, Epithelial_cells: 0.28, Tissue_stem_cells: 0.27, Smooth_muscle_cells: 0.27, Fibroblasts: 0.27, Chondrocytes: 0.26, Osteoblasts: 0.26, Endothelial_cells: 0.25, Embryonic_stem_cells: 0.24, iPS_cells: 0.24 |
| CTATAGGAGTCTCGTA-1_HTA4_1019_4075 | Hepatocytes | 0.37 | 2791.25 | Raw ScoresHepatocytes: 0.53, Epithelial_cells: 0.23, Tissue_stem_cells: 0.23, Smooth_muscle_cells: 0.22, Osteoblasts: 0.22, Chondrocytes: 0.22, Fibroblasts: 0.21, Endothelial_cells: 0.2, Keratinocytes: 0.2, Astrocyte: 0.19 |
| CAAGCTACACAACGCC-1_HTA4_1019_4074 | Hepatocytes | 0.37 | 2694.32 | Raw ScoresHepatocytes: 0.53, Smooth_muscle_cells: 0.27, Fibroblasts: 0.27, Tissue_stem_cells: 0.27, Osteoblasts: 0.27, Chondrocytes: 0.26, iPS_cells: 0.25, Epithelial_cells: 0.25, Endothelial_cells: 0.25, Astrocyte: 0.24 |
| GGGCGTTTCGGAGTGA-1_HTA4_1019_4075 | Hepatocytes | 0.37 | 2661.64 | Raw ScoresHepatocytes: 0.52, Tissue_stem_cells: 0.25, Smooth_muscle_cells: 0.24, Osteoblasts: 0.24, Epithelial_cells: 0.24, Chondrocytes: 0.24, Fibroblasts: 0.24, Endothelial_cells: 0.22, iPS_cells: 0.22, Keratinocytes: 0.21 |
| AACCAACGTTTGAACC-1_HTA4_1019_4075 | Hepatocytes | 0.35 | 2661.46 | Raw ScoresHepatocytes: 0.54, Epithelial_cells: 0.27, Tissue_stem_cells: 0.27, Chondrocytes: 0.27, Smooth_muscle_cells: 0.26, Fibroblasts: 0.26, Osteoblasts: 0.26, Embryonic_stem_cells: 0.25, iPS_cells: 0.25, Endothelial_cells: 0.25 |
| TACCGAACACGCTGTG-1_HTA4_1019_4075 | Hepatocytes | 0.34 | 2657.11 | Raw ScoresHepatocytes: 0.52, Osteoblasts: 0.31, Fibroblasts: 0.31, Smooth_muscle_cells: 0.31, Endothelial_cells: 0.31, Tissue_stem_cells: 0.31, Chondrocytes: 0.3, iPS_cells: 0.29, MSC: 0.27, Epithelial_cells: 0.27 |
| TCGATTTGTTTCGTTT-1_HTA4_1019_4074 | Hepatocytes | 0.34 | 2539.46 | Raw ScoresHepatocytes: 0.54, Smooth_muscle_cells: 0.34, Fibroblasts: 0.34, Osteoblasts: 0.33, Tissue_stem_cells: 0.33, Endothelial_cells: 0.32, Chondrocytes: 0.32, iPS_cells: 0.32, Epithelial_cells: 0.31, MSC: 0.3 |
| TGACGCGAGACAACTA-1_HTA4_1019_4075 | Hepatocytes | 0.36 | 2504.01 | Raw ScoresHepatocytes: 0.56, Smooth_muscle_cells: 0.29, Osteoblasts: 0.28, Tissue_stem_cells: 0.28, Epithelial_cells: 0.28, Fibroblasts: 0.28, Chondrocytes: 0.27, Endothelial_cells: 0.27, iPS_cells: 0.26, Astrocyte: 0.24 |
| TTACCATAGACTAGAT-1_HTA4_1019_4074 | Hepatocytes | 0.35 | 2421.56 | Raw ScoresHepatocytes: 0.54, Epithelial_cells: 0.28, Smooth_muscle_cells: 0.27, Fibroblasts: 0.27, Osteoblasts: 0.27, Tissue_stem_cells: 0.26, Endothelial_cells: 0.25, Chondrocytes: 0.25, iPS_cells: 0.25, Keratinocytes: 0.25 |
| CAAGCTACAGGCGATA-1_HTA4_1019_4075 | Hepatocytes | 0.39 | 2419.15 | Raw ScoresHepatocytes: 0.58, Epithelial_cells: 0.29, Tissue_stem_cells: 0.28, Osteoblasts: 0.27, Smooth_muscle_cells: 0.27, Fibroblasts: 0.27, Chondrocytes: 0.26, Endothelial_cells: 0.25, Keratinocytes: 0.25, iPS_cells: 0.24 |
| TCGTCCAGTTGAAGTA-1_HTA4_1019_4075 | Hepatocytes | 0.37 | 2302.95 | Raw ScoresHepatocytes: 0.52, Epithelial_cells: 0.27, Smooth_muscle_cells: 0.26, Osteoblasts: 0.26, Fibroblasts: 0.25, Tissue_stem_cells: 0.25, Chondrocytes: 0.24, Endothelial_cells: 0.24, iPS_cells: 0.24, Astrocyte: 0.23 |
| CCGTTCAAGGAAAGGT-1_HTA4_1019_4075 | Hepatocytes | 0.36 | 2280.51 | Raw ScoresHepatocytes: 0.52, Tissue_stem_cells: 0.25, Smooth_muscle_cells: 0.25, Epithelial_cells: 0.24, Osteoblasts: 0.24, Fibroblasts: 0.23, Chondrocytes: 0.23, Endothelial_cells: 0.23, iPS_cells: 0.22, Keratinocytes: 0.21 |
| CATGCGGCAAGCCATT-1_HTA4_1019_4074 | Hepatocytes | 0.37 | 2244.60 | Raw ScoresHepatocytes: 0.55, Smooth_muscle_cells: 0.3, Fibroblasts: 0.29, Tissue_stem_cells: 0.29, Osteoblasts: 0.29, Endothelial_cells: 0.29, Chondrocytes: 0.28, Epithelial_cells: 0.28, iPS_cells: 0.27, Astrocyte: 0.26 |
| CAGATCAAGAGAGCAA-1_HTA4_1019_4075 | Hepatocytes | 0.35 | 2202.26 | Raw ScoresHepatocytes: 0.53, Tissue_stem_cells: 0.28, Osteoblasts: 0.27, Smooth_muscle_cells: 0.27, Epithelial_cells: 0.27, Fibroblasts: 0.27, Chondrocytes: 0.26, Endothelial_cells: 0.25, iPS_cells: 0.24, Astrocyte: 0.24 |
| ATGCCTCGTTCGTACA-1_HTA4_1019_4075 | Hepatocytes | 0.35 | 2201.04 | Raw ScoresHepatocytes: 0.54, Epithelial_cells: 0.26, Osteoblasts: 0.25, Tissue_stem_cells: 0.25, Smooth_muscle_cells: 0.24, Fibroblasts: 0.24, Chondrocytes: 0.24, Astrocyte: 0.24, Endothelial_cells: 0.23, iPS_cells: 0.23 |
| TCGGTCTAGACTCATC-1_HTA4_1019_4075 | Hepatocytes | 0.35 | 2158.01 | Raw ScoresHepatocytes: 0.49, Tissue_stem_cells: 0.22, Chondrocytes: 0.21, Smooth_muscle_cells: 0.21, Epithelial_cells: 0.2, Osteoblasts: 0.2, Fibroblasts: 0.2, Endothelial_cells: 0.19, Keratinocytes: 0.19, iPS_cells: 0.19 |
| TGATTTCAGGCTCACC-1_HTA4_1019_4074 | Hepatocytes | 0.35 | 2148.56 | Raw ScoresHepatocytes: 0.5, Epithelial_cells: 0.24, Smooth_muscle_cells: 0.22, Osteoblasts: 0.22, Tissue_stem_cells: 0.22, Embryonic_stem_cells: 0.21, iPS_cells: 0.21, Fibroblasts: 0.21, Chondrocytes: 0.21, Astrocyte: 0.21 |
| TTGAACGTCAGCCCAG-1_HTA4_1019_4075 | Hepatocytes | 0.34 | 2127.19 | Raw ScoresHepatocytes: 0.52, Smooth_muscle_cells: 0.27, Osteoblasts: 0.27, Fibroblasts: 0.26, Epithelial_cells: 0.26, Tissue_stem_cells: 0.26, Chondrocytes: 0.25, iPS_cells: 0.25, Endothelial_cells: 0.24, Astrocyte: 0.24 |
| AAACCCAAGCGATGGT-1_HTA4_1019_4075 | Hepatocytes | 0.35 | 2060.55 | Raw ScoresHepatocytes: 0.53, Smooth_muscle_cells: 0.26, Tissue_stem_cells: 0.26, Osteoblasts: 0.26, Fibroblasts: 0.26, Epithelial_cells: 0.26, Chondrocytes: 0.25, Endothelial_cells: 0.24, iPS_cells: 0.24, Keratinocytes: 0.23 |
| TTCCTCTAGACTGTTC-1_HTA4_1019_4075 | Hepatocytes | 0.35 | 2051.03 | Raw ScoresHepatocytes: 0.49, Fibroblasts: 0.27, Smooth_muscle_cells: 0.27, Tissue_stem_cells: 0.26, Osteoblasts: 0.26, Chondrocytes: 0.25, iPS_cells: 0.24, Endothelial_cells: 0.23, MSC: 0.23, Epithelial_cells: 0.22 |
| GACATCACACCGTCTT-1_HTA4_1019_4075 | Hepatocytes | 0.37 | 2027.39 | Raw ScoresHepatocytes: 0.54, Epithelial_cells: 0.26, Smooth_muscle_cells: 0.26, Tissue_stem_cells: 0.25, Osteoblasts: 0.25, Chondrocytes: 0.24, Fibroblasts: 0.24, Endothelial_cells: 0.24, iPS_cells: 0.23, Astrocyte: 0.22 |
| GTACAACAGGTTTACC-1_HTA4_1019_4075 | Hepatocytes | 0.34 | 2009.49 | Raw ScoresHepatocytes: 0.5, Smooth_muscle_cells: 0.25, Tissue_stem_cells: 0.25, Osteoblasts: 0.24, Fibroblasts: 0.24, Epithelial_cells: 0.24, Chondrocytes: 0.23, Endothelial_cells: 0.23, Keratinocytes: 0.22, iPS_cells: 0.21 |
| CTGCCATCACTACTTT-1_HTA4_1019_4075 | Hepatocytes | 0.36 | 2002.49 | Raw ScoresHepatocytes: 0.55, Epithelial_cells: 0.26, Smooth_muscle_cells: 0.25, Osteoblasts: 0.25, Tissue_stem_cells: 0.25, Endothelial_cells: 0.24, Fibroblasts: 0.24, Chondrocytes: 0.23, iPS_cells: 0.23, Astrocyte: 0.23 |
| GGGACAATCAACTTTC-1_HTA4_1019_4075 | Hepatocytes | 0.36 | 1973.18 | Raw ScoresHepatocytes: 0.53, Smooth_muscle_cells: 0.26, Epithelial_cells: 0.26, Fibroblasts: 0.25, Tissue_stem_cells: 0.25, Osteoblasts: 0.25, Endothelial_cells: 0.24, Chondrocytes: 0.24, Keratinocytes: 0.23, iPS_cells: 0.23 |
| ATTTACCGTACACGCC-1_HTA4_1019_4075 | Hepatocytes | 0.35 | 1954.65 | Raw ScoresHepatocytes: 0.54, Smooth_muscle_cells: 0.28, Tissue_stem_cells: 0.27, Osteoblasts: 0.27, Fibroblasts: 0.27, Chondrocytes: 0.26, Endothelial_cells: 0.26, Epithelial_cells: 0.26, iPS_cells: 0.26, Astrocyte: 0.24 |
| ATTCCTACAATGCTCA-1_HTA4_1019_4075 | Hepatocytes | 0.36 | 1953.85 | Raw ScoresHepatocytes: 0.51, Smooth_muscle_cells: 0.24, Tissue_stem_cells: 0.23, Chondrocytes: 0.23, Osteoblasts: 0.23, Epithelial_cells: 0.23, Fibroblasts: 0.23, Endothelial_cells: 0.21, iPS_cells: 0.21, Keratinocytes: 0.2 |
| AAACGCTTCGTTCGCT-1_HTA4_1019_4075 | Hepatocytes | 0.33 | 1931.15 | Raw ScoresHepatocytes: 0.49, Epithelial_cells: 0.25, Smooth_muscle_cells: 0.23, Osteoblasts: 0.23, Fibroblasts: 0.22, Keratinocytes: 0.22, Endothelial_cells: 0.22, Tissue_stem_cells: 0.22, Astrocyte: 0.21, iPS_cells: 0.21 |
| ATGAGTCTCTTTGCGC-1_HTA4_1019_4075 | Hepatocytes | 0.36 | 1895.46 | Raw ScoresHepatocytes: 0.52, Smooth_muscle_cells: 0.24, Tissue_stem_cells: 0.24, Epithelial_cells: 0.24, Osteoblasts: 0.24, Fibroblasts: 0.23, Chondrocytes: 0.23, Endothelial_cells: 0.23, iPS_cells: 0.21, Astrocyte: 0.21 |
| ACGTTCCTCCACTGGG-1_HTA4_1019_4075 | Hepatocytes | 0.35 | 1878.15 | Raw ScoresHepatocytes: 0.52, Tissue_stem_cells: 0.27, Smooth_muscle_cells: 0.26, Osteoblasts: 0.26, Fibroblasts: 0.26, Chondrocytes: 0.26, Epithelial_cells: 0.25, iPS_cells: 0.24, Endothelial_cells: 0.23, Keratinocytes: 0.22 |
| CACATGAGTCTCGGGT-1_HTA4_1019_4074 | Hepatocytes | 0.34 | 1875.72 | Raw ScoresHepatocytes: 0.5, Smooth_muscle_cells: 0.25, Tissue_stem_cells: 0.25, Chondrocytes: 0.25, Osteoblasts: 0.25, Fibroblasts: 0.24, Epithelial_cells: 0.24, Astrocyte: 0.23, Endothelial_cells: 0.23, iPS_cells: 0.23 |
| ACACCAATCAGTAGGG-1_HTA4_1019_4075 | Hepatocytes | 0.39 | 1869.78 | Raw ScoresHepatocytes: 0.57, Epithelial_cells: 0.29, Tissue_stem_cells: 0.27, Smooth_muscle_cells: 0.26, Osteoblasts: 0.26, Chondrocytes: 0.25, Fibroblasts: 0.25, Endothelial_cells: 0.25, Keratinocytes: 0.25, iPS_cells: 0.23 |
| TCTGGCTTCAATGCAC-1_HTA4_1019_4075 | Hepatocytes | 0.36 | 1859.83 | Raw ScoresHepatocytes: 0.53, Smooth_muscle_cells: 0.25, Tissue_stem_cells: 0.25, Osteoblasts: 0.25, Fibroblasts: 0.25, Chondrocytes: 0.24, Epithelial_cells: 0.24, Endothelial_cells: 0.23, iPS_cells: 0.23, MSC: 0.21 |
| TTCCTTCGTTGGGTAG-1_HTA4_1019_4074 | Hepatocytes | 0.36 | 1859.26 | Raw ScoresHepatocytes: 0.55, Tissue_stem_cells: 0.29, Epithelial_cells: 0.28, Smooth_muscle_cells: 0.28, Chondrocytes: 0.28, Fibroblasts: 0.27, Osteoblasts: 0.27, Endothelial_cells: 0.26, iPS_cells: 0.25, Keratinocytes: 0.25 |
| CCCTGATTCTCGGTAA-1_HTA4_1019_4075 | Hepatocytes | 0.35 | 1847.41 | Raw ScoresHepatocytes: 0.51, Smooth_muscle_cells: 0.25, Tissue_stem_cells: 0.25, Osteoblasts: 0.25, Epithelial_cells: 0.24, Fibroblasts: 0.24, Chondrocytes: 0.24, Endothelial_cells: 0.23, iPS_cells: 0.22, Neurons: 0.21 |
| CAGGCCATCCTATTTG-1_HTA4_1019_4074 | Hepatocytes | 0.34 | 1845.89 | Raw ScoresHepatocytes: 0.51, Epithelial_cells: 0.3, Embryonic_stem_cells: 0.28, Smooth_muscle_cells: 0.28, Fibroblasts: 0.27, Neurons: 0.27, Osteoblasts: 0.27, Astrocyte: 0.27, iPS_cells: 0.27, Tissue_stem_cells: 0.26 |
| CATCCACCAAGACGGT-1_HTA4_1019_4075 | Hepatocytes | 0.34 | 1839.86 | Raw ScoresHepatocytes: 0.5, Smooth_muscle_cells: 0.24, Tissue_stem_cells: 0.24, Fibroblasts: 0.24, Osteoblasts: 0.24, Epithelial_cells: 0.23, Chondrocytes: 0.23, Endothelial_cells: 0.22, iPS_cells: 0.22, Keratinocytes: 0.21 |
Below shows the significant enrichments of this GEP for literature curated gene lists
This data was procured from existing single cell RNA-seq maps of neuroblastoma or related relevant data.
High ranks indicate this gene is a driver of this GEP.
These curated gene list are ranked by the P-value (on this GEP) of their constituent genes.
The Mean Count column shows the mean read count in cells scoring highly (H > 50) on this gene expression program.
Inflammatory CAF
These marker genes were curated across cancer subtypes in multiple organ systems as reviewed in Lavie et. al. (PMID 35883004) and contain inflammatory specific CAF genes:
Wilcoxon ranksum test P-value for gene set overrepresentation: 2.07e-10
Mean rank of genes in gene set: 4427.48
Rank on gene expression program of genes in gene set:
| Genes | Weight | Rank | GTEx | DepMap | Decartes | Mean.Counts | Mean.TPM |
|---|---|---|---|---|---|---|---|
| ADH1B | 0.0085518 | 30 | GTEx | DepMap | Descartes | 3.42 | 376.23 |
| SERPING1 | 0.0060752 | 57 | GTEx | DepMap | Descartes | 2.43 | 624.06 |
| C1R | 0.0048012 | 80 | GTEx | DepMap | Descartes | 1.16 | 219.78 |
| C1S | 0.0041561 | 96 | GTEx | DepMap | Descartes | 1.85 | 387.95 |
| CFB | 0.0040676 | 100 | GTEx | DepMap | Descartes | 0.16 | 42.55 |
| C3 | 0.0039518 | 105 | GTEx | DepMap | Descartes | 14.11 | 1355.48 |
| SAA1 | 0.0038199 | 115 | GTEx | DepMap | Descartes | 0.23 | 210.39 |
| GPX3 | 0.0015878 | 341 | GTEx | DepMap | Descartes | 0.44 | 175.81 |
| CXCL2 | 0.0014073 | 386 | GTEx | DepMap | Descartes | 1.46 | 624.97 |
| HGF | 0.0013806 | 398 | GTEx | DepMap | Descartes | 0.52 | 71.70 |
| CXCL12 | 0.0012984 | 421 | GTEx | DepMap | Descartes | 0.29 | 69.67 |
| CXCL1 | 0.0009523 | 639 | GTEx | DepMap | Descartes | 0.05 | 33.56 |
| CCL2 | 0.0009282 | 657 | GTEx | DepMap | Descartes | 0.34 | 291.69 |
| IL1R1 | 0.0007256 | 893 | GTEx | DepMap | Descartes | 2.04 | 213.96 |
| CXCL10 | 0.0005820 | 1101 | GTEx | DepMap | Descartes | 0.03 | 16.14 |
| LIF | 0.0005548 | 1158 | GTEx | DepMap | Descartes | 0.05 | 8.24 |
| PDGFD | 0.0005398 | 1205 | GTEx | DepMap | Descartes | 0.77 | 94.40 |
| C7 | 0.0005174 | 1254 | GTEx | DepMap | Descartes | 0.92 | 131.80 |
| C1QA | 0.0004542 | 1421 | GTEx | DepMap | Descartes | 0.13 | 84.40 |
| C1QC | 0.0003425 | 1851 | GTEx | DepMap | Descartes | 0.05 | 22.85 |
| C4B | 0.0002500 | 2341 | GTEx | DepMap | Descartes | 0.02 | 1.67 |
| PDGFRA | 0.0001929 | 2788 | GTEx | DepMap | Descartes | 0.06 | 7.92 |
| CFD | 0.0001915 | 2799 | GTEx | DepMap | Descartes | 0.02 | 9.85 |
| PDPN | 0.0001910 | 2805 | GTEx | DepMap | Descartes | 0.03 | 7.72 |
| SOD2 | 0.0001764 | 2949 | GTEx | DepMap | Descartes | 0.14 | 4.26 |
| CCL8 | 0.0000741 | 4452 | GTEx | DepMap | Descartes | 0.01 | 3.79 |
| IL33 | 0.0000712 | 4513 | GTEx | DepMap | Descartes | 0.11 | 24.76 |
| CCL21 | 0.0000701 | 4537 | GTEx | DepMap | Descartes | 0.22 | 184.42 |
| IL10 | 0.0000497 | 5075 | GTEx | DepMap | Descartes | 0.00 | 1.06 |
| PDGFRB | 0.0000338 | 5576 | GTEx | DepMap | Descartes | 0.21 | 30.04 |
| CXCL14 | -0.0000026 | 8321 | GTEx | DepMap | Descartes | 0.04 | 14.44 |
| CCL7 | -0.0000039 | 8480 | GTEx | DepMap | Descartes | 0.00 | 0.15 |
| IL6 | -0.0000235 | 10665 | GTEx | DepMap | Descartes | 0.02 | 10.55 |
| CXCL9 | -0.0000347 | 11606 | GTEx | DepMap | Descartes | 0.02 | 4.12 |
| IGF1 | -0.0000437 | 12214 | GTEx | DepMap | Descartes | 0.14 | 9.57 |
| SCARA5 | -0.0000829 | 14207 | GTEx | DepMap | Descartes | 0.01 | 1.03 |
| CXCL13 | -0.0000877 | 14417 | GTEx | DepMap | Descartes | 0.01 | 6.10 |
| IGFBP6 | -0.0000902 | 14521 | GTEx | DepMap | Descartes | 0.01 | 9.52 |
| SCARA3 | -0.0001115 | 15355 | GTEx | DepMap | Descartes | 0.02 | 3.13 |
| RGMA | -0.0001724 | 17170 | GTEx | DepMap | Descartes | 0.01 | 0.60 |
PMN-MDSC
These marker genes were curated for MDSC subtypes as reviewed in Veglia et. al. (PMID 33526920):
Wilcoxon ranksum test P-value for gene set overrepresentation: 8.79e-09
Mean rank of genes in gene set: 3158.77
Rank on gene expression program of genes in gene set:
| Genes | Weight | Rank | GTEx | DepMap | Decartes | Mean.Counts | Mean.TPM |
|---|---|---|---|---|---|---|---|
| ARG1 | 0.0029616 | 152 | GTEx | DepMap | Descartes | 0.81 | 283.15 |
| SLC27A2 | 0.0015283 | 355 | GTEx | DepMap | Descartes | 0.36 | 85.55 |
| CD36 | 0.0006274 | 1023 | GTEx | DepMap | Descartes | 0.56 | 55.67 |
| STAT1 | 0.0005843 | 1097 | GTEx | DepMap | Descartes | 2.59 | 304.20 |
| IRF1 | 0.0005367 | 1211 | GTEx | DepMap | Descartes | 0.44 | 43.94 |
| IL4R | 0.0005068 | 1275 | GTEx | DepMap | Descartes | 3.11 | 400.55 |
| PTGS2 | 0.0004634 | 1385 | GTEx | DepMap | Descartes | 0.07 | 12.23 |
| HIF1A | 0.0004303 | 1495 | GTEx | DepMap | Descartes | 2.18 | 278.37 |
| STAT6 | 0.0004127 | 1558 | GTEx | DepMap | Descartes | 0.90 | 105.61 |
| TNFRSF10B | 0.0003937 | 1638 | GTEx | DepMap | Descartes | 1.45 | 175.82 |
| ANXA1 | 0.0003533 | 1807 | GTEx | DepMap | Descartes | 0.36 | 115.29 |
| TGFB1 | 0.0002760 | 2175 | GTEx | DepMap | Descartes | 0.35 | 84.44 |
| STAT3 | 0.0002300 | 2482 | GTEx | DepMap | Descartes | 7.60 | 717.60 |
| IL1B | 0.0002034 | 2692 | GTEx | DepMap | Descartes | 0.02 | 10.59 |
| S100A8 | 0.0001856 | 2864 | GTEx | DepMap | Descartes | 0.01 | 11.65 |
| CSF1 | 0.0001360 | 3404 | GTEx | DepMap | Descartes | 0.21 | 28.01 |
| CD84 | 0.0001271 | 3529 | GTEx | DepMap | Descartes | 0.06 | 4.24 |
| ITGAM | 0.0001255 | 3551 | GTEx | DepMap | Descartes | 0.06 | 8.75 |
| CD244 | 0.0000788 | 4339 | GTEx | DepMap | Descartes | 0.01 | 2.11 |
| S100A9 | 0.0000636 | 4706 | GTEx | DepMap | Descartes | 0.01 | 21.32 |
| IL6 | -0.0000235 | 10665 | GTEx | DepMap | Descartes | 0.02 | 10.55 |
| ARG2 | -0.0001332 | 16090 | GTEx | DepMap | Descartes | 0.07 | 18.85 |
M1 Macrophage
These genes were collated from multiple sources:
Wilcoxon ranksum test P-value for gene set overrepresentation: 1.77e-06
Mean rank of genes in gene set: 3974.79
Rank on gene expression program of genes in gene set:
| Genes | Weight | Rank | GTEx | DepMap | Decartes | Mean.Counts | Mean.TPM |
|---|---|---|---|---|---|---|---|
| CD14 | 0.0020225 | 244 | GTEx | DepMap | Descartes | 0.29 | 112.66 |
| CCL2 | 0.0009282 | 657 | GTEx | DepMap | Descartes | 0.34 | 291.69 |
| CXCL8 | 0.0008748 | 707 | GTEx | DepMap | Descartes | 0.18 | NA |
| CXCL10 | 0.0005820 | 1101 | GTEx | DepMap | Descartes | 0.03 | 16.14 |
| CXCL16 | 0.0005732 | 1122 | GTEx | DepMap | Descartes | 0.10 | 23.78 |
| CCL4 | 0.0003199 | 1948 | GTEx | DepMap | Descartes | 0.03 | 14.81 |
| ITGAX | 0.0002774 | 2169 | GTEx | DepMap | Descartes | 0.24 | 36.13 |
| CCL3 | 0.0002660 | 2231 | GTEx | DepMap | Descartes | 0.03 | 14.75 |
| CD80 | 0.0002120 | 2623 | GTEx | DepMap | Descartes | 0.03 | 8.09 |
| IL1B | 0.0002034 | 2692 | GTEx | DepMap | Descartes | 0.02 | 10.59 |
| CD86 | 0.0001950 | 2774 | GTEx | DepMap | Descartes | 0.16 | 40.09 |
| CXCL11 | 0.0001556 | 3161 | GTEx | DepMap | Descartes | 0.00 | 1.63 |
| IL18 | 0.0001346 | 3424 | GTEx | DepMap | Descartes | 0.16 | 57.87 |
| CCL5 | 0.0001114 | 3755 | GTEx | DepMap | Descartes | 0.04 | 31.18 |
| IL33 | 0.0000712 | 4513 | GTEx | DepMap | Descartes | 0.11 | 24.76 |
| TLR4 | 0.0000034 | 7078 | GTEx | DepMap | Descartes | 0.00 | 0.01 |
| IL6 | -0.0000235 | 10665 | GTEx | DepMap | Descartes | 0.02 | 10.55 |
| CXCL9 | -0.0000347 | 11606 | GTEx | DepMap | Descartes | 0.02 | 4.12 |
| TNF | -0.0000579 | 13051 | GTEx | DepMap | Descartes | 0.00 | 1.63 |
Below shows ranks on this GEP for literature curated gene lists for large gene sets
These include those reported as mesenchymal/adrenergic by Van Groningen et al.
High ranks indicate this gene is a driver of this GEP (note these results are not ordered).
The Mean Count column shows the mean read count in cells scoring highly (H > 50) on this gene expression program.
VanGroningen Adrenergic Genes
Adrenergic marker genes from Supplementary Table 2 of Van Groningen et al. Nature Genetics 2017. These genes were identified by differential expression analysis of mesenchymal-like and adrenergic-like neuroblastoma cell lines.
Wilcoxon ranksum test P-value for gene set overrepresentation: 1.00e+00
Mean rank of genes in gene set: 17563.92
Median rank of genes in gene set: 19333
Rank on gene expression program of top 30 genes in gene set:
| Genes | Weight | Rank | GTEx | DepMap | Descartes | Mean.Counts | Mean.TPM |
|---|---|---|---|---|---|---|---|
| DNAJB1 | 0.0008110 | 774 | GTEx | DepMap | Descartes | 0.31 | 84.21 |
| EML4 | 0.0007915 | 803 | GTEx | DepMap | Descartes | 8.42 | 725.09 |
| GRB10 | 0.0007748 | 827 | GTEx | DepMap | Descartes | 2.38 | 243.85 |
| FAM107B | 0.0006444 | 998 | GTEx | DepMap | Descartes | 4.10 | 504.85 |
| NFIL3 | 0.0005665 | 1138 | GTEx | DepMap | Descartes | 1.54 | 337.35 |
| DAPK1 | 0.0005243 | 1237 | GTEx | DepMap | Descartes | 3.49 | 296.00 |
| MYRIP | 0.0004865 | 1325 | GTEx | DepMap | Descartes | 2.06 | 201.94 |
| LYN | 0.0003757 | 1707 | GTEx | DepMap | Descartes | 1.16 | 107.39 |
| GGH | 0.0003428 | 1849 | GTEx | DepMap | Descartes | 0.12 | 60.09 |
| IRS2 | 0.0003342 | 1882 | GTEx | DepMap | Descartes | 1.29 | 75.59 |
| ABCB1 | 0.0002542 | 2304 | GTEx | DepMap | Descartes | 3.13 | 254.35 |
| GLRX | 0.0002215 | 2557 | GTEx | DepMap | Descartes | 0.32 | 39.22 |
| GNB1 | 0.0001702 | 3017 | GTEx | DepMap | Descartes | 3.52 | 598.76 |
| RBBP8 | 0.0001677 | 3036 | GTEx | DepMap | Descartes | 0.74 | 110.11 |
| MTCL1 | 0.0001583 | 3134 | GTEx | DepMap | Descartes | 0.33 | NA |
| KLF13 | 0.0001567 | 3147 | GTEx | DepMap | Descartes | 0.47 | 41.61 |
| CXADR | 0.0001495 | 3243 | GTEx | DepMap | Descartes | 1.48 | 122.94 |
| TUBB4B | 0.0001251 | 3554 | GTEx | DepMap | Descartes | 0.23 | 69.87 |
| NET1 | 0.0001024 | 3896 | GTEx | DepMap | Descartes | 0.19 | 26.83 |
| PTS | 0.0000974 | 3979 | GTEx | DepMap | Descartes | 0.94 | 391.94 |
| SETD7 | 0.0000884 | 4137 | GTEx | DepMap | Descartes | 0.49 | 35.23 |
| DIABLO | 0.0000870 | 4169 | GTEx | DepMap | Descartes | 0.00 | 0.03 |
| TMEM97 | 0.0000597 | 4799 | GTEx | DepMap | Descartes | 0.11 | 26.85 |
| ZNF22 | 0.0000212 | 6080 | GTEx | DepMap | Descartes | 0.07 | 18.00 |
| INO80C | 0.0000102 | 6608 | GTEx | DepMap | Descartes | 0.00 | 0.25 |
| HEY1 | 0.0000075 | 6771 | GTEx | DepMap | Descartes | 0.01 | 1.76 |
| AKAP12 | 0.0000054 | 6919 | GTEx | DepMap | Descartes | 3.74 | 239.10 |
| SATB1 | 0.0000043 | 7011 | GTEx | DepMap | Descartes | 0.01 | 0.47 |
| HK2 | 0.0000002 | 7369 | GTEx | DepMap | Descartes | 0.03 | 2.82 |
| PEG3 | -0.0000128 | 9576 | GTEx | DepMap | Descartes | 0.00 | NA |
VanGroningen Mesenchymal Genes
Mesenchymal marker genes from Supplementary Table 2 of Van Groningen et al. Nature Genetics 2017. These genes were identified by differential expression analysis of mesenchymal-like and adrenergic-like neuroblastoma cell lines.
Wilcoxon ranksum test P-value for gene set overrepresentation: 4.30e-66
Mean rank of genes in gene set: 5651.27
Median rank of genes in gene set: 2826
Rank on gene expression program of top 30 genes in gene set:
| Genes | Weight | Rank | GTEx | DepMap | Descartes | Mean.Counts | Mean.TPM |
|---|---|---|---|---|---|---|---|
| APOE | 0.0065697 | 51 | GTEx | DepMap | Descartes | 4.76 | 2600.75 |
| IFITM3 | 0.0045063 | 89 | GTEx | DepMap | Descartes | 0.86 | 800.21 |
| GDF15 | 0.0038085 | 117 | GTEx | DepMap | Descartes | 0.57 | 265.12 |
| HLA-B | 0.0032528 | 137 | GTEx | DepMap | Descartes | 1.02 | 420.05 |
| KLF6 | 0.0031648 | 142 | GTEx | DepMap | Descartes | 6.18 | 696.28 |
| SDC4 | 0.0031610 | 143 | GTEx | DepMap | Descartes | 3.90 | 735.85 |
| A2M | 0.0030456 | 148 | GTEx | DepMap | Descartes | 24.13 | 2407.43 |
| MGST1 | 0.0029358 | 155 | GTEx | DepMap | Descartes | 3.66 | 796.19 |
| INSIG1 | 0.0028081 | 163 | GTEx | DepMap | Descartes | 2.57 | 476.80 |
| CFH | 0.0027788 | 164 | GTEx | DepMap | Descartes | 9.18 | 626.15 |
| CPS1 | 0.0025372 | 182 | GTEx | DepMap | Descartes | 7.52 | 595.78 |
| B2M | 0.0023570 | 200 | GTEx | DepMap | Descartes | 5.20 | 1435.98 |
| IL6ST | 0.0022493 | 206 | GTEx | DepMap | Descartes | 4.80 | 268.90 |
| EGR1 | 0.0021784 | 216 | GTEx | DepMap | Descartes | 2.32 | 462.30 |
| HLA-A | 0.0020565 | 237 | GTEx | DepMap | Descartes | 1.03 | 122.80 |
| TNFRSF12A | 0.0019986 | 249 | GTEx | DepMap | Descartes | 0.54 | 171.63 |
| KLF4 | 0.0019575 | 251 | GTEx | DepMap | Descartes | 0.35 | 75.78 |
| ZFP36L1 | 0.0019515 | 254 | GTEx | DepMap | Descartes | 1.74 | 332.40 |
| THBS1 | 0.0018990 | 265 | GTEx | DepMap | Descartes | 3.24 | 280.64 |
| HLA-C | 0.0017776 | 283 | GTEx | DepMap | Descartes | 0.49 | 165.46 |
| ID1 | 0.0017704 | 285 | GTEx | DepMap | Descartes | 0.68 | 299.77 |
| SLC38A2 | 0.0017017 | 305 | GTEx | DepMap | Descartes | 11.24 | 1091.76 |
| PTPRK | 0.0017000 | 307 | GTEx | DepMap | Descartes | 10.31 | NA |
| SLC30A1 | 0.0016739 | 317 | GTEx | DepMap | Descartes | 0.30 | 27.87 |
| VCL | 0.0016693 | 321 | GTEx | DepMap | Descartes | 4.11 | 269.96 |
| YAP1 | 0.0016535 | 326 | GTEx | DepMap | Descartes | 3.29 | 305.16 |
| TM4SF1 | 0.0016386 | 331 | GTEx | DepMap | Descartes | 0.61 | 108.96 |
| PDLIM1 | 0.0015161 | 361 | GTEx | DepMap | Descartes | 1.82 | 649.88 |
| DUSP6 | 0.0015092 | 363 | GTEx | DepMap | Descartes | 1.22 | 171.84 |
| RRBP1 | 0.0015056 | 364 | GTEx | DepMap | Descartes | 3.83 | 366.06 |
Descartes adrenocortical markers
Top 50 marker genes of adrenocortical cells in the Decartes fetal adrenal single cell map (https://atlas.brotmanbaty.org/bbi/human-gene-expression-during-development/cell/adrenocortical/in/adrenal)
Wilcoxon ranksum test P-value for gene set overrepresentation: 1.32e-04
Mean rank of genes in gene set: 7064.33
Median rank of genes in gene set: 4391
Rank on gene expression program of top 30 genes in gene set:
| Genes | Weight | Rank | GTEx | DepMap | Descartes | Mean.Counts | Mean.TPM |
|---|---|---|---|---|---|---|---|
| APOC1 | 0.0155098 | 6 | GTEx | DepMap | Descartes | 6.17 | 6328.76 |
| SULT2A1 | 0.0032136 | 140 | GTEx | DepMap | Descartes | 3.37 | 853.56 |
| DHCR24 | 0.0017609 | 289 | GTEx | DepMap | Descartes | 2.56 | 226.34 |
| LDLR | 0.0010249 | 574 | GTEx | DepMap | Descartes | 6.46 | 567.65 |
| MSMO1 | 0.0010235 | 576 | GTEx | DepMap | Descartes | 1.27 | 303.29 |
| BAIAP2L1 | 0.0008413 | 740 | GTEx | DepMap | Descartes | 2.97 | 360.81 |
| DHCR7 | 0.0007041 | 916 | GTEx | DepMap | Descartes | 0.18 | 37.07 |
| TM7SF2 | 0.0005223 | 1241 | GTEx | DepMap | Descartes | 0.19 | 47.66 |
| POR | 0.0004615 | 1397 | GTEx | DepMap | Descartes | 7.79 | 1349.43 |
| CLU | 0.0004591 | 1404 | GTEx | DepMap | Descartes | 1.90 | 438.54 |
| CYP17A1 | 0.0004310 | 1491 | GTEx | DepMap | Descartes | 0.45 | 45.44 |
| PAPSS2 | 0.0003475 | 1826 | GTEx | DepMap | Descartes | 2.47 | 269.00 |
| HMGCS1 | 0.0003414 | 1858 | GTEx | DepMap | Descartes | 2.51 | 222.49 |
| CYP21A2 | 0.0003064 | 2005 | GTEx | DepMap | Descartes | 0.58 | 60.31 |
| STAR | 0.0002561 | 2288 | GTEx | DepMap | Descartes | 0.61 | 36.90 |
| HSPD1 | 0.0002389 | 2419 | GTEx | DepMap | Descartes | 3.35 | 667.81 |
| HMGCR | 0.0001896 | 2823 | GTEx | DepMap | Descartes | 0.82 | 85.35 |
| FDX1 | 0.0001855 | 2865 | GTEx | DepMap | Descartes | 1.88 | 169.86 |
| FREM2 | 0.0001853 | 2869 | GTEx | DepMap | Descartes | 0.09 | 3.16 |
| ERN1 | 0.0001826 | 2893 | GTEx | DepMap | Descartes | 2.84 | 155.48 |
| NPC1 | 0.0001003 | 3932 | GTEx | DepMap | Descartes | 1.36 | 127.33 |
| CYP11B1 | 0.0000921 | 4072 | GTEx | DepMap | Descartes | 0.81 | 45.62 |
| CYB5B | 0.0000760 | 4391 | GTEx | DepMap | Descartes | 0.48 | 46.78 |
| HSPE1 | 0.0000745 | 4444 | GTEx | DepMap | Descartes | 0.32 | 171.49 |
| FDXR | 0.0000710 | 4522 | GTEx | DepMap | Descartes | 0.10 | 11.82 |
| SH3BP5 | 0.0000709 | 4523 | GTEx | DepMap | Descartes | 1.13 | 139.10 |
| MC2R | 0.0000606 | 4774 | GTEx | DepMap | Descartes | 0.10 | 5.48 |
| INHA | 0.0000400 | 5376 | GTEx | DepMap | Descartes | 0.02 | 3.30 |
| CYP11A1 | 0.0000158 | 6322 | GTEx | DepMap | Descartes | 0.39 | 40.65 |
| SCARB1 | 0.0000100 | 6619 | GTEx | DepMap | Descartes | 3.24 | 173.56 |
Descartes chromaffin markers
Top 50 marker genes of chromaffin cells in the Decartes fetal adrenal single cell map (https://atlas.brotmanbaty.org/bbi/human-gene-expression-during-development/cell/chromaffin/in/adrenal)
Wilcoxon ranksum test P-value for gene set overrepresentation: 1.00e+00
Mean rank of genes in gene set: 19313.09
Median rank of genes in gene set: 20049
Rank on gene expression program of top 30 genes in gene set:
| Genes | Weight | Rank | GTEx | DepMap | Descartes | Mean.Counts | Mean.TPM |
|---|---|---|---|---|---|---|---|
| GREM1 | 0.0002130 | 2615 | GTEx | DepMap | Descartes | 0.08 | 4.66 |
| NPY | -0.0000660 | 13458 | GTEx | DepMap | Descartes | 0.10 | 66.13 |
| PLXNA4 | -0.0001246 | 15805 | GTEx | DepMap | Descartes | 0.26 | 10.75 |
| RPH3A | -0.0001387 | 16273 | GTEx | DepMap | Descartes | 0.03 | 3.52 |
| ANKFN1 | -0.0002906 | 19067 | GTEx | DepMap | Descartes | 0.07 | 7.99 |
| EYA4 | -0.0003036 | 19190 | GTEx | DepMap | Descartes | 0.05 | 4.48 |
| GAL | -0.0003195 | 19333 | GTEx | DepMap | Descartes | 0.02 | 6.00 |
| NTRK1 | -0.0003243 | 19370 | GTEx | DepMap | Descartes | 0.02 | 2.86 |
| CNTFR | -0.0003363 | 19454 | GTEx | DepMap | Descartes | 0.03 | 9.78 |
| SLC6A2 | -0.0003587 | 19603 | GTEx | DepMap | Descartes | 0.03 | 3.92 |
| PTCHD1 | -0.0003643 | 19640 | GTEx | DepMap | Descartes | 0.02 | 0.72 |
| EPHA6 | -0.0003685 | 19664 | GTEx | DepMap | Descartes | 0.22 | 31.66 |
| TMEFF2 | -0.0003910 | 19787 | GTEx | DepMap | Descartes | 0.08 | 12.45 |
| TUBB2A | -0.0004054 | 19845 | GTEx | DepMap | Descartes | 0.08 | 28.14 |
| FAT3 | -0.0004144 | 19889 | GTEx | DepMap | Descartes | 0.12 | 4.41 |
| MAB21L1 | -0.0004159 | 19899 | GTEx | DepMap | Descartes | 0.01 | 2.25 |
| MAB21L2 | -0.0004240 | 19926 | GTEx | DepMap | Descartes | 0.01 | 2.19 |
| SLC44A5 | -0.0004277 | 19936 | GTEx | DepMap | Descartes | 0.19 | 24.49 |
| REEP1 | -0.0004340 | 19962 | GTEx | DepMap | Descartes | 0.06 | 9.32 |
| SYNPO2 | -0.0004386 | 19980 | GTEx | DepMap | Descartes | 0.46 | 22.67 |
| RGMB | -0.0004400 | 19985 | GTEx | DepMap | Descartes | 0.08 | 8.75 |
| PRPH | -0.0004665 | 20049 | GTEx | DepMap | Descartes | 0.04 | 4.10 |
| RYR2 | -0.0004819 | 20091 | GTEx | DepMap | Descartes | 0.73 | 31.03 |
| HMX1 | -0.0004900 | 20114 | GTEx | DepMap | Descartes | 0.01 | 3.02 |
| CCND1 | -0.0004988 | 20140 | GTEx | DepMap | Descartes | 0.81 | 106.72 |
| IL7 | -0.0005019 | 20147 | GTEx | DepMap | Descartes | 0.32 | 92.92 |
| HS3ST5 | -0.0005038 | 20153 | GTEx | DepMap | Descartes | 0.05 | 6.46 |
| TMEM132C | -0.0006005 | 20322 | GTEx | DepMap | Descartes | 0.17 | 12.83 |
| RBFOX1 | -0.0006032 | 20327 | GTEx | DepMap | Descartes | 3.00 | 434.92 |
| CNKSR2 | -0.0006095 | 20330 | GTEx | DepMap | Descartes | 0.37 | 20.65 |
Descartes Vascular_endothelial markers
Top 50 marker genes of Vascular_endothelial cells in the Decartes fetal adrenal single cell map (https://atlas.brotmanbaty.org/bbi/human-gene-expression-during-development/cell/vascular_endothelial/in/adrenal)
Wilcoxon ranksum test P-value for gene set overrepresentation: 1.46e-07
Mean rank of genes in gene set: 5703.93
Median rank of genes in gene set: 2931.5
Rank on gene expression program of top 30 genes in gene set:
| Genes | Weight | Rank | GTEx | DepMap | Descartes | Mean.Counts | Mean.TPM |
|---|---|---|---|---|---|---|---|
| ID1 | 0.0017704 | 285 | GTEx | DepMap | Descartes | 0.68 | 299.77 |
| NR5A2 | 0.0014470 | 376 | GTEx | DepMap | Descartes | 6.97 | 630.13 |
| CRHBP | 0.0010280 | 570 | GTEx | DepMap | Descartes | 0.12 | 47.25 |
| CALCRL | 0.0008943 | 689 | GTEx | DepMap | Descartes | 0.73 | 78.23 |
| CDH5 | 0.0007001 | 922 | GTEx | DepMap | Descartes | 0.17 | 27.64 |
| SHANK3 | 0.0005919 | 1089 | GTEx | DepMap | Descartes | 0.55 | 39.70 |
| PTPRB | 0.0005795 | 1108 | GTEx | DepMap | Descartes | 0.66 | 33.40 |
| DNASE1L3 | 0.0005507 | 1172 | GTEx | DepMap | Descartes | 0.21 | 67.59 |
| RASIP1 | 0.0005337 | 1217 | GTEx | DepMap | Descartes | 0.12 | 23.42 |
| MYRIP | 0.0004865 | 1325 | GTEx | DepMap | Descartes | 2.06 | 201.94 |
| CLDN5 | 0.0003635 | 1762 | GTEx | DepMap | Descartes | 0.11 | 24.56 |
| SOX18 | 0.0003582 | 1786 | GTEx | DepMap | Descartes | 0.07 | 25.23 |
| CEACAM1 | 0.0003545 | 1800 | GTEx | DepMap | Descartes | 0.62 | 81.99 |
| KDR | 0.0003079 | 1997 | GTEx | DepMap | Descartes | 0.14 | 16.12 |
| APLNR | 0.0002915 | 2088 | GTEx | DepMap | Descartes | 0.04 | 9.15 |
| NPR1 | 0.0002347 | 2450 | GTEx | DepMap | Descartes | 0.04 | 5.06 |
| SHE | 0.0002259 | 2511 | GTEx | DepMap | Descartes | 0.09 | 7.91 |
| TMEM88 | 0.0002100 | 2641 | GTEx | DepMap | Descartes | 0.11 | 67.70 |
| FLT4 | 0.0002063 | 2671 | GTEx | DepMap | Descartes | 0.08 | 10.06 |
| BTNL9 | 0.0002040 | 2689 | GTEx | DepMap | Descartes | 0.07 | 14.87 |
| TIE1 | 0.0001926 | 2792 | GTEx | DepMap | Descartes | 0.08 | 13.60 |
| TM4SF18 | 0.0001816 | 2902 | GTEx | DepMap | Descartes | 0.04 | 6.54 |
| TEK | 0.0001753 | 2961 | GTEx | DepMap | Descartes | 0.17 | 21.94 |
| NOTCH4 | 0.0001662 | 3054 | GTEx | DepMap | Descartes | 0.09 | 7.73 |
| PODXL | 0.0001494 | 3247 | GTEx | DepMap | Descartes | 0.18 | 18.10 |
| MMRN2 | 0.0001481 | 3269 | GTEx | DepMap | Descartes | 0.06 | 8.64 |
| KANK3 | 0.0001231 | 3580 | GTEx | DepMap | Descartes | 0.08 | 18.06 |
| ARHGAP29 | 0.0001166 | 3687 | GTEx | DepMap | Descartes | 1.11 | 66.19 |
| F8 | 0.0001113 | 3758 | GTEx | DepMap | Descartes | 0.20 | 11.56 |
| FCGR2B | 0.0000265 | 5858 | GTEx | DepMap | Descartes | 0.02 | 2.49 |
Descartes stromal markers
Top 50 marker genes of stromal cells in the Decartes fetal adrenal single cell map (https://atlas.brotmanbaty.org/bbi/human-gene-expression-during-development/cell/stromal/in/adrenal)
Wilcoxon ranksum test P-value for gene set overrepresentation: 5.87e-01
Mean rank of genes in gene set: 10480.39
Median rank of genes in gene set: 12382
Rank on gene expression program of top 30 genes in gene set:
| Genes | Weight | Rank | GTEx | DepMap | Descartes | Mean.Counts | Mean.TPM |
|---|---|---|---|---|---|---|---|
| BICC1 | 0.0023947 | 195 | GTEx | DepMap | Descartes | 6.02 | 597.61 |
| IGFBP3 | 0.0017698 | 286 | GTEx | DepMap | Descartes | 0.59 | 161.72 |
| ADAMTS2 | 0.0009163 | 668 | GTEx | DepMap | Descartes | 0.65 | 78.23 |
| C7 | 0.0005174 | 1254 | GTEx | DepMap | Descartes | 0.92 | 131.80 |
| DCN | 0.0005082 | 1271 | GTEx | DepMap | Descartes | 0.40 | 40.45 |
| HHIP | 0.0004281 | 1500 | GTEx | DepMap | Descartes | 0.21 | 15.66 |
| LAMC3 | 0.0003968 | 1623 | GTEx | DepMap | Descartes | 0.07 | 6.67 |
| RSPO3 | 0.0003772 | 1698 | GTEx | DepMap | Descartes | 0.07 | NA |
| ABCA6 | 0.0003661 | 1747 | GTEx | DepMap | Descartes | 0.88 | 54.03 |
| PAMR1 | 0.0002998 | 2035 | GTEx | DepMap | Descartes | 0.11 | 30.17 |
| ADAMTSL3 | 0.0002705 | 2199 | GTEx | DepMap | Descartes | 3.14 | 192.23 |
| GAS2 | 0.0002120 | 2624 | GTEx | DepMap | Descartes | 5.97 | 1131.49 |
| COL27A1 | 0.0001995 | 2734 | GTEx | DepMap | Descartes | 1.17 | 72.67 |
| PDGFRA | 0.0001929 | 2788 | GTEx | DepMap | Descartes | 0.06 | 7.92 |
| ABCC9 | 0.0001744 | 2977 | GTEx | DepMap | Descartes | 0.31 | 20.28 |
| GLI2 | 0.0000929 | 4052 | GTEx | DepMap | Descartes | 0.15 | 17.67 |
| EDNRA | 0.0000460 | 5185 | GTEx | DepMap | Descartes | 0.10 | 17.62 |
| COL12A1 | 0.0000433 | 5282 | GTEx | DepMap | Descartes | 0.32 | 20.10 |
| ACTA2 | 0.0000367 | 5470 | GTEx | DepMap | Descartes | 0.24 | 109.30 |
| ISLR | 0.0000192 | 6160 | GTEx | DepMap | Descartes | 0.02 | 7.53 |
| COL6A3 | 0.0000142 | 6401 | GTEx | DepMap | Descartes | 0.45 | 33.97 |
| LRRC17 | -0.0000074 | 8945 | GTEx | DepMap | Descartes | 0.04 | 13.61 |
| CLDN11 | -0.0000157 | 9911 | GTEx | DepMap | Descartes | 0.00 | 0.05 |
| MXRA5 | -0.0000417 | 12079 | GTEx | DepMap | Descartes | 0.04 | 1.69 |
| SULT1E1 | -0.0000465 | 12382 | GTEx | DepMap | Descartes | 0.03 | 8.37 |
| PCDH18 | -0.0000470 | 12418 | GTEx | DepMap | Descartes | 0.02 | 1.89 |
| CCDC80 | -0.0000808 | 14118 | GTEx | DepMap | Descartes | 0.13 | 7.18 |
| SCARA5 | -0.0000829 | 14207 | GTEx | DepMap | Descartes | 0.01 | 1.03 |
| CCDC102B | -0.0000971 | 14815 | GTEx | DepMap | Descartes | 0.78 | 218.54 |
| ELN | -0.0001071 | 15198 | GTEx | DepMap | Descartes | 0.12 | 21.47 |
Descartes sympathoblasts markers
Top 50 marker genes of sympathoblasts cells in the Decartes fetal adrenal single cell map (https://atlas.brotmanbaty.org/bbi/human-gene-expression-during-development/cell/sympathoblasts/in/adrenal)
Wilcoxon ranksum test P-value for gene set overrepresentation: 1.00e+00
Mean rank of genes in gene set: 17807.44
Median rank of genes in gene set: 19649
Rank on gene expression program of top 30 genes in gene set:
| Genes | Weight | Rank | GTEx | DepMap | Descartes | Mean.Counts | Mean.TPM |
|---|---|---|---|---|---|---|---|
| ST18 | 0.0001261 | 3540 | GTEx | DepMap | Descartes | 0.20 | 19.49 |
| LAMA3 | 0.0001134 | 3725 | GTEx | DepMap | Descartes | 0.25 | 14.16 |
| SLC35F3 | 0.0000727 | 4477 | GTEx | DepMap | Descartes | 0.43 | 70.66 |
| CNTN3 | -0.0000066 | 8838 | GTEx | DepMap | Descartes | 0.13 | 13.39 |
| PNMT | -0.0000573 | 13009 | GTEx | DepMap | Descartes | 0.00 | 0.54 |
| MGAT4C | -0.0000673 | 13523 | GTEx | DepMap | Descartes | 0.68 | 21.10 |
| DGKK | -0.0001461 | 16502 | GTEx | DepMap | Descartes | 0.01 | 0.64 |
| PENK | -0.0001694 | 17103 | GTEx | DepMap | Descartes | 0.00 | 0.30 |
| SCG2 | -0.0001930 | 17612 | GTEx | DepMap | Descartes | 0.27 | 34.52 |
| SLC24A2 | -0.0002015 | 17776 | GTEx | DepMap | Descartes | 0.04 | 1.45 |
| ARC | -0.0002036 | 17818 | GTEx | DepMap | Descartes | 0.00 | 0.35 |
| GCH1 | -0.0002064 | 17860 | GTEx | DepMap | Descartes | 1.09 | 179.35 |
| HTATSF1 | -0.0002206 | 18109 | GTEx | DepMap | Descartes | 0.10 | 21.55 |
| C1QL1 | -0.0002489 | 18570 | GTEx | DepMap | Descartes | 0.00 | 1.26 |
| SLC18A1 | -0.0002737 | 18870 | GTEx | DepMap | Descartes | 0.01 | 1.82 |
| SORCS3 | -0.0002809 | 18964 | GTEx | DepMap | Descartes | 0.03 | 3.22 |
| GRID2 | -0.0002930 | 19092 | GTEx | DepMap | Descartes | 0.15 | 11.63 |
| PACRG | -0.0002958 | 19121 | GTEx | DepMap | Descartes | 0.77 | 208.88 |
| PCSK2 | -0.0002964 | 19123 | GTEx | DepMap | Descartes | 0.04 | 4.03 |
| CNTNAP5 | -0.0003017 | 19177 | GTEx | DepMap | Descartes | 0.06 | 4.87 |
| INSM1 | -0.0003214 | 19344 | GTEx | DepMap | Descartes | 0.00 | 0.35 |
| KSR2 | -0.0003656 | 19649 | GTEx | DepMap | Descartes | 0.08 | 2.60 |
| EML6 | -0.0003729 | 19695 | GTEx | DepMap | Descartes | 0.24 | 8.47 |
| TMEM130 | -0.0003849 | 19755 | GTEx | DepMap | Descartes | 0.03 | 3.25 |
| GRM7 | -0.0003932 | 19794 | GTEx | DepMap | Descartes | 0.09 | 16.02 |
| TBX20 | -0.0004033 | 19833 | GTEx | DepMap | Descartes | 0.04 | 11.45 |
| SPOCK3 | -0.0004041 | 19838 | GTEx | DepMap | Descartes | 0.03 | 6.19 |
| CDH18 | -0.0004086 | 19861 | GTEx | DepMap | Descartes | 0.07 | 5.60 |
| CDH12 | -0.0004275 | 19935 | GTEx | DepMap | Descartes | 0.37 | 34.27 |
| GALNTL6 | -0.0004623 | 20042 | GTEx | DepMap | Descartes | 0.09 | 10.51 |
Descartes erythroblasts markers
Top 50 marker genes of erythroblasts cells in the Decartes fetal adrenal single cell map (https://atlas.brotmanbaty.org/bbi/human-gene-expression-during-development/cell/erythroblasts/in/adrenal)
Wilcoxon ranksum test P-value for gene set overrepresentation: 4.82e-03
Mean rank of genes in gene set: 8029.72
Median rank of genes in gene set: 6435.5
Rank on gene expression program of top 30 genes in gene set:
| Genes | Weight | Rank | GTEx | DepMap | Descartes | Mean.Counts | Mean.TPM |
|---|---|---|---|---|---|---|---|
| SELENBP1 | 0.0015235 | 358 | GTEx | DepMap | Descartes | 0.13 | 24.51 |
| TFR2 | 0.0012437 | 445 | GTEx | DepMap | Descartes | 0.82 | 130.70 |
| CAT | 0.0012124 | 458 | GTEx | DepMap | Descartes | 0.93 | 210.25 |
| SOX6 | 0.0007866 | 808 | GTEx | DepMap | Descartes | 2.10 | 138.56 |
| DENND4A | 0.0005951 | 1083 | GTEx | DepMap | Descartes | 8.71 | 469.09 |
| BLVRB | 0.0004174 | 1534 | GTEx | DepMap | Descartes | 0.27 | 107.03 |
| SLC25A21 | 0.0003909 | 1646 | GTEx | DepMap | Descartes | 0.21 | 26.21 |
| GYPC | 0.0002608 | 2252 | GTEx | DepMap | Descartes | 0.09 | 34.89 |
| RAPGEF2 | 0.0002258 | 2513 | GTEx | DepMap | Descartes | 2.56 | 169.03 |
| GCLC | 0.0002113 | 2632 | GTEx | DepMap | Descartes | 5.63 | 656.77 |
| SLC4A1 | 0.0001772 | 2942 | GTEx | DepMap | Descartes | 0.02 | 3.07 |
| SPTA1 | 0.0001492 | 3252 | GTEx | DepMap | Descartes | 0.02 | 1.75 |
| HBA2 | 0.0001290 | 3500 | GTEx | DepMap | Descartes | 0.10 | 151.24 |
| GYPA | 0.0001167 | 3684 | GTEx | DepMap | Descartes | 0.00 | 1.59 |
| AHSP | 0.0001148 | 3707 | GTEx | DepMap | Descartes | 0.01 | 13.18 |
| RGS6 | 0.0001011 | 3918 | GTEx | DepMap | Descartes | 0.29 | 29.18 |
| SLC25A37 | 0.0001007 | 3925 | GTEx | DepMap | Descartes | 0.71 | 71.55 |
| HBM | 0.0000556 | 4908 | GTEx | DepMap | Descartes | 0.01 | 11.03 |
| HEMGN | 0.0000523 | 4983 | GTEx | DepMap | Descartes | 0.01 | 1.77 |
| HBA1 | 0.0000490 | 5100 | GTEx | DepMap | Descartes | 0.03 | 45.27 |
| ALAS2 | 0.0000298 | 5718 | GTEx | DepMap | Descartes | 0.01 | 2.05 |
| MICAL2 | 0.0000297 | 5719 | GTEx | DepMap | Descartes | 0.82 | 67.74 |
| RHCE | 0.0000143 | 6388 | GTEx | DepMap | Descartes | 0.02 | 6.60 |
| RHD | 0.0000127 | 6483 | GTEx | DepMap | Descartes | 0.06 | 10.34 |
| HBZ | 0.0000102 | 6609 | GTEx | DepMap | Descartes | 0.00 | 3.05 |
| EPB42 | 0.0000045 | 6991 | GTEx | DepMap | Descartes | 0.00 | 0.77 |
| HBG1 | 0.0000040 | 7021 | GTEx | DepMap | Descartes | 0.00 | 0.00 |
| HBG2 | 0.0000000 | 7751 | GTEx | DepMap | Descartes | 0.00 | 0.00 |
| ABCB10 | -0.0000023 | 8287 | GTEx | DepMap | Descartes | 0.32 | 43.44 |
| RHAG | -0.0000064 | 8809 | GTEx | DepMap | Descartes | 0.01 | 2.52 |
Descartes myeloid markers
Top 50 marker genes of myeloid cells in the Decartes fetal adrenal single cell map (https://atlas.brotmanbaty.org/bbi/human-gene-expression-during-development/cell/myeloid/in/adrenal)
Wilcoxon ranksum test P-value for gene set overrepresentation: 5.95e-07
Mean rank of genes in gene set: 6174.82
Median rank of genes in gene set: 3222
Rank on gene expression program of top 30 genes in gene set:
| Genes | Weight | Rank | GTEx | DepMap | Descartes | Mean.Counts | Mean.TPM |
|---|---|---|---|---|---|---|---|
| CD14 | 0.0020225 | 244 | GTEx | DepMap | Descartes | 0.29 | 112.66 |
| CTSB | 0.0009678 | 628 | GTEx | DepMap | Descartes | 2.07 | 289.27 |
| CST3 | 0.0004838 | 1332 | GTEx | DepMap | Descartes | 0.46 | 89.95 |
| LGMN | 0.0004639 | 1383 | GTEx | DepMap | Descartes | 0.42 | 123.42 |
| C1QA | 0.0004542 | 1421 | GTEx | DepMap | Descartes | 0.13 | 84.40 |
| WWP1 | 0.0004281 | 1501 | GTEx | DepMap | Descartes | 2.39 | 238.41 |
| ABCA1 | 0.0004148 | 1548 | GTEx | DepMap | Descartes | 2.73 | 121.79 |
| HLA-DRB1 | 0.0004078 | 1580 | GTEx | DepMap | Descartes | 0.10 | 54.01 |
| CD74 | 0.0004018 | 1604 | GTEx | DepMap | Descartes | 0.61 | 140.16 |
| HLA-DRA | 0.0003956 | 1628 | GTEx | DepMap | Descartes | 0.34 | 198.73 |
| CTSS | 0.0003807 | 1680 | GTEx | DepMap | Descartes | 0.27 | 44.11 |
| SLC9A9 | 0.0003661 | 1746 | GTEx | DepMap | Descartes | 1.10 | 207.66 |
| TGFBI | 0.0003487 | 1819 | GTEx | DepMap | Descartes | 0.96 | 98.74 |
| C1QC | 0.0003425 | 1851 | GTEx | DepMap | Descartes | 0.05 | 22.85 |
| HLA-DPA1 | 0.0003060 | 2007 | GTEx | DepMap | Descartes | 0.15 | 21.80 |
| IFNGR1 | 0.0003004 | 2031 | GTEx | DepMap | Descartes | 0.76 | 142.02 |
| AXL | 0.0002945 | 2071 | GTEx | DepMap | Descartes | 0.33 | 46.14 |
| ITPR2 | 0.0002820 | 2141 | GTEx | DepMap | Descartes | 8.30 | 299.59 |
| C1QB | 0.0002776 | 2167 | GTEx | DepMap | Descartes | 0.08 | 38.29 |
| FGL2 | 0.0002201 | 2566 | GTEx | DepMap | Descartes | 0.07 | 11.61 |
| SLCO2B1 | 0.0002020 | 2708 | GTEx | DepMap | Descartes | 1.40 | 111.25 |
| SPP1 | 0.0001752 | 2962 | GTEx | DepMap | Descartes | 0.56 | 188.27 |
| SLC1A3 | 0.0001725 | 2997 | GTEx | DepMap | Descartes | 0.12 | 12.45 |
| MSR1 | 0.0001595 | 3122 | GTEx | DepMap | Descartes | 0.27 | 49.65 |
| MPEG1 | 0.0001508 | 3222 | GTEx | DepMap | Descartes | 0.04 | 6.57 |
| RNASE1 | 0.0001378 | 3385 | GTEx | DepMap | Descartes | 0.05 | 29.51 |
| MS4A7 | 0.0000972 | 3983 | GTEx | DepMap | Descartes | 0.01 | 1.60 |
| VSIG4 | 0.0000722 | 4489 | GTEx | DepMap | Descartes | 0.01 | 4.12 |
| RGL1 | 0.0000355 | 5509 | GTEx | DepMap | Descartes | 0.56 | 63.42 |
| CYBB | 0.0000309 | 5674 | GTEx | DepMap | Descartes | 0.01 | 0.82 |
Descartes Schwann markers
Top 50 marker genes of Schwann cells in the Decartes fetal adrenal single cell map (https://atlas.brotmanbaty.org/bbi/human-gene-expression-during-development/cell/schwann/in/adrenal)
Wilcoxon ranksum test P-value for gene set overrepresentation: 1.00e+00
Mean rank of genes in gene set: 13681.88
Median rank of genes in gene set: 16827
Rank on gene expression program of top 30 genes in gene set:
| Genes | Weight | Rank | GTEx | DepMap | Descartes | Mean.Counts | Mean.TPM |
|---|---|---|---|---|---|---|---|
| COL25A1 | 0.0007532 | 853 | GTEx | DepMap | Descartes | 0.60 | 57.93 |
| COL18A1 | 0.0006529 | 986 | GTEx | DepMap | Descartes | 2.07 | 166.87 |
| LAMC1 | 0.0005416 | 1199 | GTEx | DepMap | Descartes | 1.73 | 112.94 |
| EDNRB | 0.0003888 | 1658 | GTEx | DepMap | Descartes | 0.12 | 20.56 |
| STARD13 | 0.0003718 | 1725 | GTEx | DepMap | Descartes | 2.80 | 242.49 |
| VIM | 0.0003715 | 1726 | GTEx | DepMap | Descartes | 0.92 | 229.48 |
| KCTD12 | 0.0002259 | 2512 | GTEx | DepMap | Descartes | 0.13 | 12.34 |
| ERBB3 | 0.0001968 | 2760 | GTEx | DepMap | Descartes | 0.18 | 16.43 |
| ADAMTS5 | 0.0001626 | 3085 | GTEx | DepMap | Descartes | 0.06 | 4.16 |
| COL5A2 | 0.0001522 | 3205 | GTEx | DepMap | Descartes | 0.62 | 60.27 |
| ABCA8 | 0.0000974 | 3977 | GTEx | DepMap | Descartes | 1.17 | 85.52 |
| GAS7 | 0.0000865 | 4180 | GTEx | DepMap | Descartes | 0.51 | 47.36 |
| HMGA2 | 0.0000660 | 4627 | GTEx | DepMap | Descartes | 0.04 | 3.10 |
| PAG1 | -0.0000485 | 12493 | GTEx | DepMap | Descartes | 0.81 | 44.82 |
| PTN | -0.0000628 | 13300 | GTEx | DepMap | Descartes | 0.06 | 25.49 |
| MDGA2 | -0.0000760 | 13919 | GTEx | DepMap | Descartes | 0.16 | 18.98 |
| TRPM3 | -0.0000804 | 14106 | GTEx | DepMap | Descartes | 0.57 | 22.20 |
| IL1RAPL1 | -0.0000967 | 14802 | GTEx | DepMap | Descartes | 0.34 | 71.19 |
| CDH19 | -0.0000986 | 14888 | GTEx | DepMap | Descartes | 0.20 | 25.70 |
| MPZ | -0.0001043 | 15093 | GTEx | DepMap | Descartes | 0.01 | 3.18 |
| LAMA4 | -0.0001064 | 15171 | GTEx | DepMap | Descartes | 0.73 | 54.95 |
| OLFML2A | -0.0001174 | 15569 | GTEx | DepMap | Descartes | 0.02 | 2.44 |
| PTPRZ1 | -0.0001319 | 16052 | GTEx | DepMap | Descartes | 0.02 | 1.56 |
| SOX10 | -0.0001515 | 16647 | GTEx | DepMap | Descartes | 0.01 | 2.57 |
| PLP1 | -0.0001585 | 16827 | GTEx | DepMap | Descartes | 0.01 | 1.15 |
| PLCE1 | -0.0001666 | 17036 | GTEx | DepMap | Descartes | 0.16 | 8.01 |
| SCN7A | -0.0001864 | 17474 | GTEx | DepMap | Descartes | 0.08 | 8.34 |
| SOX5 | -0.0001888 | 17529 | GTEx | DepMap | Descartes | 12.68 | 826.64 |
| PMP22 | -0.0001899 | 17548 | GTEx | DepMap | Descartes | 0.16 | 60.62 |
| FIGN | -0.0001982 | 17724 | GTEx | DepMap | Descartes | 0.50 | 32.31 |
Descartes Megakaryocytes markers
Top 50 marker genes of Megakaryocytes cells in the Decartes fetal adrenal single cell map (https://atlas.brotmanbaty.org/bbi/human-gene-expression-during-development/cell/megakaryocytes/in/adrenal)
Wilcoxon ranksum test P-value for gene set overrepresentation: 8.83e-06
Mean rank of genes in gene set: 6653.67
Median rank of genes in gene set: 3679
Rank on gene expression program of top 30 genes in gene set:
| Genes | Weight | Rank | GTEx | DepMap | Descartes | Mean.Counts | Mean.TPM |
|---|---|---|---|---|---|---|---|
| STOM | 0.0021039 | 225 | GTEx | DepMap | Descartes | 1.66 | 269.61 |
| THBS1 | 0.0018990 | 265 | GTEx | DepMap | Descartes | 3.24 | 280.64 |
| VCL | 0.0016693 | 321 | GTEx | DepMap | Descartes | 4.11 | 269.96 |
| MYH9 | 0.0013766 | 400 | GTEx | DepMap | Descartes | 5.20 | 350.70 |
| ACTN1 | 0.0006212 | 1036 | GTEx | DepMap | Descartes | 2.06 | 231.85 |
| TPM4 | 0.0005994 | 1074 | GTEx | DepMap | Descartes | 1.12 | 155.22 |
| FLNA | 0.0005983 | 1075 | GTEx | DepMap | Descartes | 0.39 | 32.57 |
| MYLK | 0.0005820 | 1102 | GTEx | DepMap | Descartes | 0.44 | 26.48 |
| ARHGAP6 | 0.0005038 | 1279 | GTEx | DepMap | Descartes | 0.43 | 50.47 |
| RAP1B | 0.0004976 | 1293 | GTEx | DepMap | Descartes | 2.37 | 91.95 |
| UBASH3B | 0.0004836 | 1333 | GTEx | DepMap | Descartes | 0.61 | 56.46 |
| LTBP1 | 0.0004446 | 1444 | GTEx | DepMap | Descartes | 2.43 | 176.91 |
| TLN1 | 0.0004407 | 1457 | GTEx | DepMap | Descartes | 0.81 | 47.13 |
| ACTB | 0.0004045 | 1592 | GTEx | DepMap | Descartes | 2.42 | 715.08 |
| LIMS1 | 0.0003534 | 1804 | GTEx | DepMap | Descartes | 1.94 | 229.72 |
| TGFB1 | 0.0002760 | 2175 | GTEx | DepMap | Descartes | 0.35 | 84.44 |
| SLC24A3 | 0.0002619 | 2244 | GTEx | DepMap | Descartes | 0.29 | 54.18 |
| PSTPIP2 | 0.0002098 | 2642 | GTEx | DepMap | Descartes | 0.26 | 45.56 |
| PDE3A | 0.0001616 | 3094 | GTEx | DepMap | Descartes | 1.23 | 123.87 |
| PF4 | 0.0001497 | 3241 | GTEx | DepMap | Descartes | 0.00 | 0.83 |
| MMRN1 | 0.0001453 | 3296 | GTEx | DepMap | Descartes | 0.10 | 13.91 |
| INPP4B | 0.0001416 | 3336 | GTEx | DepMap | Descartes | 0.70 | 56.57 |
| ZYX | 0.0001382 | 3380 | GTEx | DepMap | Descartes | 0.45 | 100.60 |
| CD84 | 0.0001271 | 3529 | GTEx | DepMap | Descartes | 0.06 | 4.24 |
| ANGPT1 | 0.0001170 | 3679 | GTEx | DepMap | Descartes | 0.09 | 12.26 |
| HIPK2 | 0.0001081 | 3802 | GTEx | DepMap | Descartes | 2.15 | 70.44 |
| FERMT3 | 0.0001073 | 3814 | GTEx | DepMap | Descartes | 0.10 | 23.26 |
| FLI1 | 0.0000755 | 4407 | GTEx | DepMap | Descartes | 0.48 | 62.01 |
| PPBP | 0.0000712 | 4512 | GTEx | DepMap | Descartes | 0.00 | 1.22 |
| GP9 | 0.0000172 | 6244 | GTEx | DepMap | Descartes | 0.00 | 0.35 |
Descartes Lyphoid markers
Top 50 marker genes of Lyphoid cells in the Decartes fetal adrenal single cell map (https://atlas.brotmanbaty.org/bbi/human-gene-expression-during-development/cell/lymphoid/in/adrenal)
Wilcoxon ranksum test P-value for gene set overrepresentation: 8.17e-01
Mean rank of genes in gene set: 11077.4
Median rank of genes in gene set: 12996
Rank on gene expression program of top 30 genes in gene set:
| Genes | Weight | Rank | GTEx | DepMap | Descartes | Mean.Counts | Mean.TPM |
|---|---|---|---|---|---|---|---|
| HLA-B | 0.0032528 | 137 | GTEx | DepMap | Descartes | 1.02 | 420.05 |
| B2M | 0.0023570 | 200 | GTEx | DepMap | Descartes | 5.20 | 1435.98 |
| HLA-A | 0.0020565 | 237 | GTEx | DepMap | Descartes | 1.03 | 122.80 |
| HLA-C | 0.0017776 | 283 | GTEx | DepMap | Descartes | 0.49 | 165.46 |
| MSN | 0.0007594 | 847 | GTEx | DepMap | Descartes | 1.00 | 146.29 |
| MBNL1 | 0.0007174 | 903 | GTEx | DepMap | Descartes | 9.28 | 752.44 |
| ARID5B | 0.0006764 | 951 | GTEx | DepMap | Descartes | 3.12 | 210.16 |
| SP100 | 0.0006526 | 987 | GTEx | DepMap | Descartes | 2.06 | 192.27 |
| NCALD | 0.0004225 | 1520 | GTEx | DepMap | Descartes | 1.06 | 175.56 |
| ETS1 | 0.0002964 | 2058 | GTEx | DepMap | Descartes | 0.66 | 92.50 |
| FOXP1 | 0.0002704 | 2200 | GTEx | DepMap | Descartes | 0.38 | 22.14 |
| PRKCH | 0.0002164 | 2589 | GTEx | DepMap | Descartes | 0.87 | 153.37 |
| IFI16 | 0.0001912 | 2802 | GTEx | DepMap | Descartes | 0.37 | 63.46 |
| CCL5 | 0.0001114 | 3755 | GTEx | DepMap | Descartes | 0.04 | 31.18 |
| PLEKHA2 | 0.0000863 | 4188 | GTEx | DepMap | Descartes | 0.38 | 39.47 |
| NKG7 | 0.0000592 | 4808 | GTEx | DepMap | Descartes | 0.01 | 12.62 |
| LCP1 | 0.0000590 | 4815 | GTEx | DepMap | Descartes | 0.12 | 22.78 |
| ITPKB | 0.0000528 | 4971 | GTEx | DepMap | Descartes | 0.25 | 27.96 |
| PTPRC | 0.0000491 | 5094 | GTEx | DepMap | Descartes | 0.52 | 76.09 |
| CCND3 | 0.0000418 | 5314 | GTEx | DepMap | Descartes | 1.78 | 386.17 |
| ARHGDIB | 0.0000072 | 6793 | GTEx | DepMap | Descartes | 0.07 | 43.07 |
| PDE3B | -0.0000297 | 11206 | GTEx | DepMap | Descartes | 4.29 | 316.41 |
| SORL1 | -0.0000537 | 12819 | GTEx | DepMap | Descartes | 1.06 | 47.08 |
| MCTP2 | -0.0000570 | 12996 | GTEx | DepMap | Descartes | 0.17 | 12.07 |
| SAMD3 | -0.0000999 | 14936 | GTEx | DepMap | Descartes | 0.13 | 23.53 |
| ARHGAP15 | -0.0001011 | 14973 | GTEx | DepMap | Descartes | 0.81 | 201.01 |
| SKAP1 | -0.0001136 | 15436 | GTEx | DepMap | Descartes | 0.49 | 172.30 |
| ANKRD44 | -0.0001297 | 15989 | GTEx | DepMap | Descartes | 2.72 | 189.21 |
| WIPF1 | -0.0001726 | 17172 | GTEx | DepMap | Descartes | 0.37 | 55.62 |
| IKZF1 | -0.0001739 | 17211 | GTEx | DepMap | Descartes | 0.19 | 23.85 |
Embryonic Pausing Signatures Up
Embryonic pausing signature upregulated genes from Supplementary Table 6 of Rehman et al. Cell 2021. These genes are upregulated in paused ESCs and diapaused embryos.
Wilcoxon ranksum test P-value for gene set overrepresentation: 1.52e-02
Mean rank of genes in gene set: 6870.07
Median rank of genes in gene set: 4649
Rank on gene expression program of top 30 genes in gene set:
| Genes | Weight | Rank | GTEx | DepMap | Descartes | Mean.Counts | Mean.TPM |
|---|---|---|---|---|---|---|---|
| APOE | 0.0065697 | 51 | GTEx | DepMap | Descartes | 4.76 | 2600.75 |
| ALDH6A1 | 0.0028105 | 162 | GTEx | DepMap | Descartes | 0.43 | 54.76 |
| CTSL | 0.0008864 | 694 | GTEx | DepMap | Descartes | 0.48 | NA |
| HEXB | 0.0004916 | 1303 | GTEx | DepMap | Descartes | 0.60 | 147.24 |
| HEXA | 0.0001896 | 2822 | GTEx | DepMap | Descartes | 0.02 | 1.84 |
| SPRY1 | 0.0000815 | 4280 | GTEx | DepMap | Descartes | 0.15 | 41.28 |
| YPEL2 | 0.0000746 | 4440 | GTEx | DepMap | Descartes | 0.82 | 73.29 |
| ACSS1 | 0.0000575 | 4858 | GTEx | DepMap | Descartes | 0.07 | 10.86 |
| DPP7 | 0.0000208 | 6096 | GTEx | DepMap | Descartes | 0.15 | 51.91 |
| LY6G6E | 0.0000000 | 7844 | GTEx | DepMap | Descartes | 0.00 | 0.00 |
| RENBP | -0.0000605 | 13187 | GTEx | DepMap | Descartes | 0.02 | 12.44 |
| PDCD4 | -0.0000858 | 14350 | GTEx | DepMap | Descartes | 0.86 | 113.93 |
| CCNG2 | -0.0001905 | 17559 | GTEx | DepMap | Descartes | 0.09 | 11.20 |
| AUH | -0.0002465 | 18535 | GTEx | DepMap | Descartes | 1.64 | 491.23 |
Embryonic Pausing Signatures Down
Embryonic pausing signature downregulated genes from Supplementary Table 6 of Rehman et al. Cell 2021. These genes are downregulated in paused ESCs and diapaused embryos.
Wilcoxon ranksum test P-value for gene set overrepresentation: 6.63e-01
Mean rank of genes in gene set: 10536.4
Median rank of genes in gene set: 11460
Rank on gene expression program of top 30 genes in gene set:
| Genes | Weight | Rank | GTEx | DepMap | Descartes | Mean.Counts | Mean.TPM |
|---|---|---|---|---|---|---|---|
| PEBP1 | 0.0016787 | 314 | GTEx | DepMap | Descartes | 2.12 | 841.21 |
| UQCRQ | 0.0007952 | 798 | GTEx | DepMap | Descartes | 0.37 | 144.93 |
| P4HB | 0.0007473 | 863 | GTEx | DepMap | Descartes | 1.30 | 273.49 |
| ATOX1 | 0.0006597 | 982 | GTEx | DepMap | Descartes | 0.34 | 52.03 |
| MGMT | 0.0003800 | 1686 | GTEx | DepMap | Descartes | 1.61 | 168.44 |
| SLC25A5 | 0.0003711 | 1727 | GTEx | DepMap | Descartes | 0.15 | 67.71 |
| NDUFC1 | 0.0003096 | 1992 | GTEx | DepMap | Descartes | 0.21 | 90.65 |
| HDLBP | 0.0003058 | 2008 | GTEx | DepMap | Descartes | 1.54 | 122.41 |
| ID3 | 0.0002945 | 2070 | GTEx | DepMap | Descartes | 0.15 | 93.90 |
| ARPC1B | 0.0002634 | 2240 | GTEx | DepMap | Descartes | 0.09 | 27.95 |
| RPS27L | 0.0002599 | 2255 | GTEx | DepMap | Descartes | 0.41 | 36.60 |
| CDC34 | 0.0002147 | 2600 | GTEx | DepMap | Descartes | 0.15 | 54.30 |
| TMEM109 | 0.0001621 | 3090 | GTEx | DepMap | Descartes | 0.05 | 12.91 |
| POLR2L | 0.0001468 | 3284 | GTEx | DepMap | Descartes | 0.13 | 82.50 |
| PRADC1 | 0.0001386 | 3377 | GTEx | DepMap | Descartes | 0.03 | 14.91 |
| DUSP14 | 0.0001377 | 3387 | GTEx | DepMap | Descartes | 0.32 | 69.23 |
| NUDC | 0.0001235 | 3575 | GTEx | DepMap | Descartes | 0.58 | 158.65 |
| DPH3 | 0.0001234 | 3576 | GTEx | DepMap | Descartes | 0.07 | 9.91 |
| SEC13 | 0.0001201 | 3624 | GTEx | DepMap | Descartes | 0.37 | 76.33 |
| LDHA | 0.0000970 | 3987 | GTEx | DepMap | Descartes | 0.89 | 190.82 |
| UQCR10 | 0.0000895 | 4121 | GTEx | DepMap | Descartes | 0.20 | 125.03 |
| MRPS18A | 0.0000822 | 4265 | GTEx | DepMap | Descartes | 0.06 | 33.72 |
| CYB5B | 0.0000760 | 4391 | GTEx | DepMap | Descartes | 0.48 | 46.78 |
| HSPE1 | 0.0000745 | 4444 | GTEx | DepMap | Descartes | 0.32 | 171.49 |
| TMEM97 | 0.0000597 | 4799 | GTEx | DepMap | Descartes | 0.11 | 26.85 |
| ANKRD37 | 0.0000530 | 4968 | GTEx | DepMap | Descartes | 0.03 | 13.61 |
| LRRC42 | 0.0000498 | 5071 | GTEx | DepMap | Descartes | 0.11 | 33.27 |
| CAPG | 0.0000443 | 5246 | GTEx | DepMap | Descartes | 0.03 | 9.64 |
| PLAC8 | 0.0000420 | 5310 | GTEx | DepMap | Descartes | 0.05 | 17.00 |
| DGCR6 | 0.0000341 | 5569 | GTEx | DepMap | Descartes | 0.00 | 0.02 |
Below shows the ranks on this GEP for immune marker gene lists curated by CellTypist (https://www.celltypist.org/encyclopedia).
High ranks indicate this gene is a driver of this GEP.
These curated gene list are ranked by P-value (on this GEP) of their constituent genes.
The Mean Count column shows the mean read count in cells scoring highly (H > 50) on this gene expression program.
Macrophages: Macrophages (model markers)
specialised mononuclear phagocytic cells which recognise:
Wilcoxon ranksum test P-value for gene set overrepresentation: 1.64e-05
Mean rank of genes in gene set: 2490.7
Rank on gene expression program of genes in gene set:
| Genes | Weight | Rank | GTEx | DepMap | Decartes | Mean.Counts | Mean.TPM |
|---|---|---|---|---|---|---|---|
| APOC1 | 0.0155098 | 6 | GTEx | DepMap | Descartes | 6.17 | 6328.76 |
| APOE | 0.0065697 | 51 | GTEx | DepMap | Descartes | 4.76 | 2600.75 |
| SELENOP | 0.0057501 | 63 | GTEx | DepMap | Descartes | 1.99 | NA |
| FTL | 0.0020885 | 228 | GTEx | DepMap | Descartes | 4.17 | 2884.21 |
| C1QA | 0.0004542 | 1421 | GTEx | DepMap | Descartes | 0.13 | 84.40 |
| CD5L | 0.0004406 | 1458 | GTEx | DepMap | Descartes | 0.03 | 8.93 |
| C1QB | 0.0002776 | 2167 | GTEx | DepMap | Descartes | 0.08 | 38.29 |
| FTH1 | 0.0002001 | 2732 | GTEx | DepMap | Descartes | 1.66 | 797.97 |
| RNASE1 | 0.0001378 | 3385 | GTEx | DepMap | Descartes | 0.05 | 29.51 |
| GNLY | -0.0000648 | 13396 | GTEx | DepMap | Descartes | 0.01 | 4.84 |
Myelocytes: Myelocytes (model markers)
early granulocyte precursors that are derive from promyelocytes and later mature into metamyelocytes:
Wilcoxon ranksum test P-value for gene set overrepresentation: 4.36e-04
Mean rank of genes in gene set: 3701.11
Rank on gene expression program of genes in gene set:
| Genes | Weight | Rank | GTEx | DepMap | Decartes | Mean.Counts | Mean.TPM |
|---|---|---|---|---|---|---|---|
| FTL | 0.0020885 | 228 | GTEx | DepMap | Descartes | 4.17 | 2884.21 |
| LYZ | 0.0009867 | 613 | GTEx | DepMap | Descartes | 0.38 | 164.48 |
| MT-ND3 | 0.0004913 | 1307 | GTEx | DepMap | Descartes | 4.59 | 6408.57 |
| ACTB | 0.0004045 | 1592 | GTEx | DepMap | Descartes | 2.42 | 715.08 |
| SRGN | 0.0003346 | 1879 | GTEx | DepMap | Descartes | 0.43 | 256.77 |
| TYROBP | 0.0002031 | 2696 | GTEx | DepMap | Descartes | 0.05 | 47.05 |
| FTH1 | 0.0002001 | 2732 | GTEx | DepMap | Descartes | 1.66 | 797.97 |
| GPIHBP1 | 0.0000644 | 4677 | GTEx | DepMap | Descartes | 0.01 | 1.75 |
| S100A6 | -0.0001918 | 17586 | GTEx | DepMap | Descartes | 0.28 | 251.56 |
Double-negative thymocytes: Double-negative thymocytes (curated markers)
the early immature thymocytes from the thymus in the double negative (co-receptors CD4- and CD8-) stage:
Wilcoxon ranksum test P-value for gene set overrepresentation: 2.43e-03
Mean rank of genes in gene set: 632
Rank on gene expression program of genes in gene set:
| Genes | Weight | Rank | GTEx | DepMap | Decartes | Mean.Counts | Mean.TPM |
|---|---|---|---|---|---|---|---|
| HES1 | 0.0010086 | 594 | GTEx | DepMap | Descartes | 0.30 | 103.63 |
| FXYD2 | 0.0009447 | 646 | GTEx | DepMap | Descartes | 0.02 | 5.03 |
| CD99 | 0.0009296 | 656 | GTEx | DepMap | Descartes | 0.76 | 360.78 |