Program: 51. Adrenergic Neuroblastoma (HTA4_1021).
Program description and justification of annotation generated by GPT5: MYCN/2p24 amplicon-associated ribosome/translation program in adrenergic malignant neuroblastoma (immature-adrenergic bias).
Submit a comment on this gene expression program's interpretation: CLICK
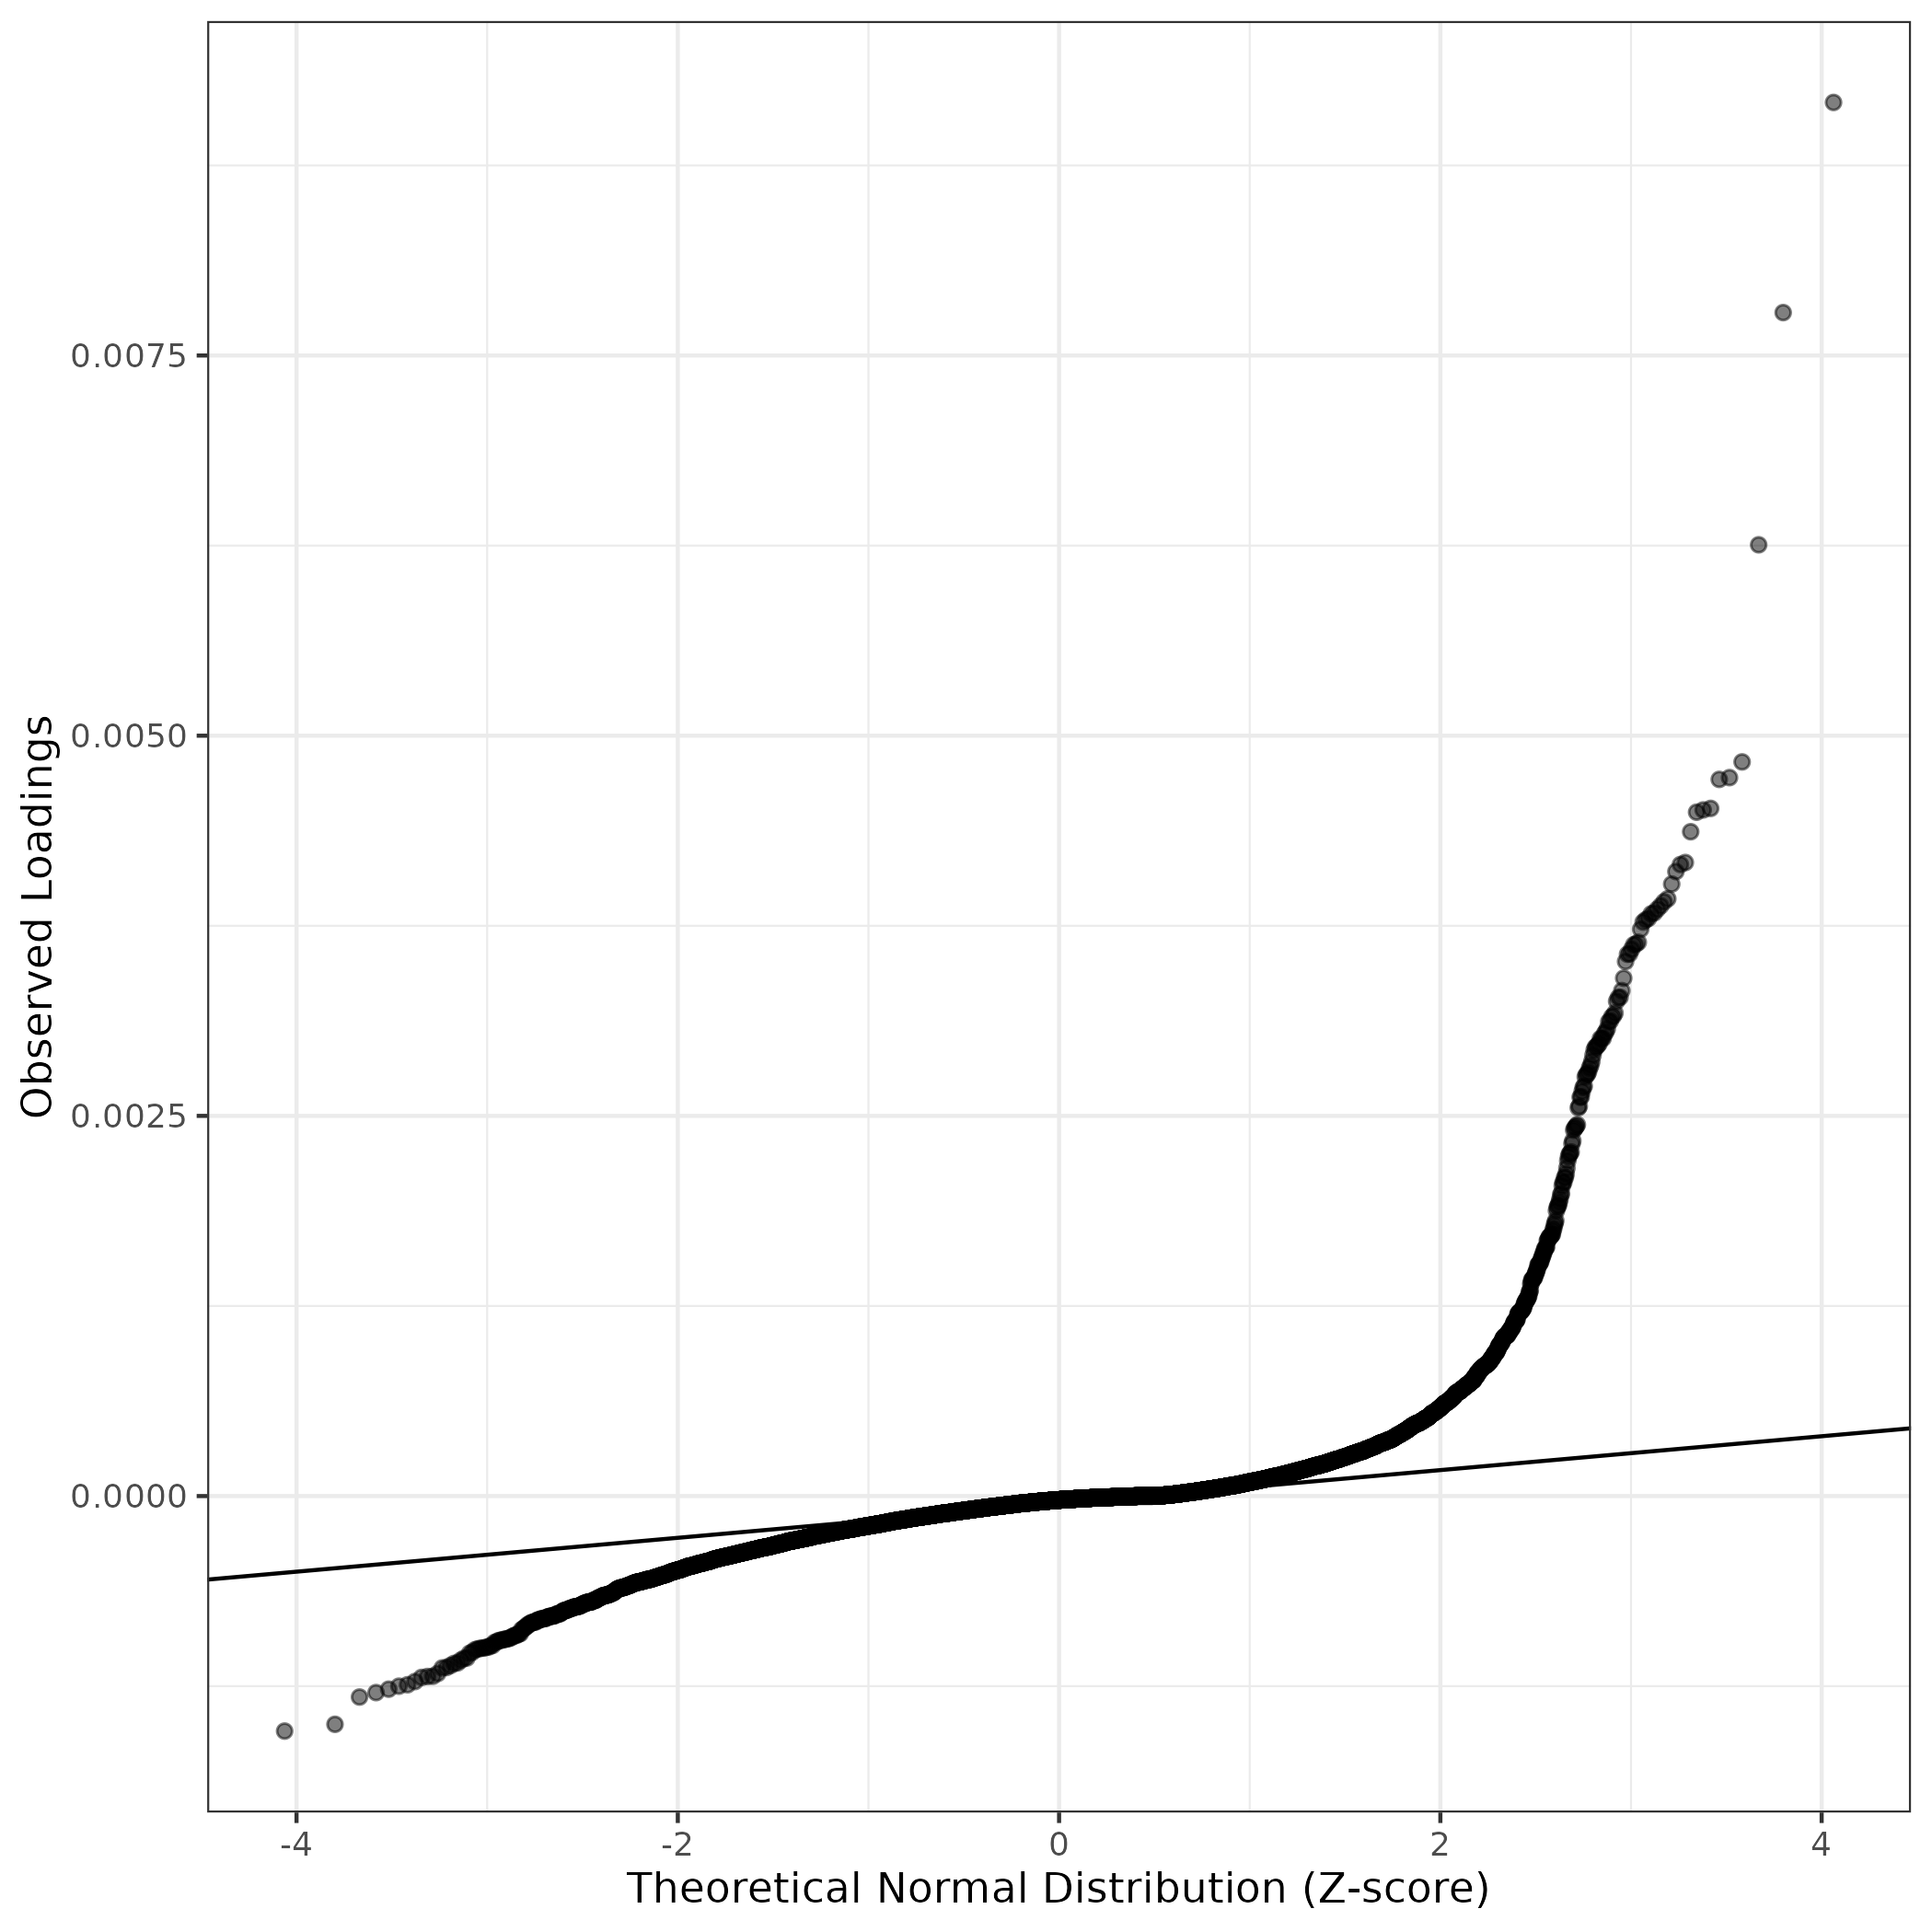
QQ-plot of gene loadings, averaged over both independent splits of the data
This plot highlights the relative contribution of each gene to the GEP
Top genes driving this program.
Note: Decartes website is buggy, try refreshing. Also, Decartes fetal adrenal data have been collected at specific time points (89-122 days), all possible cell types of interest may not be represented, do not overinterpret.
The Mean Count column shows the mean read count in cells scoring highly (H > 50) on this gene expression program.
| Gene | Loading | Gene.Name | GTEx | DepMap | Descartes | Mean.Counts | Mean.Tpm | |
|---|---|---|---|---|---|---|---|---|
| 1 | DDX1 | 0.0091640 | DEAD-box helicase 1 | GTEx | DepMap | Descartes | 163.96 | 26972.11 |
| 2 | NBAS | 0.0077821 | NBAS subunit of NRZ tethering complex | GTEx | DepMap | Descartes | 103.01 | 6670.62 |
| 3 | RPS19 | 0.0062551 | ribosomal protein S19 | GTEx | DepMap | Descartes | 18.69 | 4359.82 |
| 4 | RPS4X | 0.0048275 | ribosomal protein S4 X-linked | GTEx | DepMap | Descartes | 11.23 | 2840.93 |
| 5 | RPS18 | 0.0047243 | ribosomal protein S18 | GTEx | DepMap | Descartes | 19.83 | 7989.20 |
| 6 | MYCN | 0.0047126 | MYCN proto-oncogene, bHLH transcription factor | GTEx | DepMap | Descartes | 8.27 | 1356.75 |
| 7 | RPS3 | 0.0045218 | ribosomal protein S3 | GTEx | DepMap | Descartes | 11.22 | 2399.71 |
| 8 | RPS21 | 0.0045117 | ribosomal protein S21 | GTEx | DepMap | Descartes | 13.83 | 5663.70 |
| 9 | FAM149A | 0.0044969 | family with sequence similarity 149 member A | GTEx | DepMap | Descartes | 1.19 | 196.46 |
| 10 | RPS7 | 0.0043685 | ribosomal protein S7 | GTEx | DepMap | Descartes | 12.27 | 1020.96 |
| 11 | BARHL1 | 0.0041660 | BarH like homeobox 1 | GTEx | DepMap | Descartes | 0.26 | 62.88 |
| 12 | RPL18A | 0.0041528 | ribosomal protein L18a | GTEx | DepMap | Descartes | 8.63 | 2823.21 |
| 13 | RPL29 | 0.0041066 | ribosomal protein L29 | GTEx | DepMap | Descartes | 8.20 | 4191.85 |
| 14 | RPL13 | 0.0040243 | ribosomal protein L13 | GTEx | DepMap | Descartes | 22.83 | 2335.79 |
| 15 | RBFOX3 | 0.0039278 | RNA binding fox-1 homolog 3 | GTEx | DepMap | Descartes | 3.36 | 493.90 |
| 16 | RPS3A | 0.0039080 | ribosomal protein S3A | GTEx | DepMap | Descartes | 11.41 | 3428.71 |
| 17 | RPL3 | 0.0038809 | ribosomal protein L3 | GTEx | DepMap | Descartes | 12.19 | 2532.20 |
| 18 | RPL26 | 0.0038591 | ribosomal protein L26 | GTEx | DepMap | Descartes | 4.66 | 2249.57 |
| 19 | RPL32 | 0.0038348 | ribosomal protein L32 | GTEx | DepMap | Descartes | 10.04 | 2296.74 |
| 20 | MEIS2 | 0.0038289 | Meis homeobox 2 | GTEx | DepMap | Descartes | 10.63 | 851.79 |
| 21 | RPL37A | 0.0037988 | ribosomal protein L37a | GTEx | DepMap | Descartes | 14.40 | 2237.87 |
| 22 | RPL7A | 0.0037891 | ribosomal protein L7a | GTEx | DepMap | Descartes | 9.13 | 3423.24 |
| 23 | SLC17A6 | 0.0037742 | solute carrier family 17 member 6 | GTEx | DepMap | Descartes | 0.34 | 46.46 |
| 24 | RPL10A | 0.0037272 | ribosomal protein L10a | GTEx | DepMap | Descartes | 5.34 | 2299.08 |
| 25 | RPL10 | 0.0036415 | ribosomal protein L10 | GTEx | DepMap | Descartes | 12.37 | 2359.85 |
| 26 | RPS24 | 0.0036296 | ribosomal protein S24 | GTEx | DepMap | Descartes | 16.26 | 2349.58 |
| 27 | RACK1 | 0.0036252 | receptor for activated C kinase 1 | GTEx | DepMap | Descartes | 6.62 | NA |
| 28 | RPL14 | 0.0035953 | ribosomal protein L14 | GTEx | DepMap | Descartes | 6.85 | 426.07 |
| 29 | RPL41 | 0.0035654 | ribosomal protein L41 | GTEx | DepMap | Descartes | 7.83 | 5080.30 |
| 30 | RPL34 | 0.0035628 | ribosomal protein L34 | GTEx | DepMap | Descartes | 10.43 | 1855.74 |
| 31 | RPS14 | 0.0035152 | ribosomal protein S14 | GTEx | DepMap | Descartes | 10.65 | 1554.28 |
| 32 | RPS2 | 0.0034056 | ribosomal protein S2 | GTEx | DepMap | Descartes | 12.13 | 3476.69 |
| 33 | RPS28 | 0.0033236 | ribosomal protein S28 | GTEx | DepMap | Descartes | 6.15 | 1799.48 |
| 34 | MT-CO3 | 0.0032798 | NA | GTEx | DepMap | Descartes | 66.59 | 28869.60 |
| 35 | EEF1B2 | 0.0032776 | eukaryotic translation elongation factor 1 beta 2 | GTEx | DepMap | Descartes | 3.94 | 1677.17 |
| 36 | RPS6 | 0.0032537 | ribosomal protein S6 | GTEx | DepMap | Descartes | 7.52 | 2512.06 |
| 37 | ADARB2 | 0.0031767 | adenosine deaminase RNA specific B2 (inactive) | GTEx | DepMap | Descartes | 7.31 | 399.67 |
| 38 | RPL5 | 0.0031574 | ribosomal protein L5 | GTEx | DepMap | Descartes | 6.99 | 2569.84 |
| 39 | RPL9 | 0.0031513 | ribosomal protein L9 | GTEx | DepMap | Descartes | 7.59 | 1490.88 |
| 40 | EEF1A1 | 0.0031235 | eukaryotic translation elongation factor 1 alpha 1 | GTEx | DepMap | Descartes | 10.61 | 1059.66 |
| 41 | RPL35A | 0.0031192 | ribosomal protein L35a | GTEx | DepMap | Descartes | 6.42 | 2384.21 |
| 42 | RPL21 | 0.0030734 | ribosomal protein L21 | GTEx | DepMap | Descartes | 6.10 | 3440.56 |
| 43 | RPS16 | 0.0030532 | ribosomal protein S16 | GTEx | DepMap | Descartes | 6.03 | 1176.93 |
| 44 | RPL36 | 0.0030400 | ribosomal protein L36 | GTEx | DepMap | Descartes | 9.07 | 4723.93 |
| 45 | RPL4 | 0.0030100 | ribosomal protein L4 | GTEx | DepMap | Descartes | 4.84 | 811.19 |
| 46 | INSM1 | 0.0030086 | INSM transcriptional repressor 1 | GTEx | DepMap | Descartes | 0.99 | 162.50 |
| 47 | MT-CO2 | 0.0030081 | NA | GTEx | DepMap | Descartes | 39.74 | 19339.18 |
| 48 | NECTIN4 | 0.0029759 | nectin cell adhesion molecule 4 | GTEx | DepMap | Descartes | 0.38 | NA |
| 49 | NHLH2 | 0.0029646 | nescient helix-loop-helix 2 | GTEx | DepMap | Descartes | 0.42 | 27.23 |
| 50 | RPS27 | 0.0029564 | ribosomal protein S27 | GTEx | DepMap | Descartes | 7.66 | 5803.47 |
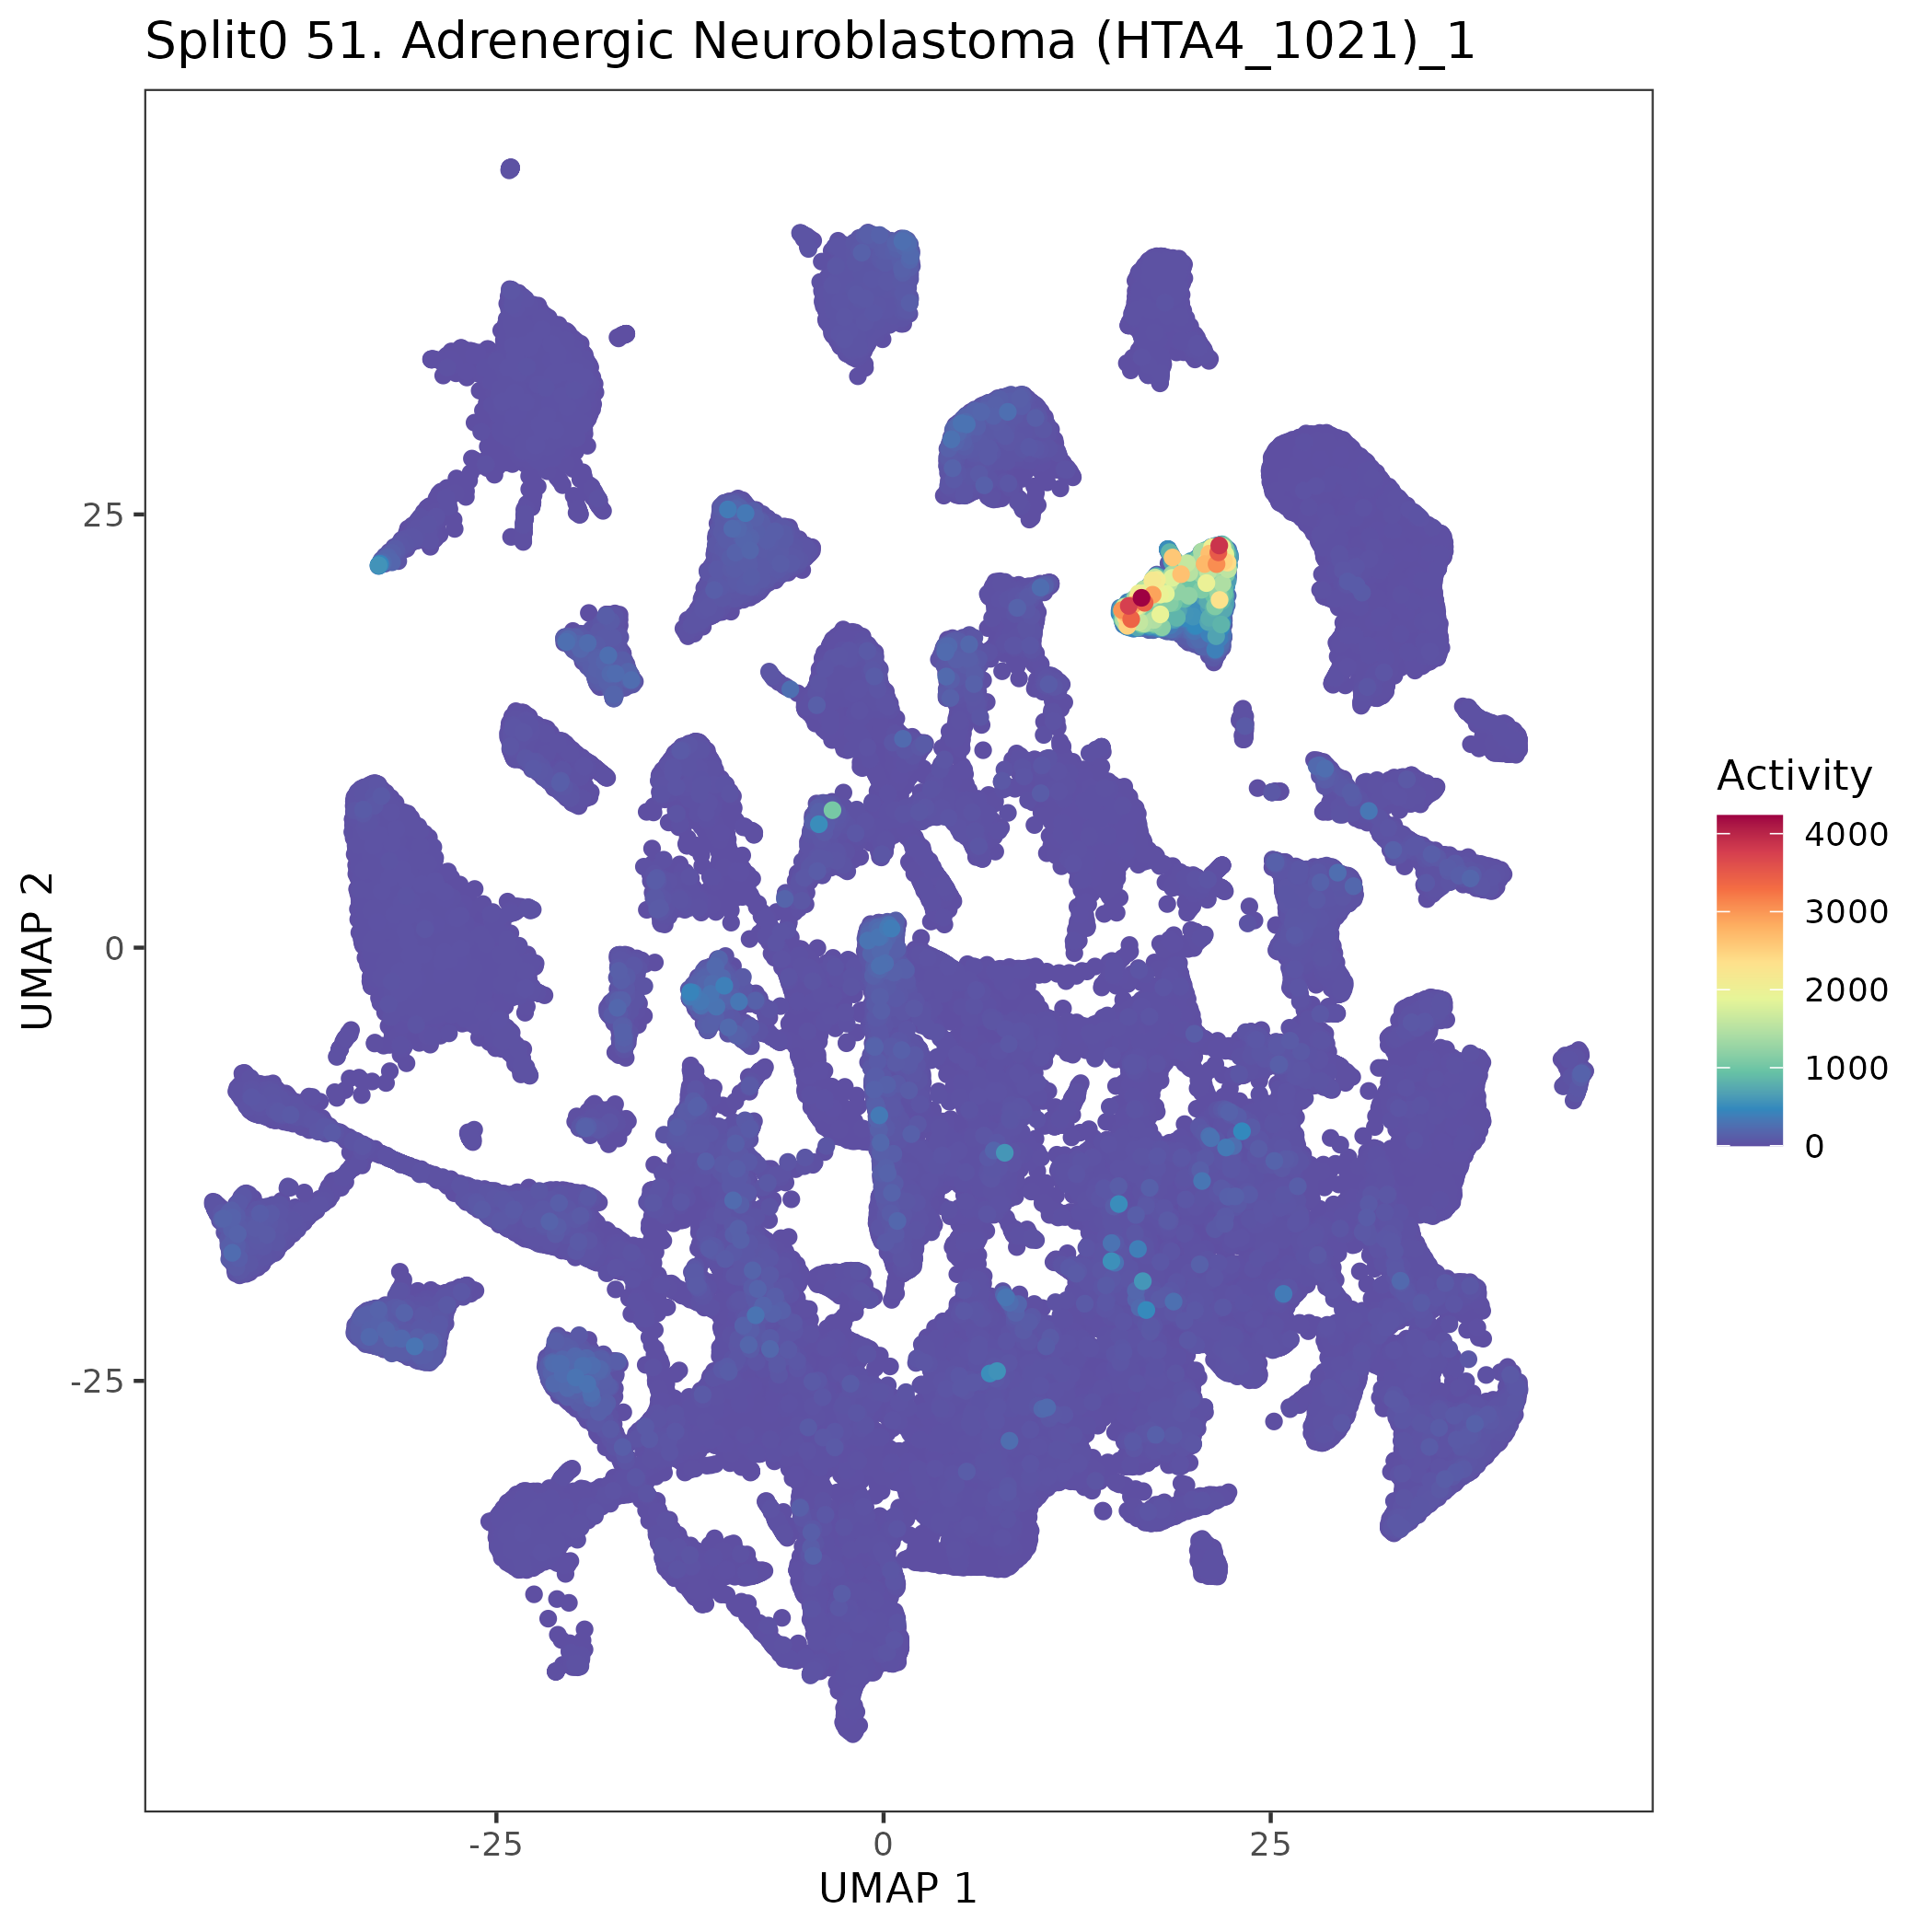
UMAP plots showing activity of gene expression program identified in GEP 51. Adrenergic Neuroblastoma (HTA4_1021):
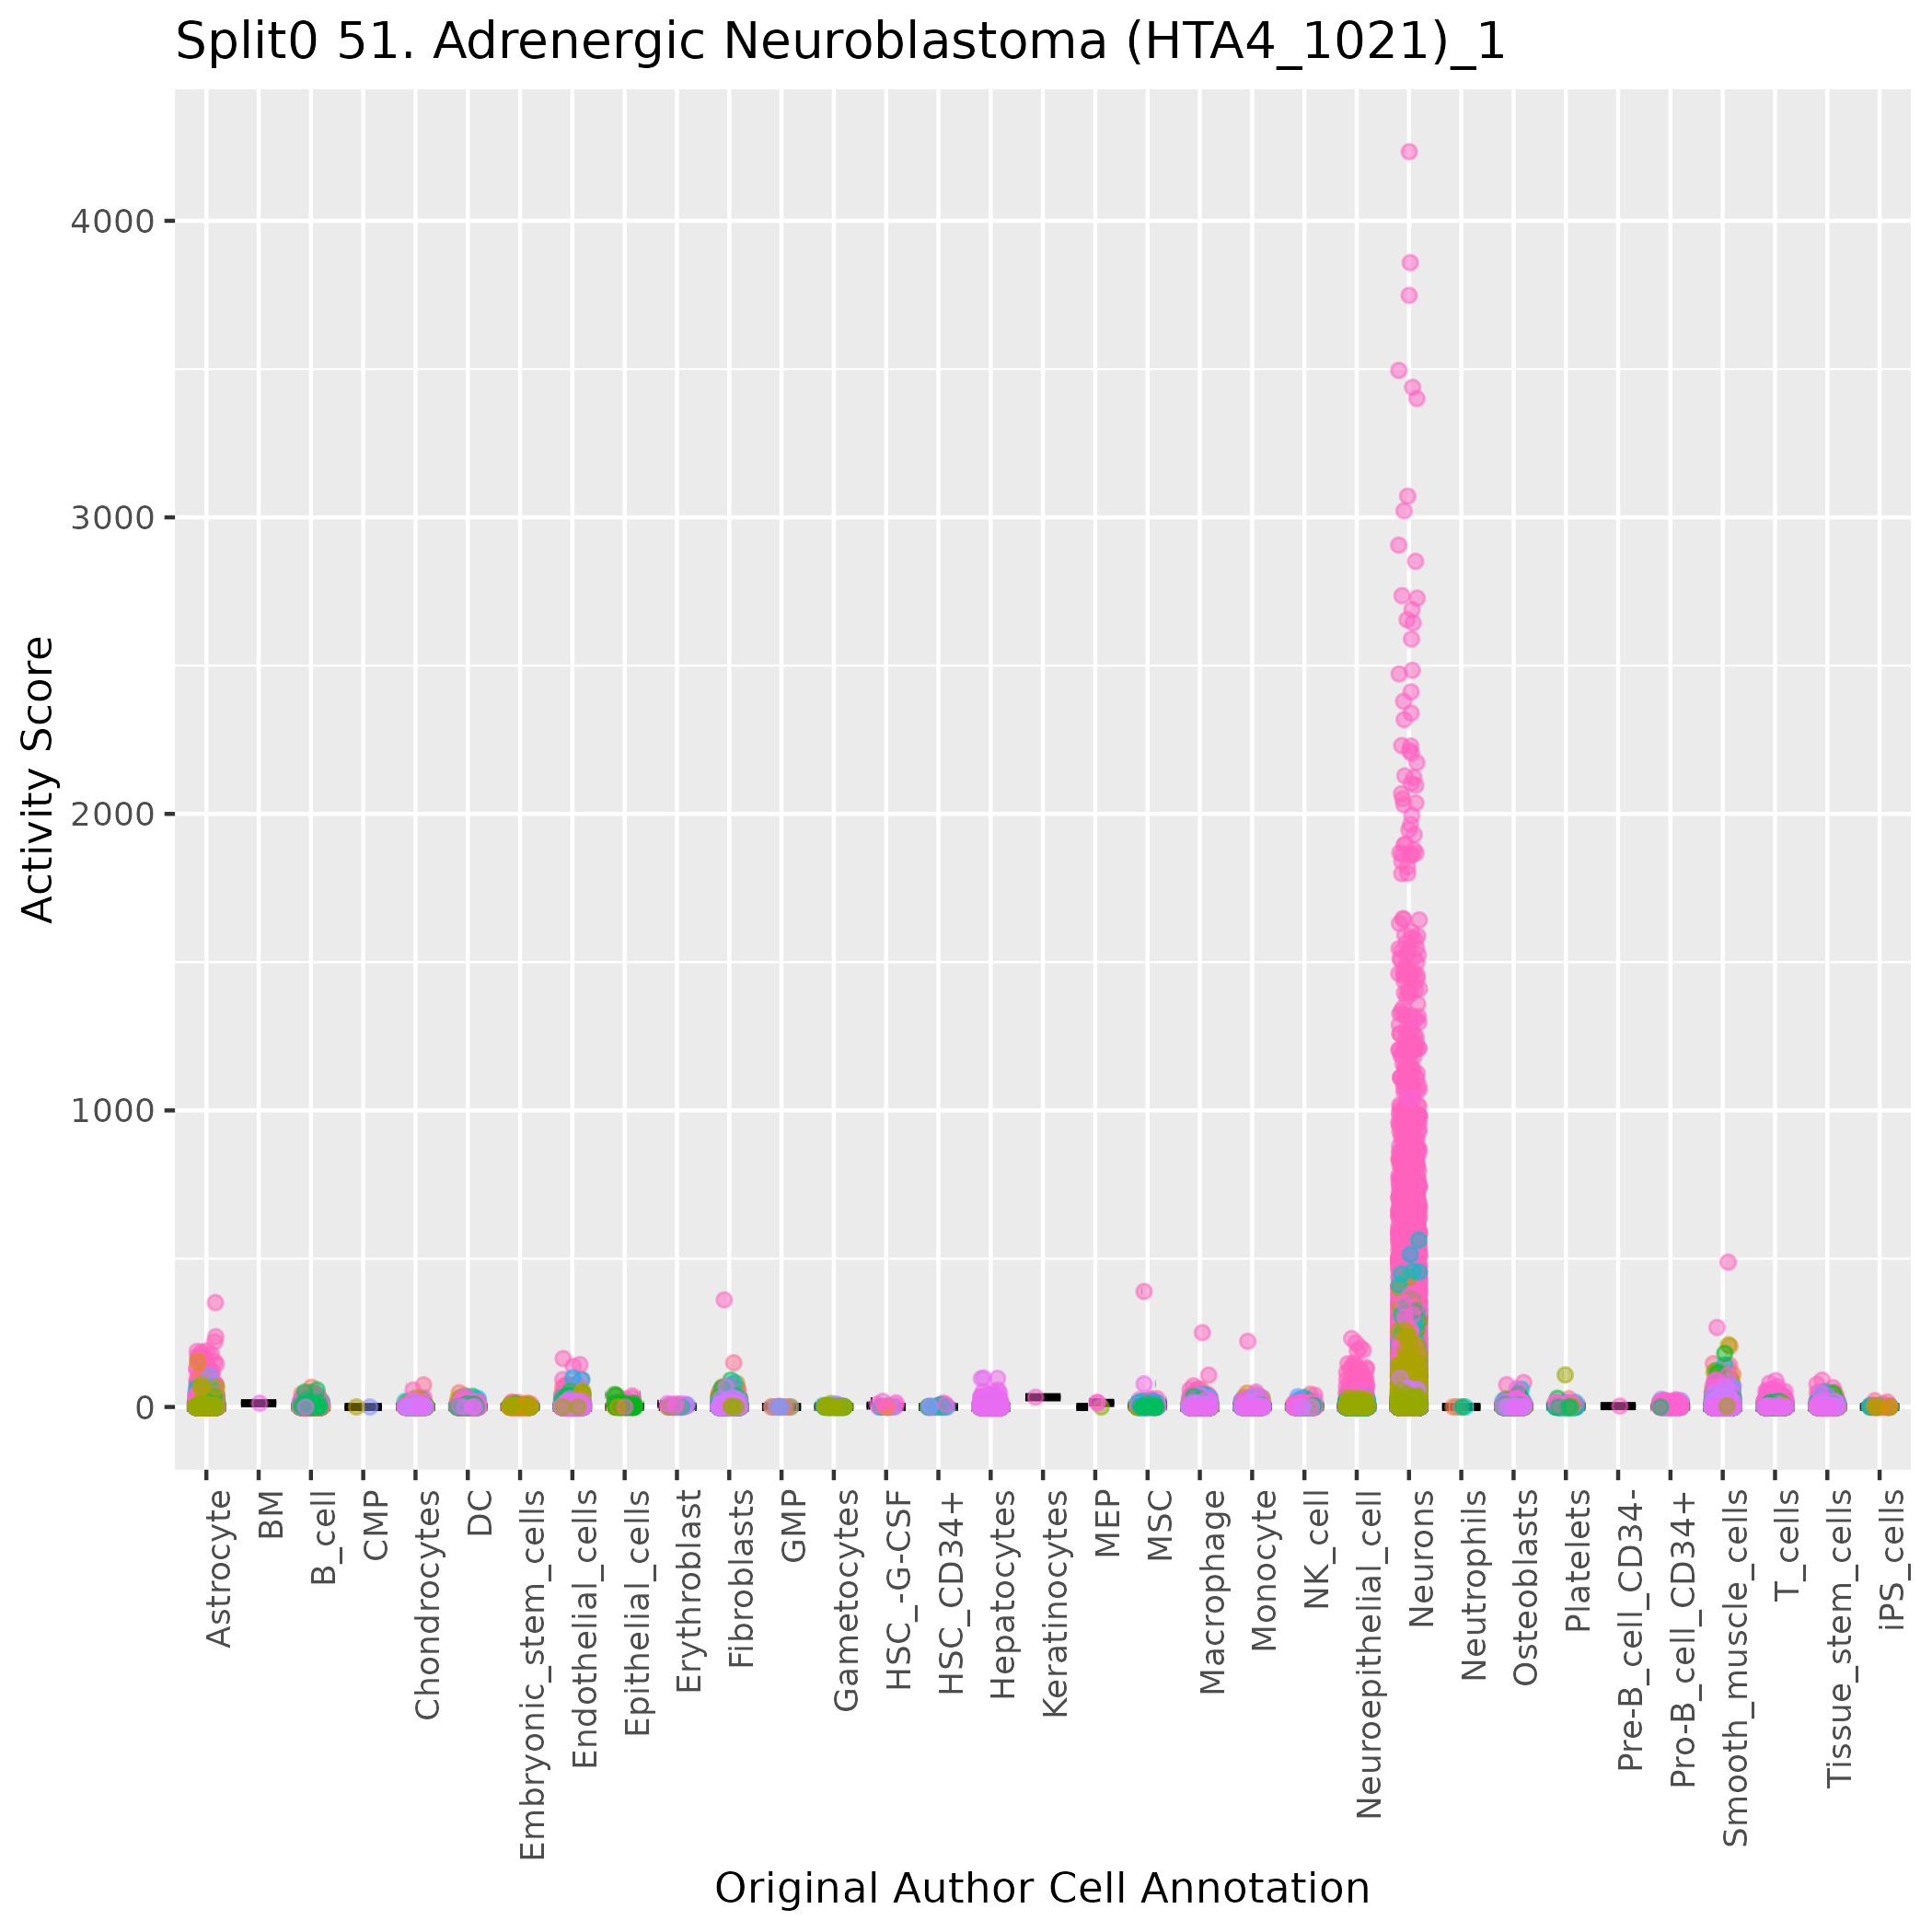
Boxlot showing activity of gene expression program identified in GEP 51. Adrenergic Neuroblastoma (HTA4_1021):
Gene set Enrichments for this program, caculated from top 50 genes
mSigDB Cell Types Gene Set:
| P-value | OR | Lower 95% CI | FDR | FWER | Genes Found | Gene Set Size | |
|---|---|---|---|---|---|---|---|
| BUSSLINGER_GASTRIC_PPP1R1B_POSITIVE_CELLS | 1.52e-63 | 454.60 | 235.37 | 5.10e-61 | 1.02e-60 | 33RPS19, RPS4X, RPS18, RPS3, RPS21, RPL18A, RPL29, RPL13, RPS3A, RPL3, RPL26, RPL32, RPL37A, RPL7A, RPL10A, RPS24, RACK1, RPL14, RPL41, RPL34, RPS14, RPS2, RPS28, EEF1B2, RPS6, RPL5, RPL9, EEF1A1, RPL35A, RPS16, RPL36, RPL4, RPS27 |
121 |
| BUSSLINGER_GASTRIC_LYZ_POSITIVE_CELLS | 1.15e-59 | 414.61 | 218.43 | 1.93e-57 | 7.71e-57 | 31RPS4X, RPS18, RPS3, RPS21, RPS7, RPL18A, RPL29, RPL13, RPS3A, RPL3, RPL26, RPL32, RPL37A, RPL7A, RPL10A, RPL10, RACK1, RPL14, RPL41, RPL34, RPS14, RPS2, RPS28, EEF1B2, RPS6, RPL5, RPL9, EEF1A1, RPL35A, RPL36, RPS27 |
111 |
| RUBENSTEIN_SKELETAL_MUSCLE_T_CELLS | 1.49e-64 | 362.72 | 185.94 | 1.00e-61 | 1.00e-61 | 36RPS19, RPS4X, RPS18, RPS3, RPS21, RPS7, RPL18A, RPL29, RPL13, RPS3A, RPL3, RPL26, RPL32, RPL37A, RPL7A, RPL10A, RPL10, RPS24, RACK1, RPL14, RPL41, RPL34, RPS14, RPS2, RPS28, EEF1B2, RPS6, RPL5, RPL9, EEF1A1, RPL35A, RPL21, RPS16, RPL36, RPL4, RPS27 |
181 |
| RUBENSTEIN_SKELETAL_MUSCLE_B_CELLS | 6.73e-60 | 303.05 | 160.09 | 1.50e-57 | 4.51e-57 | 34RPS19, RPS4X, RPS18, RPS3, RPS21, RPS7, RPL18A, RPL29, RPL13, RPS3A, RPL3, RPL26, RPL32, RPL37A, RPL7A, RPL10, RPS24, RACK1, RPL14, RPL41, RPL34, RPS14, RPS2, RPS28, EEF1B2, RPS6, RPL5, RPL9, EEF1A1, RPL35A, RPL21, RPL36, RPL4, RPS27 |
177 |
| TRAVAGLINI_LUNG_CD4_NAIVE_T_CELL | 1.22e-49 | 250.52 | 133.66 | 1.03e-47 | 8.21e-47 | 28RPS19, RPS3, RPS21, RPS7, RPL18A, RPL29, RPL13, RPS3A, RPL3, RPL26, RPL32, RPL37A, RPL10A, RPL10, RPL14, RPL41, RPL34, RPS14, RPS2, RPS28, RPS6, RPL5, EEF1A1, RPL35A, RPS16, RPL36, RPL4, RPS27 |
132 |
| BUSSLINGER_DUODENAL_TRANSIT_AMPLIFYING_CELLS | 5.12e-56 | 246.87 | 130.24 | 5.73e-54 | 3.44e-53 | 33RPS19, RPS4X, RPS18, RPS3, RPS7, RPL18A, RPL29, RPL13, RPS3A, RPL3, RPL26, RPL32, RPL37A, RPL7A, RPL10A, RPL10, RPS24, RACK1, RPL14, RPL41, RPL34, RPS14, RPS2, RPS28, EEF1B2, RPS6, RPL5, RPL9, EEF1A1, RPL35A, RPS16, RPL36, RPL4 |
194 |
| RUBENSTEIN_SKELETAL_MUSCLE_SATELLITE_CELLS | 7.20e-58 | 213.56 | 109.61 | 9.67e-56 | 4.83e-55 | 37RPS19, RPS4X, RPS18, RPS3, RPS21, RPS7, RPL18A, RPL29, RPL13, RPS3A, RPL3, RPL26, RPL32, RPL37A, RPL7A, RPL10A, RPL10, RPS24, RACK1, RPL14, RPL41, RPL34, RPS14, RPS2, RPS28, MT-CO3, EEF1B2, RPS6, RPL5, RPL9, EEF1A1, RPL35A, RPL21, RPS16, RPL36, RPL4, RPS27 |
310 |
| FAN_OVARY_CL0_XBP1_SELK_HIGH_STROMAL_CELL | 6.18e-44 | 189.20 | 101.70 | 3.77e-42 | 4.14e-41 | 26RPS19, RPS4X, RPS18, RPS3, RPL18A, RPL13, RPS3A, RPL3, RPL26, RPL32, RPL10A, RPL10, RPS24, RACK1, RPL14, RPL41, RPL34, RPS14, RPS2, RPS6, RPL5, RPL9, RPL35A, RPL21, RPL36, RPS27 |
143 |
| TRAVAGLINI_LUNG_CLUB_CELL | 9.92e-40 | 192.70 | 101.15 | 3.70e-38 | 6.66e-37 | 23RPS19, RPS3, RPS21, RPS7, RPL18A, RPL29, RPL13, RPS3A, RPL26, RPL32, RPL37A, RPL10, RPS24, RPL34, RPS14, RPS28, RPS6, RPL5, RPL35A, RPL21, RPS16, RPL36, RPS27 |
114 |
| LAKE_ADULT_KIDNEY_C7_PROXIMAL_TUBULE_EPITHELIAL_CELLS_S3 | 4.19e-40 | 169.77 | 90.60 | 1.76e-38 | 2.81e-37 | 24RPS19, RPS4X, RPS18, RPS21, RPS7, RPL13, RPS3A, RPL3, RPL32, RPL37A, RPL7A, RPS24, RPL14, RPL34, RPS14, RPS28, RPS6, RPL5, RPL9, EEF1A1, RPL35A, RPL21, RPS16, RPL4 |
135 |
| TRAVAGLINI_LUNG_BRONCHIAL_VESSEL_1_CELL | 4.78e-47 | 158.47 | 85.49 | 3.21e-45 | 3.21e-44 | 30RPS19, RPS4X, RPS3, RPS21, RPS7, RPL18A, RPL29, RPL13, RPS3A, RPL3, RPL26, RPL32, RPL37A, RPL10A, RPL10, RPS24, RPL14, RPL41, RPL34, RPS14, RPS2, RPS28, RPS6, RPL5, RPL35A, RPL21, RPS16, RPL36, RPL4, RPS27 |
224 |
| BUSSLINGER_DUODENAL_DIFFERENTIATING_STEM_CELLS | 2.36e-51 | 160.47 | 85.30 | 2.27e-49 | 1.59e-48 | 34RPS19, RPS4X, RPS18, RPS3, RPS7, RPL18A, RPL29, RPL13, RPS3A, RPL3, RPL26, RPL32, RPL37A, RPL7A, RPL10A, RPL10, RPS24, RACK1, RPL14, RPL41, RPL34, RPS14, RPS2, RPS28, EEF1B2, RPS6, RPL5, RPL9, EEF1A1, RPL35A, RPS16, RPL36, RPL4, RPS27 |
305 |
| BUSSLINGER_DUODENAL_STEM_CELLS | 6.95e-49 | 143.03 | 76.42 | 5.18e-47 | 4.66e-46 | 33RPS19, RPS4X, RPS18, RPS3, RPS7, RPL18A, RPL13, RPS3A, RPL3, RPL26, RPL32, RPL37A, RPL7A, RPL10A, RPL10, RPS24, RACK1, RPL14, RPL41, RPL34, RPS14, RPS2, RPS28, EEF1B2, RPS6, RPL5, RPL9, EEF1A1, RPL35A, RPS16, RPL36, RPL4, RPS27 |
311 |
| LAKE_ADULT_KIDNEY_C8_DECENDING_THIN_LIMB | 4.88e-42 | 113.77 | 61.64 | 2.52e-40 | 3.27e-39 | 29RPS19, RPS4X, RPS18, RPS7, RPL13, RPS3A, RPL3, RPL32, RPL37A, RPL7A, RPL10A, RPL10, RPS24, RACK1, RPL14, RPL41, RPL34, RPS14, RPS2, RPS28, EEF1B2, RPS6, RPL5, RPL9, EEF1A1, RPL21, RPS16, RPL4, RPS27 |
278 |
| LAKE_ADULT_KIDNEY_C19_COLLECTING_DUCT_INTERCALATED_CELLS_TYPE_A_MEDULLA | 5.61e-42 | 103.99 | 56.50 | 2.69e-40 | 3.77e-39 | 30RPS19, RPS4X, RPS18, RPS3, RPS7, RPL13, RPS3A, RPL3, RPL32, RPL37A, RPL7A, RPL10A, RPL10, RPS24, RACK1, RPL14, RPL41, RPL34, RPS14, RPS2, RPS28, RPS6, RPL5, RPL9, EEF1A1, RPL35A, RPL21, RPS16, RPL4, RPS27 |
326 |
| LAKE_ADULT_KIDNEY_C9_THIN_ASCENDING_LIMB | 1.83e-36 | 91.66 | 49.89 | 6.14e-35 | 1.23e-33 | 26RPS19, RPS4X, RPS18, RPS3, RPS7, RPL13, RPS3A, RPL3, RPL32, RPL37A, RPL7A, RPL10A, RPL10, RPS24, RACK1, RPL14, RPL34, RPS14, RPS2, RPS6, RPL5, RPL9, EEF1A1, RPL21, RPS16, RPL4 |
268 |
| HAY_BONE_MARROW_NAIVE_T_CELL | 4.15e-41 | 89.90 | 48.79 | 1.86e-39 | 2.78e-38 | 31RPS19, RPS4X, RPS18, RPS3, RPS21, RPS7, RPL18A, RPL29, RPL13, RPS3A, RPL3, RPL32, RPL10A, RPL10, RPL14, RPL41, RPL34, RPS14, RPS2, RPS28, EEF1B2, RPS6, RPL5, RPL9, EEF1A1, RPL35A, RPL21, RPS16, RPL36, RPL4, RPS27 |
403 |
| LAKE_ADULT_KIDNEY_C18_COLLECTING_DUCT_PRINCIPAL_CELLS_MEDULLA | 3.56e-38 | 88.79 | 48.40 | 1.26e-36 | 2.39e-35 | 28RPS19, RPS4X, RPS18, RPS7, RPL13, RPS3A, RPL3, RPL32, RPL37A, RPL7A, RPL10A, RPL10, RPS24, RACK1, RPL14, RPL41, RPL34, RPS14, RPS2, RPS28, RPS6, RPL5, RPL9, EEF1A1, RPL21, RPS16, RPL4, RPS27 |
322 |
| LAKE_ADULT_KIDNEY_C12_THICK_ASCENDING_LIMB | 6.50e-40 | 87.73 | 47.72 | 2.56e-38 | 4.36e-37 | 30RPS19, RPS4X, RPS18, RPS3, RPS21, RPS7, RPL13, RPS3A, RPL3, RPL32, RPL37A, RPL7A, RPL10A, RPL10, RPS24, RACK1, RPL14, RPL41, RPL34, RPS14, RPS28, RPS6, RPL5, RPL9, EEF1A1, RPL35A, RPL21, RPS16, RPL4, RPS27 |
381 |
| TRAVAGLINI_LUNG_PROXIMAL_BASAL_CELL | 1.93e-42 | 80.58 | 42.71 | 1.08e-40 | 1.30e-39 | 35RPS19, RPS4X, RPS18, RPS3, RPS21, RPS7, RPL18A, RPL29, RPL13, RPS3A, RPL3, RPL26, RPL32, MEIS2, RPL7A, RPL10A, RPL10, RPS24, RACK1, RPL14, RPL41, RPL34, RPS14, RPS2, RPS28, EEF1B2, RPS6, RPL5, RPL9, EEF1A1, RPL35A, RPL21, RPS16, RPL36, RPL4 |
629 |
Dowload full table
mSigDB Hallmark Gene Sets:
| P-value | OR | Lower 95% CI | FDR | FWER | Genes Found | Gene Set Size | |
|---|---|---|---|---|---|---|---|
| HALLMARK_MYC_TARGETS_V1 | 4.84e-07 | 17.32 | 6.49 | 2.42e-05 | 2.42e-05 | 7RPS3, RACK1, RPL14, RPL34, RPS2, EEF1B2, RPS6 |
200 |
| HALLMARK_P53_PATHWAY | 1.23e-02 | 6.65 | 1.31 | 2.06e-01 | 6.17e-01 | 3RACK1, RPL36, NHLH2 |
200 |
| HALLMARK_ALLOGRAFT_REJECTION | 1.23e-02 | 6.65 | 1.31 | 2.06e-01 | 6.17e-01 | 3RPS19, RPS3A, RPL9 |
200 |
| HALLMARK_PANCREAS_BETA_CELLS | 9.26e-02 | 10.74 | 0.26 | 1.00e+00 | 1.00e+00 | 1INSM1 |
40 |
| HALLMARK_UNFOLDED_PROTEIN_RESPONSE | 2.40e-01 | 3.74 | 0.09 | 1.00e+00 | 1.00e+00 | 1RPS14 |
113 |
| HALLMARK_G2M_CHECKPOINT | 3.84e-01 | 2.11 | 0.05 | 1.00e+00 | 1.00e+00 | 1MEIS2 |
200 |
| HALLMARK_APICAL_JUNCTION | 3.84e-01 | 2.11 | 0.05 | 1.00e+00 | 1.00e+00 | 1NECTIN4 |
200 |
| HALLMARK_KRAS_SIGNALING_UP | 3.84e-01 | 2.11 | 0.05 | 1.00e+00 | 1.00e+00 | 1MYCN |
200 |
| HALLMARK_TNFA_SIGNALING_VIA_NFKB | 1.00e+00 | 0.00 | 0.00 | 1.00e+00 | 1.00e+00 | 0 |
200 |
| HALLMARK_HYPOXIA | 1.00e+00 | 0.00 | 0.00 | 1.00e+00 | 1.00e+00 | 0 |
200 |
| HALLMARK_CHOLESTEROL_HOMEOSTASIS | 1.00e+00 | 0.00 | 0.00 | 1.00e+00 | 1.00e+00 | 0 |
74 |
| HALLMARK_MITOTIC_SPINDLE | 1.00e+00 | 0.00 | 0.00 | 1.00e+00 | 1.00e+00 | 0 |
199 |
| HALLMARK_WNT_BETA_CATENIN_SIGNALING | 1.00e+00 | 0.00 | 0.00 | 1.00e+00 | 1.00e+00 | 0 |
42 |
| HALLMARK_TGF_BETA_SIGNALING | 1.00e+00 | 0.00 | 0.00 | 1.00e+00 | 1.00e+00 | 0 |
54 |
| HALLMARK_IL6_JAK_STAT3_SIGNALING | 1.00e+00 | 0.00 | 0.00 | 1.00e+00 | 1.00e+00 | 0 |
87 |
| HALLMARK_DNA_REPAIR | 1.00e+00 | 0.00 | 0.00 | 1.00e+00 | 1.00e+00 | 0 |
150 |
| HALLMARK_APOPTOSIS | 1.00e+00 | 0.00 | 0.00 | 1.00e+00 | 1.00e+00 | 0 |
161 |
| HALLMARK_NOTCH_SIGNALING | 1.00e+00 | 0.00 | 0.00 | 1.00e+00 | 1.00e+00 | 0 |
32 |
| HALLMARK_ADIPOGENESIS | 1.00e+00 | 0.00 | 0.00 | 1.00e+00 | 1.00e+00 | 0 |
200 |
| HALLMARK_ESTROGEN_RESPONSE_EARLY | 1.00e+00 | 0.00 | 0.00 | 1.00e+00 | 1.00e+00 | 0 |
200 |
Dowload full table
KEGG Pathways:
| P-value | OR | Lower 95% CI | FDR | FWER | Genes Found | Gene Set Size | |
|---|---|---|---|---|---|---|---|
| KEGG_RIBOSOME | 3.71e-66 | 639.25 | 331.50 | 6.90e-64 | 6.90e-64 | 32RPS19, RPS4X, RPS18, RPS3, RPS21, RPS7, RPL18A, RPL29, RPL13, RPS3A, RPL3, RPL26, RPL32, RPL37A, RPL7A, RPL10A, RPL10, RPS24, RPL14, RPL41, RPL34, RPS2, RPS28, RPS6, RPL5, RPL9, RPL35A, RPL21, RPS16, RPL36, RPL4, RPS27 |
88 |
| KEGG_CARDIAC_MUSCLE_CONTRACTION | 1.57e-02 | 11.11 | 1.29 | 1.00e+00 | 1.00e+00 | 2MT-CO3, MT-CO2 |
79 |
| KEGG_PARKINSONS_DISEASE | 3.94e-02 | 6.68 | 0.78 | 1.00e+00 | 1.00e+00 | 2MT-CO3, MT-CO2 |
130 |
| KEGG_OXIDATIVE_PHOSPHORYLATION | 4.05e-02 | 6.58 | 0.77 | 1.00e+00 | 1.00e+00 | 2MT-CO3, MT-CO2 |
132 |
| KEGG_ALZHEIMERS_DISEASE | 6.07e-02 | 5.22 | 0.61 | 1.00e+00 | 1.00e+00 | 2MT-CO3, MT-CO2 |
166 |
| KEGG_HUNTINGTONS_DISEASE | 7.12e-02 | 4.75 | 0.56 | 1.00e+00 | 1.00e+00 | 2MT-CO3, MT-CO2 |
182 |
| KEGG_MTOR_SIGNALING_PATHWAY | 1.19e-01 | 8.21 | 0.20 | 1.00e+00 | 1.00e+00 | 1RPS6 |
52 |
| KEGG_ADHERENS_JUNCTION | 1.62e-01 | 5.82 | 0.14 | 1.00e+00 | 1.00e+00 | 1NECTIN4 |
73 |
| KEGG_INSULIN_SIGNALING_PATHWAY | 2.83e-01 | 3.08 | 0.08 | 1.00e+00 | 1.00e+00 | 1RPS6 |
137 |
| KEGG_N_GLYCAN_BIOSYNTHESIS | 1.00e+00 | 0.00 | 0.00 | 1.00e+00 | 1.00e+00 | 0 |
46 |
| KEGG_OTHER_GLYCAN_DEGRADATION | 1.00e+00 | 0.00 | 0.00 | 1.00e+00 | 1.00e+00 | 0 |
16 |
| KEGG_O_GLYCAN_BIOSYNTHESIS | 1.00e+00 | 0.00 | 0.00 | 1.00e+00 | 1.00e+00 | 0 |
30 |
| KEGG_GLYCOSAMINOGLYCAN_DEGRADATION | 1.00e+00 | 0.00 | 0.00 | 1.00e+00 | 1.00e+00 | 0 |
21 |
| KEGG_GLYCOSAMINOGLYCAN_BIOSYNTHESIS_KERATAN_SULFATE | 1.00e+00 | 0.00 | 0.00 | 1.00e+00 | 1.00e+00 | 0 |
15 |
| KEGG_GLYCEROLIPID_METABOLISM | 1.00e+00 | 0.00 | 0.00 | 1.00e+00 | 1.00e+00 | 0 |
49 |
| KEGG_GLYCOSYLPHOSPHATIDYLINOSITOL_GPI_ANCHOR_BIOSYNTHESIS | 1.00e+00 | 0.00 | 0.00 | 1.00e+00 | 1.00e+00 | 0 |
25 |
| KEGG_GLYCEROPHOSPHOLIPID_METABOLISM | 1.00e+00 | 0.00 | 0.00 | 1.00e+00 | 1.00e+00 | 0 |
77 |
| KEGG_ETHER_LIPID_METABOLISM | 1.00e+00 | 0.00 | 0.00 | 1.00e+00 | 1.00e+00 | 0 |
33 |
| KEGG_ARACHIDONIC_ACID_METABOLISM | 1.00e+00 | 0.00 | 0.00 | 1.00e+00 | 1.00e+00 | 0 |
58 |
| KEGG_LINOLEIC_ACID_METABOLISM | 1.00e+00 | 0.00 | 0.00 | 1.00e+00 | 1.00e+00 | 0 |
29 |
Dowload full table
CHR Positional Gene Sets:
| P-value | OR | Lower 95% CI | FDR | FWER | Genes Found | Gene Set Size | |
|---|---|---|---|---|---|---|---|
| chr2p24 | 7.66e-04 | 18.45 | 3.59 | 2.13e-01 | 2.13e-01 | 3DDX1, NBAS, MYCN |
74 |
| MT | 3.63e-03 | 24.43 | 2.77 | 5.05e-01 | 1.00e+00 | 2MT-CO3, MT-CO2 |
37 |
| chr19p13 | 4.29e-01 | 1.70 | 0.34 | 1.00e+00 | 1.00e+00 | 3RPL18A, RPS28, RPL36 |
773 |
| chr9q34 | 1.70e-01 | 2.77 | 0.32 | 1.00e+00 | 1.00e+00 | 2BARHL1, RPL7A |
311 |
| chr6p21 | 3.05e-01 | 1.84 | 0.22 | 1.00e+00 | 1.00e+00 | 2RPS18, RPL10A |
467 |
| chr11p14 | 1.27e-01 | 7.62 | 0.19 | 1.00e+00 | 1.00e+00 | 1SLC17A6 |
56 |
| chr15q14 | 1.27e-01 | 7.62 | 0.19 | 1.00e+00 | 1.00e+00 | 1MEIS2 |
56 |
| chr6q13 | 1.27e-01 | 7.62 | 0.19 | 1.00e+00 | 1.00e+00 | 1EEF1A1 |
56 |
| chr4p14 | 1.44e-01 | 6.65 | 0.16 | 1.00e+00 | 1.00e+00 | 1RPL9 |
64 |
| chr10p15 | 1.88e-01 | 4.93 | 0.12 | 1.00e+00 | 1.00e+00 | 1ADARB2 |
86 |
| chr4q25 | 1.90e-01 | 4.87 | 0.12 | 1.00e+00 | 1.00e+00 | 1RPL34 |
87 |
| chr4q35 | 2.25e-01 | 4.03 | 0.10 | 1.00e+00 | 1.00e+00 | 1FAM149A |
105 |
| chr5q33 | 2.32e-01 | 3.88 | 0.10 | 1.00e+00 | 1.00e+00 | 1RPS14 |
109 |
| chr2p25 | 2.47e-01 | 3.61 | 0.09 | 1.00e+00 | 1.00e+00 | 1RPS7 |
117 |
| chr19q13 | 1.00e+00 | 0.74 | 0.09 | 1.00e+00 | 1.00e+00 | 2RPS19, RPS16 |
1165 |
| chr3q29 | 2.56e-01 | 3.46 | 0.09 | 1.00e+00 | 1.00e+00 | 1RPL35A |
122 |
| chr15q22 | 2.60e-01 | 3.41 | 0.08 | 1.00e+00 | 1.00e+00 | 1RPL4 |
124 |
| chr2q35 | 2.63e-01 | 3.35 | 0.08 | 1.00e+00 | 1.00e+00 | 1RPL37A |
126 |
| chr1p22 | 2.69e-01 | 3.27 | 0.08 | 1.00e+00 | 1.00e+00 | 1RPL5 |
129 |
| chr16q24 | 2.70e-01 | 3.25 | 0.08 | 1.00e+00 | 1.00e+00 | 1RPL13 |
130 |
Dowload full table
Transcription Factor Targets:
| P-value | OR | Lower 95% CI | FDR | FWER | Genes Found | Gene Set Size | |
|---|---|---|---|---|---|---|---|
| ZZZ3_TARGET_GENES | 2.68e-13 | 46.26 | 20.08 | 4.34e-11 | 3.04e-10 | 10RPS18, RPS3, RPS7, RPS3A, RPL37A, RPL10A, RPL41, RPS14, RPS2, RPL35A |
121 |
| TAF9B_TARGET_GENES | 6.85e-25 | 35.04 | 19.13 | 7.76e-22 | 7.76e-22 | 24DDX1, RPS4X, RPS3, RPL29, RPL3, RPL26, MEIS2, RPL37A, RPL7A, RPL10A, RPL10, RPS24, RACK1, RPL14, RPL41, RPL34, RPS14, RPS28, RPS6, RPL5, EEF1A1, RPL35A, RPL4, RPS27 |
565 |
| PER1_TARGET_GENES | 1.19e-06 | 61.45 | 15.09 | 7.92e-05 | 1.35e-03 | 4RPL3, RPL34, EEF1A1, RPL21 |
33 |
| ZNF318_TARGET_GENES | 3.13e-17 | 24.22 | 12.70 | 1.77e-14 | 3.55e-14 | 18RPS18, RPS3, RPS7, RPL29, RPL13, RPS3A, RPL26, RPL32, RPL37A, RPL7A, RPS24, RACK1, RPL41, RPL34, RPS14, RPL5, EEF1A1, RPL4 |
495 |
| FOXR2_TARGET_GENES | 1.84e-10 | 22.92 | 10.09 | 2.08e-08 | 2.08e-07 | 10RPS18, RPS21, RPL32, RACK1, RPL34, RPS14, RPS6, EEF1A1, RPS16, RPS27 |
234 |
| HJURP_TARGET_GENES | 4.21e-05 | 52.28 | 9.78 | 1.71e-03 | 4.78e-02 | 3RPL3, RACK1, EEF1A1 |
28 |
| GTF2A2_TARGET_GENES | 3.54e-14 | 19.10 | 9.78 | 8.01e-12 | 4.01e-11 | 16RPS18, RPS3, RPS7, RPL29, RPL13, RPS3A, RPL3, RPL37A, RPL10, RPS24, RPS2, RPS6, EEF1A1, RPL36, RPL4, RPS27 |
522 |
| FOXE1_TARGET_GENES | 1.22e-15 | 17.76 | 9.43 | 4.61e-13 | 1.38e-12 | 19RPS4X, RPS3, BARHL1, RPL29, RPL13, RPL3, RPL26, RPL32, RPL10A, RPS24, RPL41, RPS14, RPS28, RPS6, RPL5, RPL9, RPL4, INSM1, RPS27 |
728 |
| SNRNP70_TARGET_GENES | 2.54e-14 | 13.85 | 7.43 | 7.19e-12 | 2.88e-11 | 20RPS19, RPS3, RPL13, RPL3, RPL26, RPL32, RPL7A, RPL10, RPS24, RACK1, RPL41, RPS14, RPS2, RPS6, RPL5, RPL9, EEF1A1, RPL35A, RPS16, MT-CO2 |
1009 |
| ADA2_TARGET_GENES | 4.23e-11 | 11.64 | 5.98 | 5.98e-09 | 4.79e-08 | 16DDX1, RPS18, RPS3, RPS7, RPL29, RPL13, RPS3A, RPL3, RPL32, MEIS2, RPS24, RPS14, RPS2, RPL5, RPL9, EEF1A1 |
846 |
| NFRKB_TARGET_GENES | 1.16e-13 | 10.43 | 5.72 | 2.18e-11 | 1.31e-10 | 24DDX1, NBAS, RPS19, RPS18, RPS3, RPS7, RPL29, RPS3A, RPL3, RPL26, RPL32, RPS24, RACK1, RPL14, RPL41, RPL34, EEF1B2, RPS6, RPL9, RPL35A, RPL21, RPL36, RPL4, RPS27 |
1843 |
| KAT5_TARGET_GENES | 1.19e-10 | 10.81 | 5.55 | 1.50e-08 | 1.35e-07 | 16DDX1, RPL18A, RPL13, RPL32, RPL37A, RPL10A, RPL10, RPS24, RPL34, RPS14, MT-CO3, EEF1B2, RPS6, RPL5, EEF1A1, RPL36 |
910 |
| CAGNWMCNNNGAC_UNKNOWN | 6.08e-05 | 21.24 | 5.43 | 2.15e-03 | 6.89e-02 | 4BARHL1, SLC17A6, RPL4, NHLH2 |
88 |
| PSMB5_TARGET_GENES | 6.23e-07 | 13.08 | 5.26 | 4.71e-05 | 7.06e-04 | 8RPL3, RPL32, RPL10A, RPL10, RPS2, RPS28, EEF1A1, RPS27 |
307 |
| SETD7_TARGET_GENES | 3.82e-09 | 9.02 | 4.56 | 3.61e-07 | 4.33e-06 | 15RPS19, RPL13, RPS3A, RPL3, RPL26, MEIS2, RPL10, RACK1, RPL14, RPS14, RPS2, RPS6, RPL5, EEF1A1, RPL4 |
991 |
| KAT2A_TARGET_GENES | 3.30e-09 | 8.48 | 4.35 | 3.40e-07 | 3.74e-06 | 16DDX1, RPS4X, RPS3, RPS7, RPL29, RPL3, RPL7A, RACK1, RPL41, RPL34, RPS2, RPL5, RPL9, RPL35A, RPS16, RPL36 |
1157 |
| TMTCGCGANR_UNKNOWN | 4.88e-05 | 14.17 | 4.33 | 1.88e-03 | 5.53e-02 | 5RPS19, RPS7, RPL26, RPL10A, RPS6 |
166 |
| AUTS2_TARGET_GENES | 1.02e-06 | 10.20 | 4.33 | 7.19e-05 | 1.15e-03 | 9RPS19, MYCN, RPL26, RACK1, RPS28, RPL5, RPL9, RPL4, INSM1 |
451 |
| TET1_TARGET_GENES | 5.32e-08 | 8.57 | 4.17 | 4.63e-06 | 6.02e-05 | 13DDX1, RPS19, RPS7, RPL18A, RPL29, RPS3A, RPL3, RPL10A, RPS24, RPS28, RPS6, RPL5, RPL35A |
855 |
| GGCNKCCATNK_UNKNOWN | 2.08e-04 | 15.26 | 3.93 | 6.03e-03 | 2.35e-01 | 4RPL18A, RPL32, RPL4, RPS27 |
121 |
Dowload full table
GO Biological Processes:
| P-value | OR | Lower 95% CI | FDR | FWER | Genes Found | Gene Set Size | |
|---|---|---|---|---|---|---|---|
| GOBP_COTRANSLATIONAL_PROTEIN_TARGETING_TO_MEMBRANE | 1.34e-65 | 538.00 | 275.82 | 5.00e-62 | 9.99e-62 | 33RPS19, RPS4X, RPS18, RPS3, RPS21, RPS7, RPL18A, RPL29, RPL13, RPS3A, RPL3, RPL26, RPL32, RPL37A, RPL7A, RPL10A, RPL10, RPS24, RPL14, RPL41, RPL34, RPS14, RPS2, RPS28, RPS6, RPL5, RPL9, RPL35A, RPL21, RPS16, RPL36, RPL4, RPS27 |
107 |
| GOBP_NUCLEAR_TRANSCRIBED_MRNA_CATABOLIC_PROCESS_NONSENSE_MEDIATED_DECAY | 2.34e-66 | 503.83 | 258.42 | 1.75e-62 | 1.75e-62 | 34NBAS, RPS19, RPS4X, RPS18, RPS3, RPS21, RPS7, RPL18A, RPL29, RPL13, RPS3A, RPL3, RPL26, RPL32, RPL37A, RPL7A, RPL10A, RPL10, RPS24, RPL14, RPL41, RPL34, RPS14, RPS2, RPS28, RPS6, RPL5, RPL9, RPL35A, RPL21, RPS16, RPL36, RPL4, RPS27 |
120 |
| GOBP_ESTABLISHMENT_OF_PROTEIN_LOCALIZATION_TO_ENDOPLASMIC_RETICULUM | 1.52e-63 | 454.60 | 235.37 | 3.79e-60 | 1.14e-59 | 33RPS19, RPS4X, RPS18, RPS3, RPS21, RPS7, RPL18A, RPL29, RPL13, RPS3A, RPL3, RPL26, RPL32, RPL37A, RPL7A, RPL10A, RPL10, RPS24, RPL14, RPL41, RPL34, RPS14, RPS2, RPS28, RPS6, RPL5, RPL9, RPL35A, RPL21, RPS16, RPL36, RPL4, RPS27 |
121 |
| GOBP_PROTEIN_LOCALIZATION_TO_ENDOPLASMIC_RETICULUM | 3.66e-60 | 341.56 | 180.96 | 6.84e-57 | 2.74e-56 | 33RPS19, RPS4X, RPS18, RPS3, RPS21, RPS7, RPL18A, RPL29, RPL13, RPS3A, RPL3, RPL26, RPL32, RPL37A, RPL7A, RPL10A, RPL10, RPS24, RPL14, RPL41, RPL34, RPS14, RPS2, RPS28, RPS6, RPL5, RPL9, RPL35A, RPL21, RPS16, RPL36, RPL4, RPS27 |
149 |
| GOBP_TRANSLATIONAL_INITIATION | 1.66e-58 | 274.32 | 143.81 | 2.48e-55 | 1.24e-54 | 34DDX1, RPS19, RPS4X, RPS18, RPS3, RPS21, RPS7, RPL18A, RPL29, RPL13, RPS3A, RPL3, RPL26, RPL32, RPL37A, RPL7A, RPL10A, RPL10, RPS24, RPL14, RPL41, RPL34, RPS14, RPS2, RPS28, RPS6, RPL5, RPL9, RPL35A, RPL21, RPS16, RPL36, RPL4, RPS27 |
193 |
| GOBP_NUCLEAR_TRANSCRIBED_MRNA_CATABOLIC_PROCESS | 2.58e-57 | 251.83 | 131.28 | 3.22e-54 | 1.93e-53 | 34NBAS, RPS19, RPS4X, RPS18, RPS3, RPS21, RPS7, RPL18A, RPL29, RPL13, RPS3A, RPL3, RPL26, RPL32, RPL37A, RPL7A, RPL10A, RPL10, RPS24, RPL14, RPL41, RPL34, RPS14, RPS2, RPS28, RPS6, RPL5, RPL9, RPL35A, RPL21, RPS16, RPL36, RPL4, RPS27 |
208 |
| GOBP_VIRAL_GENE_EXPRESSION | 1.06e-55 | 240.96 | 127.31 | 1.13e-52 | 7.92e-52 | 33RPS19, RPS4X, RPS18, RPS3, RPS21, RPS7, RPL18A, RPL29, RPL13, RPS3A, RPL3, RPL26, RPL32, RPL37A, RPL7A, RPL10A, RPL10, RPS24, RPL14, RPL41, RPL34, RPS14, RPS2, RPS28, RPS6, RPL5, RPL9, RPL35A, RPL21, RPS16, RPL36, RPL4, RPS27 |
198 |
| GOBP_PROTEIN_TARGETING_TO_MEMBRANE | 6.07e-55 | 226.30 | 120.07 | 5.67e-52 | 4.54e-51 | 33RPS19, RPS4X, RPS18, RPS3, RPS21, RPS7, RPL18A, RPL29, RPL13, RPS3A, RPL3, RPL26, RPL32, RPL37A, RPL7A, RPL10A, RPL10, RPS24, RPL14, RPL41, RPL34, RPS14, RPS2, RPS28, RPS6, RPL5, RPL9, RPL35A, RPL21, RPS16, RPL36, RPL4, RPS27 |
208 |
| GOBP_ESTABLISHMENT_OF_PROTEIN_LOCALIZATION_TO_MEMBRANE | 3.26e-49 | 137.14 | 73.09 | 2.71e-46 | 2.44e-45 | 34RPS19, RPS4X, RPS18, RPS3, RPS21, RPS7, RPL18A, RPL29, RPL13, RPS3A, RPL3, RPL26, RPL32, RPL37A, RPL7A, RPL10A, RPL10, RPS24, RACK1, RPL14, RPL41, RPL34, RPS14, RPS2, RPS28, RPS6, RPL5, RPL9, RPL35A, RPL21, RPS16, RPL36, RPL4, RPS27 |
351 |
| GOBP_RNA_CATABOLIC_PROCESS | 9.95e-47 | 115.19 | 61.03 | 7.45e-44 | 7.45e-43 | 34NBAS, RPS19, RPS4X, RPS18, RPS3, RPS21, RPS7, RPL18A, RPL29, RPL13, RPS3A, RPL3, RPL26, RPL32, RPL37A, RPL7A, RPL10A, RPL10, RPS24, RPL14, RPL41, RPL34, RPS14, RPS2, RPS28, RPS6, RPL5, RPL9, RPL35A, RPL21, RPS16, RPL36, RPL4, RPS27 |
414 |
| GOBP_PROTEIN_TARGETING | 7.03e-44 | 98.63 | 52.80 | 4.78e-41 | 5.26e-40 | 33RPS19, RPS4X, RPS18, RPS3, RPS21, RPS7, RPL18A, RPL29, RPL13, RPS3A, RPL3, RPL26, RPL32, RPL37A, RPL7A, RPL10A, RPL10, RPS24, RPL14, RPL41, RPL34, RPS14, RPS2, RPS28, RPS6, RPL5, RPL9, RPL35A, RPL21, RPS16, RPL36, RPL4, RPS27 |
438 |
| GOBP_PEPTIDE_BIOSYNTHETIC_PROCESS | 9.41e-44 | 83.28 | 43.01 | 5.87e-41 | 7.04e-40 | 37DDX1, RPS19, RPS4X, RPS18, RPS3, RPS21, RPS7, RPL18A, RPL29, RPL13, RPS3A, RPL3, RPL26, RPL32, RPL37A, RPL7A, RPL10A, RPL10, RPS24, RACK1, RPL14, RPL41, RPL34, RPS14, RPS2, RPS28, EEF1B2, RPS6, RPL5, RPL9, EEF1A1, RPL35A, RPL21, RPS16, RPL36, RPL4, RPS27 |
740 |
| GOBP_ESTABLISHMENT_OF_PROTEIN_LOCALIZATION_TO_ORGANELLE | 5.79e-40 | 73.32 | 39.45 | 2.55e-37 | 4.33e-36 | 33RPS19, RPS4X, RPS18, RPS3, RPS21, RPS7, RPL18A, RPL29, RPL13, RPS3A, RPL3, RPL26, RPL32, RPL37A, RPL7A, RPL10A, RPL10, RPS24, RPL14, RPL41, RPL34, RPS14, RPS2, RPS28, RPS6, RPL5, RPL9, RPL35A, RPL21, RPS16, RPL36, RPL4, RPS27 |
576 |
| GOBP_ORGANIC_CYCLIC_COMPOUND_CATABOLIC_PROCESS | 2.23e-40 | 72.34 | 38.61 | 1.04e-37 | 1.67e-36 | 34NBAS, RPS19, RPS4X, RPS18, RPS3, RPS21, RPS7, RPL18A, RPL29, RPL13, RPS3A, RPL3, RPL26, RPL32, RPL37A, RPL7A, RPL10A, RPL10, RPS24, RPL14, RPL41, RPL34, RPS14, RPS2, RPS28, RPS6, RPL5, RPL9, RPL35A, RPL21, RPS16, RPL36, RPL4, RPS27 |
637 |
| GOBP_PROTEIN_LOCALIZATION_TO_MEMBRANE | 6.59e-40 | 69.89 | 37.38 | 2.74e-37 | 4.93e-36 | 34RPS19, RPS4X, RPS18, RPS3, RPS21, RPS7, RPL18A, RPL29, RPL13, RPS3A, RPL3, RPL26, RPL32, RPL37A, RPL7A, RPL10A, RPL10, RPS24, RACK1, RPL14, RPL41, RPL34, RPS14, RPS2, RPS28, RPS6, RPL5, RPL9, RPL35A, RPL21, RPS16, RPL36, RPL4, RPS27 |
658 |
| GOBP_AMIDE_BIOSYNTHETIC_PROCESS | 4.24e-41 | 69.78 | 36.05 | 2.44e-38 | 3.17e-37 | 37DDX1, RPS19, RPS4X, RPS18, RPS3, RPS21, RPS7, RPL18A, RPL29, RPL13, RPS3A, RPL3, RPL26, RPL32, RPL37A, RPL7A, RPL10A, RPL10, RPS24, RACK1, RPL14, RPL41, RPL34, RPS14, RPS2, RPS28, EEF1B2, RPS6, RPL5, RPL9, EEF1A1, RPL35A, RPL21, RPS16, RPL36, RPL4, RPS27 |
877 |
| GOBP_MRNA_METABOLIC_PROCESS | 4.60e-41 | 69.61 | 35.96 | 2.46e-38 | 3.44e-37 | 37DDX1, NBAS, RPS19, RPS4X, RPS18, RPS3, RPS21, RPS7, RPL18A, RPL29, RPL13, RBFOX3, RPS3A, RPL3, RPL26, RPL32, RPL37A, RPL7A, RPL10A, RPL10, RPS24, RPL14, RPL41, RPL34, RPS14, RPS2, RPS28, RPS6, ADARB2, RPL5, RPL9, RPL35A, RPL21, RPS16, RPL36, RPL4, RPS27 |
879 |
| GOBP_PEPTIDE_METABOLIC_PROCESS | 1.20e-40 | 67.69 | 34.96 | 6.01e-38 | 9.01e-37 | 37DDX1, RPS19, RPS4X, RPS18, RPS3, RPS21, RPS7, RPL18A, RPL29, RPL13, RPS3A, RPL3, RPL26, RPL32, RPL37A, RPL7A, RPL10A, RPL10, RPS24, RACK1, RPL14, RPL41, RPL34, RPS14, RPS2, RPS28, EEF1B2, RPS6, RPL5, RPL9, EEF1A1, RPL35A, RPL21, RPS16, RPL36, RPL4, RPS27 |
903 |
| GOBP_BIOLOGICAL_PROCESS_INVOLVED_IN_SYMBIOTIC_INTERACTION | 2.30e-37 | 55.01 | 28.83 | 9.07e-35 | 1.72e-33 | 36DDX1, RPS19, RPS4X, RPS18, RPS3, RPS21, RPS7, RPL18A, RPL29, RPL13, RPS3A, RPL3, RPL26, RPL32, RPL37A, RPL7A, RPL10A, RPL10, RPS24, RACK1, RPL14, RPL41, RPL34, RPS14, RPS2, RPS28, RPS6, RPL5, RPL9, RPL35A, RPL21, RPS16, RPL36, RPL4, NECTIN4, RPS27 |
997 |
| GOBP_CYTOPLASMIC_TRANSLATION | 7.66e-16 | 63.56 | 28.43 | 1.64e-13 | 5.73e-12 | 11RPS21, RPL18A, RPL29, RPL26, RPL32, RPL10A, RPL41, RPS28, RPL9, RPL35A, RPL36 |
102 |
Dowload full table
Immunological Gene Sets:
| P-value | OR | Lower 95% CI | FDR | FWER | Genes Found | Gene Set Size | |
|---|---|---|---|---|---|---|---|
| GSE2405_0H_VS_24H_A_PHAGOCYTOPHILUM_STIM_NEUTROPHIL_UP | 3.54e-44 | 151.48 | 81.77 | 1.73e-40 | 1.73e-40 | 28RPS19, RPS4X, RPS18, RPS3, RPS21, RPS7, RPL18A, RPL13, RPS3A, RPL3, RPL26, RPL37A, RPL7A, RPL10, RACK1, RPL14, RPL41, RPL34, RPS14, RPS2, EEF1B2, RPS6, RPL5, RPL9, RPS16, RPL36, RPL4, RPS27 |
200 |
| GSE2405_0H_VS_9H_A_PHAGOCYTOPHILUM_STIM_NEUTROPHIL_DN | 5.13e-42 | 138.95 | 75.21 | 1.25e-38 | 2.50e-38 | 27RPS19, RPS4X, RPS18, RPS3, RPS21, RPS7, RPL18A, RPL13, RPS3A, RPL3, RPL26, RPL37A, RPL7A, RPL10, RACK1, RPL14, RPL34, RPS14, RPS2, EEF1B2, RPS6, RPL5, RPL9, RPS16, RPL36, RPL4, RPS27 |
200 |
| GSE41978_ID2_KO_VS_ID2_KO_AND_BIM_KO_KLRG1_LOW_EFFECTOR_CD8_TCELL_DN | 4.71e-26 | 69.47 | 36.38 | 7.65e-23 | 2.30e-22 | 19RPS4X, RPS18, RPS3, RPS7, RPL13, RPS3A, RPL3, RPL26, RPL37A, RPL10, RACK1, RPL41, RPL34, RPS14, RPS6, RPL5, RPL9, RPS16, RPL4 |
200 |
| GSE22886_NAIVE_BCELL_VS_NEUTROPHIL_UP | 2.89e-24 | 63.79 | 33.09 | 3.08e-21 | 1.41e-20 | 18RPS19, RPS18, RPS7, RPL26, RPL37A, RPL7A, RPL10, RPS24, RACK1, RPL41, RPL34, RPS14, RPS6, RPL9, RPL35A, RPL21, RPS16, RPS27 |
199 |
| GSE42088_UNINF_VS_LEISHMANIA_INF_DC_2H_DN | 3.16e-24 | 63.45 | 32.89 | 3.08e-21 | 1.54e-20 | 18RPS18, RPS7, RPL29, RPL13, RPL26, RPL32, RPL7A, RPL10A, RPL10, RPS24, RACK1, RPL14, RPS28, RPL35A, RPL21, RPS16, RPL36, RPL4 |
200 |
| GSE41978_KLRG1_HIGH_VS_LOW_EFFECTOR_CD8_TCELL_DN | 1.94e-22 | 57.69 | 29.60 | 1.58e-19 | 9.46e-19 | 17RPS19, RPS4X, RPS18, RPS3, RPS21, RPS7, RPS3A, RPL3, RPL7A, RPL10, RPL34, RPS14, RPS2, RPS6, RPL5, RPL9, RPS16 |
200 |
| GSE22886_NAIVE_TCELL_VS_DC_UP | 1.00e-20 | 52.75 | 26.70 | 6.97e-18 | 4.88e-17 | 16RPS18, RPS3, RPS7, RPL29, RPL3, RPL26, RPL7A, RPL14, RPL34, RPS14, EEF1B2, RPL5, RPL35A, RPL21, RPL36, RPS27 |
199 |
| GSE42088_UNINF_VS_LEISHMANIA_INF_DC_4H_DN | 5.12e-19 | 47.74 | 23.82 | 3.12e-16 | 2.49e-15 | 15RPS19, RPS4X, RPS18, RPS7, RPL13, RPL26, RPL32, RPL10, RPS24, RACK1, RPL34, RPS14, RPL35A, RPL21, RPS16 |
199 |
| GSE42724_NAIVE_VS_B1_BCELL_DN | 2.38e-17 | 43.13 | 21.13 | 1.29e-14 | 1.16e-13 | 14RPS3, RPS7, RPL29, RPL13, RPL3, RPL26, RPL7A, RACK1, RPL34, RPS2, EEF1B2, RPS6, RPL5, RPL4 |
199 |
| GSE3720_UNSTIM_VS_LPS_STIM_VD2_GAMMADELTA_TCELL_UP | 4.61e-15 | 41.77 | 19.51 | 2.04e-12 | 2.24e-11 | 12RPS19, RPS3, RPL29, RPL3, RPL32, RPL37A, RPL14, RPS2, EEF1B2, RPL5, RPL36, RPL4 |
167 |
| GSE34205_HEALTHY_VS_FLU_INF_INFANT_PBMC_UP | 9.32e-16 | 38.98 | 18.70 | 4.54e-13 | 4.54e-12 | 13RPS18, RPS3, RPL13, RPS3A, RPL32, RPL7A, RPL10, RACK1, RPS14, EEF1B2, RPL5, RPL21, RPL4 |
198 |
| GSE3720_UNSTIM_VS_PMA_STIM_VD2_GAMMADELTA_TCELL_UP | 8.08e-15 | 39.71 | 18.57 | 3.28e-12 | 3.94e-11 | 12RPS3, RPL29, RPL3, RPL32, RPL37A, RPL10A, RPS2, EEF1B2, EEF1A1, RPL36, RPL4, RPS27 |
175 |
| GSE14000_TRANSLATED_RNA_VS_MRNA_DC_DN | 2.77e-14 | 35.61 | 16.66 | 1.04e-11 | 1.35e-10 | 12RPS18, RPS3, RPL26, RPL32, RPL10, RACK1, RPS14, EEF1B2, RPS6, RPL21, RPL36, RPL4 |
194 |
| GSE21927_SPLEEN_C57BL6_VS_4T1_TUMOR_BALBC_MONOCYTES_UP | 3.98e-14 | 34.48 | 16.13 | 1.39e-11 | 1.94e-10 | 12RPS3, RPS7, RPL29, RPL13, RPS3A, RPL3, RPL7A, EEF1B2, RPL5, RPL35A, RPL21, RPL4 |
200 |
| GSE6269_HEALTHY_VS_FLU_INF_PBMC_UP | 3.32e-13 | 35.08 | 15.92 | 1.08e-10 | 1.62e-09 | 11RPL18A, RPL13, RPS3A, RPL3, RPL10A, RPL10, RPS14, RPS28, EEF1B2, RPL5, RPL4 |
176 |
| GSE6269_FLU_VS_E_COLI_INF_PBMC_DN | 5.65e-12 | 33.32 | 14.59 | 1.62e-09 | 2.75e-08 | 10MYCN, RPL29, RPL13, RPS3A, RPL3, RPL10, RPS14, EEF1B2, RPL5, RPL4 |
164 |
| GSE10239_NAIVE_VS_DAY4.5_EFF_CD8_TCELL_UP | 1.27e-12 | 30.80 | 14.01 | 3.85e-10 | 6.17e-09 | 11RPS18, RPS3, RPS21, RPS7, RPL13, RPL26, RPL32, RPL37A, RPS14, EEF1B2, RPL36 |
199 |
| GSE1460_DP_THYMOCYTE_VS_NAIVE_CD4_TCELL_ADULT_BLOOD_DN | 9.21e-10 | 23.97 | 10.09 | 2.23e-07 | 4.49e-06 | 9RPS19, RPS18, RPS7, RPL13, RPL26, RPL32, RPL10A, RPS6, RPS27 |
197 |
| GSE2124_CTRL_VS_LYMPHOTOXIN_BETA_TREATED_MLN_UP | 9.21e-10 | 23.97 | 10.09 | 2.23e-07 | 4.49e-06 | 9RPS4X, RPS7, RPS3A, RPL26, RPS14, RPS6, RPL5, RPL9, RPS16 |
197 |
| GSE3982_NEUTROPHIL_VS_BCELL_DN | 9.63e-10 | 23.84 | 10.05 | 2.23e-07 | 4.69e-06 | 9RPS19, RPS4X, RPS18, RPL13, RPL32, RPL9, RPL35A, RPS16, RPS27 |
198 |
Top Ranked Transcription Factors for this Gene Expression Program:
| Gene Symbol | Gene Loading Rank | DNA Binding Domain | Motif Status | IUPAC PWM | GTEx | DepMap | Decartes |
|---|---|---|---|---|---|---|---|
| MYCN | 6 | Yes | Known motif | Monomer or homomultimer | High-throughput in vitro | None | None |
| BARHL1 | 11 | Yes | Known motif | Monomer or homomultimer | High-throughput in vitro | None | None |
| MEIS2 | 20 | Yes | Known motif | Monomer or homomultimer | High-throughput in vitro | None | None |
| RPL7A | 22 | No | Unlikely to be sequence specific TF | Not a DNA binding protein | No motif | None | None |
| INSM1 | 46 | Yes | Known motif | Monomer or homomultimer | In vivo/Misc source | None | None |
| NHLH2 | 49 | Yes | Known motif | Monomer or homomultimer | High-throughput in vitro | None | None |
| RPL7 | 72 | No | Unlikely to be sequence specific TF | Low specificity DNA-binding protein | No motif | None | Binds DNA by filter binding (PMID: 8441630), but competition assays suggest it is non-specific. A specific dsRNA structure is thought to be the preferred substrate. RNA-binding has been demonstrated by gel-shift experiments (PMID: 10329420). |
| RPS27A | 79 | No | ssDNA/RNA binding | Not a DNA binding protein | No motif | None | None |
| EBF3 | 81 | Yes | Known motif | Monomer or homomultimer | In vivo/Misc source | Only known motifs are from Transfac or HocoMoco - origin is uncertain | None |
| SATB2 | 92 | Yes | Inferred motif | Low specificity DNA-binding protein | In vivo/Misc source | None | SATBs were analyzed by Gwenael Badis and Mike Berger a decade ago; by PBMs. It did not yield a motif; instead; the signal was very closely proportional to nucleotide content, as the name suggests (Special AT Binding). |
| DACH1 | 94 | Yes | Likely to be sequence specific TF | Monomer or homomultimer | No motif | Has a putative AT-hook | Binds with consensus AAWANAAAWAAWT and AATACAATTAAAT as strongest target sequences based on EMSA and SELEX (PMID: 20351289). Protein contains a winged helix structural domain (PMID: 12057194) |
| NFIX | 102 | Yes | Known motif | Monomer or homomultimer | High-throughput in vitro | None | None |
| NPM1 | 104 | No | Unlikely to be sequence specific TF | Low specificity DNA-binding protein | No motif | None | No evidence for sequence-specific DNA-binding (PMID: 2223875) |
| EDA2R | 116 | No | Unlikely to be sequence specific TF | Not a DNA binding protein | No motif | None | Included only because GO says positive regulation of sequence-specific DNA binding transcription factor activity. Not DNA binding. |
| POU4F1 | 117 | Yes | Known motif | Monomer or homomultimer | High-throughput in vitro | None | None |
| ZFHX4 | 124 | Yes | Inferred motif | Monomer or homomultimer | In vivo/Misc source | None | Curious protein with numerous C2H2 and homeodomain-like domains. |
| SOX11 | 130 | Yes | Known motif | Monomer or homomultimer | 100 perc ID - in vitro | None | None |
| NPAS4 | 173 | Yes | Inferred motif | Obligate heteromer | High-throughput in vitro | None | Likely dimerizes with ARNT2 (PMID:24263188). |
| UBA52 | 174 | No | Unlikely to be sequence specific TF | Not a DNA binding protein | No motif | None | None |
| POU4F2 | 182 | Yes | Known motif | Monomer or homomultimer | High-throughput in vitro | None | None |
Druggable Genes for this Gene Expression Program:
| Gene Symbol | Gene Loading Rank | Drug Names | Drug Category | GTEx | DepMap |
|---|---|---|---|---|---|
| CACNA2D1 | 74 | 4BEPRIDIL, GABAPENTIN ENACARBIL, GABAPENTIN, PREGABALIN |
Small molecule | GTEx | DepMap |
| IMPDH2 | 91 | 3MYCOPHENOLATE MOFETIL, MYCOPHENOLIC ACID, THIOGUANINE |
Small molecule | GTEx | DepMap |
| KCNN4 | 100 | 1CHLORZOXAZONE |
Small molecule | GTEx | DepMap |
| ERBB4 | 108 | 3AFATINIB, OSIMERTINIB, VANDETANIB |
Small molecule | GTEx | DepMap |
| PRKCE | 119 | 1(7S)-HYDROXYL-STAUROSPORINE |
Small molecule | GTEx | DepMap |
| TUBB2B | 151 | 9VINCRISTINE, VINORELBINE BASE, ERIBULIN, CABAZITAXEL, IXABEPILONE, DOCETAXEL, COLCHICINE, PACLITAXEL, VINBLASTINE |
Small molecule | GTEx | DepMap |
| TUBB2B | 151 | 2BRENTUXIMAB VEDOTIN, TRASTUZUMAB EMTANSINE |
Antibody | GTEx | DepMap |
| RYR3 | 231 | 1DANTROLENE |
Small molecule | GTEx | DepMap |
| ODC1 | 250 | 1EFLORNITHINE |
Small molecule | GTEx | DepMap |
| GRIN1 | 287 | 6MEMANTINE, KETAMINE, ORPHENADRINE, ACAMPROSATE, AMANTADINE, FELBAMATE |
Small molecule | GTEx | DepMap |
| GRIA4 | 289 | 2PERAMPANEL, TOPIRAMATE |
Small molecule | GTEx | DepMap |
| EPHA7 | 292 | 1VANDETANIB |
Small molecule | GTEx | DepMap |
| KCNH8 | 310 | 2GUANIDINE, DALFAMPRIDINE |
Small molecule | GTEx | DepMap |
| P2RX3 | 341 | 1AF-219 |
Small molecule | GTEx | DepMap |
| PRKCA | 382 | 1(7S)-HYDROXYL-STAUROSPORINE |
Small molecule | GTEx | DepMap |
| KCNQ2 | 429 | 3GUANIDINE, DALFAMPRIDINE, EZOGABINE |
Small molecule | GTEx | DepMap |
| BRD3 | 440 | 1GSK525762 |
Small molecule | GTEx | DepMap |
| TNFRSF10B | 498 | 1TIGATUZUMAB |
Antibody | GTEx | DepMap |
| FYN | 521 | 1DASATINIB |
Small molecule | GTEx | DepMap |
| MDM2 | 530 | 1AMG232 |
Small molecule | GTEx | DepMap |
| IDH2 | 547 | 1ENASIDENIB |
Small molecule | GTEx | DepMap |
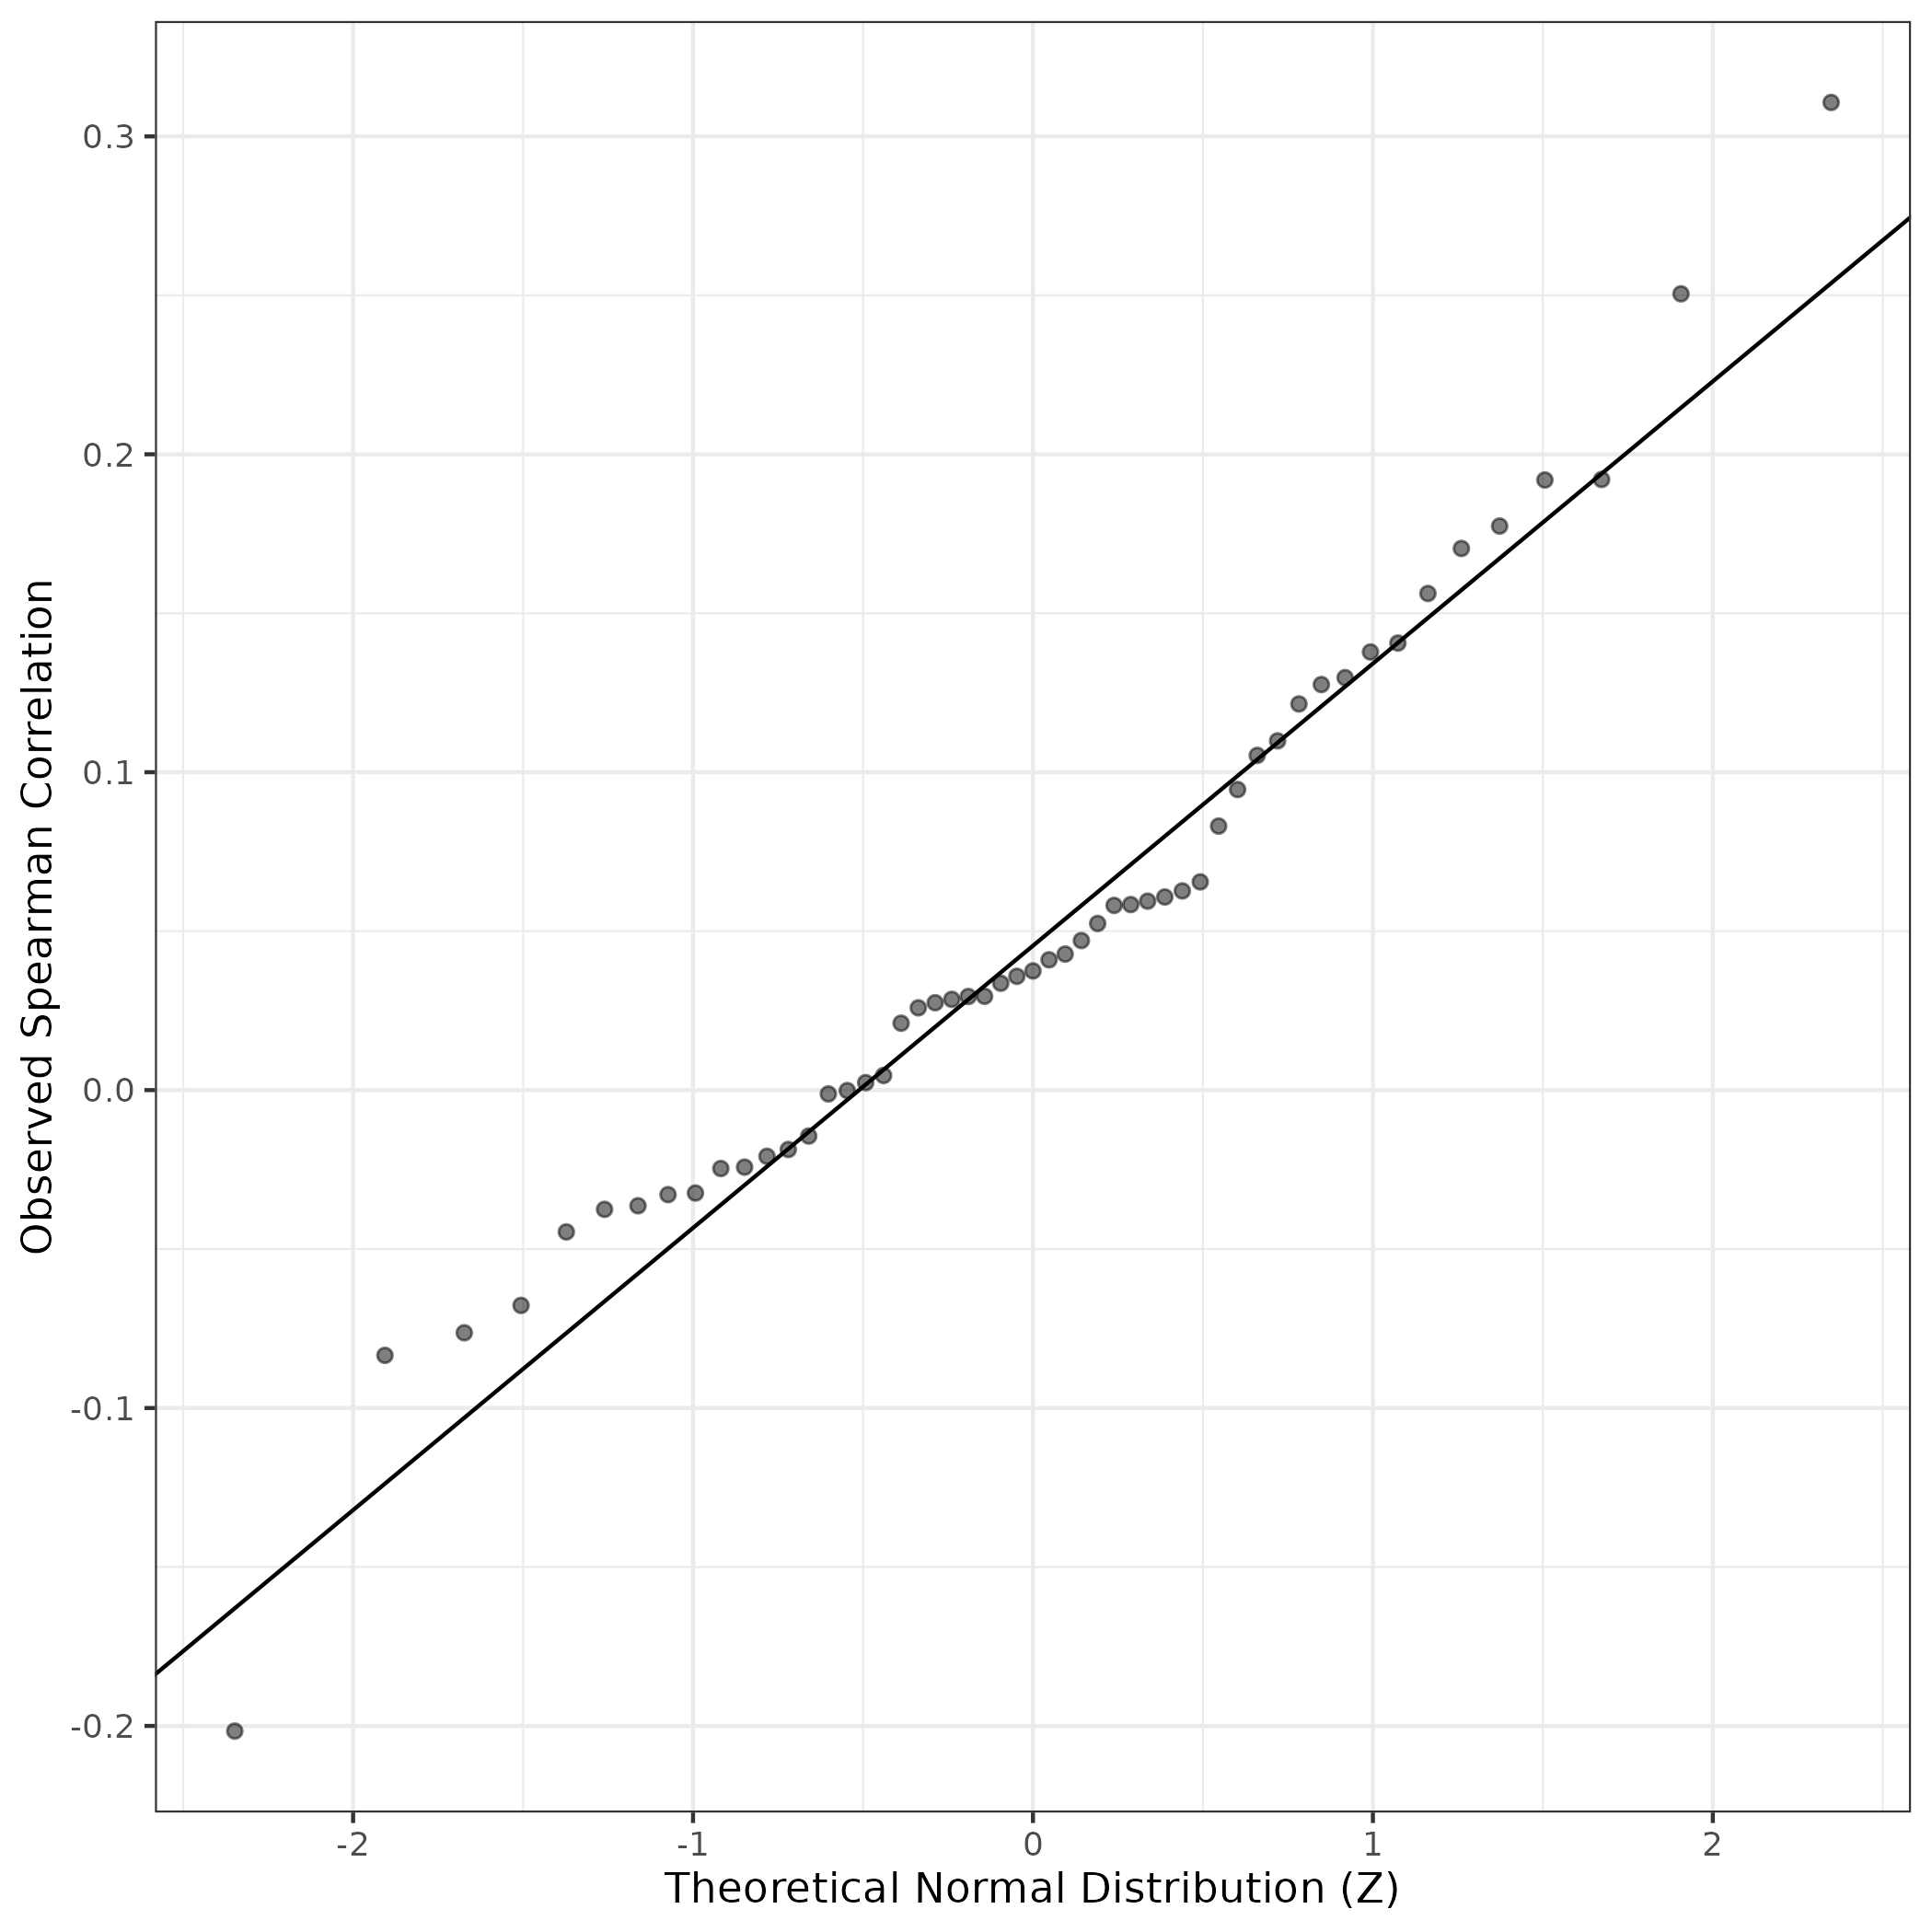
QQ Plot showing correlations with other GEPs in this dataset, calculated by Spearman correlation:
Interactive QQ-plot of gene loadings:
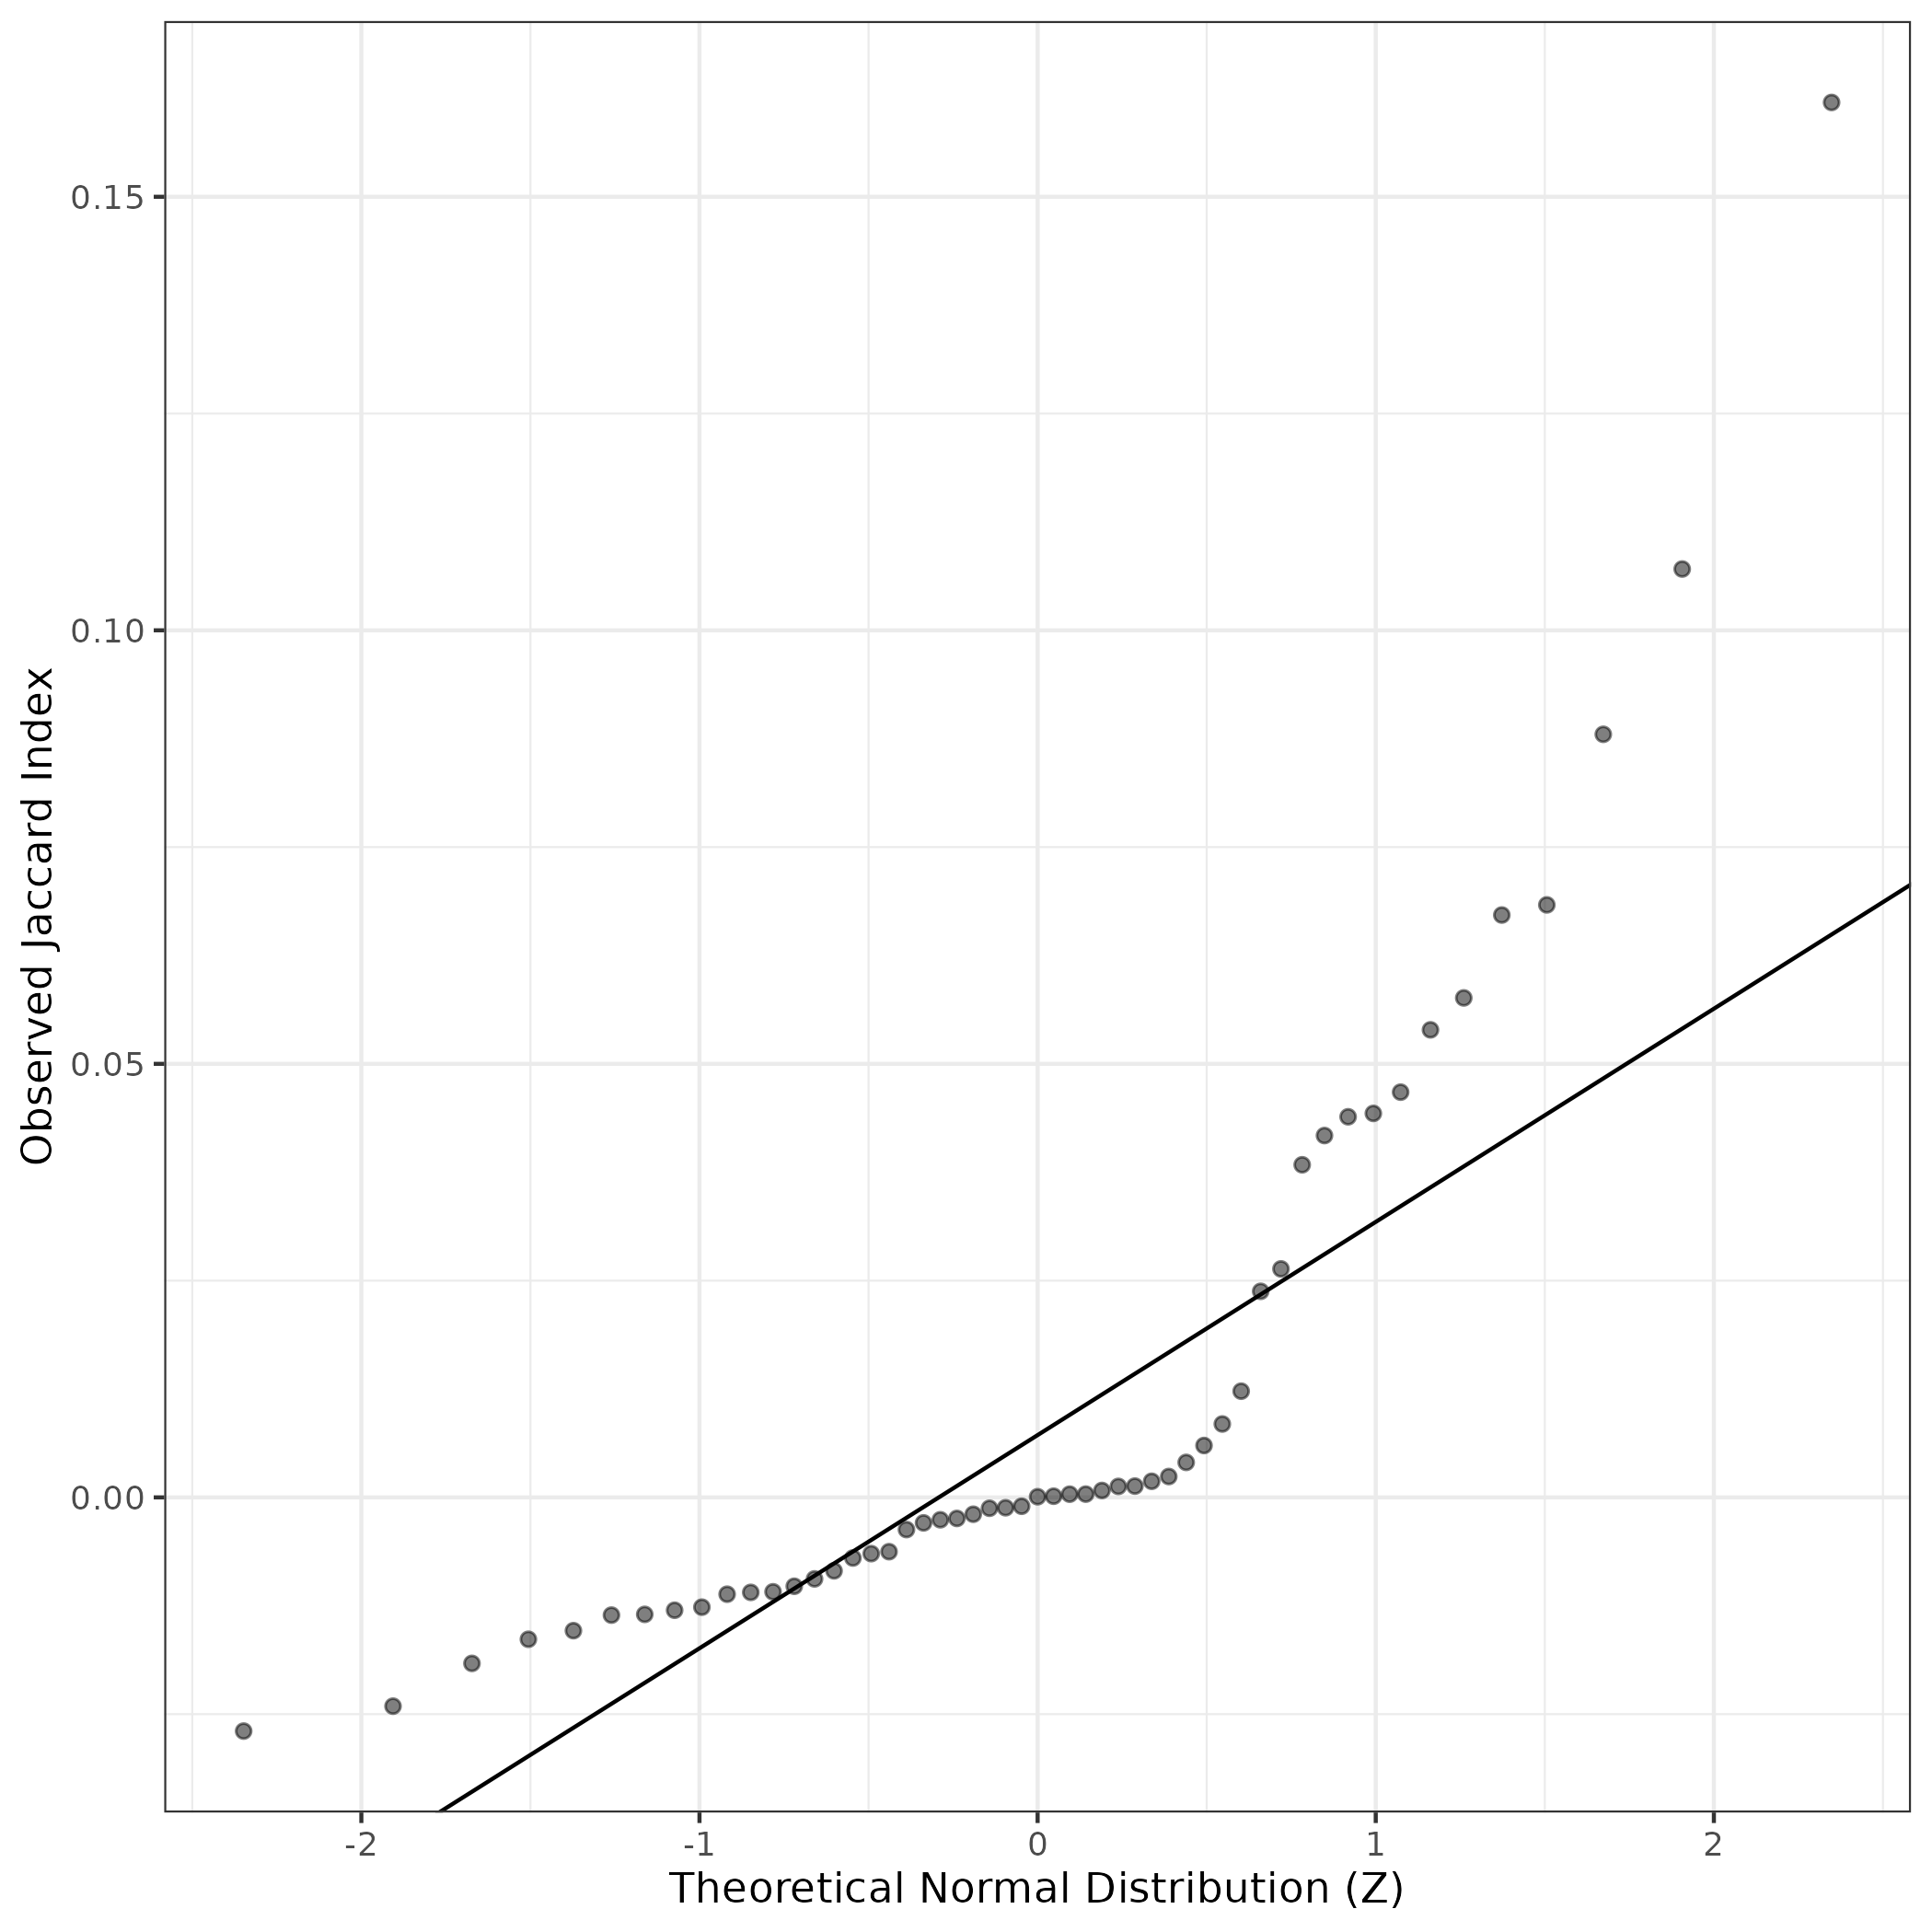
A similar QQ-plot as above, but only for instances where the H value is e.g. > 25, i.e. we are confident that the expression program is active above noise. Agreemenet between these binary vectors is tested using the Jaccard Index, with the P-values calculated by an exact test:
Interactive QQ-plot:
Singler cell type annotations for the top 50 cells on this program.
| Cell ID | Singler label | Singler Delta | Activity Score | Top Singler Raw Scores |
|---|---|---|---|---|
| AAACGCTTCTTCTGTA-1_HTA4_1021_4082 | Neurons | 0.30 | 4233.03 | Raw ScoresNeurons: 0.53, Astrocyte: 0.47, Neuroepithelial_cell: 0.47, Embryonic_stem_cells: 0.41, iPS_cells: 0.4, MSC: 0.35, Smooth_muscle_cells: 0.33, Fibroblasts: 0.33, Tissue_stem_cells: 0.32, Osteoblasts: 0.32 |
| GATCAGTTCAAGCCTA-1_HTA4_1021_4082 | Neurons | 0.28 | 3859.04 | Raw ScoresNeurons: 0.52, Neuroepithelial_cell: 0.49, Astrocyte: 0.46, Embryonic_stem_cells: 0.43, iPS_cells: 0.41, MSC: 0.35, Tissue_stem_cells: 0.32, Endothelial_cells: 0.31, Fibroblasts: 0.3, Smooth_muscle_cells: 0.28 |
| CCGTGAGCACAGCTTA-1_HTA4_1021_4082 | Neurons | 0.28 | 3748.62 | Raw ScoresNeurons: 0.51, Astrocyte: 0.46, Neuroepithelial_cell: 0.46, Embryonic_stem_cells: 0.4, iPS_cells: 0.39, MSC: 0.34, Smooth_muscle_cells: 0.33, Fibroblasts: 0.33, Osteoblasts: 0.32, Chondrocytes: 0.32 |
| GGAGGATCACGTAGTT-1_HTA4_1021_4082 | Neurons | 0.29 | 3495.56 | Raw ScoresNeurons: 0.56, Neuroepithelial_cell: 0.51, Astrocyte: 0.49, Embryonic_stem_cells: 0.46, iPS_cells: 0.45, MSC: 0.39, Endothelial_cells: 0.35, Tissue_stem_cells: 0.34, Fibroblasts: 0.33, Smooth_muscle_cells: 0.33 |
| CGGTCAGAGGCCTGCT-1_HTA4_1021_4082 | Neurons | 0.29 | 3438.63 | Raw ScoresNeurons: 0.53, Neuroepithelial_cell: 0.47, Astrocyte: 0.47, Embryonic_stem_cells: 0.42, iPS_cells: 0.41, MSC: 0.36, Fibroblasts: 0.33, Tissue_stem_cells: 0.32, Smooth_muscle_cells: 0.32, Endothelial_cells: 0.31 |
| TCTCAGCGTTGCGAAG-1_HTA4_1021_4082 | Neurons | 0.28 | 3400.70 | Raw ScoresNeurons: 0.52, Neuroepithelial_cell: 0.46, Astrocyte: 0.45, Embryonic_stem_cells: 0.4, iPS_cells: 0.39, MSC: 0.35, Smooth_muscle_cells: 0.34, Fibroblasts: 0.33, Tissue_stem_cells: 0.33, Osteoblasts: 0.32 |
| GGGCTCATCGACATCA-1_HTA4_1021_4083 | Neurons | 0.29 | 3071.65 | Raw ScoresNeurons: 0.55, Neuroepithelial_cell: 0.5, Astrocyte: 0.47, Embryonic_stem_cells: 0.44, iPS_cells: 0.43, MSC: 0.38, Tissue_stem_cells: 0.34, Endothelial_cells: 0.33, Fibroblasts: 0.33, Smooth_muscle_cells: 0.32 |
| ACCGTTCGTGGAACAC-1_HTA4_1021_4082 | Neurons | 0.27 | 3021.97 | Raw ScoresNeurons: 0.5, Astrocyte: 0.44, Neuroepithelial_cell: 0.43, Embryonic_stem_cells: 0.38, iPS_cells: 0.37, MSC: 0.32, Smooth_muscle_cells: 0.32, Fibroblasts: 0.32, Osteoblasts: 0.31, Tissue_stem_cells: 0.31 |
| TGATTCTGTTCTTGTT-1_HTA4_1021_4082 | Neurons | 0.28 | 2906.29 | Raw ScoresNeurons: 0.53, Neuroepithelial_cell: 0.47, Astrocyte: 0.45, Embryonic_stem_cells: 0.42, iPS_cells: 0.4, MSC: 0.35, Tissue_stem_cells: 0.32, Smooth_muscle_cells: 0.32, Fibroblasts: 0.32, Endothelial_cells: 0.32 |
| ACGGTCGCAGCATTGT-1_HTA4_1021_4082 | Neurons | 0.28 | 2851.70 | Raw ScoresNeurons: 0.51, Astrocyte: 0.44, Neuroepithelial_cell: 0.44, Embryonic_stem_cells: 0.38, iPS_cells: 0.37, MSC: 0.33, Smooth_muscle_cells: 0.33, Fibroblasts: 0.32, Chondrocytes: 0.31, Osteoblasts: 0.31 |
| GGAGAACGTGACAACG-1_HTA4_1021_4082 | Neurons | 0.29 | 2735.80 | Raw ScoresNeurons: 0.52, Neuroepithelial_cell: 0.47, Astrocyte: 0.46, Embryonic_stem_cells: 0.42, iPS_cells: 0.41, MSC: 0.36, Tissue_stem_cells: 0.32, Fibroblasts: 0.32, Endothelial_cells: 0.31, Smooth_muscle_cells: 0.31 |
| TGACCCTCATACCATG-1_HTA4_1021_4082 | Neurons | 0.27 | 2727.62 | Raw ScoresNeurons: 0.49, Neuroepithelial_cell: 0.44, Astrocyte: 0.43, Embryonic_stem_cells: 0.39, iPS_cells: 0.37, MSC: 0.31, Smooth_muscle_cells: 0.28, Endothelial_cells: 0.28, Fibroblasts: 0.28, Tissue_stem_cells: 0.28 |
| AATGCCACATCAGCGC-1_HTA4_1021_4082 | Neurons | 0.29 | 2688.86 | Raw ScoresNeurons: 0.51, Astrocyte: 0.44, Neuroepithelial_cell: 0.43, Embryonic_stem_cells: 0.38, iPS_cells: 0.37, MSC: 0.33, Smooth_muscle_cells: 0.32, Fibroblasts: 0.32, Tissue_stem_cells: 0.31, Osteoblasts: 0.3 |
| TTCGATTCAACCCGCA-1_HTA4_1021_4082 | Neurons | 0.28 | 2654.86 | Raw ScoresNeurons: 0.52, Neuroepithelial_cell: 0.47, Astrocyte: 0.45, Embryonic_stem_cells: 0.42, iPS_cells: 0.41, MSC: 0.35, Tissue_stem_cells: 0.31, Endothelial_cells: 0.31, Fibroblasts: 0.31, Smooth_muscle_cells: 0.3 |
| CGGAATTCACACGCCA-1_HTA4_1021_4082 | Neurons | 0.30 | 2644.11 | Raw ScoresNeurons: 0.54, Neuroepithelial_cell: 0.48, Astrocyte: 0.48, Embryonic_stem_cells: 0.43, iPS_cells: 0.41, MSC: 0.36, Tissue_stem_cells: 0.32, Endothelial_cells: 0.31, Smooth_muscle_cells: 0.31, Fibroblasts: 0.31 |
| TACCTCGTCTGCTAGA-1_HTA4_1021_4082 | Neurons | 0.28 | 2589.69 | Raw ScoresNeurons: 0.53, Neuroepithelial_cell: 0.47, Astrocyte: 0.47, Embryonic_stem_cells: 0.42, iPS_cells: 0.41, MSC: 0.36, Smooth_muscle_cells: 0.34, Fibroblasts: 0.34, Tissue_stem_cells: 0.33, Endothelial_cells: 0.33 |
| CTCAGTCAGGCCACCT-1_HTA4_1021_4082 | Neurons | 0.28 | 2484.35 | Raw ScoresNeurons: 0.48, Neuroepithelial_cell: 0.43, Astrocyte: 0.43, Embryonic_stem_cells: 0.37, iPS_cells: 0.35, MSC: 0.31, Fibroblasts: 0.3, Smooth_muscle_cells: 0.3, Osteoblasts: 0.29, Tissue_stem_cells: 0.29 |
| CCCTCTCAGTTACGAA-1_HTA4_1021_4082 | Neurons | 0.28 | 2471.95 | Raw ScoresNeurons: 0.54, Neuroepithelial_cell: 0.5, Astrocyte: 0.46, Embryonic_stem_cells: 0.45, iPS_cells: 0.43, MSC: 0.36, Tissue_stem_cells: 0.32, Endothelial_cells: 0.32, Fibroblasts: 0.3, MEP: 0.3 |
| CCCTCTCTCAAGCCAT-1_HTA4_1021_4082 | Neurons | 0.27 | 2411.42 | Raw ScoresNeurons: 0.47, Astrocyte: 0.43, Neuroepithelial_cell: 0.42, Embryonic_stem_cells: 0.36, iPS_cells: 0.36, MSC: 0.32, Fibroblasts: 0.3, Smooth_muscle_cells: 0.3, Osteoblasts: 0.29, Tissue_stem_cells: 0.29 |
| CAACGATTCCCTTGTG-1_HTA4_1021_4082 | Neurons | 0.29 | 2379.61 | Raw ScoresNeurons: 0.53, Neuroepithelial_cell: 0.48, Astrocyte: 0.44, Embryonic_stem_cells: 0.43, iPS_cells: 0.41, MSC: 0.35, Endothelial_cells: 0.31, Tissue_stem_cells: 0.31, MEP: 0.29, Fibroblasts: 0.29 |
| GGTTAACAGACATATG-1_HTA4_1021_4082 | Neurons | 0.28 | 2339.88 | Raw ScoresNeurons: 0.48, Astrocyte: 0.43, Neuroepithelial_cell: 0.43, Embryonic_stem_cells: 0.37, iPS_cells: 0.36, MSC: 0.32, Fibroblasts: 0.3, Smooth_muscle_cells: 0.3, Tissue_stem_cells: 0.29, Osteoblasts: 0.29 |
| CCGAACGCACTCCACT-1_HTA4_1021_4082 | Neurons | 0.27 | 2317.74 | Raw ScoresNeurons: 0.5, Neuroepithelial_cell: 0.45, Astrocyte: 0.43, Embryonic_stem_cells: 0.4, iPS_cells: 0.39, MSC: 0.34, Tissue_stem_cells: 0.31, Fibroblasts: 0.3, Endothelial_cells: 0.3, Smooth_muscle_cells: 0.3 |
| GACCAATTCCCGATCT-1_HTA4_1021_4082 | Neurons | 0.28 | 2230.53 | Raw ScoresNeurons: 0.5, Astrocyte: 0.45, Neuroepithelial_cell: 0.44, Embryonic_stem_cells: 0.39, iPS_cells: 0.38, MSC: 0.33, Fibroblasts: 0.33, Smooth_muscle_cells: 0.33, Osteoblasts: 0.32, Tissue_stem_cells: 0.31 |
| ATTCCTACACGACGCT-1_HTA4_1021_4082 | Neurons | 0.27 | 2228.85 | Raw ScoresNeurons: 0.46, Neuroepithelial_cell: 0.41, Astrocyte: 0.41, Embryonic_stem_cells: 0.35, iPS_cells: 0.34, MSC: 0.3, Smooth_muscle_cells: 0.29, Fibroblasts: 0.29, Chondrocytes: 0.28, Osteoblasts: 0.28 |
| CCGCAAGGTCGCTGCA-1_HTA4_1021_4082 | Neurons | 0.25 | 2213.65 | Raw ScoresNeurons: 0.44, Neuroepithelial_cell: 0.4, Astrocyte: 0.4, Embryonic_stem_cells: 0.36, iPS_cells: 0.35, MSC: 0.28, Fibroblasts: 0.28, Smooth_muscle_cells: 0.27, Osteoblasts: 0.27, Tissue_stem_cells: 0.26 |
| AGCCAGCGTCTAACGT-1_HTA4_1021_4082 | Neurons | 0.29 | 2204.50 | Raw ScoresNeurons: 0.48, Astrocyte: 0.43, Neuroepithelial_cell: 0.42, Embryonic_stem_cells: 0.37, iPS_cells: 0.35, MSC: 0.32, Fibroblasts: 0.31, Smooth_muscle_cells: 0.3, Osteoblasts: 0.29, Chondrocytes: 0.28 |
| GCCATGGTCGAAACAA-1_HTA4_1021_4082 | Neurons | 0.28 | 2173.01 | Raw ScoresNeurons: 0.46, Astrocyte: 0.43, Neuroepithelial_cell: 0.42, Embryonic_stem_cells: 0.37, iPS_cells: 0.35, MSC: 0.32, Fibroblasts: 0.3, Smooth_muscle_cells: 0.3, Osteoblasts: 0.29, Tissue_stem_cells: 0.28 |
| GGTGAAGGTTCAGGTT-1_HTA4_1021_4082 | Neurons | 0.28 | 2128.53 | Raw ScoresNeurons: 0.46, Astrocyte: 0.4, Neuroepithelial_cell: 0.4, Embryonic_stem_cells: 0.34, iPS_cells: 0.33, MSC: 0.3, Smooth_muscle_cells: 0.29, Fibroblasts: 0.28, Osteoblasts: 0.27, Tissue_stem_cells: 0.27 |
| GACATCATCGTTCATT-1_HTA4_1021_4082 | Neurons | 0.27 | 2122.94 | Raw ScoresNeurons: 0.46, Neuroepithelial_cell: 0.41, Astrocyte: 0.41, Embryonic_stem_cells: 0.36, iPS_cells: 0.34, MSC: 0.3, Smooth_muscle_cells: 0.29, Fibroblasts: 0.28, Tissue_stem_cells: 0.28, Osteoblasts: 0.27 |
| TGGAACTAGTAATCCC-1_HTA4_1021_4083 | Neurons | 0.28 | 2103.02 | Raw ScoresNeurons: 0.5, Neuroepithelial_cell: 0.42, Astrocyte: 0.42, Embryonic_stem_cells: 0.38, iPS_cells: 0.37, MSC: 0.31, Smooth_muscle_cells: 0.31, Fibroblasts: 0.3, Tissue_stem_cells: 0.3, Osteoblasts: 0.3 |
| TCGATTTAGTTCGGTT-1_HTA4_1021_4082 | Neurons | 0.27 | 2096.01 | Raw ScoresNeurons: 0.47, Astrocyte: 0.43, Neuroepithelial_cell: 0.43, Embryonic_stem_cells: 0.38, iPS_cells: 0.37, MSC: 0.32, Fibroblasts: 0.32, Smooth_muscle_cells: 0.3, Osteoblasts: 0.3, Chondrocytes: 0.3 |
| TGCTTGCCATGACAAA-1_HTA4_1021_4083 | Neurons | 0.29 | 2068.12 | Raw ScoresNeurons: 0.49, Astrocyte: 0.43, Neuroepithelial_cell: 0.43, Embryonic_stem_cells: 0.37, iPS_cells: 0.36, MSC: 0.31, Smooth_muscle_cells: 0.3, Fibroblasts: 0.29, Tissue_stem_cells: 0.29, Endothelial_cells: 0.29 |
| TCATATCCATCGGTTA-1_HTA4_1021_4083 | Neurons | 0.28 | 2050.92 | Raw ScoresNeurons: 0.5, Neuroepithelial_cell: 0.45, Astrocyte: 0.44, Embryonic_stem_cells: 0.4, iPS_cells: 0.39, MSC: 0.33, Endothelial_cells: 0.3, Tissue_stem_cells: 0.3, Smooth_muscle_cells: 0.29, Fibroblasts: 0.28 |
| CAGCCAGTCGTCTACC-1_HTA4_1021_4082 | Neurons | 0.28 | 2036.71 | Raw ScoresNeurons: 0.49, Astrocyte: 0.45, Neuroepithelial_cell: 0.43, Embryonic_stem_cells: 0.38, iPS_cells: 0.36, Fibroblasts: 0.33, MSC: 0.33, Smooth_muscle_cells: 0.32, Osteoblasts: 0.32, Chondrocytes: 0.31 |
| GATTCGATCTGCATGA-1_HTA4_1021_4082 | Neurons | 0.28 | 2031.20 | Raw ScoresNeurons: 0.52, Neuroepithelial_cell: 0.47, Astrocyte: 0.45, Embryonic_stem_cells: 0.42, iPS_cells: 0.41, MSC: 0.35, Endothelial_cells: 0.31, Tissue_stem_cells: 0.31, Fibroblasts: 0.29, MEP: 0.29 |
| TGGTTAGGTATCAAGA-1_HTA4_1021_4082 | Neurons | 0.29 | 1995.68 | Raw ScoresNeurons: 0.47, Astrocyte: 0.41, Neuroepithelial_cell: 0.41, Embryonic_stem_cells: 0.36, iPS_cells: 0.35, MSC: 0.3, Smooth_muscle_cells: 0.29, Fibroblasts: 0.29, Tissue_stem_cells: 0.28, Osteoblasts: 0.27 |
| TTCTAACAGCTACGTT-1_HTA4_1021_4082 | Neurons | 0.26 | 1964.49 | Raw ScoresNeurons: 0.45, Neuroepithelial_cell: 0.4, Astrocyte: 0.39, Embryonic_stem_cells: 0.36, iPS_cells: 0.35, MSC: 0.29, Smooth_muscle_cells: 0.27, Fibroblasts: 0.26, Tissue_stem_cells: 0.25, Osteoblasts: 0.25 |
| CTACTATGTCGCCACA-1_HTA4_1021_4082 | Neurons | 0.27 | 1946.07 | Raw ScoresNeurons: 0.48, Astrocyte: 0.43, Neuroepithelial_cell: 0.42, Embryonic_stem_cells: 0.37, iPS_cells: 0.36, MSC: 0.33, Fibroblasts: 0.32, Smooth_muscle_cells: 0.32, Tissue_stem_cells: 0.31, Osteoblasts: 0.31 |
| TTACCGCAGATAGTCA-1_HTA4_1021_4082 | Neurons | 0.27 | 1930.08 | Raw ScoresNeurons: 0.48, Astrocyte: 0.44, Neuroepithelial_cell: 0.43, Embryonic_stem_cells: 0.37, iPS_cells: 0.35, MSC: 0.33, Fibroblasts: 0.32, Smooth_muscle_cells: 0.32, Endothelial_cells: 0.31, Osteoblasts: 0.31 |
| CCTCTCCGTTCTGAGT-1_HTA4_1021_4082 | Neurons | 0.27 | 1898.72 | Raw ScoresNeurons: 0.49, Astrocyte: 0.43, Neuroepithelial_cell: 0.43, Embryonic_stem_cells: 0.37, iPS_cells: 0.36, MSC: 0.32, Fibroblasts: 0.31, Smooth_muscle_cells: 0.31, Osteoblasts: 0.3, Chondrocytes: 0.29 |
| AATGACCGTTGTCTAG-1_HTA4_1021_4082 | Neurons | 0.28 | 1893.94 | Raw ScoresNeurons: 0.49, Neuroepithelial_cell: 0.44, Astrocyte: 0.43, Embryonic_stem_cells: 0.39, iPS_cells: 0.38, MSC: 0.33, Endothelial_cells: 0.31, Tissue_stem_cells: 0.29, Fibroblasts: 0.29, Smooth_muscle_cells: 0.29 |
| ACGATCAAGTCGCTAT-1_HTA4_1021_4082 | Neurons | 0.25 | 1879.12 | Raw ScoresNeurons: 0.45, Neuroepithelial_cell: 0.41, Astrocyte: 0.41, Embryonic_stem_cells: 0.37, iPS_cells: 0.36, MSC: 0.31, Smooth_muscle_cells: 0.28, Fibroblasts: 0.28, Endothelial_cells: 0.28, Tissue_stem_cells: 0.28 |
| ATCGTGAGTGTCTAAC-1_HTA4_1021_4083 | Neurons | 0.30 | 1868.99 | Raw ScoresNeurons: 0.53, Neuroepithelial_cell: 0.46, Astrocyte: 0.45, Embryonic_stem_cells: 0.41, iPS_cells: 0.4, MSC: 0.33, Tissue_stem_cells: 0.3, Endothelial_cells: 0.29, Fibroblasts: 0.28, MEP: 0.27 |
| AGAACCTCATTCCTCG-1_HTA4_1021_4082 | Neurons | 0.28 | 1868.00 | Raw ScoresNeurons: 0.47, Neuroepithelial_cell: 0.43, Astrocyte: 0.43, Embryonic_stem_cells: 0.37, iPS_cells: 0.35, MSC: 0.32, Smooth_muscle_cells: 0.31, Fibroblasts: 0.31, Tissue_stem_cells: 0.3, Osteoblasts: 0.3 |
| AAATGGATCGTCGACG-1_HTA4_1021_4082 | Neurons | 0.25 | 1862.99 | Raw ScoresNeurons: 0.42, Neuroepithelial_cell: 0.36, Astrocyte: 0.36, Embryonic_stem_cells: 0.33, iPS_cells: 0.31, MSC: 0.27, Smooth_muscle_cells: 0.26, Fibroblasts: 0.26, Osteoblasts: 0.25, Tissue_stem_cells: 0.24 |
| CCGGACACAGAGTTCT-1_HTA4_1021_4083 | Neurons | 0.29 | 1861.92 | Raw ScoresNeurons: 0.5, Neuroepithelial_cell: 0.45, Astrocyte: 0.43, Embryonic_stem_cells: 0.39, iPS_cells: 0.37, MSC: 0.31, Tissue_stem_cells: 0.28, Fibroblasts: 0.28, Endothelial_cells: 0.28, Smooth_muscle_cells: 0.27 |
| TAGTGCATCCCTCTTT-1_HTA4_1021_4082 | Neurons | 0.29 | 1858.56 | Raw ScoresNeurons: 0.53, Neuroepithelial_cell: 0.49, Astrocyte: 0.46, Embryonic_stem_cells: 0.44, iPS_cells: 0.42, MSC: 0.35, Tissue_stem_cells: 0.31, Endothelial_cells: 0.31, Fibroblasts: 0.29, MEP: 0.29 |
| TGGTTAGGTTACAGCT-1_HTA4_1021_4082 | Neurons | 0.29 | 1839.26 | Raw ScoresNeurons: 0.48, Neuroepithelial_cell: 0.42, Astrocyte: 0.42, Embryonic_stem_cells: 0.37, iPS_cells: 0.35, MSC: 0.31, Smooth_muscle_cells: 0.3, Fibroblasts: 0.3, Osteoblasts: 0.29, Tissue_stem_cells: 0.29 |
| TGCTTGCTCACTTCTA-1_HTA4_1021_4083 | Neurons | 0.29 | 1822.13 | Raw ScoresNeurons: 0.47, Astrocyte: 0.43, Neuroepithelial_cell: 0.43, Embryonic_stem_cells: 0.37, iPS_cells: 0.35, MSC: 0.32, Smooth_muscle_cells: 0.31, Fibroblasts: 0.31, Osteoblasts: 0.3, Chondrocytes: 0.29 |
| ATTCCATGTGCCTGCA-1_HTA4_1021_4082 | Neurons | 0.29 | 1799.70 | Raw ScoresNeurons: 0.5, Neuroepithelial_cell: 0.45, Astrocyte: 0.44, Embryonic_stem_cells: 0.38, iPS_cells: 0.37, MSC: 0.33, Smooth_muscle_cells: 0.31, Fibroblasts: 0.31, Tissue_stem_cells: 0.31, Osteoblasts: 0.31 |
Below shows the significant enrichments of this GEP for literature curated gene lists
This data was procured from existing single cell RNA-seq maps of neuroblastoma or related relevant data.
High ranks indicate this gene is a driver of this GEP.
These curated gene list are ranked by the P-value (on this GEP) of their constituent genes.
The Mean Count column shows the mean read count in cells scoring highly (H > 50) on this gene expression program.
Translation (Dong)
Markers obtained in computationally inferred meta program (by NMF applied to their neuroblastoma sc-RNA-seq data) from Fig. 5(a) of Dong et al. (PMID 32946775).:
Wilcoxon ranksum test P-value for gene set overrepresentation: 1.70e-03
Mean rank of genes in gene set: 243
Rank on gene expression program of genes in gene set:
| Genes | Weight | Rank | GTEx | DepMap | Decartes | Mean.Counts | Mean.TPM |
|---|---|---|---|---|---|---|---|
| EIF3L | 0.0011974 | 166 | GTEx | DepMap | Descartes | 2.03 | 266.35 |
| EIF3E | 0.0010086 | 210 | GTEx | DepMap | Descartes | 2.11 | 440.31 |
| EIF3F | 0.0007067 | 353 | GTEx | DepMap | Descartes | 1.02 | 55.16 |
Definitive Zone (Hanemaaijer)
Marker genes obtained from Supplementary Table SD of Hanemaaijer et al (PMID 33500353). The authors generated single-cell RNA-seq data (sort-seq, 2,229 cells total) from mouse adrenal glads at E13.5, E14.5, E17.5, E18.5, P1 and P5. These were marker genes that matched with a similar dataset generated by Furlan et al (PMID 28684471). This particular set of markers are for the Definitive Zone subcluster, which is part of the Cortex cluster.:
Wilcoxon ranksum test P-value for gene set overrepresentation: 4.20e-03
Mean rank of genes in gene set: 2462.5
Rank on gene expression program of genes in gene set:
| Genes | Weight | Rank | GTEx | DepMap | Decartes | Mean.Counts | Mean.TPM |
|---|---|---|---|---|---|---|---|
| CPE | 0.0013131 | 143 | GTEx | DepMap | Descartes | 3.89 | 641.77 |
| GREB1 | 0.0006002 | 451 | GTEx | DepMap | Descartes | 2.04 | 91.40 |
| CALN1 | 0.0000625 | 3915 | GTEx | DepMap | Descartes | 4.02 | 158.71 |
| CHCHD10 | 0.0000182 | 5341 | GTEx | DepMap | Descartes | 0.48 | 131.29 |
p53 Dependent Senescence (Kinker)
These marker genes were obtained in a pan cancer cell lines NMF analysis of scRNA-eq data in Kinker et al (PMID 33128048) - 10 metaprograms were recovered that manifest across cancers.:
Wilcoxon ranksum test P-value for gene set overrepresentation: 1.12e-02
Mean rank of genes in gene set: 700
Rank on gene expression program of genes in gene set:
| Genes | Weight | Rank | GTEx | DepMap | Decartes | Mean.Counts | Mean.TPM |
|---|---|---|---|---|---|---|---|
| CDKN1A | 0.0006930 | 364 | GTEx | DepMap | Descartes | 0.31 | 69.22 |
| TP53I3 | 0.0003221 | 1036 | GTEx | DepMap | Descartes | 0.15 | 36.98 |
Below shows ranks on this GEP for literature curated gene lists for large gene sets
These include those reported as mesenchymal/adrenergic by Van Groningen et al.
High ranks indicate this gene is a driver of this GEP (note these results are not ordered).
The Mean Count column shows the mean read count in cells scoring highly (H > 50) on this gene expression program.
VanGroningen Adrenergic Genes
Adrenergic marker genes from Supplementary Table 2 of Van Groningen et al. Nature Genetics 2017. These genes were identified by differential expression analysis of mesenchymal-like and adrenergic-like neuroblastoma cell lines.
Wilcoxon ranksum test P-value for gene set overrepresentation: 3.02e-01
Mean rank of genes in gene set: 10130.78
Median rank of genes in gene set: 10830
Rank on gene expression program of top 30 genes in gene set:
| Genes | Weight | Rank | GTEx | DepMap | Descartes | Mean.Counts | Mean.TPM |
|---|---|---|---|---|---|---|---|
| INSM1 | 0.0030086 | 46 | GTEx | DepMap | Descartes | 0.99 | 162.50 |
| PRSS12 | 0.0025636 | 66 | GTEx | DepMap | Descartes | 2.35 | 207.49 |
| DACH1 | 0.0018763 | 94 | GTEx | DepMap | Descartes | 5.74 | 467.71 |
| FAM155A | 0.0017074 | 103 | GTEx | DepMap | Descartes | 42.63 | 1819.92 |
| DLK1 | 0.0016306 | 111 | GTEx | DepMap | Descartes | 3.15 | 323.84 |
| SOX11 | 0.0014479 | 130 | GTEx | DepMap | Descartes | 3.97 | 185.63 |
| EYA1 | 0.0014353 | 131 | GTEx | DepMap | Descartes | 4.90 | 463.59 |
| TUBB2B | 0.0012655 | 151 | GTEx | DepMap | Descartes | 4.27 | 914.44 |
| EEF1A2 | 0.0012363 | 154 | GTEx | DepMap | Descartes | 2.85 | 285.62 |
| SLC10A4 | 0.0012199 | 157 | GTEx | DepMap | Descartes | 0.83 | 165.60 |
| HS6ST2 | 0.0012160 | 159 | GTEx | DepMap | Descartes | 3.41 | 328.06 |
| DCX | 0.0012100 | 161 | GTEx | DepMap | Descartes | 1.93 | 86.94 |
| CCNI | 0.0011485 | 172 | GTEx | DepMap | Descartes | 3.08 | 470.93 |
| NCAN | 0.0011081 | 180 | GTEx | DepMap | Descartes | 0.77 | 49.59 |
| DUSP4 | 0.0009930 | 216 | GTEx | DepMap | Descartes | 0.46 | 36.78 |
| RBMS3 | 0.0009664 | 220 | GTEx | DepMap | Descartes | 7.13 | 326.13 |
| GPR22 | 0.0009082 | 238 | GTEx | DepMap | Descartes | 0.47 | 68.17 |
| ISL1 | 0.0008740 | 251 | GTEx | DepMap | Descartes | 1.87 | 322.21 |
| RNF144A | 0.0008104 | 288 | GTEx | DepMap | Descartes | 3.30 | 223.53 |
| CDC42EP3 | 0.0008087 | 291 | GTEx | DepMap | Descartes | 0.76 | 60.19 |
| CACNA2D2 | 0.0007934 | 293 | GTEx | DepMap | Descartes | 0.47 | 31.93 |
| ATCAY | 0.0007850 | 299 | GTEx | DepMap | Descartes | 1.76 | 136.27 |
| MXI1 | 0.0007609 | 308 | GTEx | DepMap | Descartes | 1.89 | 217.77 |
| BEND4 | 0.0007454 | 321 | GTEx | DepMap | Descartes | 0.24 | 11.60 |
| CKB | 0.0007084 | 351 | GTEx | DepMap | Descartes | 1.43 | 399.73 |
| TRAP1 | 0.0006902 | 367 | GTEx | DepMap | Descartes | 1.66 | 286.79 |
| RALGDS | 0.0006834 | 376 | GTEx | DepMap | Descartes | 0.96 | 63.10 |
| NCAM1 | 0.0006595 | 393 | GTEx | DepMap | Descartes | 12.20 | 763.25 |
| GDAP1L1 | 0.0006367 | 412 | GTEx | DepMap | Descartes | 0.94 | 133.27 |
| LRRTM2 | 0.0006294 | 419 | GTEx | DepMap | Descartes | 0.36 | 24.96 |
VanGroningen Mesenchymal Genes
Mesenchymal marker genes from Supplementary Table 2 of Van Groningen et al. Nature Genetics 2017. These genes were identified by differential expression analysis of mesenchymal-like and adrenergic-like neuroblastoma cell lines.
Wilcoxon ranksum test P-value for gene set overrepresentation: 1.00e+00
Mean rank of genes in gene set: 15223.49
Median rank of genes in gene set: 17413.5
Rank on gene expression program of top 30 genes in gene set:
| Genes | Weight | Rank | GTEx | DepMap | Descartes | Mean.Counts | Mean.TPM |
|---|---|---|---|---|---|---|---|
| EGR1 | 0.0009053 | 239 | GTEx | DepMap | Descartes | 1.27 | 163.68 |
| CYP26A1 | 0.0005748 | 477 | GTEx | DepMap | Descartes | 0.02 | 3.45 |
| RIN2 | 0.0005019 | 572 | GTEx | DepMap | Descartes | 1.14 | 101.34 |
| ADGRG6 | 0.0004145 | 743 | GTEx | DepMap | Descartes | 0.21 | NA |
| F2R | 0.0003963 | 786 | GTEx | DepMap | Descartes | 0.36 | 39.44 |
| LAPTM4A | 0.0003942 | 792 | GTEx | DepMap | Descartes | 0.78 | 223.00 |
| LIPA | 0.0003499 | 936 | GTEx | DepMap | Descartes | 1.16 | 178.64 |
| PDIA6 | 0.0003464 | 947 | GTEx | DepMap | Descartes | 0.91 | 132.54 |
| RCN1 | 0.0003015 | 1125 | GTEx | DepMap | Descartes | 0.28 | 44.15 |
| MBTPS1 | 0.0002926 | 1175 | GTEx | DepMap | Descartes | 0.99 | 85.54 |
| SOX9 | 0.0002668 | 1321 | GTEx | DepMap | Descartes | 0.09 | 9.16 |
| JAM3 | 0.0002542 | 1395 | GTEx | DepMap | Descartes | 1.41 | 143.83 |
| PHLDA3 | 0.0002439 | 1464 | GTEx | DepMap | Descartes | 0.16 | 23.98 |
| FZD2 | 0.0002280 | 1580 | GTEx | DepMap | Descartes | 0.05 | 5.82 |
| ITPRIPL2 | 0.0002216 | 1627 | GTEx | DepMap | Descartes | 0.18 | 10.39 |
| ANTXR1 | 0.0002104 | 1716 | GTEx | DepMap | Descartes | 1.72 | 108.73 |
| PXDN | 0.0002077 | 1740 | GTEx | DepMap | Descartes | 1.25 | 67.54 |
| SSBP4 | 0.0002020 | 1795 | GTEx | DepMap | Descartes | 0.69 | 140.33 |
| DDR2 | 0.0001984 | 1840 | GTEx | DepMap | Descartes | 0.68 | 25.87 |
| COL6A1 | 0.0001970 | 1853 | GTEx | DepMap | Descartes | 0.80 | 70.10 |
| PRDX4 | 0.0001868 | 1944 | GTEx | DepMap | Descartes | 0.29 | 112.33 |
| NBR1 | 0.0001580 | 2258 | GTEx | DepMap | Descartes | 0.80 | 63.85 |
| SSR1 | 0.0001537 | 2302 | GTEx | DepMap | Descartes | 0.57 | 22.36 |
| HOMER1 | 0.0001333 | 2563 | GTEx | DepMap | Descartes | 0.99 | 56.03 |
| MYDGF | 0.0001311 | 2603 | GTEx | DepMap | Descartes | 0.35 | NA |
| RECK | 0.0001304 | 2617 | GTEx | DepMap | Descartes | 0.74 | 63.75 |
| ATP8B2 | 0.0001285 | 2647 | GTEx | DepMap | Descartes | 0.65 | 41.16 |
| SLC30A1 | 0.0001075 | 2978 | GTEx | DepMap | Descartes | 0.06 | 4.09 |
| HS3ST3A1 | 0.0001038 | 3036 | GTEx | DepMap | Descartes | 0.16 | 14.52 |
| EGR3 | 0.0001030 | 3055 | GTEx | DepMap | Descartes | 0.09 | 7.67 |
Descartes adrenocortical markers
Top 50 marker genes of adrenocortical cells in the Decartes fetal adrenal single cell map (https://atlas.brotmanbaty.org/bbi/human-gene-expression-during-development/cell/adrenocortical/in/adrenal)
Wilcoxon ranksum test P-value for gene set overrepresentation: 1.00e+00
Mean rank of genes in gene set: 15588.58
Median rank of genes in gene set: 18061
Rank on gene expression program of top 30 genes in gene set:
| Genes | Weight | Rank | GTEx | DepMap | Descartes | Mean.Counts | Mean.TPM |
|---|---|---|---|---|---|---|---|
| HSPD1 | 0.0005481 | 510 | GTEx | DepMap | Descartes | 2.50 | 435.56 |
| IGF1R | 0.0004127 | 748 | GTEx | DepMap | Descartes | 6.64 | 210.38 |
| FDXR | 0.0003738 | 837 | GTEx | DepMap | Descartes | 0.19 | 32.71 |
| HSPE1 | 0.0002726 | 1289 | GTEx | DepMap | Descartes | 0.69 | 396.46 |
| SCAP | 0.0001080 | 2966 | GTEx | DepMap | Descartes | 0.79 | 66.46 |
| TM7SF2 | -0.0000061 | 7948 | GTEx | DepMap | Descartes | 0.20 | 34.82 |
| GSTA4 | -0.0000194 | 9691 | GTEx | DepMap | Descartes | 0.64 | 138.87 |
| PEG3 | -0.0000581 | 12451 | GTEx | DepMap | Descartes | 0.01 | NA |
| FREM2 | -0.0000842 | 13730 | GTEx | DepMap | Descartes | 0.01 | 0.19 |
| JAKMIP2 | -0.0000867 | 13855 | GTEx | DepMap | Descartes | 2.17 | 83.61 |
| INHA | -0.0000893 | 13952 | GTEx | DepMap | Descartes | 0.02 | 4.31 |
| SLC2A14 | -0.0001178 | 15125 | GTEx | DepMap | Descartes | 0.03 | 2.43 |
| SLC16A9 | -0.0001363 | 15761 | GTEx | DepMap | Descartes | 0.51 | 43.61 |
| BAIAP2L1 | -0.0001394 | 15868 | GTEx | DepMap | Descartes | 0.11 | 10.01 |
| DHCR7 | -0.0001439 | 16016 | GTEx | DepMap | Descartes | 0.09 | 10.37 |
| SULT2A1 | -0.0001637 | 16580 | GTEx | DepMap | Descartes | 0.01 | 1.80 |
| CYP11A1 | -0.0001764 | 16869 | GTEx | DepMap | Descartes | 0.14 | 14.17 |
| MC2R | -0.0002064 | 17567 | GTEx | DepMap | Descartes | 0.04 | 2.03 |
| SCARB1 | -0.0002147 | 17722 | GTEx | DepMap | Descartes | 1.60 | 87.01 |
| CYP17A1 | -0.0002160 | 17747 | GTEx | DepMap | Descartes | 0.07 | 6.39 |
| SLC1A2 | -0.0002178 | 17795 | GTEx | DepMap | Descartes | 1.13 | 32.82 |
| APOC1 | -0.0002243 | 17936 | GTEx | DepMap | Descartes | 0.06 | 32.44 |
| PAPSS2 | -0.0002318 | 18061 | GTEx | DepMap | Descartes | 0.25 | 15.76 |
| CYP11B1 | -0.0002330 | 18078 | GTEx | DepMap | Descartes | 0.26 | 12.90 |
| NPC1 | -0.0002419 | 18227 | GTEx | DepMap | Descartes | 0.50 | 34.89 |
| SH3BP5 | -0.0002544 | 18412 | GTEx | DepMap | Descartes | 0.88 | 76.35 |
| FRMD5 | -0.0002549 | 18420 | GTEx | DepMap | Descartes | 4.97 | 355.13 |
| STAR | -0.0002557 | 18436 | GTEx | DepMap | Descartes | 0.17 | 10.36 |
| GRAMD1B | -0.0002604 | 18506 | GTEx | DepMap | Descartes | 1.43 | 52.71 |
| CYB5B | -0.0002625 | 18536 | GTEx | DepMap | Descartes | 0.51 | 42.13 |
Descartes chromaffin markers
Top 50 marker genes of chromaffin cells in the Decartes fetal adrenal single cell map (https://atlas.brotmanbaty.org/bbi/human-gene-expression-during-development/cell/chromaffin/in/adrenal)
Wilcoxon ranksum test P-value for gene set overrepresentation: 1.00e+00
Mean rank of genes in gene set: 15095.07
Median rank of genes in gene set: 19300
Rank on gene expression program of top 30 genes in gene set:
| Genes | Weight | Rank | GTEx | DepMap | Descartes | Mean.Counts | Mean.TPM |
|---|---|---|---|---|---|---|---|
| EYA1 | 0.0014353 | 131 | GTEx | DepMap | Descartes | 4.90 | 463.59 |
| TUBB2B | 0.0012655 | 151 | GTEx | DepMap | Descartes | 4.27 | 914.44 |
| ISL1 | 0.0008740 | 251 | GTEx | DepMap | Descartes | 1.87 | 322.21 |
| STMN4 | 0.0005601 | 493 | GTEx | DepMap | Descartes | 1.51 | 257.55 |
| GAL | 0.0002986 | 1135 | GTEx | DepMap | Descartes | 2.11 | 1016.01 |
| MAB21L2 | 0.0001429 | 2437 | GTEx | DepMap | Descartes | 0.37 | 59.34 |
| CCND1 | 0.0001303 | 2622 | GTEx | DepMap | Descartes | 3.11 | 290.95 |
| PTCHD1 | 0.0001302 | 2623 | GTEx | DepMap | Descartes | 0.91 | 23.50 |
| CNTFR | 0.0000731 | 3632 | GTEx | DepMap | Descartes | 0.66 | 120.66 |
| ELAVL2 | 0.0000498 | 4244 | GTEx | DepMap | Descartes | 2.24 | 198.48 |
| HMX1 | 0.0000407 | 4533 | GTEx | DepMap | Descartes | 0.86 | 160.71 |
| GREM1 | -0.0001566 | 16378 | GTEx | DepMap | Descartes | 0.05 | 0.75 |
| MLLT11 | -0.0001632 | 16566 | GTEx | DepMap | Descartes | 0.99 | 150.21 |
| RPH3A | -0.0002376 | 18157 | GTEx | DepMap | Descartes | 0.24 | 12.52 |
| NTRK1 | -0.0002402 | 18199 | GTEx | DepMap | Descartes | 0.31 | 27.36 |
| TMEM132C | -0.0002499 | 18351 | GTEx | DepMap | Descartes | 7.59 | 568.70 |
| BASP1 | -0.0002672 | 18588 | GTEx | DepMap | Descartes | 2.86 | 572.40 |
| RGMB | -0.0002759 | 18699 | GTEx | DepMap | Descartes | 0.60 | 45.16 |
| MAP1B | -0.0002760 | 18701 | GTEx | DepMap | Descartes | 8.94 | 246.70 |
| PRPH | -0.0002839 | 18798 | GTEx | DepMap | Descartes | 1.16 | 188.35 |
| MAB21L1 | -0.0003127 | 19107 | GTEx | DepMap | Descartes | 0.25 | 27.67 |
| GAP43 | -0.0003349 | 19300 | GTEx | DepMap | Descartes | 2.21 | 391.92 |
| TUBA1A | -0.0003715 | 19588 | GTEx | DepMap | Descartes | 5.81 | 1048.66 |
| CNKSR2 | -0.0003879 | 19697 | GTEx | DepMap | Descartes | 2.46 | 107.69 |
| STMN2 | -0.0004322 | 19925 | GTEx | DepMap | Descartes | 6.52 | 1105.57 |
| TUBB2A | -0.0004432 | 19972 | GTEx | DepMap | Descartes | 0.85 | 136.29 |
| EYA4 | -0.0004751 | 20084 | GTEx | DepMap | Descartes | 1.00 | 55.96 |
| REEP1 | -0.0004924 | 20133 | GTEx | DepMap | Descartes | 1.12 | 78.87 |
| HS3ST5 | -0.0005063 | 20168 | GTEx | DepMap | Descartes | 0.74 | 49.49 |
| PLXNA4 | -0.0005219 | 20204 | GTEx | DepMap | Descartes | 1.84 | 38.75 |
Descartes Vascular_endothelial markers
Top 50 marker genes of Vascular_endothelial cells in the Decartes fetal adrenal single cell map (https://atlas.brotmanbaty.org/bbi/human-gene-expression-during-development/cell/vascular_endothelial/in/adrenal)
Wilcoxon ranksum test P-value for gene set overrepresentation: 1.00e+00
Mean rank of genes in gene set: 13672.59
Median rank of genes in gene set: 14810
Rank on gene expression program of top 30 genes in gene set:
| Genes | Weight | Rank | GTEx | DepMap | Descartes | Mean.Counts | Mean.TPM |
|---|---|---|---|---|---|---|---|
| IRX3 | 0.0002926 | 1172 | GTEx | DepMap | Descartes | 0.03 | 5.23 |
| CYP26B1 | 0.0001985 | 1839 | GTEx | DepMap | Descartes | 0.05 | 4.25 |
| HYAL2 | 0.0001252 | 2693 | GTEx | DepMap | Descartes | 0.16 | 13.82 |
| PODXL | 0.0000715 | 3672 | GTEx | DepMap | Descartes | 0.24 | 14.57 |
| RAMP2 | 0.0000486 | 4281 | GTEx | DepMap | Descartes | 0.14 | 60.99 |
| TMEM88 | 0.0000130 | 5552 | GTEx | DepMap | Descartes | 0.04 | 16.93 |
| TEK | 0.0000005 | 6361 | GTEx | DepMap | Descartes | 0.12 | 8.70 |
| ECSCR | -0.0000060 | 7933 | GTEx | DepMap | Descartes | 0.00 | 0.00 |
| KANK3 | -0.0000610 | 12591 | GTEx | DepMap | Descartes | 0.03 | 5.00 |
| F8 | -0.0000669 | 12904 | GTEx | DepMap | Descartes | 0.09 | 3.57 |
| SHANK3 | -0.0000695 | 13032 | GTEx | DepMap | Descartes | 0.27 | 11.00 |
| ESM1 | -0.0000722 | 13172 | GTEx | DepMap | Descartes | 0.02 | 3.65 |
| CDH13 | -0.0000746 | 13297 | GTEx | DepMap | Descartes | 1.71 | 75.03 |
| NPR1 | -0.0000841 | 13726 | GTEx | DepMap | Descartes | 0.01 | 0.80 |
| FCGR2B | -0.0000871 | 13872 | GTEx | DepMap | Descartes | 0.00 | 0.33 |
| GALNT15 | -0.0000919 | 14065 | GTEx | DepMap | Descartes | 0.06 | NA |
| SOX18 | -0.0000975 | 14304 | GTEx | DepMap | Descartes | 0.01 | 2.21 |
| ROBO4 | -0.0000980 | 14330 | GTEx | DepMap | Descartes | 0.02 | 1.08 |
| CLDN5 | -0.0001022 | 14508 | GTEx | DepMap | Descartes | 0.03 | 4.56 |
| BTNL9 | -0.0001029 | 14534 | GTEx | DepMap | Descartes | 0.02 | 1.44 |
| TM4SF18 | -0.0001064 | 14659 | GTEx | DepMap | Descartes | 0.00 | 0.37 |
| APLNR | -0.0001068 | 14673 | GTEx | DepMap | Descartes | 0.01 | 0.43 |
| NOTCH4 | -0.0001130 | 14947 | GTEx | DepMap | Descartes | 0.02 | 0.77 |
| CRHBP | -0.0001139 | 14982 | GTEx | DepMap | Descartes | 0.00 | 0.53 |
| CEACAM1 | -0.0001151 | 15031 | GTEx | DepMap | Descartes | 0.12 | 11.53 |
| SLCO2A1 | -0.0001173 | 15105 | GTEx | DepMap | Descartes | 0.04 | 2.05 |
| SHE | -0.0001261 | 15410 | GTEx | DepMap | Descartes | 0.01 | 0.55 |
| FLT4 | -0.0001360 | 15750 | GTEx | DepMap | Descartes | 0.02 | 0.93 |
| KDR | -0.0001392 | 15865 | GTEx | DepMap | Descartes | 0.02 | 1.25 |
| TIE1 | -0.0001422 | 15964 | GTEx | DepMap | Descartes | 0.02 | 1.28 |
Descartes stromal markers
Top 50 marker genes of stromal cells in the Decartes fetal adrenal single cell map (https://atlas.brotmanbaty.org/bbi/human-gene-expression-during-development/cell/stromal/in/adrenal)
Wilcoxon ranksum test P-value for gene set overrepresentation: 1.00e+00
Mean rank of genes in gene set: 15093.1
Median rank of genes in gene set: 16913
Rank on gene expression program of top 30 genes in gene set:
| Genes | Weight | Rank | GTEx | DepMap | Descartes | Mean.Counts | Mean.TPM |
|---|---|---|---|---|---|---|---|
| PCOLCE | 0.0002206 | 1633 | GTEx | DepMap | Descartes | 0.67 | 162.35 |
| LAMC3 | 0.0001271 | 2666 | GTEx | DepMap | Descartes | 0.09 | 4.33 |
| CD248 | 0.0000650 | 3850 | GTEx | DepMap | Descartes | 0.03 | 4.93 |
| GAS2 | 0.0000349 | 4716 | GTEx | DepMap | Descartes | 0.57 | 91.36 |
| PDGFRA | 0.0000044 | 6039 | GTEx | DepMap | Descartes | 0.06 | 3.82 |
| CLDN11 | -0.0000049 | 7746 | GTEx | DepMap | Descartes | 0.00 | 0.00 |
| PAMR1 | -0.0000145 | 9156 | GTEx | DepMap | Descartes | 0.16 | 15.27 |
| SULT1E1 | -0.0000349 | 11054 | GTEx | DepMap | Descartes | 0.00 | 0.03 |
| ELN | -0.0000516 | 12103 | GTEx | DepMap | Descartes | 0.28 | 30.54 |
| SCARA5 | -0.0000549 | 12270 | GTEx | DepMap | Descartes | 0.01 | 0.71 |
| RSPO3 | -0.0000699 | 13051 | GTEx | DepMap | Descartes | 0.01 | NA |
| DKK2 | -0.0000730 | 13221 | GTEx | DepMap | Descartes | 0.12 | 10.70 |
| PCDH18 | -0.0000795 | 13514 | GTEx | DepMap | Descartes | 0.02 | 1.23 |
| LRRC17 | -0.0000816 | 13600 | GTEx | DepMap | Descartes | 0.10 | 15.28 |
| ACTA2 | -0.0000850 | 13769 | GTEx | DepMap | Descartes | 0.24 | 70.08 |
| SFRP2 | -0.0000997 | 14408 | GTEx | DepMap | Descartes | 0.06 | 7.74 |
| LOX | -0.0001035 | 14557 | GTEx | DepMap | Descartes | 0.02 | 1.38 |
| ISLR | -0.0001237 | 15323 | GTEx | DepMap | Descartes | 0.01 | 1.68 |
| FNDC1 | -0.0001283 | 15491 | GTEx | DepMap | Descartes | 0.02 | 0.76 |
| ABCC9 | -0.0001498 | 16177 | GTEx | DepMap | Descartes | 0.04 | 1.75 |
| MXRA5 | -0.0001503 | 16196 | GTEx | DepMap | Descartes | 0.03 | 0.75 |
| IGFBP3 | -0.0001559 | 16365 | GTEx | DepMap | Descartes | 0.06 | 7.14 |
| EDNRA | -0.0001660 | 16636 | GTEx | DepMap | Descartes | 0.05 | 3.73 |
| COL27A1 | -0.0001672 | 16670 | GTEx | DepMap | Descartes | 0.07 | 2.68 |
| ADAMTSL3 | -0.0001785 | 16913 | GTEx | DepMap | Descartes | 0.25 | 10.48 |
| GLI2 | -0.0002036 | 17500 | GTEx | DepMap | Descartes | 0.16 | 7.81 |
| CCDC102B | -0.0002072 | 17580 | GTEx | DepMap | Descartes | 0.76 | 90.07 |
| C7 | -0.0002079 | 17592 | GTEx | DepMap | Descartes | 0.20 | 7.21 |
| COL1A1 | -0.0002120 | 17670 | GTEx | DepMap | Descartes | 0.70 | 32.22 |
| CCDC80 | -0.0002154 | 17734 | GTEx | DepMap | Descartes | 0.08 | 1.57 |
Descartes sympathoblasts markers
Top 50 marker genes of sympathoblasts cells in the Decartes fetal adrenal single cell map (https://atlas.brotmanbaty.org/bbi/human-gene-expression-during-development/cell/sympathoblasts/in/adrenal)
Wilcoxon ranksum test P-value for gene set overrepresentation: 1.00e+00
Mean rank of genes in gene set: 13471.65
Median rank of genes in gene set: 18209
Rank on gene expression program of top 30 genes in gene set:
| Genes | Weight | Rank | GTEx | DepMap | Descartes | Mean.Counts | Mean.TPM |
|---|---|---|---|---|---|---|---|
| INSM1 | 0.0030086 | 46 | GTEx | DepMap | Descartes | 0.99 | 162.50 |
| SLC35F3 | 0.0024424 | 68 | GTEx | DepMap | Descartes | 3.36 | 488.08 |
| FAM155A | 0.0017074 | 103 | GTEx | DepMap | Descartes | 42.63 | 1819.92 |
| ARC | 0.0016321 | 110 | GTEx | DepMap | Descartes | 0.67 | 88.61 |
| SLC24A2 | 0.0013030 | 144 | GTEx | DepMap | Descartes | 0.68 | 23.62 |
| CHGB | 0.0005542 | 501 | GTEx | DepMap | Descartes | 6.19 | 941.70 |
| SPOCK3 | 0.0004851 | 601 | GTEx | DepMap | Descartes | 1.93 | 228.83 |
| CCSER1 | 0.0003135 | 1074 | GTEx | DepMap | Descartes | 14.87 | NA |
| TIAM1 | 0.0001948 | 1869 | GTEx | DepMap | Descartes | 3.30 | 177.83 |
| DGKK | 0.0001805 | 1993 | GTEx | DepMap | Descartes | 0.28 | 14.06 |
| PENK | 0.0000083 | 5786 | GTEx | DepMap | Descartes | 0.12 | 35.55 |
| PNMT | -0.0000169 | 9417 | GTEx | DepMap | Descartes | 0.02 | 7.48 |
| HTATSF1 | -0.0000187 | 9601 | GTEx | DepMap | Descartes | 0.41 | 50.67 |
| ROBO1 | -0.0000191 | 9651 | GTEx | DepMap | Descartes | 12.43 | 594.10 |
| CHGA | -0.0000376 | 11228 | GTEx | DepMap | Descartes | 1.09 | 179.58 |
| NTNG1 | -0.0000536 | 12205 | GTEx | DepMap | Descartes | 2.47 | 166.19 |
| TMEM130 | -0.0000946 | 14183 | GTEx | DepMap | Descartes | 0.70 | 58.22 |
| CNTN3 | -0.0000971 | 14286 | GTEx | DepMap | Descartes | 0.21 | 13.52 |
| CNTNAP5 | -0.0001256 | 15393 | GTEx | DepMap | Descartes | 1.24 | 71.74 |
| ST18 | -0.0001526 | 16262 | GTEx | DepMap | Descartes | 0.09 | 5.03 |
| SORCS3 | -0.0001986 | 17399 | GTEx | DepMap | Descartes | 0.56 | 31.11 |
| KSR2 | -0.0002409 | 18209 | GTEx | DepMap | Descartes | 1.17 | 20.41 |
| C1QL1 | -0.0002540 | 18404 | GTEx | DepMap | Descartes | 0.10 | 22.50 |
| SLC18A1 | -0.0002856 | 18824 | GTEx | DepMap | Descartes | 0.27 | 30.41 |
| LAMA3 | -0.0003305 | 19254 | GTEx | DepMap | Descartes | 0.55 | 16.30 |
| UNC80 | -0.0003345 | 19297 | GTEx | DepMap | Descartes | 2.41 | 60.52 |
| TBX20 | -0.0003526 | 19450 | GTEx | DepMap | Descartes | 0.60 | 111.60 |
| TENM1 | -0.0003813 | 19652 | GTEx | DepMap | Descartes | 1.84 | NA |
| PCSK1N | -0.0003877 | 19694 | GTEx | DepMap | Descartes | 2.07 | 581.16 |
| SCG2 | -0.0004490 | 19998 | GTEx | DepMap | Descartes | 5.16 | 495.78 |
Descartes erythroblasts markers
Top 50 marker genes of erythroblasts cells in the Decartes fetal adrenal single cell map (https://atlas.brotmanbaty.org/bbi/human-gene-expression-during-development/cell/erythroblasts/in/adrenal)
Wilcoxon ranksum test P-value for gene set overrepresentation: 9.93e-01
Mean rank of genes in gene set: 12460.35
Median rank of genes in gene set: 13154.5
Rank on gene expression program of top 30 genes in gene set:
| Genes | Weight | Rank | GTEx | DepMap | Descartes | Mean.Counts | Mean.TPM |
|---|---|---|---|---|---|---|---|
| ANK1 | 0.0004937 | 588 | GTEx | DepMap | Descartes | 1.41 | 62.52 |
| EPB41 | 0.0002973 | 1141 | GTEx | DepMap | Descartes | 2.05 | 125.19 |
| TSPAN5 | 0.0002484 | 1433 | GTEx | DepMap | Descartes | 2.73 | 250.55 |
| HBZ | 0.0000835 | 3422 | GTEx | DepMap | Descartes | 0.01 | 4.71 |
| TFR2 | 0.0000267 | 5001 | GTEx | DepMap | Descartes | 0.32 | 37.45 |
| SLC25A37 | 0.0000255 | 5053 | GTEx | DepMap | Descartes | 0.65 | 49.67 |
| FECH | 0.0000117 | 5618 | GTEx | DepMap | Descartes | 0.33 | 15.40 |
| HBG1 | 0.0000011 | 6299 | GTEx | DepMap | Descartes | 0.00 | 0.00 |
| HBG2 | 0.0000000 | 6773 | GTEx | DepMap | Descartes | 0.00 | 0.00 |
| DENND4A | -0.0000086 | 8359 | GTEx | DepMap | Descartes | 2.64 | 114.07 |
| HEMGN | -0.0000127 | 8930 | GTEx | DepMap | Descartes | 0.00 | 0.75 |
| HBM | -0.0000196 | 9704 | GTEx | DepMap | Descartes | 0.01 | 3.92 |
| XPO7 | -0.0000276 | 10487 | GTEx | DepMap | Descartes | 1.10 | 83.43 |
| GYPE | -0.0000303 | 10689 | GTEx | DepMap | Descartes | 0.05 | 9.48 |
| HBB | -0.0000392 | 11335 | GTEx | DepMap | Descartes | 0.19 | 106.03 |
| EPB42 | -0.0000397 | 11370 | GTEx | DepMap | Descartes | 0.00 | 0.34 |
| RHCE | -0.0000402 | 11398 | GTEx | DepMap | Descartes | 0.05 | 9.61 |
| RHAG | -0.0000599 | 12535 | GTEx | DepMap | Descartes | 0.00 | 0.60 |
| AHSP | -0.0000631 | 12719 | GTEx | DepMap | Descartes | 0.00 | 0.10 |
| GYPA | -0.0000635 | 12736 | GTEx | DepMap | Descartes | 0.01 | 1.22 |
| ALAS2 | -0.0000660 | 12862 | GTEx | DepMap | Descartes | 0.00 | 0.74 |
| HBA1 | -0.0000695 | 13034 | GTEx | DepMap | Descartes | 0.03 | 16.26 |
| HBA2 | -0.0000705 | 13092 | GTEx | DepMap | Descartes | 0.06 | 42.87 |
| SPTA1 | -0.0000730 | 13217 | GTEx | DepMap | Descartes | 0.00 | 0.06 |
| TMCC2 | -0.0000767 | 13388 | GTEx | DepMap | Descartes | 0.11 | 9.13 |
| CAT | -0.0000767 | 13389 | GTEx | DepMap | Descartes | 0.32 | 50.42 |
| GYPB | -0.0000779 | 13459 | GTEx | DepMap | Descartes | 0.02 | 10.58 |
| SLC4A1 | -0.0000780 | 13463 | GTEx | DepMap | Descartes | 0.01 | 0.54 |
| CPOX | -0.0000809 | 13575 | GTEx | DepMap | Descartes | 0.04 | 4.61 |
| SELENBP1 | -0.0000855 | 13794 | GTEx | DepMap | Descartes | 0.00 | 0.25 |
Descartes myeloid markers
Top 50 marker genes of myeloid cells in the Decartes fetal adrenal single cell map (https://atlas.brotmanbaty.org/bbi/human-gene-expression-during-development/cell/myeloid/in/adrenal)
Wilcoxon ranksum test P-value for gene set overrepresentation: 1.00e+00
Mean rank of genes in gene set: 16211.02
Median rank of genes in gene set: 17701
Rank on gene expression program of top 30 genes in gene set:
| Genes | Weight | Rank | GTEx | DepMap | Descartes | Mean.Counts | Mean.TPM |
|---|---|---|---|---|---|---|---|
| ATP8B4 | 0.0003947 | 789 | GTEx | DepMap | Descartes | 0.48 | 35.28 |
| RGL1 | 0.0000967 | 3176 | GTEx | DepMap | Descartes | 0.98 | 74.19 |
| ABCA1 | 0.0000895 | 3315 | GTEx | DepMap | Descartes | 0.78 | 30.64 |
| SFMBT2 | 0.0000555 | 4089 | GTEx | DepMap | Descartes | 1.09 | 53.57 |
| CTSD | -0.0000072 | 8119 | GTEx | DepMap | Descartes | 0.00 | 0.01 |
| ADAP2 | -0.0000339 | 10982 | GTEx | DepMap | Descartes | 0.17 | 23.98 |
| CYBB | -0.0000778 | 13454 | GTEx | DepMap | Descartes | 0.00 | 0.11 |
| VSIG4 | -0.0000894 | 13956 | GTEx | DepMap | Descartes | 0.00 | 0.46 |
| MS4A7 | -0.0000941 | 14162 | GTEx | DepMap | Descartes | 0.00 | 0.52 |
| CTSC | -0.0001083 | 14731 | GTEx | DepMap | Descartes | 0.22 | 13.97 |
| RNASE1 | -0.0001243 | 15343 | GTEx | DepMap | Descartes | 0.02 | 6.94 |
| ITPR2 | -0.0001275 | 15459 | GTEx | DepMap | Descartes | 1.78 | 51.77 |
| CPVL | -0.0001530 | 16271 | GTEx | DepMap | Descartes | 0.20 | 30.43 |
| CD163 | -0.0001593 | 16456 | GTEx | DepMap | Descartes | 0.02 | 1.15 |
| MS4A4E | -0.0001673 | 16672 | GTEx | DepMap | Descartes | 0.02 | 2.02 |
| MPEG1 | -0.0001786 | 16916 | GTEx | DepMap | Descartes | 0.01 | 0.92 |
| FGD2 | -0.0001853 | 17064 | GTEx | DepMap | Descartes | 0.01 | 0.71 |
| CSF1R | -0.0001918 | 17226 | GTEx | DepMap | Descartes | 0.03 | 1.74 |
| HCK | -0.0001943 | 17288 | GTEx | DepMap | Descartes | 0.02 | 3.18 |
| RBPJ | -0.0002076 | 17586 | GTEx | DepMap | Descartes | 2.18 | 138.43 |
| MS4A4A | -0.0002113 | 17658 | GTEx | DepMap | Descartes | 0.02 | 3.24 |
| IFNGR1 | -0.0002125 | 17679 | GTEx | DepMap | Descartes | 0.26 | 36.81 |
| HLA-DRB1 | -0.0002130 | 17686 | GTEx | DepMap | Descartes | 0.02 | 3.47 |
| SLC1A3 | -0.0002133 | 17692 | GTEx | DepMap | Descartes | 0.09 | 5.31 |
| FGL2 | -0.0002137 | 17701 | GTEx | DepMap | Descartes | 0.02 | 1.34 |
| C1QC | -0.0002250 | 17946 | GTEx | DepMap | Descartes | 0.03 | 8.06 |
| SLCO2B1 | -0.0002342 | 18103 | GTEx | DepMap | Descartes | 0.08 | 3.58 |
| CD14 | -0.0002346 | 18106 | GTEx | DepMap | Descartes | 0.03 | 5.66 |
| LGMN | -0.0002370 | 18146 | GTEx | DepMap | Descartes | 0.19 | 30.57 |
| MS4A6A | -0.0002411 | 18213 | GTEx | DepMap | Descartes | 0.03 | 3.31 |
Descartes Schwann markers
Top 50 marker genes of Schwann cells in the Decartes fetal adrenal single cell map (https://atlas.brotmanbaty.org/bbi/human-gene-expression-during-development/cell/schwann/in/adrenal)
Wilcoxon ranksum test P-value for gene set overrepresentation: 1.00e+00
Mean rank of genes in gene set: 15404
Median rank of genes in gene set: 17866
Rank on gene expression program of top 30 genes in gene set:
| Genes | Weight | Rank | GTEx | DepMap | Descartes | Mean.Counts | Mean.TPM |
|---|---|---|---|---|---|---|---|
| TRPM3 | 0.0018116 | 95 | GTEx | DepMap | Descartes | 2.64 | 90.41 |
| ERBB4 | 0.0016779 | 108 | GTEx | DepMap | Descartes | 7.56 | 254.75 |
| EGFLAM | 0.0007558 | 315 | GTEx | DepMap | Descartes | 1.30 | 98.37 |
| DST | 0.0002835 | 1223 | GTEx | DepMap | Descartes | 10.42 | 170.38 |
| MARCKS | 0.0002575 | 1375 | GTEx | DepMap | Descartes | 2.33 | 221.81 |
| NLGN4X | 0.0001390 | 2488 | GTEx | DepMap | Descartes | 3.80 | 237.71 |
| GRIK3 | 0.0000116 | 5623 | GTEx | DepMap | Descartes | 0.35 | 15.99 |
| ZNF536 | 0.0000086 | 5778 | GTEx | DepMap | Descartes | 1.99 | 142.02 |
| IL1RAPL2 | -0.0000638 | 12749 | GTEx | DepMap | Descartes | 0.62 | 70.24 |
| COL25A1 | -0.0000679 | 12949 | GTEx | DepMap | Descartes | 0.33 | 13.52 |
| SOX10 | -0.0000912 | 14037 | GTEx | DepMap | Descartes | 0.07 | 7.97 |
| MPZ | -0.0000916 | 14052 | GTEx | DepMap | Descartes | 0.03 | 4.15 |
| ERBB3 | -0.0000996 | 14402 | GTEx | DepMap | Descartes | 0.02 | 1.03 |
| HMGA2 | -0.0001228 | 15293 | GTEx | DepMap | Descartes | 0.02 | 0.93 |
| OLFML2A | -0.0001255 | 15390 | GTEx | DepMap | Descartes | 0.02 | 0.70 |
| LAMB1 | -0.0001324 | 15636 | GTEx | DepMap | Descartes | 1.36 | 86.12 |
| PLP1 | -0.0001482 | 16130 | GTEx | DepMap | Descartes | 0.01 | 0.74 |
| ADAMTS5 | -0.0001526 | 16263 | GTEx | DepMap | Descartes | 0.04 | 1.07 |
| PTPRZ1 | -0.0001541 | 16304 | GTEx | DepMap | Descartes | 0.02 | 0.67 |
| PLCE1 | -0.0001588 | 16441 | GTEx | DepMap | Descartes | 0.51 | 13.75 |
| EDNRB | -0.0001722 | 16768 | GTEx | DepMap | Descartes | 0.02 | 1.56 |
| CDH19 | -0.0001740 | 16810 | GTEx | DepMap | Descartes | 0.07 | 1.77 |
| KCTD12 | -0.0001989 | 17405 | GTEx | DepMap | Descartes | 0.10 | 4.95 |
| LAMC1 | -0.0002172 | 17784 | GTEx | DepMap | Descartes | 0.55 | 25.06 |
| NRXN1 | -0.0002211 | 17866 | GTEx | DepMap | Descartes | 11.77 | 407.32 |
| PTN | -0.0002287 | 18003 | GTEx | DepMap | Descartes | 0.45 | 89.53 |
| ABCA8 | -0.0002383 | 18167 | GTEx | DepMap | Descartes | 0.06 | 1.77 |
| XKR4 | -0.0002890 | 18860 | GTEx | DepMap | Descartes | 0.45 | 5.18 |
| IL1RAPL1 | -0.0002920 | 18902 | GTEx | DepMap | Descartes | 1.27 | 100.00 |
| COL5A2 | -0.0002964 | 18960 | GTEx | DepMap | Descartes | 0.24 | 11.30 |
Descartes Megakaryocytes markers
Top 50 marker genes of Megakaryocytes cells in the Decartes fetal adrenal single cell map (https://atlas.brotmanbaty.org/bbi/human-gene-expression-during-development/cell/megakaryocytes/in/adrenal)
Wilcoxon ranksum test P-value for gene set overrepresentation: 1.00e+00
Mean rank of genes in gene set: 15928.06
Median rank of genes in gene set: 17754
Rank on gene expression program of top 30 genes in gene set:
| Genes | Weight | Rank | GTEx | DepMap | Descartes | Mean.Counts | Mean.TPM |
|---|---|---|---|---|---|---|---|
| STON2 | 0.0001409 | 2459 | GTEx | DepMap | Descartes | 0.48 | 45.17 |
| ITGA2B | 0.0000998 | 3114 | GTEx | DepMap | Descartes | 0.17 | 16.73 |
| PSTPIP2 | 0.0000216 | 5207 | GTEx | DepMap | Descartes | 0.11 | 14.43 |
| GP9 | -0.0000004 | 7027 | GTEx | DepMap | Descartes | 0.00 | 0.02 |
| SPN | -0.0000070 | 8088 | GTEx | DepMap | Descartes | 0.00 | 0.00 |
| PF4 | -0.0000121 | 8853 | GTEx | DepMap | Descartes | 0.00 | 0.08 |
| ITGB3 | -0.0000140 | 9093 | GTEx | DepMap | Descartes | 0.00 | 0.01 |
| PPBP | -0.0000166 | 9374 | GTEx | DepMap | Descartes | 0.00 | 0.25 |
| GP1BA | -0.0000526 | 12150 | GTEx | DepMap | Descartes | 0.01 | 1.09 |
| TPM4 | -0.0000863 | 13829 | GTEx | DepMap | Descartes | 1.08 | 82.12 |
| P2RX1 | -0.0000909 | 14023 | GTEx | DepMap | Descartes | 0.01 | 1.20 |
| TUBB1 | -0.0000992 | 14381 | GTEx | DepMap | Descartes | 0.01 | 1.13 |
| ZYX | -0.0001037 | 14566 | GTEx | DepMap | Descartes | 0.14 | 22.80 |
| MMRN1 | -0.0001083 | 14733 | GTEx | DepMap | Descartes | 0.01 | 0.66 |
| FLNA | -0.0001246 | 15353 | GTEx | DepMap | Descartes | 0.39 | 17.63 |
| ANGPT1 | -0.0001291 | 15516 | GTEx | DepMap | Descartes | 0.18 | 12.90 |
| TRPC6 | -0.0001303 | 15553 | GTEx | DepMap | Descartes | 0.05 | 3.16 |
| FERMT3 | -0.0001317 | 15605 | GTEx | DepMap | Descartes | 0.06 | 8.81 |
| TGFB1 | -0.0001496 | 16169 | GTEx | DepMap | Descartes | 0.32 | 43.30 |
| UBASH3B | -0.0001554 | 16352 | GTEx | DepMap | Descartes | 0.42 | 21.84 |
| BIN2 | -0.0001693 | 16712 | GTEx | DepMap | Descartes | 0.04 | 4.61 |
| PLEK | -0.0001748 | 16828 | GTEx | DepMap | Descartes | 0.01 | 1.54 |
| CD84 | -0.0001902 | 17185 | GTEx | DepMap | Descartes | 0.01 | 0.60 |
| STOM | -0.0002084 | 17605 | GTEx | DepMap | Descartes | 0.18 | 19.07 |
| SLC24A3 | -0.0002162 | 17754 | GTEx | DepMap | Descartes | 0.61 | 45.11 |
| MCTP1 | -0.0002419 | 18224 | GTEx | DepMap | Descartes | 0.25 | 12.48 |
| LIMS1 | -0.0002546 | 18418 | GTEx | DepMap | Descartes | 1.35 | 106.27 |
| ARHGAP6 | -0.0002607 | 18512 | GTEx | DepMap | Descartes | 0.15 | 6.11 |
| MYLK | -0.0002619 | 18531 | GTEx | DepMap | Descartes | 0.23 | 6.67 |
| ACTB | -0.0002718 | 18639 | GTEx | DepMap | Descartes | 4.24 | 740.63 |
Descartes Lyphoid markers
Top 50 marker genes of Lyphoid cells in the Decartes fetal adrenal single cell map (https://atlas.brotmanbaty.org/bbi/human-gene-expression-during-development/cell/lymphoid/in/adrenal)
Wilcoxon ranksum test P-value for gene set overrepresentation: 1.00e+00
Mean rank of genes in gene set: 17433.02
Median rank of genes in gene set: 19291
Rank on gene expression program of top 30 genes in gene set:
| Genes | Weight | Rank | GTEx | DepMap | Descartes | Mean.Counts | Mean.TPM |
|---|---|---|---|---|---|---|---|
| FYN | 0.0005414 | 521 | GTEx | DepMap | Descartes | 4.64 | 498.68 |
| RAP1GAP2 | 0.0003400 | 972 | GTEx | DepMap | Descartes | 4.36 | 240.51 |
| HLA-A | 0.0000385 | 4595 | GTEx | DepMap | Descartes | 0.61 | 40.29 |
| FOXP1 | 0.0000285 | 4938 | GTEx | DepMap | Descartes | 0.32 | 13.43 |
| ABLIM1 | -0.0000322 | 10830 | GTEx | DepMap | Descartes | 2.48 | 113.51 |
| NKG7 | -0.0000817 | 13603 | GTEx | DepMap | Descartes | 0.00 | 2.18 |
| CELF2 | -0.0001121 | 14902 | GTEx | DepMap | Descartes | 1.91 | 87.87 |
| CCND3 | -0.0001127 | 14935 | GTEx | DepMap | Descartes | 0.71 | 113.42 |
| CCL5 | -0.0001194 | 15173 | GTEx | DepMap | Descartes | 0.02 | 5.70 |
| SORL1 | -0.0001273 | 15452 | GTEx | DepMap | Descartes | 0.86 | 26.98 |
| ARHGDIB | -0.0002134 | 17695 | GTEx | DepMap | Descartes | 0.03 | 9.81 |
| WIPF1 | -0.0002367 | 18140 | GTEx | DepMap | Descartes | 0.90 | 71.59 |
| LEF1 | -0.0002394 | 18181 | GTEx | DepMap | Descartes | 0.36 | 37.16 |
| MCTP2 | -0.0002672 | 18589 | GTEx | DepMap | Descartes | 0.18 | 6.02 |
| SKAP1 | -0.0002722 | 18643 | GTEx | DepMap | Descartes | 0.23 | 46.73 |
| PDE3B | -0.0002777 | 18720 | GTEx | DepMap | Descartes | 2.17 | 123.10 |
| RCSD1 | -0.0002834 | 18791 | GTEx | DepMap | Descartes | 0.09 | 5.35 |
| PRKCH | -0.0002853 | 18819 | GTEx | DepMap | Descartes | 0.22 | 18.18 |
| ITPKB | -0.0002919 | 18900 | GTEx | DepMap | Descartes | 0.12 | 5.80 |
| IKZF1 | -0.0002938 | 18929 | GTEx | DepMap | Descartes | 0.14 | 8.58 |
| PLEKHA2 | -0.0002970 | 18964 | GTEx | DepMap | Descartes | 0.21 | 12.26 |
| LCP1 | -0.0002980 | 18975 | GTEx | DepMap | Descartes | 0.09 | 7.90 |
| SAMD3 | -0.0003022 | 19013 | GTEx | DepMap | Descartes | 0.21 | 14.64 |
| EVL | -0.0003342 | 19291 | GTEx | DepMap | Descartes | 3.15 | 297.46 |
| ETS1 | -0.0003372 | 19320 | GTEx | DepMap | Descartes | 0.17 | 10.56 |
| NCALD | -0.0003399 | 19350 | GTEx | DepMap | Descartes | 0.63 | 49.81 |
| HLA-C | -0.0003677 | 19563 | GTEx | DepMap | Descartes | 0.10 | 13.89 |
| PTPRC | -0.0003724 | 19597 | GTEx | DepMap | Descartes | 0.20 | 13.46 |
| IFI16 | -0.0003858 | 19682 | GTEx | DepMap | Descartes | 0.22 | 15.12 |
| MSN | -0.0004078 | 19818 | GTEx | DepMap | Descartes | 0.13 | 8.77 |
Embryonic Pausing Signatures Up
Embryonic pausing signature upregulated genes from Supplementary Table 6 of Rehman et al. Cell 2021. These genes are upregulated in paused ESCs and diapaused embryos.
Wilcoxon ranksum test P-value for gene set overrepresentation: 1.44e-01
Mean rank of genes in gene set: 8619.43
Median rank of genes in gene set: 5330
Rank on gene expression program of top 30 genes in gene set:
| Genes | Weight | Rank | GTEx | DepMap | Descartes | Mean.Counts | Mean.TPM |
|---|---|---|---|---|---|---|---|
| DPP7 | 0.0007459 | 320 | GTEx | DepMap | Descartes | 0.73 | 179.76 |
| PDCD4 | 0.0002408 | 1490 | GTEx | DepMap | Descartes | 0.91 | 97.27 |
| RENBP | 0.0001140 | 2863 | GTEx | DepMap | Descartes | 0.13 | 34.84 |
| CCNG2 | 0.0001095 | 2934 | GTEx | DepMap | Descartes | 0.48 | 33.83 |
| ALDH6A1 | 0.0000401 | 4544 | GTEx | DepMap | Descartes | 0.12 | 8.73 |
| AUH | 0.0000195 | 5279 | GTEx | DepMap | Descartes | 1.58 | 373.42 |
| ACSS1 | 0.0000185 | 5329 | GTEx | DepMap | Descartes | 0.06 | 4.93 |
| HEXA | 0.0000184 | 5331 | GTEx | DepMap | Descartes | 0.04 | 2.33 |
| LY6G6E | 0.0000000 | 6866 | GTEx | DepMap | Descartes | 0.00 | 0.00 |
| HEXB | -0.0000793 | 13508 | GTEx | DepMap | Descartes | 0.25 | 45.24 |
| SPRY1 | -0.0001535 | 16285 | GTEx | DepMap | Descartes | 0.07 | 7.64 |
| YPEL2 | -0.0001862 | 17092 | GTEx | DepMap | Descartes | 0.64 | 38.11 |
| CTSL | -0.0002725 | 18647 | GTEx | DepMap | Descartes | 0.35 | NA |
| APOE | -0.0005136 | 20184 | GTEx | DepMap | Descartes | 0.33 | 82.60 |
Embryonic Pausing Signatures Down
Embryonic pausing signature downregulated genes from Supplementary Table 6 of Rehman et al. Cell 2021. These genes are downregulated in paused ESCs and diapaused embryos.
Wilcoxon ranksum test P-value for gene set overrepresentation: 6.00e-04
Mean rank of genes in gene set: 8419.89
Median rank of genes in gene set: 6191
Rank on gene expression program of top 30 genes in gene set:
| Genes | Weight | Rank | GTEx | DepMap | Descartes | Mean.Counts | Mean.TPM |
|---|---|---|---|---|---|---|---|
| RPL41 | 0.0035654 | 29 | GTEx | DepMap | Descartes | 7.83 | 5080.30 |
| PPA1 | 0.0008626 | 258 | GTEx | DepMap | Descartes | 1.76 | 205.98 |
| TMEM97 | 0.0005941 | 455 | GTEx | DepMap | Descartes | 0.40 | 66.97 |
| EIF3B | 0.0005384 | 525 | GTEx | DepMap | Descartes | 1.33 | 139.33 |
| RPS27L | 0.0004748 | 629 | GTEx | DepMap | Descartes | 0.78 | 58.41 |
| SNRPE | 0.0004564 | 663 | GTEx | DepMap | Descartes | 0.63 | 171.70 |
| SNRPD2 | 0.0003500 | 934 | GTEx | DepMap | Descartes | 0.67 | 335.76 |
| PHB | 0.0003423 | 964 | GTEx | DepMap | Descartes | 0.62 | 120.78 |
| SAC3D1 | 0.0003281 | 1010 | GTEx | DepMap | Descartes | 0.26 | 69.54 |
| PA2G4 | 0.0003244 | 1024 | GTEx | DepMap | Descartes | 0.52 | 91.35 |
| ANKRD37 | 0.0003182 | 1052 | GTEx | DepMap | Descartes | 0.09 | 25.66 |
| PHGDH | 0.0003097 | 1091 | GTEx | DepMap | Descartes | 0.23 | 29.53 |
| TMEM258 | 0.0003015 | 1126 | GTEx | DepMap | Descartes | 0.66 | NA |
| THOP1 | 0.0003004 | 1130 | GTEx | DepMap | Descartes | 0.36 | 30.82 |
| HMGA1 | 0.0002938 | 1164 | GTEx | DepMap | Descartes | 0.49 | 95.41 |
| HSPE1 | 0.0002726 | 1289 | GTEx | DepMap | Descartes | 0.69 | 396.46 |
| ELOF1 | 0.0002544 | 1393 | GTEx | DepMap | Descartes | 0.16 | 28.63 |
| RAN | 0.0002147 | 1678 | GTEx | DepMap | Descartes | 1.21 | 192.46 |
| SLC25A5 | 0.0002091 | 1726 | GTEx | DepMap | Descartes | 0.32 | 96.03 |
| NABP2 | 0.0002001 | 1819 | GTEx | DepMap | Descartes | 0.16 | NA |
| RCL1 | 0.0001985 | 1838 | GTEx | DepMap | Descartes | 0.92 | 170.25 |
| DCTPP1 | 0.0001821 | 1980 | GTEx | DepMap | Descartes | 0.17 | 60.58 |
| POLR2I | 0.0001729 | 2088 | GTEx | DepMap | Descartes | 0.37 | 151.96 |
| BYSL | 0.0001552 | 2288 | GTEx | DepMap | Descartes | 0.08 | 19.97 |
| EXOSC2 | 0.0001492 | 2358 | GTEx | DepMap | Descartes | 0.21 | 31.09 |
| ANAPC15 | 0.0001451 | 2408 | GTEx | DepMap | Descartes | 0.10 | NA |
| EXOSC4 | 0.0001416 | 2453 | GTEx | DepMap | Descartes | 0.11 | 38.26 |
| SMS | 0.0001348 | 2539 | GTEx | DepMap | Descartes | 1.35 | 300.55 |
| DRG2 | 0.0001283 | 2651 | GTEx | DepMap | Descartes | 0.17 | 12.35 |
| MDH2 | 0.0001199 | 2774 | GTEx | DepMap | Descartes | 0.53 | 92.34 |
Below shows the ranks on this GEP for immune marker gene lists curated by CellTypist (https://www.celltypist.org/encyclopedia).
High ranks indicate this gene is a driver of this GEP.
These curated gene list are ranked by P-value (on this GEP) of their constituent genes.
The Mean Count column shows the mean read count in cells scoring highly (H > 50) on this gene expression program.
Megakaryocytes/platelets: Megakaryocytes/platelets (curated markers)
large multinucleated cells with numerous azurophilic granules and with mature blood platelets released from the cytoplasm:
Wilcoxon ranksum test P-value for gene set overrepresentation: 4.95e-02
Mean rank of genes in gene set: 4635
Rank on gene expression program of genes in gene set:
| Genes | Weight | Rank | GTEx | DepMap | Decartes | Mean.Counts | Mean.TPM |
|---|---|---|---|---|---|---|---|
| CMTM5 | 0.0001876 | 1938 | GTEx | DepMap | Descartes | 0.01 | 2.07 |
| ITGA2B | 0.0000998 | 3114 | GTEx | DepMap | Descartes | 0.17 | 16.73 |
| PF4 | -0.0000121 | 8853 | GTEx | DepMap | Descartes | 0.00 | 0.08 |
Erythroid: Early erythroid (model markers)
early erythroid cells which are committed to erythroid lineage cells:
Wilcoxon ranksum test P-value for gene set overrepresentation: 7.32e-02
Mean rank of genes in gene set: 7242.25
Rank on gene expression program of genes in gene set:
| Genes | Weight | Rank | GTEx | DepMap | Decartes | Mean.Counts | Mean.TPM |
|---|---|---|---|---|---|---|---|
| FAM178B | 0.0001105 | 2915 | GTEx | DepMap | Descartes | 0.06 | 8.18 |
| CD207 | 0.0000769 | 3554 | GTEx | DepMap | Descartes | 0.01 | 1.22 |
| PRSS57 | 0.0000613 | 3939 | GTEx | DepMap | Descartes | 0.01 | 3.12 |
| PCLAF | 0.0000315 | 4823 | GTEx | DepMap | Descartes | 0.01 | NA |
| IL17A | -0.0000033 | 7500 | GTEx | DepMap | Descartes | 0.00 | 0.00 |
| OR2A25 | -0.0000094 | 8470 | GTEx | DepMap | Descartes | 0.00 | 0.01 |
| PRG2 | -0.0000117 | 8801 | GTEx | DepMap | Descartes | 0.00 | 0.00 |
| APOC1 | -0.0002243 | 17936 | GTEx | DepMap | Descartes | 0.06 | 32.44 |
Erythroid: Mid erythroid (curated markers)
middle erythroid cells in fetal liver:
Wilcoxon ranksum test P-value for gene set overrepresentation: 8.53e-02
Mean rank of genes in gene set: 5591.67
Rank on gene expression program of genes in gene set:
| Genes | Weight | Rank | GTEx | DepMap | Decartes | Mean.Counts | Mean.TPM |
|---|---|---|---|---|---|---|---|
| KCNH2 | 0.0003489 | 941 | GTEx | DepMap | Descartes | 0.49 | 40.73 |
| PRDX2 | 0.0001007 | 3098 | GTEx | DepMap | Descartes | 0.21 | 46.11 |
| GYPA | -0.0000635 | 12736 | GTEx | DepMap | Descartes | 0.01 | 1.22 |