Program: 48. Inflammatory Cancer-Associated Fibroblasts.
Program description and justification of annotation generated by GPT5: Inflammatory cancer-associated fibroblasts (iCAF) with EMT/stress and hyaluronan-ECM remodeling.
Submit a comment on this gene expression program's interpretation: CLICK
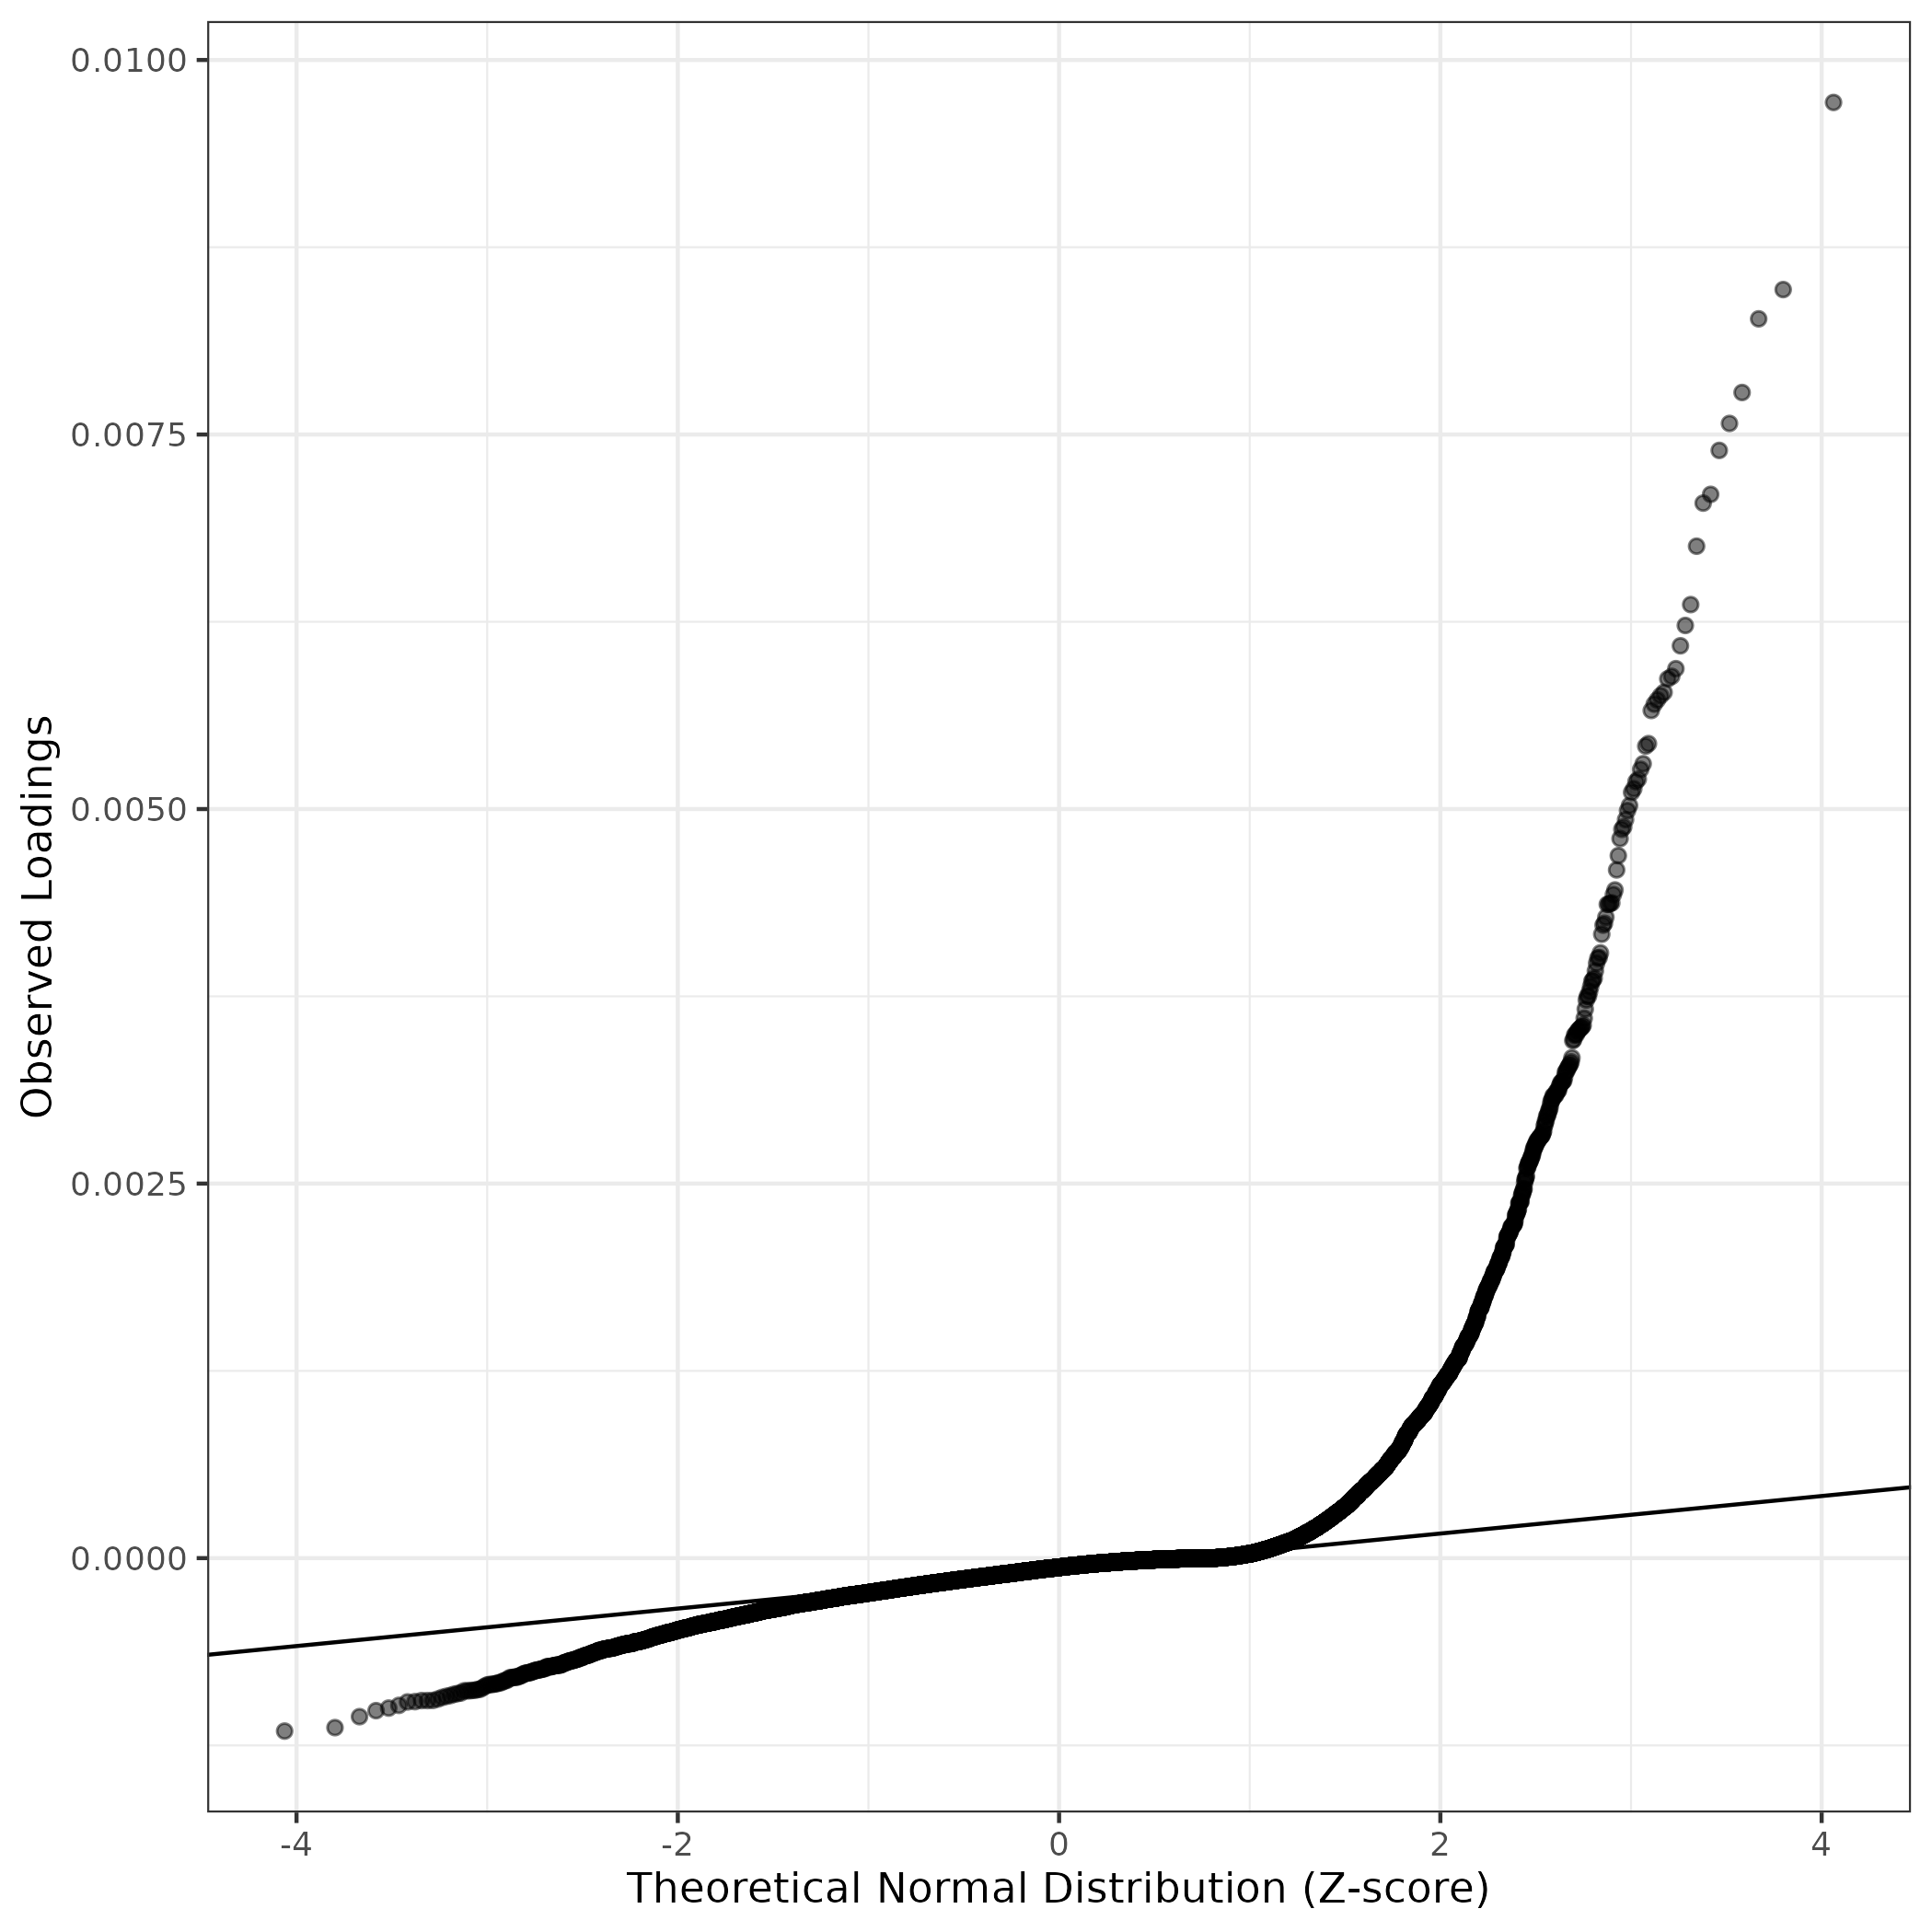
QQ-plot of gene loadings, averaged over both independent splits of the data
This plot highlights the relative contribution of each gene to the GEP
Top genes driving this program.
Note: Decartes website is buggy, try refreshing. Also, Decartes fetal adrenal data have been collected at specific time points (89-122 days), all possible cell types of interest may not be represented, do not overinterpret.
The Mean Count column shows the mean read count in cells scoring highly (H > 50) on this gene expression program.
| Gene | Loading | Gene.Name | GTEx | DepMap | Descartes | Mean.Counts | Mean.Tpm | |
|---|---|---|---|---|---|---|---|---|
| 1 | CRISPLD2 | 0.0097166 | cysteine rich secretory protein LCCL domain containing 2 | GTEx | DepMap | Descartes | 5.12 | 1133.49 |
| 2 | LMNA | 0.0084675 | lamin A/C | GTEx | DepMap | Descartes | 6.62 | 1852.26 |
| 3 | GFPT2 | 0.0082721 | glutamine-fructose-6-phosphate transaminase 2 | GTEx | DepMap | Descartes | 1.32 | 427.38 |
| 4 | FOSB | 0.0077804 | FosB proto-oncogene, AP-1 transcription factor subunit | GTEx | DepMap | Descartes | 4.00 | 938.15 |
| 5 | HAS2 | 0.0075740 | hyaluronan synthase 2 | GTEx | DepMap | Descartes | 0.83 | 195.73 |
| 6 | EMP1 | 0.0073940 | epithelial membrane protein 1 | GTEx | DepMap | Descartes | 6.85 | 1059.63 |
| 7 | TWIST2 | 0.0071006 | twist family bHLH transcription factor 2 | GTEx | DepMap | Descartes | 0.64 | 532.98 |
| 8 | ESYT2 | 0.0070422 | extended synaptotagmin 2 | GTEx | DepMap | Descartes | 5.64 | 743.97 |
| 9 | RFX2 | 0.0067545 | regulatory factor X2 | GTEx | DepMap | Descartes | 3.17 | 676.17 |
| 10 | FGFR1 | 0.0063647 | fibroblast growth factor receptor 1 | GTEx | DepMap | Descartes | 2.30 | 322.99 |
| 11 | HAS1 | 0.0062255 | hyaluronan synthase 1 | GTEx | DepMap | Descartes | 0.24 | 115.14 |
| 12 | NFATC2 | 0.0060898 | nuclear factor of activated T cells 2 | GTEx | DepMap | Descartes | 7.74 | 1036.89 |
| 13 | PRICKLE2 | 0.0059370 | prickle planar cell polarity protein 2 | GTEx | DepMap | Descartes | 2.98 | 244.38 |
| 14 | MMP19 | 0.0058856 | matrix metallopeptidase 19 | GTEx | DepMap | Descartes | 1.34 | 304.91 |
| 15 | NR4A1 | 0.0058689 | nuclear receptor subfamily 4 group A member 1 | GTEx | DepMap | Descartes | 4.85 | 783.39 |
| 16 | B4GALT1 | 0.0057794 | beta-1,4-galactosyltransferase 1 | GTEx | DepMap | Descartes | 2.22 | 381.22 |
| 17 | GPRC5A | 0.0057568 | G protein-coupled receptor class C group 5 member A | GTEx | DepMap | Descartes | 0.53 | 71.96 |
| 18 | FGF7 | 0.0057284 | fibroblast growth factor 7 | GTEx | DepMap | Descartes | 1.55 | 249.73 |
| 19 | NFATC1 | 0.0057003 | nuclear factor of activated T cells 1 | GTEx | DepMap | Descartes | 2.08 | 396.04 |
| 20 | TACC1 | 0.0056579 | transforming acidic coiled-coil containing protein 1 | GTEx | DepMap | Descartes | 4.75 | 521.57 |
| 21 | UAP1 | 0.0054367 | UDP-N-acetylglucosamine pyrophosphorylase 1 | GTEx | DepMap | Descartes | 1.06 | 310.86 |
| 22 | ERCC1 | 0.0054204 | ERCC excision repair 1, endonuclease non-catalytic subunit | GTEx | DepMap | Descartes | 1.77 | 441.83 |
| 23 | IL1R1 | 0.0053024 | interleukin 1 receptor type 1 | GTEx | DepMap | Descartes | 2.47 | 378.89 |
| 24 | SEMA4A | 0.0052649 | semaphorin 4A | GTEx | DepMap | Descartes | 1.02 | 331.82 |
| 25 | SLC19A2 | 0.0051996 | solute carrier family 19 member 2 | GTEx | DepMap | Descartes | 1.04 | 224.63 |
| 26 | SVEP1 | 0.0051828 | sushi, von Willebrand factor type A, EGF and pentraxin domain containing 1 | GTEx | DepMap | Descartes | 1.54 | 107.30 |
| 27 | SAMD4A | 0.0051354 | sterile alpha motif domain containing 4A | GTEx | DepMap | Descartes | 8.71 | 881.69 |
| 28 | STAT3 | 0.0051113 | signal transducer and activator of transcription 3 | GTEx | DepMap | Descartes | 6.62 | 822.99 |
| 29 | ABI3BP | 0.0050239 | ABI family member 3 binding protein | GTEx | DepMap | Descartes | 1.68 | 209.78 |
| 30 | ADAMTS1 | 0.0049896 | ADAM metallopeptidase with thrombospondin type 1 motif 1 | GTEx | DepMap | Descartes | 1.54 | 254.37 |
| 31 | MEDAG | 0.0049298 | mesenteric estrogen dependent adipogenesis | GTEx | DepMap | Descartes | 0.47 | NA |
| 32 | SIK3 | 0.0048808 | SIK family kinase 3 | GTEx | DepMap | Descartes | 9.60 | 1016.20 |
| 33 | EGFR | 0.0048645 | epidermal growth factor receptor | GTEx | DepMap | Descartes | 3.98 | 301.96 |
| 34 | OSMR | 0.0048028 | oncostatin M receptor | GTEx | DepMap | Descartes | 2.32 | 282.80 |
| 35 | FOS | 0.0046891 | Fos proto-oncogene, AP-1 transcription factor subunit | GTEx | DepMap | Descartes | 5.69 | 1942.14 |
| 36 | SPON1 | 0.0045938 | spondin 1 | GTEx | DepMap | Descartes | 0.87 | 136.07 |
| 37 | PRRX1 | 0.0044597 | paired related homeobox 1 | GTEx | DepMap | Descartes | 1.66 | 335.61 |
| 38 | AXL | 0.0044290 | AXL receptor tyrosine kinase | GTEx | DepMap | Descartes | 1.29 | 243.26 |
| 39 | DPYSL3 | 0.0043736 | dihydropyrimidinase like 3 | GTEx | DepMap | Descartes | 2.80 | 357.64 |
| 40 | COL4A4 | 0.0043707 | collagen type IV alpha 4 chain | GTEx | DepMap | Descartes | 0.69 | 58.14 |
| 41 | MYOF | 0.0043649 | myoferlin | GTEx | DepMap | Descartes | 1.89 | 225.81 |
| 42 | RAD51B | 0.0043640 | RAD51 paralog B | GTEx | DepMap | Descartes | 4.01 | 1208.83 |
| 43 | SPSB1 | 0.0042782 | splA/ryanodine receptor domain and SOCS box containing 1 | GTEx | DepMap | Descartes | 3.81 | 741.43 |
| 44 | CCN1 | 0.0042375 | cellular communication network factor 1 | GTEx | DepMap | Descartes | 2.75 | NA |
| 45 | SIK2 | 0.0042251 | salt inducible kinase 2 | GTEx | DepMap | Descartes | 4.26 | 289.01 |
| 46 | ADAMTS15 | 0.0041647 | ADAM metallopeptidase with thrombospondin type 1 motif 15 | GTEx | DepMap | Descartes | 0.17 | 33.81 |
| 47 | SLC2A3 | 0.0040398 | solute carrier family 2 member 3 | GTEx | DepMap | Descartes | 3.01 | 544.69 |
| 48 | ADGRD1 | 0.0040086 | adhesion G protein-coupled receptor D1 | GTEx | DepMap | Descartes | 0.50 | NA |
| 49 | THBS1 | 0.0040045 | thrombospondin 1 | GTEx | DepMap | Descartes | 5.13 | 501.17 |
| 50 | ERRFI1 | 0.0039704 | ERBB receptor feedback inhibitor 1 | GTEx | DepMap | Descartes | 2.93 | 551.92 |
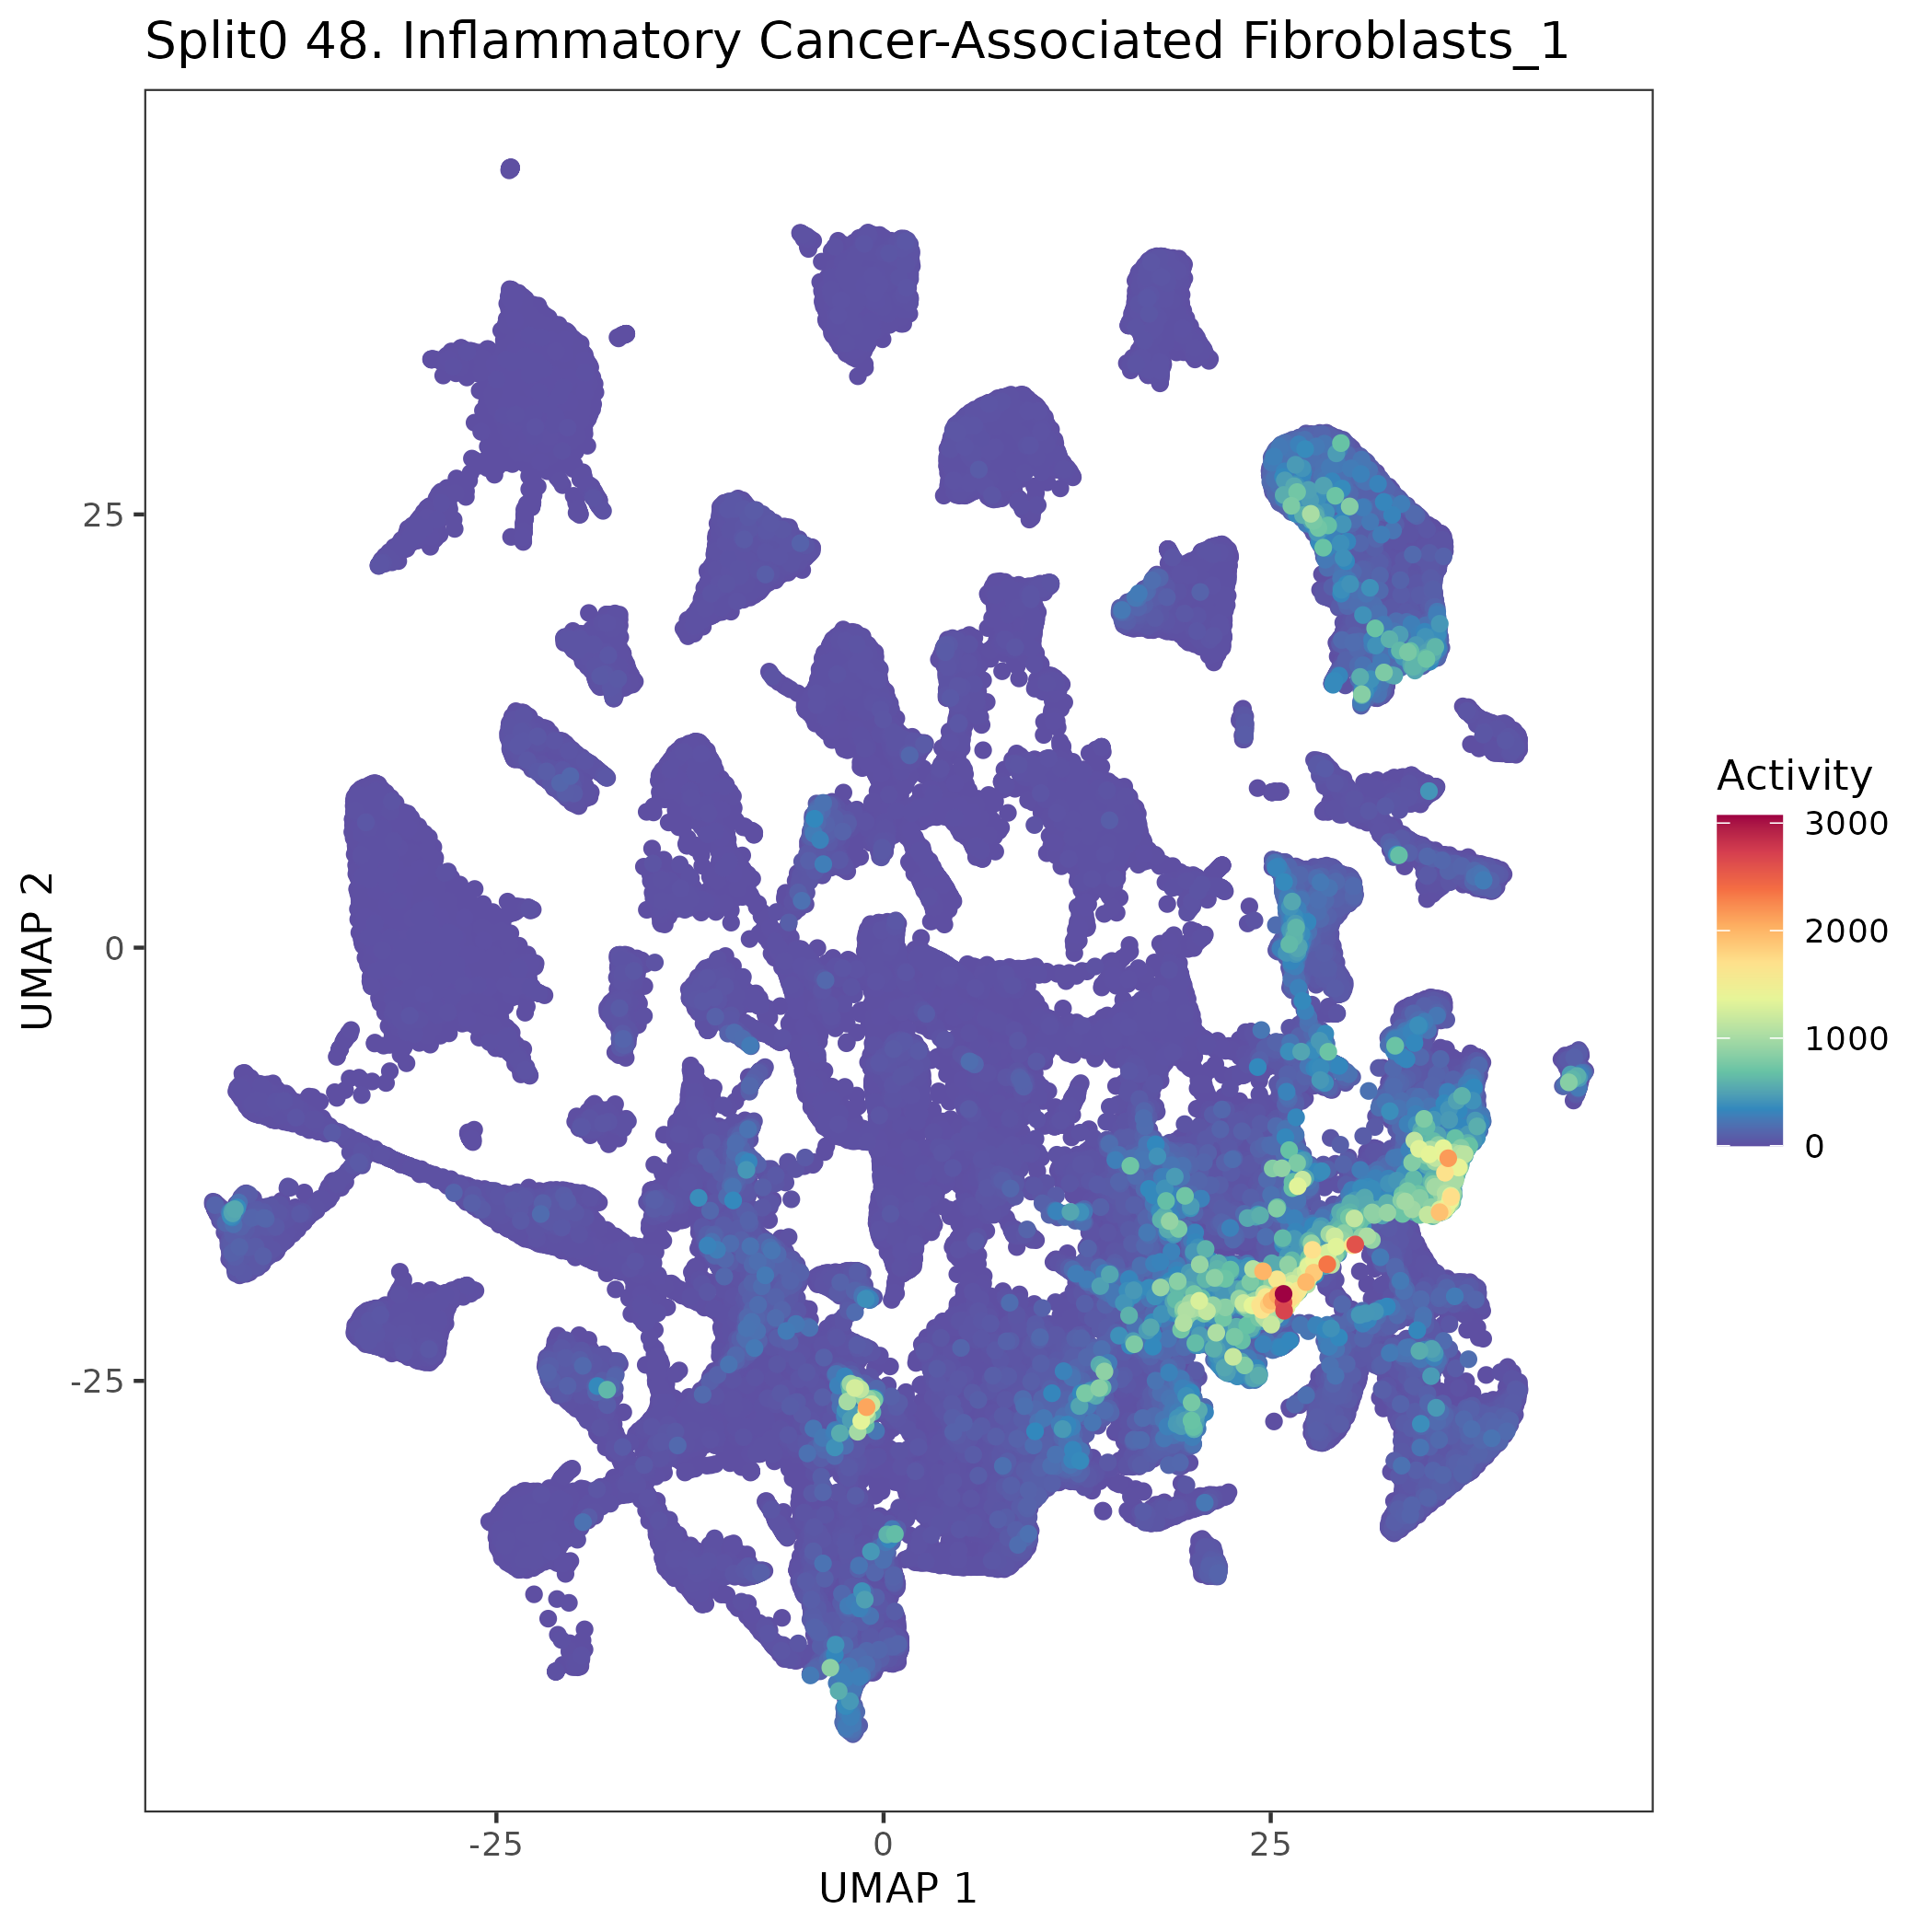
UMAP plots showing activity of gene expression program identified in GEP 48. Inflammatory Cancer-Associated Fibroblasts:
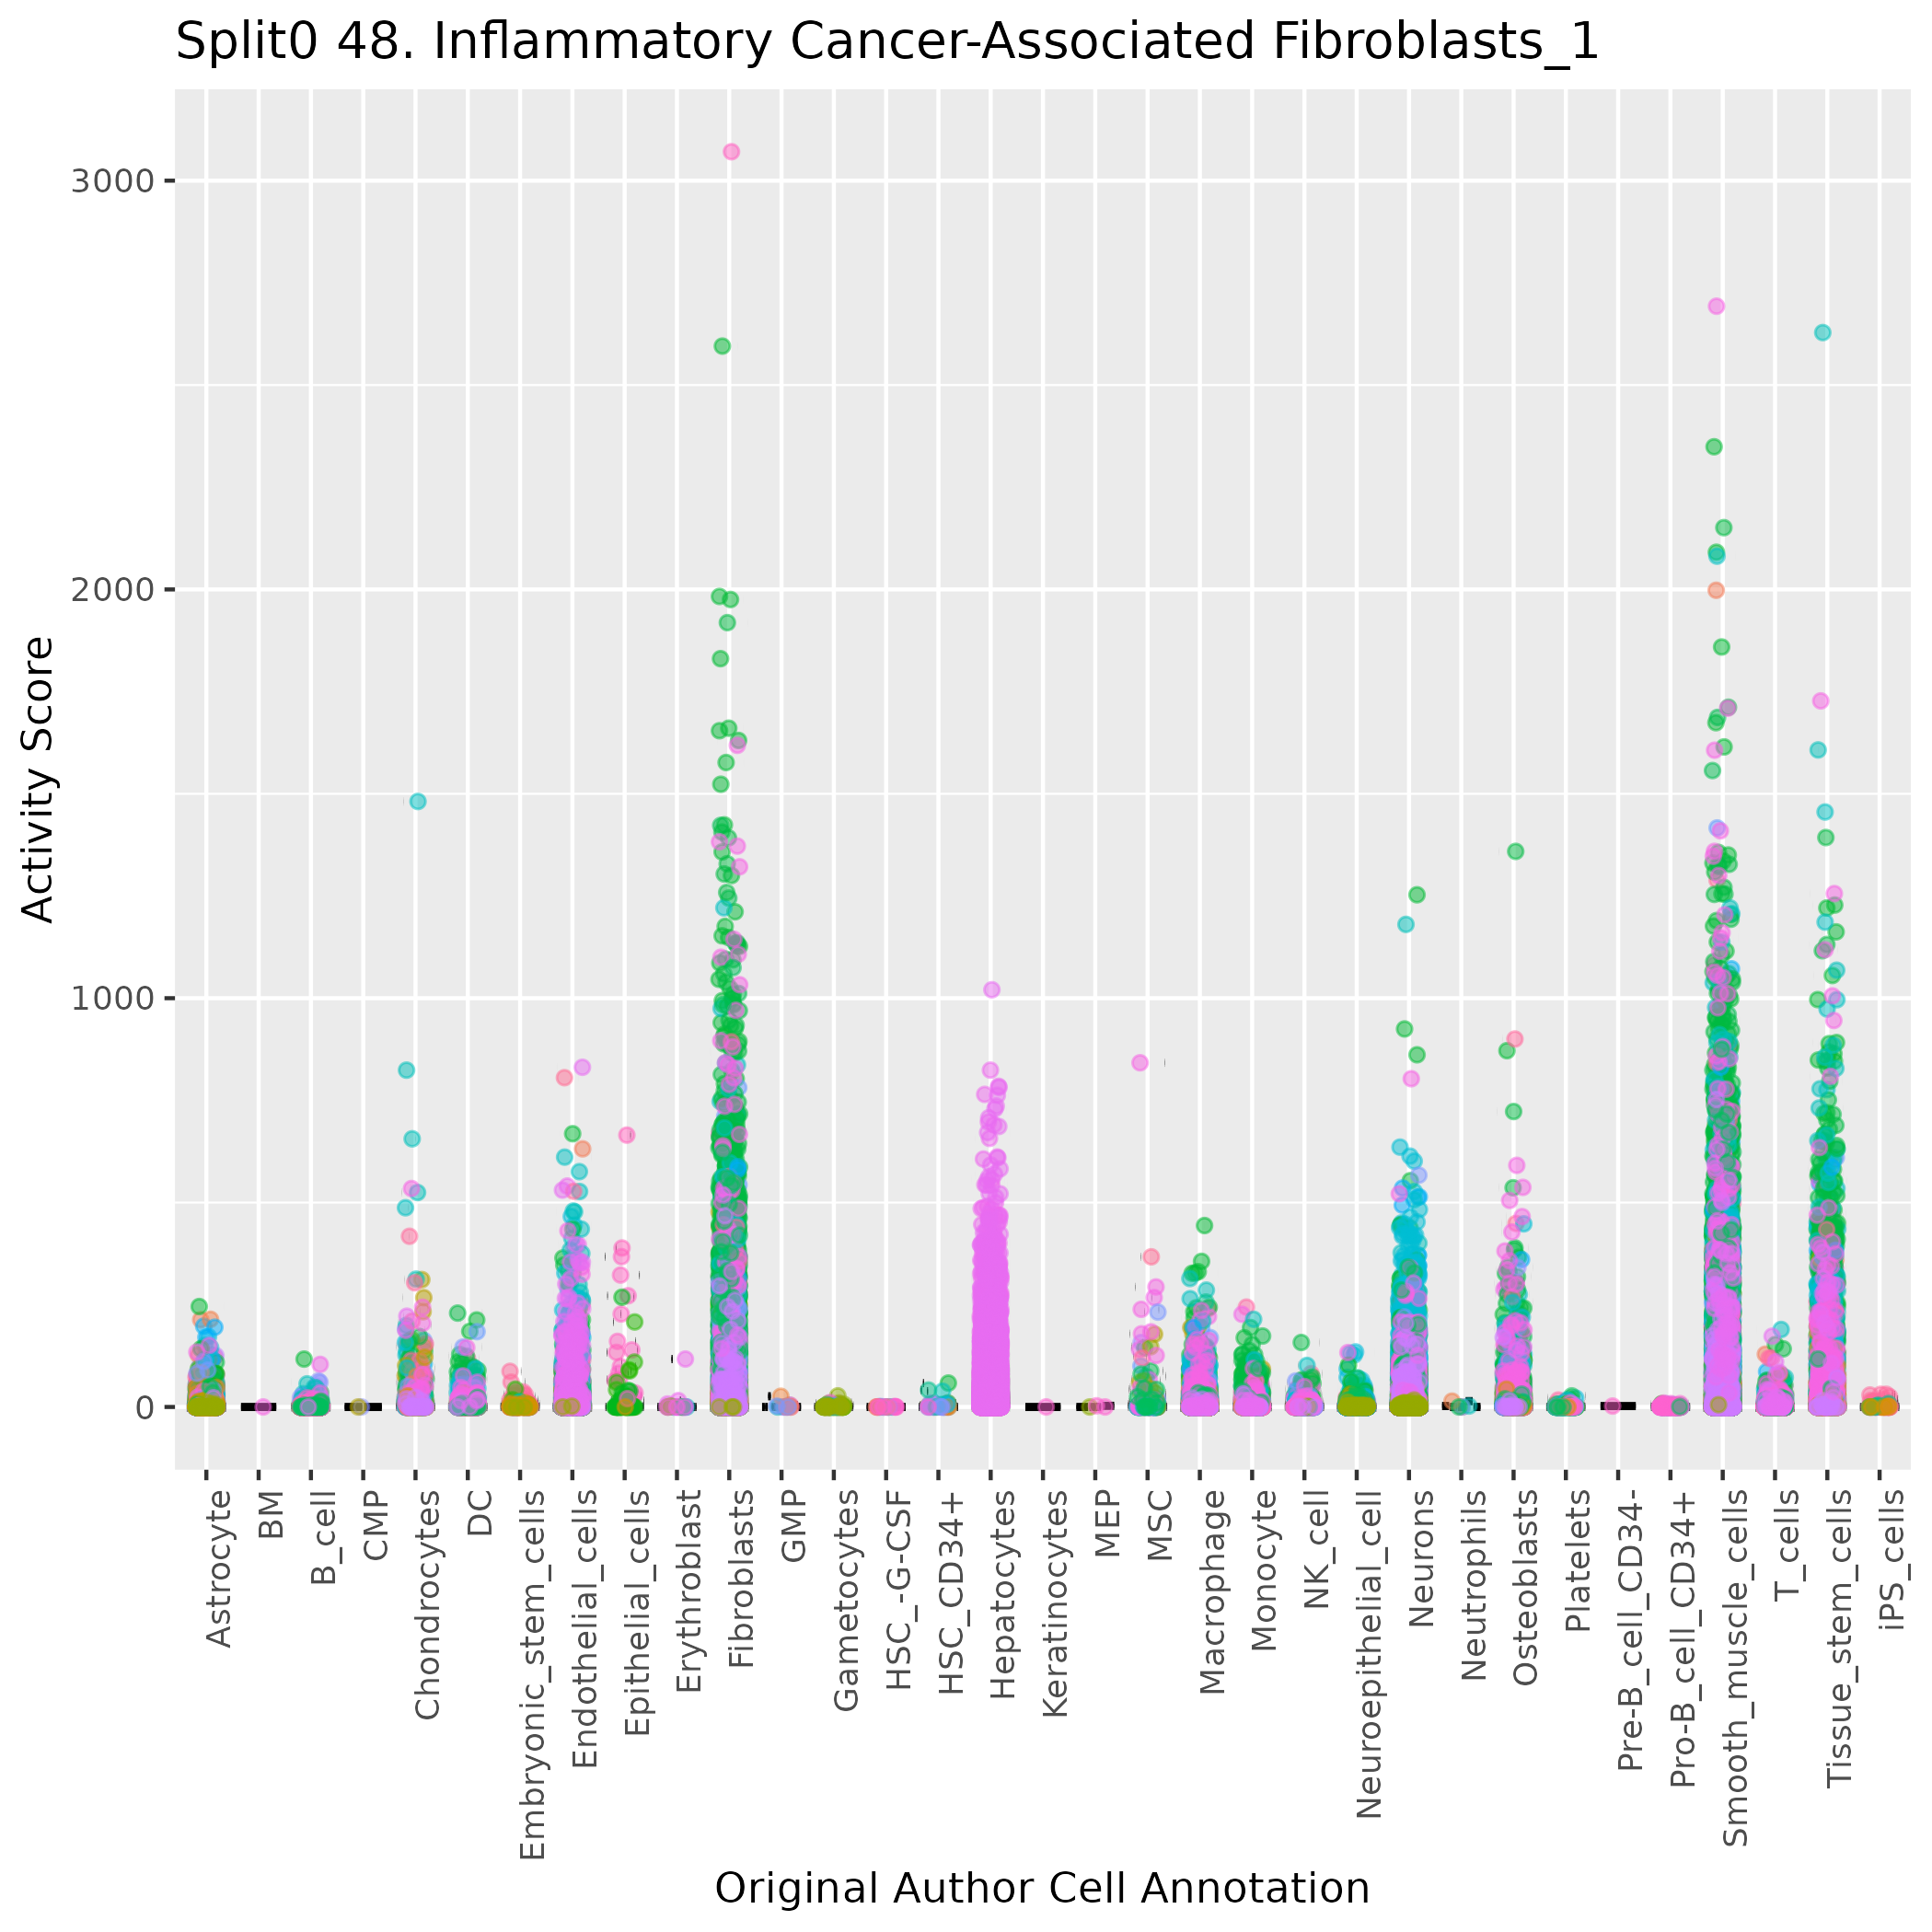
Boxlot showing activity of gene expression program identified in GEP 48. Inflammatory Cancer-Associated Fibroblasts:
Gene set Enrichments for this program, caculated from top 50 genes
mSigDB Cell Types Gene Set:
| P-value | OR | Lower 95% CI | FDR | FWER | Genes Found | Gene Set Size | |
|---|---|---|---|---|---|---|---|
| TRAVAGLINI_LUNG_ADVENTITIAL_FIBROBLAST_CELL | 1.47e-31 | 69.68 | 37.79 | 9.89e-29 | 9.89e-29 | 24LMNA, GFPT2, FOSB, HAS2, EMP1, ESYT2, FGFR1, HAS1, NR4A1, B4GALT1, GPRC5A, FGF7, UAP1, IL1R1, SLC19A2, SVEP1, ABI3BP, MEDAG, FOS, PRRX1, DPYSL3, SPSB1, CCN1, ERRFI1 |
296 |
| TRAVAGLINI_LUNG_LIPOFIBROBLAST_CELL | 2.95e-19 | 60.41 | 29.39 | 9.88e-17 | 1.98e-16 | 14GFPT2, HAS2, ESYT2, HAS1, MMP19, B4GALT1, GPRC5A, FGF7, UAP1, IL1R1, SLC19A2, STAT3, MEDAG, ERRFI1 |
146 |
| CUI_DEVELOPING_HEART_C5_VALVAR_CELL | 6.34e-14 | 33.07 | 15.49 | 7.10e-12 | 4.26e-11 | 12LMNA, MMP19, NR4A1, B4GALT1, NFATC1, UAP1, ADAMTS1, FOS, PRRX1, DPYSL3, THBS1, ERRFI1 |
208 |
| AIZARANI_LIVER_C29_MVECS_2 | 4.30e-16 | 29.53 | 14.81 | 7.21e-14 | 2.88e-13 | 15LMNA, FOSB, EMP1, RFX2, NFATC2, B4GALT1, GPRC5A, NFATC1, TACC1, IL1R1, ABI3BP, ADAMTS1, DPYSL3, MYOF, CCN1 |
313 |
| HAY_BONE_MARROW_STROMAL | 8.41e-18 | 20.00 | 10.79 | 1.88e-15 | 5.65e-15 | 21LMNA, FOSB, HAS2, EMP1, TWIST2, FGFR1, PRICKLE2, MMP19, GPRC5A, FGF7, IL1R1, SVEP1, ABI3BP, ADAMTS1, MEDAG, EGFR, OSMR, PRRX1, DPYSL3, CCN1, ERRFI1 |
765 |
| AIZARANI_LIVER_C21_STELLATE_CELLS_1 | 8.05e-10 | 24.35 | 10.26 | 6.01e-08 | 5.40e-07 | 9CRISPLD2, LMNA, FOSB, EMP1, MMP19, ADAMTS1, FOS, CCN1, THBS1 |
194 |
| LAKE_ADULT_KIDNEY_C17_COLLECTING_SYSTEM_PCS_STRESSED_DISSOC_SUBSET | 2.35e-10 | 22.33 | 9.83 | 1.97e-08 | 1.58e-07 | 10LMNA, FOSB, ESYT2, NR4A1, SLC19A2, STAT3, SIK3, FOS, RAD51B, SIK2 |
240 |
| DESCARTES_FETAL_PANCREAS_MESOTHELIAL_CELLS | 1.33e-06 | 30.81 | 9.28 | 4.46e-05 | 8.92e-04 | 5GFPT2, HAS1, NFATC2, GPRC5A, ADGRD1 |
79 |
| MURARO_PANCREAS_MESENCHYMAL_STROMAL_CELL | 6.79e-15 | 17.46 | 9.17 | 9.11e-13 | 4.56e-12 | 18CRISPLD2, LMNA, GFPT2, HAS2, EMP1, B4GALT1, FGF7, IL1R1, MEDAG, OSMR, SPON1, PRRX1, AXL, MYOF, SPSB1, CCN1, SLC2A3, THBS1 |
680 |
| RUBENSTEIN_SKELETAL_MUSCLE_FBN1_FAP_CELLS | 1.40e-09 | 18.40 | 8.12 | 9.36e-08 | 9.36e-07 | 10LMNA, GFPT2, FGFR1, UAP1, ABI3BP, MEDAG, PRRX1, AXL, MYOF, CCN1 |
289 |
| DESCARTES_MAIN_FETAL_MESOTHELIAL_CELLS | 7.61e-05 | 42.17 | 7.99 | 1.50e-03 | 5.11e-02 | 3GFPT2, HAS1, NFATC2 |
34 |
| BUSSLINGER_ESOPHAGEAL_DENDRITIC_CELLS | 4.08e-08 | 18.98 | 7.60 | 1.96e-06 | 2.74e-05 | 8LMNA, FOSB, NFATC2, NR4A1, TACC1, FOS, AXL, SLC2A3 |
214 |
| AIZARANI_LIVER_C20_LSECS_3 | 2.99e-08 | 15.76 | 6.67 | 1.55e-06 | 2.01e-05 | 9LMNA, EMP1, FGFR1, PRICKLE2, GPRC5A, IL1R1, ADAMTS1, OSMR, SLC2A3 |
295 |
| LAKE_ADULT_KIDNEY_C27_VASCULAR_SMOOTH_MUSCLE_CELLS_AND_PERICYTES | 1.91e-06 | 18.79 | 6.44 | 6.12e-05 | 1.28e-03 | 6FOSB, ESYT2, NR4A1, TACC1, SIK3, FOS |
155 |
| MANNO_MIDBRAIN_NEUROTYPES_HPERIC | 1.73e-11 | 12.41 | 6.37 | 1.66e-09 | 1.16e-08 | 16CRISPLD2, LMNA, FOSB, NR4A1, TACC1, IL1R1, SVEP1, STAT3, ADAMTS1, OSMR, FOS, AXL, MYOF, CCN1, SLC2A3, ADGRD1 |
795 |
| FAN_OVARY_CL1_GPRC5A_TNFRS12A_HIGH_SELECTABLE_FOLLICLE_STROMAL_CELL | 1.83e-08 | 13.88 | 6.14 | 1.02e-06 | 1.23e-05 | 10LMNA, EMP1, FGFR1, GPRC5A, FGF7, UAP1, STAT3, AXL, SPSB1, ERRFI1 |
380 |
| TRAVAGLINI_LUNG_BRONCHIAL_VESSEL_2_CELL | 2.52e-07 | 14.82 | 5.95 | 1.06e-05 | 1.69e-04 | 8LMNA, FOSB, EMP1, NR4A1, UAP1, ADAMTS1, CCN1, SLC2A3 |
272 |
| FAN_OVARY_CL17_PUTATIVE_APOPTOTIC_SMOOTH_MUSCLE_CELL | 1.26e-06 | 14.92 | 5.60 | 4.45e-05 | 8.45e-04 | 7CRISPLD2, LMNA, FGFR1, NR4A1, STAT3, ADAMTS1, AXL |
231 |
| DESCARTES_MAIN_FETAL_IGFBP1_DKK1_POSITIVE_CELLS | 4.24e-06 | 16.28 | 5.59 | 1.29e-04 | 2.84e-03 | 6CRISPLD2, MMP19, ABI3BP, ADAMTS1, SPSB1, ADAMTS15 |
178 |
| LAKE_ADULT_KIDNEY_C28_INTERSTITIUM | 5.56e-05 | 21.76 | 5.56 | 1.24e-03 | 3.73e-02 | 4TACC1, COL4A4, CCN1, THBS1 |
86 |
Dowload full table
mSigDB Hallmark Gene Sets:
| P-value | OR | Lower 95% CI | FDR | FWER | Genes Found | Gene Set Size | |
|---|---|---|---|---|---|---|---|
| HALLMARK_TNFA_SIGNALING_VIA_NFKB | 2.42e-08 | 20.36 | 8.15 | 1.21e-06 | 1.21e-06 | 8GFPT2, FOSB, NR4A1, B4GALT1, FOS, SPSB1, CCN1, SLC2A3 |
200 |
| HALLMARK_HYPOXIA | 8.22e-06 | 14.43 | 4.97 | 2.06e-04 | 4.11e-04 | 6HAS1, EGFR, FOS, CCN1, SLC2A3, ERRFI1 |
200 |
| HALLMARK_EPITHELIAL_MESENCHYMAL_TRANSITION | 1.17e-04 | 11.70 | 3.59 | 1.95e-03 | 5.85e-03 | 5ABI3BP, PRRX1, DPYSL3, CCN1, THBS1 |
200 |
| HALLMARK_IL6_JAK_STAT3_SIGNALING | 1.22e-03 | 15.60 | 3.05 | 9.68e-03 | 6.12e-02 | 3IL1R1, STAT3, OSMR |
87 |
| HALLMARK_ANDROGEN_RESPONSE | 1.82e-03 | 13.51 | 2.64 | 1.14e-02 | 9.11e-02 | 3B4GALT1, UAP1, ADAMTS1 |
100 |
| HALLMARK_ESTROGEN_RESPONSE_EARLY | 1.36e-03 | 9.11 | 2.36 | 9.68e-03 | 6.78e-02 | 4B4GALT1, SLC19A2, FOS, MYOF |
200 |
| HALLMARK_INFLAMMATORY_RESPONSE | 1.36e-03 | 9.11 | 2.36 | 9.68e-03 | 6.78e-02 | 4HAS2, IL1R1, OSMR, AXL |
200 |
| HALLMARK_KRAS_SIGNALING_UP | 1.36e-03 | 9.11 | 2.36 | 9.68e-03 | 6.78e-02 | 4GFPT2, EMP1, SPON1, PRRX1 |
200 |
| HALLMARK_UV_RESPONSE_UP | 6.54e-03 | 8.46 | 1.67 | 3.63e-02 | 3.27e-01 | 3FOSB, NR4A1, FOS |
158 |
| HALLMARK_UV_RESPONSE_DN | 4.73e-02 | 6.02 | 0.70 | 2.36e-01 | 1.00e+00 | 2HAS2, CCN1 |
144 |
| HALLMARK_APOPTOSIS | 5.75e-02 | 5.38 | 0.63 | 2.46e-01 | 1.00e+00 | 2LMNA, EMP1 |
161 |
| HALLMARK_IL2_STAT5_SIGNALING | 8.29e-02 | 4.34 | 0.51 | 2.46e-01 | 1.00e+00 | 2EMP1, SLC2A3 |
199 |
| HALLMARK_ESTROGEN_RESPONSE_LATE | 8.36e-02 | 4.32 | 0.51 | 2.46e-01 | 1.00e+00 | 2FOS, MYOF |
200 |
| HALLMARK_APICAL_JUNCTION | 8.36e-02 | 4.32 | 0.51 | 2.46e-01 | 1.00e+00 | 2B4GALT1, EGFR |
200 |
| HALLMARK_GLYCOLYSIS | 8.36e-02 | 4.32 | 0.51 | 2.46e-01 | 1.00e+00 | 2B4GALT1, EGFR |
200 |
| HALLMARK_P53_PATHWAY | 8.36e-02 | 4.32 | 0.51 | 2.46e-01 | 1.00e+00 | 2SLC19A2, FOS |
200 |
| HALLMARK_ANGIOGENESIS | 8.37e-02 | 11.97 | 0.29 | 2.46e-01 | 1.00e+00 | 1FGFR1 |
36 |
| HALLMARK_APICAL_SURFACE | 1.01e-01 | 9.74 | 0.24 | 2.82e-01 | 1.00e+00 | 1B4GALT1 |
44 |
| HALLMARK_TGF_BETA_SIGNALING | 1.23e-01 | 7.91 | 0.19 | 3.23e-01 | 1.00e+00 | 1THBS1 |
54 |
| HALLMARK_CHOLESTEROL_HOMEOSTASIS | 1.64e-01 | 5.74 | 0.14 | 4.11e-01 | 1.00e+00 | 1ERRFI1 |
74 |
Dowload full table
KEGG Pathways:
| P-value | OR | Lower 95% CI | FDR | FWER | Genes Found | Gene Set Size | |
|---|---|---|---|---|---|---|---|
| KEGG_MAPK_SIGNALING_PATHWAY | 3.26e-06 | 12.86 | 4.83 | 6.05e-04 | 6.05e-04 | 7FGFR1, NFATC2, NR4A1, FGF7, IL1R1, EGFR, FOS |
267 |
| KEGG_MELANOMA | 6.79e-04 | 19.27 | 3.75 | 3.70e-02 | 1.26e-01 | 3FGFR1, FGF7, EGFR |
71 |
| KEGG_B_CELL_RECEPTOR_SIGNALING_PATHWAY | 7.97e-04 | 18.19 | 3.54 | 3.70e-02 | 1.48e-01 | 3NFATC2, NFATC1, FOS |
75 |
| KEGG_PATHWAYS_IN_CANCER | 1.20e-04 | 8.78 | 3.03 | 1.12e-02 | 2.24e-02 | 6FGFR1, FGF7, STAT3, EGFR, FOS, COL4A4 |
325 |
| KEGG_T_CELL_RECEPTOR_SIGNALING_PATHWAY | 2.27e-03 | 12.48 | 2.45 | 8.43e-02 | 4.22e-01 | 3NFATC2, NFATC1, FOS |
108 |
| KEGG_BLADDER_CANCER | 4.66e-03 | 21.38 | 2.43 | 1.19e-01 | 8.67e-01 | 2EGFR, THBS1 |
42 |
| KEGG_AMINO_SUGAR_AND_NUCLEOTIDE_SUGAR_METABOLISM | 5.10e-03 | 20.35 | 2.32 | 1.19e-01 | 9.49e-01 | 2GFPT2, UAP1 |
44 |
| KEGG_AXON_GUIDANCE | 3.74e-03 | 10.40 | 2.04 | 1.16e-01 | 6.95e-01 | 3NFATC2, NFATC1, SEMA4A |
129 |
| KEGG_WNT_SIGNALING_PATHWAY | 5.78e-03 | 8.86 | 1.74 | 1.19e-01 | 1.00e+00 | 3NFATC2, PRICKLE2, NFATC1 |
151 |
| KEGG_PANCREATIC_CANCER | 1.25e-02 | 12.58 | 1.45 | 1.94e-01 | 1.00e+00 | 2STAT3, EGFR |
70 |
| KEGG_ADHERENS_JUNCTION | 1.35e-02 | 12.05 | 1.39 | 1.94e-01 | 1.00e+00 | 2FGFR1, EGFR |
73 |
| KEGG_VEGF_SIGNALING_PATHWAY | 1.46e-02 | 11.56 | 1.34 | 1.94e-01 | 1.00e+00 | 2NFATC2, NFATC1 |
76 |
| KEGG_FOCAL_ADHESION | 1.22e-02 | 6.69 | 1.32 | 1.94e-01 | 1.00e+00 | 3EGFR, COL4A4, THBS1 |
199 |
| KEGG_REGULATION_OF_ACTIN_CYTOSKELETON | 1.46e-02 | 6.24 | 1.23 | 1.94e-01 | 1.00e+00 | 3FGFR1, FGF7, EGFR |
213 |
| KEGG_ECM_RECEPTOR_INTERACTION | 1.76e-02 | 10.43 | 1.21 | 2.18e-01 | 1.00e+00 | 2COL4A4, THBS1 |
84 |
| KEGG_PROSTATE_CANCER | 1.96e-02 | 9.83 | 1.14 | 2.28e-01 | 1.00e+00 | 2FGFR1, EGFR |
89 |
| KEGG_CYTOKINE_CYTOKINE_RECEPTOR_INTERACTION | 2.57e-02 | 5.00 | 0.99 | 2.81e-01 | 1.00e+00 | 3IL1R1, EGFR, OSMR |
265 |
| KEGG_NATURAL_KILLER_CELL_MEDIATED_CYTOTOXICITY | 4.32e-02 | 6.34 | 0.74 | 4.23e-01 | 1.00e+00 | 2NFATC2, NFATC1 |
137 |
| KEGG_GLYCOSAMINOGLYCAN_BIOSYNTHESIS_KERATAN_SULFATE | 3.58e-02 | 29.90 | 0.69 | 3.70e-01 | 1.00e+00 | 1B4GALT1 |
15 |
| KEGG_JAK_STAT_SIGNALING_PATHWAY | 5.38e-02 | 5.59 | 0.65 | 4.95e-01 | 1.00e+00 | 2STAT3, OSMR |
155 |
Dowload full table
CHR Positional Gene Sets:
| P-value | OR | Lower 95% CI | FDR | FWER | Genes Found | Gene Set Size | |
|---|---|---|---|---|---|---|---|
| chr1q22 | 1.25e-02 | 12.58 | 1.45 | 1.00e+00 | 1.00e+00 | 2LMNA, SEMA4A |
70 |
| chr8p11 | 2.22e-02 | 9.20 | 1.07 | 1.00e+00 | 1.00e+00 | 2FGFR1, TACC1 |
95 |
| chr1q24 | 3.56e-02 | 7.07 | 0.82 | 1.00e+00 | 1.00e+00 | 2SLC19A2, PRRX1 |
123 |
| chr12p13 | 4.52e-02 | 3.97 | 0.79 | 1.00e+00 | 1.00e+00 | 3EMP1, GPRC5A, SLC2A3 |
333 |
| chr14q24 | 7.73e-02 | 4.53 | 0.53 | 1.00e+00 | 1.00e+00 | 2FOS, RAD51B |
191 |
| chr11q23 | 8.71e-02 | 4.21 | 0.49 | 1.00e+00 | 1.00e+00 | 2SIK3, SIK2 |
205 |
| chr19q13 | 3.43e-01 | 1.54 | 0.40 | 1.00e+00 | 1.00e+00 | 4FOSB, HAS1, ERCC1, AXL |
1165 |
| chr18q23 | 9.04e-02 | 11.03 | 0.27 | 1.00e+00 | 1.00e+00 | 1NFATC1 |
39 |
| chr12q13 | 2.53e-01 | 2.11 | 0.25 | 1.00e+00 | 1.00e+00 | 2MMP19, NR4A1 |
407 |
| chr3q12 | 1.06e-01 | 9.31 | 0.23 | 1.00e+00 | 1.00e+00 | 1ABI3BP |
46 |
| chr15q14 | 1.27e-01 | 7.62 | 0.19 | 1.00e+00 | 1.00e+00 | 1THBS1 |
56 |
| chr1p36 | 6.68e-01 | 1.31 | 0.15 | 1.00e+00 | 1.00e+00 | 2SPSB1, ERRFI1 |
656 |
| chr2q36 | 1.80e-01 | 5.17 | 0.13 | 1.00e+00 | 1.00e+00 | 1COL4A4 |
82 |
| chr7p11 | 1.80e-01 | 5.17 | 0.13 | 1.00e+00 | 1.00e+00 | 1EGFR |
82 |
| chr14q22 | 1.96e-01 | 4.71 | 0.12 | 1.00e+00 | 1.00e+00 | 1SAMD4A |
90 |
| chr21q21 | 2.51e-01 | 3.55 | 0.09 | 1.00e+00 | 1.00e+00 | 1ADAMTS1 |
119 |
| chr3p14 | 2.56e-01 | 3.46 | 0.09 | 1.00e+00 | 1.00e+00 | 1PRICKLE2 |
122 |
| chr5p13 | 2.67e-01 | 3.30 | 0.08 | 1.00e+00 | 1.00e+00 | 1OSMR |
128 |
| chr9q31 | 2.67e-01 | 3.30 | 0.08 | 1.00e+00 | 1.00e+00 | 1SVEP1 |
128 |
| chr1p22 | 2.69e-01 | 3.27 | 0.08 | 1.00e+00 | 1.00e+00 | 1CCN1 |
129 |
Dowload full table
Transcription Factor Targets:
| P-value | OR | Lower 95% CI | FDR | FWER | Genes Found | Gene Set Size | |
|---|---|---|---|---|---|---|---|
| SRF_01 | 2.57e-04 | 27.29 | 5.25 | 2.36e-02 | 2.91e-01 | 3FOSB, FOS, THBS1 |
51 |
| SRF_C | 1.24e-05 | 13.39 | 4.61 | 7.00e-03 | 1.40e-02 | 6GFPT2, FOSB, NR4A1, FOS, CCN1, THBS1 |
215 |
| PSMB5_TARGET_GENES | 8.03e-06 | 11.14 | 4.20 | 7.00e-03 | 9.10e-03 | 7LMNA, EMP1, UAP1, ADAMTS1, CCN1, SLC2A3, THBS1 |
307 |
| HTF_01 | 6.79e-04 | 19.27 | 3.75 | 3.50e-02 | 7.70e-01 | 3STAT3, PRRX1, SIK2 |
71 |
| ZNF26_TARGET_GENES | 2.24e-03 | 31.65 | 3.55 | 8.15e-02 | 1.00e+00 | 2UAP1, OSMR |
29 |
| FOXD3_01 | 1.22e-04 | 11.58 | 3.55 | 2.36e-02 | 1.39e-01 | 5HAS2, PRICKLE2, NR4A1, CCN1, ERRFI1 |
202 |
| HMEF2_Q6 | 3.71e-04 | 13.03 | 3.36 | 2.63e-02 | 4.20e-01 | 4HAS2, PRICKLE2, NR4A1, FOS |
141 |
| NR0B1_TARGET_GENES | 2.36e-04 | 10.01 | 3.07 | 2.36e-02 | 2.68e-01 | 5NR4A1, GPRC5A, NFATC1, OSMR, SIK2 |
233 |
| RTTTNNNYTGGM_UNKNOWN | 5.29e-04 | 11.82 | 3.05 | 3.00e-02 | 5.99e-01 | 4HAS2, NFATC2, NFATC1, EGFR |
155 |
| CCAWWNAAGG_SRF_Q4 | 1.26e-03 | 15.41 | 3.01 | 5.97e-02 | 1.00e+00 | 3FOSB, NR4A1, THBS1 |
88 |
| ZNF239_TARGET_GENES | 3.83e-03 | 23.75 | 2.70 | 8.15e-02 | 1.00e+00 | 2ERCC1, CCN1 |
38 |
| CTAWWWATA_RSRFC4_Q2 | 2.27e-04 | 7.78 | 2.69 | 2.36e-02 | 2.57e-01 | 6NR4A1, NFATC1, SIK3, PRRX1, DPYSL3, ADGRD1 |
366 |
| ATF_01 | 4.39e-04 | 8.71 | 2.68 | 2.71e-02 | 4.97e-01 | 5FOSB, NFATC1, FOS, CCN1, SIK2 |
267 |
| NKX25_02 | 4.39e-04 | 8.71 | 2.68 | 2.71e-02 | 4.97e-01 | 5HAS2, FGF7, STAT3, SIK3, PRRX1 |
267 |
| TAZ_TARGET_GENES | 1.31e-04 | 7.07 | 2.67 | 2.36e-02 | 1.48e-01 | 7LMNA, RFX2, MMP19, NR4A1, SAMD4A, AXL, THBS1 |
480 |
| CREB_Q2 | 4.54e-04 | 8.64 | 2.66 | 2.71e-02 | 5.14e-01 | 5FOSB, NFATC1, STAT3, FOS, SIK2 |
269 |
| IGLV5_37_TARGET_GENES | 1.10e-04 | 6.23 | 2.52 | 2.36e-02 | 1.25e-01 | 8LMNA, FGFR1, PRICKLE2, NFATC1, ADAMTS1, EGFR, OSMR, MYOF |
636 |
| HNF3_Q6 | 1.17e-03 | 9.50 | 2.46 | 5.75e-02 | 1.00e+00 | 4FOSB, NR4A1, CCN1, ERRFI1 |
192 |
| TGAYRTCA_ATF3_Q6 | 2.91e-04 | 6.17 | 2.33 | 2.36e-02 | 3.30e-01 | 7HAS1, PRICKLE2, NFATC1, STAT3, ABI3BP, EGFR, FOS |
549 |
| CTTTAAR_UNKNOWN | 7.86e-05 | 5.22 | 2.32 | 2.36e-02 | 8.91e-02 | 10LMNA, HAS2, EMP1, B4GALT1, SIK3, PRRX1, AXL, CCN1, ADGRD1, ERRFI1 |
994 |
Dowload full table
GO Biological Processes:
| P-value | OR | Lower 95% CI | FDR | FWER | Genes Found | Gene Set Size | |
|---|---|---|---|---|---|---|---|
| GOBP_OVULATION_FROM_OVARIAN_FOLLICLE | 8.61e-05 | 211.61 | 18.81 | 2.30e-02 | 6.44e-01 | 2MMP19, ADAMTS1 |
6 |
| GOBP_NEGATIVE_REGULATION_OF_CARDIAC_MUSCLE_ADAPTATION | 1.60e-04 | 141.92 | 13.68 | 3.75e-02 | 1.00e+00 | 2LMNA, ERRFI1 |
8 |
| GOBP_RESPONSE_TO_PLATELET_DERIVED_GROWTH_FACTOR | 1.73e-05 | 72.60 | 13.27 | 6.48e-03 | 1.30e-01 | 3HAS2, HAS1, ERRFI1 |
21 |
| GOBP_REGULATION_OF_NITRIC_OXIDE_MEDIATED_SIGNAL_TRANSDUCTION | 2.06e-04 | 121.74 | 12.04 | 4.27e-02 | 1.00e+00 | 2EGFR, THBS1 |
9 |
| GOBP_OVULATION_CYCLE | 3.95e-07 | 39.98 | 11.95 | 4.23e-04 | 2.96e-03 | 5HAS2, MMP19, ADAMTS1, EGFR, AXL |
62 |
| GOBP_UDP_N_ACETYLGLUCOSAMINE_BIOSYNTHETIC_PROCESS | 3.13e-04 | 94.83 | 9.72 | 5.72e-02 | 1.00e+00 | 2GFPT2, UAP1 |
11 |
| GOBP_REGULATION_OF_TYPE_B_PANCREATIC_CELL_PROLIFERATION | 3.75e-04 | 85.24 | 8.86 | 6.52e-02 | 1.00e+00 | 2NR4A1, ERRFI1 |
12 |
| GOBP_ENDOTHELIAL_CELL_CHEMOTAXIS | 6.33e-05 | 45.10 | 8.51 | 1.76e-02 | 4.74e-01 | 3FGFR1, NR4A1, THBS1 |
32 |
| GOBP_NEGATIVE_REGULATION_OF_MUSCLE_ADAPTATION | 4.43e-04 | 77.52 | 8.14 | 6.52e-02 | 1.00e+00 | 2LMNA, ERRFI1 |
13 |
| GOBP_AMINO_SUGAR_BIOSYNTHETIC_PROCESS | 4.43e-04 | 77.52 | 8.14 | 6.52e-02 | 1.00e+00 | 2GFPT2, UAP1 |
13 |
| GOBP_NEGATIVE_REGULATION_OF_VASCULAR_ASSOCIATED_SMOOTH_MUSCLE_CELL_DIFFERENTIATION | 4.43e-04 | 77.52 | 8.14 | 6.52e-02 | 1.00e+00 | 2NFATC2, NFATC1 |
13 |
| GOBP_NEGATIVE_REGULATION_OF_EPIDERMAL_GROWTH_FACTOR_ACTIVATED_RECEPTOR_ACTIVITY | 5.16e-04 | 71.02 | 7.54 | 6.77e-02 | 1.00e+00 | 2GPRC5A, ERRFI1 |
14 |
| GOBP_HYALURONAN_BIOSYNTHETIC_PROCESS | 5.16e-04 | 71.02 | 7.54 | 6.77e-02 | 1.00e+00 | 2HAS2, HAS1 |
14 |
| GOBP_REGULATION_OF_KERATINOCYTE_MIGRATION | 5.16e-04 | 71.02 | 7.54 | 6.77e-02 | 1.00e+00 | 2HAS2, FGF7 |
14 |
| GOBP_POSITIVE_REGULATION_OF_KERATINOCYTE_PROLIFERATION | 5.94e-04 | 65.66 | 7.01 | 7.53e-02 | 1.00e+00 | 2HAS2, FGF7 |
15 |
| GOBP_UDP_N_ACETYLGLUCOSAMINE_METABOLIC_PROCESS | 6.78e-04 | 60.98 | 6.55 | 7.68e-02 | 1.00e+00 | 2GFPT2, UAP1 |
16 |
| GOBP_OVULATION | 6.78e-04 | 60.98 | 6.55 | 7.68e-02 | 1.00e+00 | 2MMP19, ADAMTS1 |
16 |
| GOBP_REGULATION_OF_CARDIAC_MUSCLE_ADAPTATION | 7.67e-04 | 56.94 | 6.15 | 8.44e-02 | 1.00e+00 | 2LMNA, ERRFI1 |
17 |
| GOBP_RESPONSE_TO_PROGESTERONE | 1.77e-04 | 31.17 | 5.97 | 3.89e-02 | 1.00e+00 | 3FOSB, FOS, THBS1 |
45 |
| GOBP_EXTERNAL_ENCAPSULATING_STRUCTURE_ORGANIZATION | 2.68e-08 | 13.31 | 5.89 | 1.00e-04 | 2.01e-04 | 10CRISPLD2, HAS2, HAS1, MMP19, B4GALT1, ADAMTS1, COL4A4, CCN1, ADAMTS15, THBS1 |
396 |
Dowload full table
Immunological Gene Sets:
| P-value | OR | Lower 95% CI | FDR | FWER | Genes Found | Gene Set Size | |
|---|---|---|---|---|---|---|---|
| GSE37605_FOXP3_FUSION_GFP_VS_IRES_GFP_TREG_C57BL6_UP | 2.87e-07 | 18.77 | 7.03 | 7.85e-04 | 1.40e-03 | 7FOSB, NR4A1, SVEP1, ADAMTS1, EGFR, FOS, THBS1 |
185 |
| GSE45365_NK_CELL_VS_CD11B_DC_DN | 4.68e-07 | 17.41 | 6.52 | 7.85e-04 | 2.28e-03 | 7TWIST2, HAS1, GPRC5A, UAP1, OSMR, FOS, SLC2A3 |
199 |
| GSE12392_IFNAR_KO_VS_IFNB_KO_CD8_NEG_SPLEEN_DC_DN | 4.84e-07 | 17.32 | 6.49 | 7.85e-04 | 2.36e-03 | 7LMNA, FOSB, EMP1, NR4A1, ADAMTS1, THBS1, ERRFI1 |
200 |
| GSE9988_ANTI_TREM1_VS_CTRL_TREATED_MONOCYTES_UP | 7.77e-06 | 14.58 | 5.02 | 5.01e-03 | 3.78e-02 | 6ESYT2, MMP19, NR4A1, GPRC5A, IL1R1, SLC2A3 |
198 |
| GSE45365_NK_CELL_VS_BCELL_UP | 7.77e-06 | 14.58 | 5.02 | 5.01e-03 | 3.78e-02 | 6FOSB, ESYT2, HAS1, FOS, CCN1, THBS1 |
198 |
| GSE4748_CTRL_VS_LPS_STIM_DC_3H_UP | 8.22e-06 | 14.43 | 4.97 | 5.01e-03 | 4.01e-02 | 6HAS2, EMP1, ADAMTS1, DPYSL3, CCN1, ERRFI1 |
200 |
| GSE22196_HEALTHY_VS_OBESE_MOUSE_SKIN_GAMMADELTA_TCELL_DN | 8.22e-06 | 14.43 | 4.97 | 5.01e-03 | 4.01e-02 | 6LMNA, FOSB, EMP1, UAP1, DPYSL3, THBS1 |
200 |
| GSE22935_WT_VS_MYD88_KO_MACROPHAGE_12H_MBOVIS_BCG_STIM_UP | 8.22e-06 | 14.43 | 4.97 | 5.01e-03 | 4.01e-02 | 6HAS1, NR4A1, ADAMTS1, MEDAG, SPSB1, THBS1 |
200 |
| GSE37605_TREG_VS_TCONV_NOD_FOXP3_FUSION_GFP_UP | 3.02e-05 | 15.73 | 4.80 | 1.63e-02 | 1.47e-01 | 5FOSB, NR4A1, ADAMTS1, FOS, ADAMTS15 |
150 |
| GSE9988_ANTI_TREM1_VS_VEHICLE_TREATED_MONOCYTES_UP | 1.01e-04 | 12.07 | 3.70 | 1.84e-02 | 4.94e-01 | 5ESYT2, MMP19, GPRC5A, UAP1, IL1R1 |
194 |
| GSE9988_ANTI_TREM1_AND_LPS_VS_CTRL_TREATED_MONOCYTES_UP | 1.01e-04 | 12.07 | 3.70 | 1.84e-02 | 4.94e-01 | 5NR4A1, GPRC5A, SLC19A2, SLC2A3, ERRFI1 |
194 |
| GSE29617_CTRL_VS_DAY7_TIV_FLU_VACCINE_PBMC_2008_UP | 1.06e-04 | 11.94 | 3.66 | 1.84e-02 | 5.19e-01 | 5FOSB, NR4A1, TACC1, FOS, SLC2A3 |
196 |
| GSE20152_HTNFA_OVERXPRESS_ANKLE_VS_CTRL_SPHK1_KO_ANKLE_UP | 1.06e-04 | 11.94 | 3.66 | 1.84e-02 | 5.19e-01 | 5B4GALT1, GPRC5A, FGF7, SVEP1, OSMR |
196 |
| GSE2128_C57BL6_VS_NOD_CD4CD8_DP_THYMOCYTE_UP | 1.09e-04 | 11.88 | 3.64 | 1.84e-02 | 5.31e-01 | 5EMP1, ERCC1, SLC19A2, SLC2A3, ERRFI1 |
197 |
| GSE23321_EFFECTOR_MEMORY_VS_NAIVE_CD8_TCELL_DN | 1.09e-04 | 11.88 | 3.64 | 1.84e-02 | 5.31e-01 | 5LMNA, NFATC1, UAP1, SLC19A2, FOS |
197 |
| GSE1460_DP_THYMOCYTE_VS_NAIVE_CD4_TCELL_CORD_BLOOD_DN | 1.12e-04 | 11.82 | 3.62 | 1.84e-02 | 5.44e-01 | 5EMP1, RFX2, B4GALT1, SIK3, SIK2 |
198 |
| GSE15930_NAIVE_VS_48H_IN_VITRO_STIM_IFNAB_CD8_TCELL_UP | 1.12e-04 | 11.82 | 3.62 | 1.84e-02 | 5.44e-01 | 5RFX2, B4GALT1, FGF7, SEMA4A, FOS |
198 |
| GSE21546_UNSTIM_VS_ANTI_CD3_STIM_SAP1A_KO_DP_THYMOCYTES_UP | 1.12e-04 | 11.82 | 3.62 | 1.84e-02 | 5.44e-01 | 5GPRC5A, ABI3BP, CCN1, ADAMTS15, ADGRD1 |
198 |
| GSE5455_HEALTHY_VS_TUMOR_BEARING_MOUSE_SPLEEN_MONOCYTE_DN | 1.14e-04 | 11.76 | 3.60 | 1.84e-02 | 5.57e-01 | 5LMNA, EMP1, SPON1, AXL, SLC2A3 |
199 |
| GSE5589_WT_VS_IL6_KO_LPS_AND_IL6_STIM_MACROPHAGE_45MIN_DN | 1.14e-04 | 11.76 | 3.60 | 1.84e-02 | 5.57e-01 | 5FGFR1, PRICKLE2, FGF7, SAMD4A, OSMR |
199 |
Top Ranked Transcription Factors for this Gene Expression Program:
| Gene Symbol | Gene Loading Rank | DNA Binding Domain | Motif Status | IUPAC PWM | GTEx | DepMap | Decartes |
|---|---|---|---|---|---|---|---|
| FOSB | 4 | Yes | Known motif | Monomer or homomultimer | High-throughput in vitro | None | None |
| TWIST2 | 7 | Yes | Known motif | Monomer or homomultimer | 100 perc ID - in vitro | None | None |
| RFX2 | 9 | Yes | Known motif | Monomer or homomultimer | High-throughput in vitro | None | None |
| NFATC2 | 12 | Yes | Known motif | Monomer or homomultimer | High-throughput in vitro | None | PDB:1A02 has NFAT, Fos and Jun trimeric complex with non-consensus bZIP target site |
| NR4A1 | 15 | Yes | Known motif | Monomer or homomultimer | High-throughput in vitro | None | None |
| NFATC1 | 19 | Yes | Known motif | Monomer or homomultimer | High-throughput in vitro | None | None |
| SEMA4A | 24 | No | Unlikely to be sequence specific TF | Not a DNA binding protein | No motif | None | None |
| STAT3 | 28 | Yes | Known motif | Monomer or homomultimer | In vivo/Misc source | None | None |
| FOS | 35 | Yes | Known motif | Monomer or homomultimer | High-throughput in vitro | None | None |
| PRRX1 | 37 | Yes | Known motif | Monomer or homomultimer | High-throughput in vitro | None | None |
| TSC22D2 | 51 | No | Unlikely to be sequence specific TF | Not a DNA binding protein | No motif | None | There is some evidence that a related protein (TSC22D1) binds DNA specifically - thus, it is possible this is also a TF. |
| EGR1 | 53 | Yes | Known motif | Monomer or homomultimer | High-throughput in vitro | None | None |
| ZFP36 | 58 | No | ssDNA/RNA binding | Not a DNA binding protein | No motif | None | RNA binding protein (PMID: 10330172). |
| NR4A3 | 60 | Yes | Known motif | Monomer or homomultimer | In vivo/Misc source | Only known motifs are from Transfac or HocoMoco - origin is uncertain | None |
| MAFF | 65 | Yes | Known motif | Monomer or homomultimer | High-throughput in vitro | None | None |
| IL6 | 67 | No | Unlikely to be sequence specific TF | Not a DNA binding protein | No motif | None | None |
| JUNB | 73 | Yes | Known motif | Monomer or homomultimer | High-throughput in vitro | None | Prefers forming heterodimers with FOS; FOSB; FOSL1 and FOSL2 over homodimers (PMID:12805554); but, clearly can bind DNA specifically in vitro. |
| KLF9 | 75 | Yes | Known motif | Monomer or homomultimer | 100 perc ID - in vitro | None | None |
| ZBTB16 | 80 | Yes | Known motif | Monomer or homomultimer | In vivo/Misc source | Only known motifs are from Transfac or HocoMoco - origin is uncertain | None |
| PER1 | 81 | No | Unlikely to be sequence specific TF | Not a DNA binding protein | No motif | None | Protein that associates with CLOCK-ARNTL heterodimers to silence the expression of their target genes (PMID: 16987893) |
Druggable Genes for this Gene Expression Program:
| Gene Symbol | Gene Loading Rank | Drug Names | Drug Category | GTEx | DepMap |
|---|---|---|---|---|---|
| FGFR1 | 10 | 3REGORAFENIB, PAZOPANIB, NINTEDANIB |
Small molecule | GTEx | DepMap |
| EGFR | 33 | 6ERLOTINIB, AFATINIB, OSIMERTINIB, LAPATINIB, VANDETANIB, GEFITINIB |
Small molecule | GTEx | DepMap |
| EGFR | 33 | 3PANITUMUMAB, NECITUMUMAB, CETUXIMAB |
Antibody | GTEx | DepMap |
| AXL | 38 | 2R428, BGB324 |
Small molecule | GTEx | DepMap |
| TUBB6 | 57 | 9VINORELBINE BASE, VINCRISTINE, ERIBULIN, CABAZITAXEL, IXABEPILONE, DOCETAXEL, COLCHICINE, PACLITAXEL, VINBLASTINE |
Small molecule | GTEx | DepMap |
| TUBB6 | 57 | 2BRENTUXIMAB VEDOTIN, TRASTUZUMAB EMTANSINE |
Antibody | GTEx | DepMap |
| IL6 | 67 | 1SILTUXIMAB |
Antibody | GTEx | DepMap |
| CDK17 | 105 | 2Roniciclib, AT-7519 |
Small molecule | GTEx | DepMap |
| MCL1 | 108 | 1AMG176 |
Small molecule | GTEx | DepMap |
| EPHA3 | 111 | 1VANDETANIB |
Small molecule | GTEx | DepMap |
| NTRK2 | 144 | 5AZD-6918, PLX-7486, CEP-2563, LOXO-101, AZD-7451 |
Small molecule | GTEx | DepMap |
| ABL1 | 151 | 6IMATINIB, REGORAFENIB, NILOTINIB, PONATINIB, BOSUTINIB, DASATINIB |
Small molecule | GTEx | DepMap |
| MAPKAPK2 | 173 | 1AT-13148 |
Small molecule | GTEx | DepMap |
| PDE3A | 180 | 9THEOPHYLLINE SODIUM GLYCINATE, ANAGRELIDE, PENTOXIFYLLINE, THEOPHYLLINE, DYPHYLLINE, INAMRINONE, MILRINONE, CILOSTAZOL, DIPYRIDAMOLE |
Small molecule | GTEx | DepMap |
| IL4R | 243 | 1DUPILUMAB |
Antibody | GTEx | DepMap |
| CDK14 | 291 | 2Roniciclib, AT-7519 |
Small molecule | GTEx | DepMap |
| HDAC4 | 311 | 3ROMIDEPSIN, PANOBINOSTAT, BELINOSTAT |
Small molecule | GTEx | DepMap |
| TOP1 | 319 | 1IRINOTECAN |
Small molecule | GTEx | DepMap |
| VEGFA | 357 | 2RANIBIZUMAB, BEVACIZUMAB |
Antibody | GTEx | DepMap |
| PPARD | 377 | 1MBX-8025 |
Small molecule | GTEx | DepMap |
| ESR1 | 397 | 23DIETHYLSTILBESTROL DIPHOSPHATE, TAMOXIFEN, TOREMIFENE, ESTRADIOL ACETATE, ESTROGENS, ESTERIFIED, SYNTHETIC CONJUGATED ESTROGENS, B, ESTROGENS, CONJUGATED, ESTROGENS, CONJUGATED SYNTHETIC A, BAZEDOXIFENE, CLOMIPHENE CITRATE, OSPEMIFENE, ESTRONE SULFURIC ACID, ESTRADIOL CYPIONATE, POLYESTRADIOL PHOSPHATE, MESTRANOL, QUINESTROL, ETHINYL ESTRADIOL, ESTRADIOL, DIETHYLSTILBESTROL, FULVESTRANT, ESTRADIOL VALERATE, ESTRONE, DIENESTROL |
Small molecule | GTEx | DepMap |
| JAK1 | 427 | 2RUXOLITINIB, TOFACITINIB |
Small molecule | GTEx | DepMap |
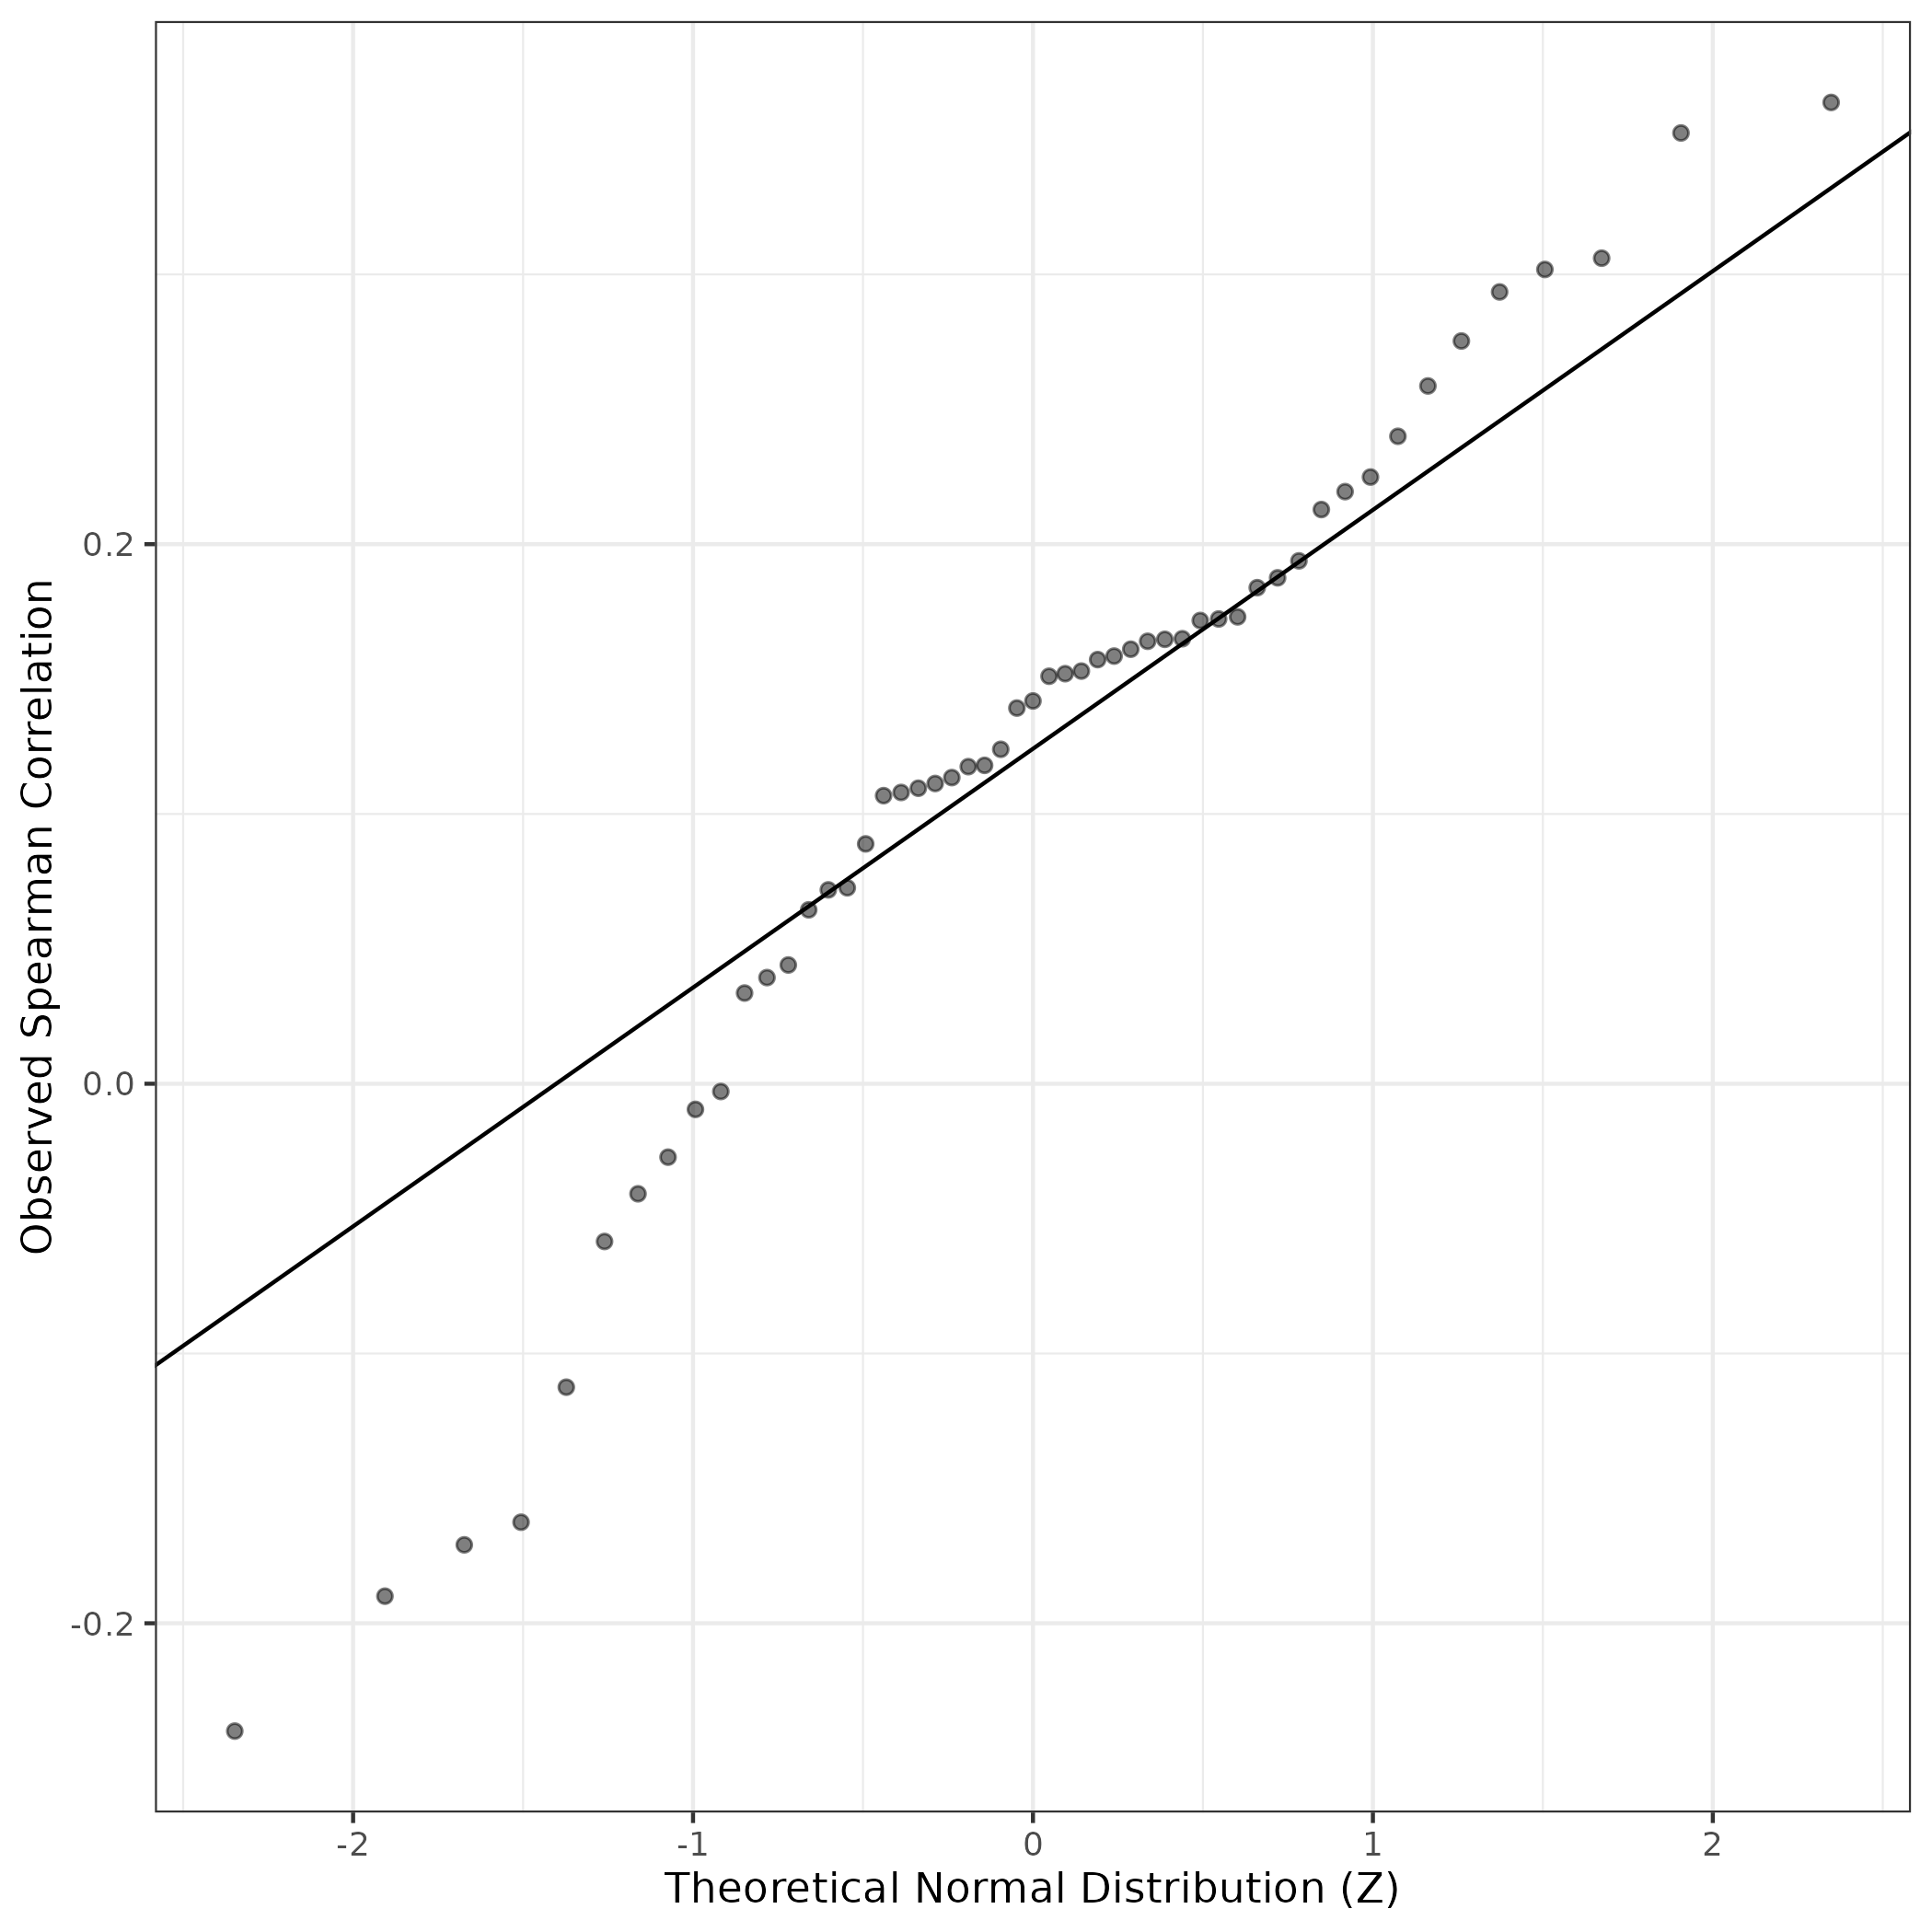
QQ Plot showing correlations with other GEPs in this dataset, calculated by Spearman correlation:
Interactive QQ-plot of gene loadings:
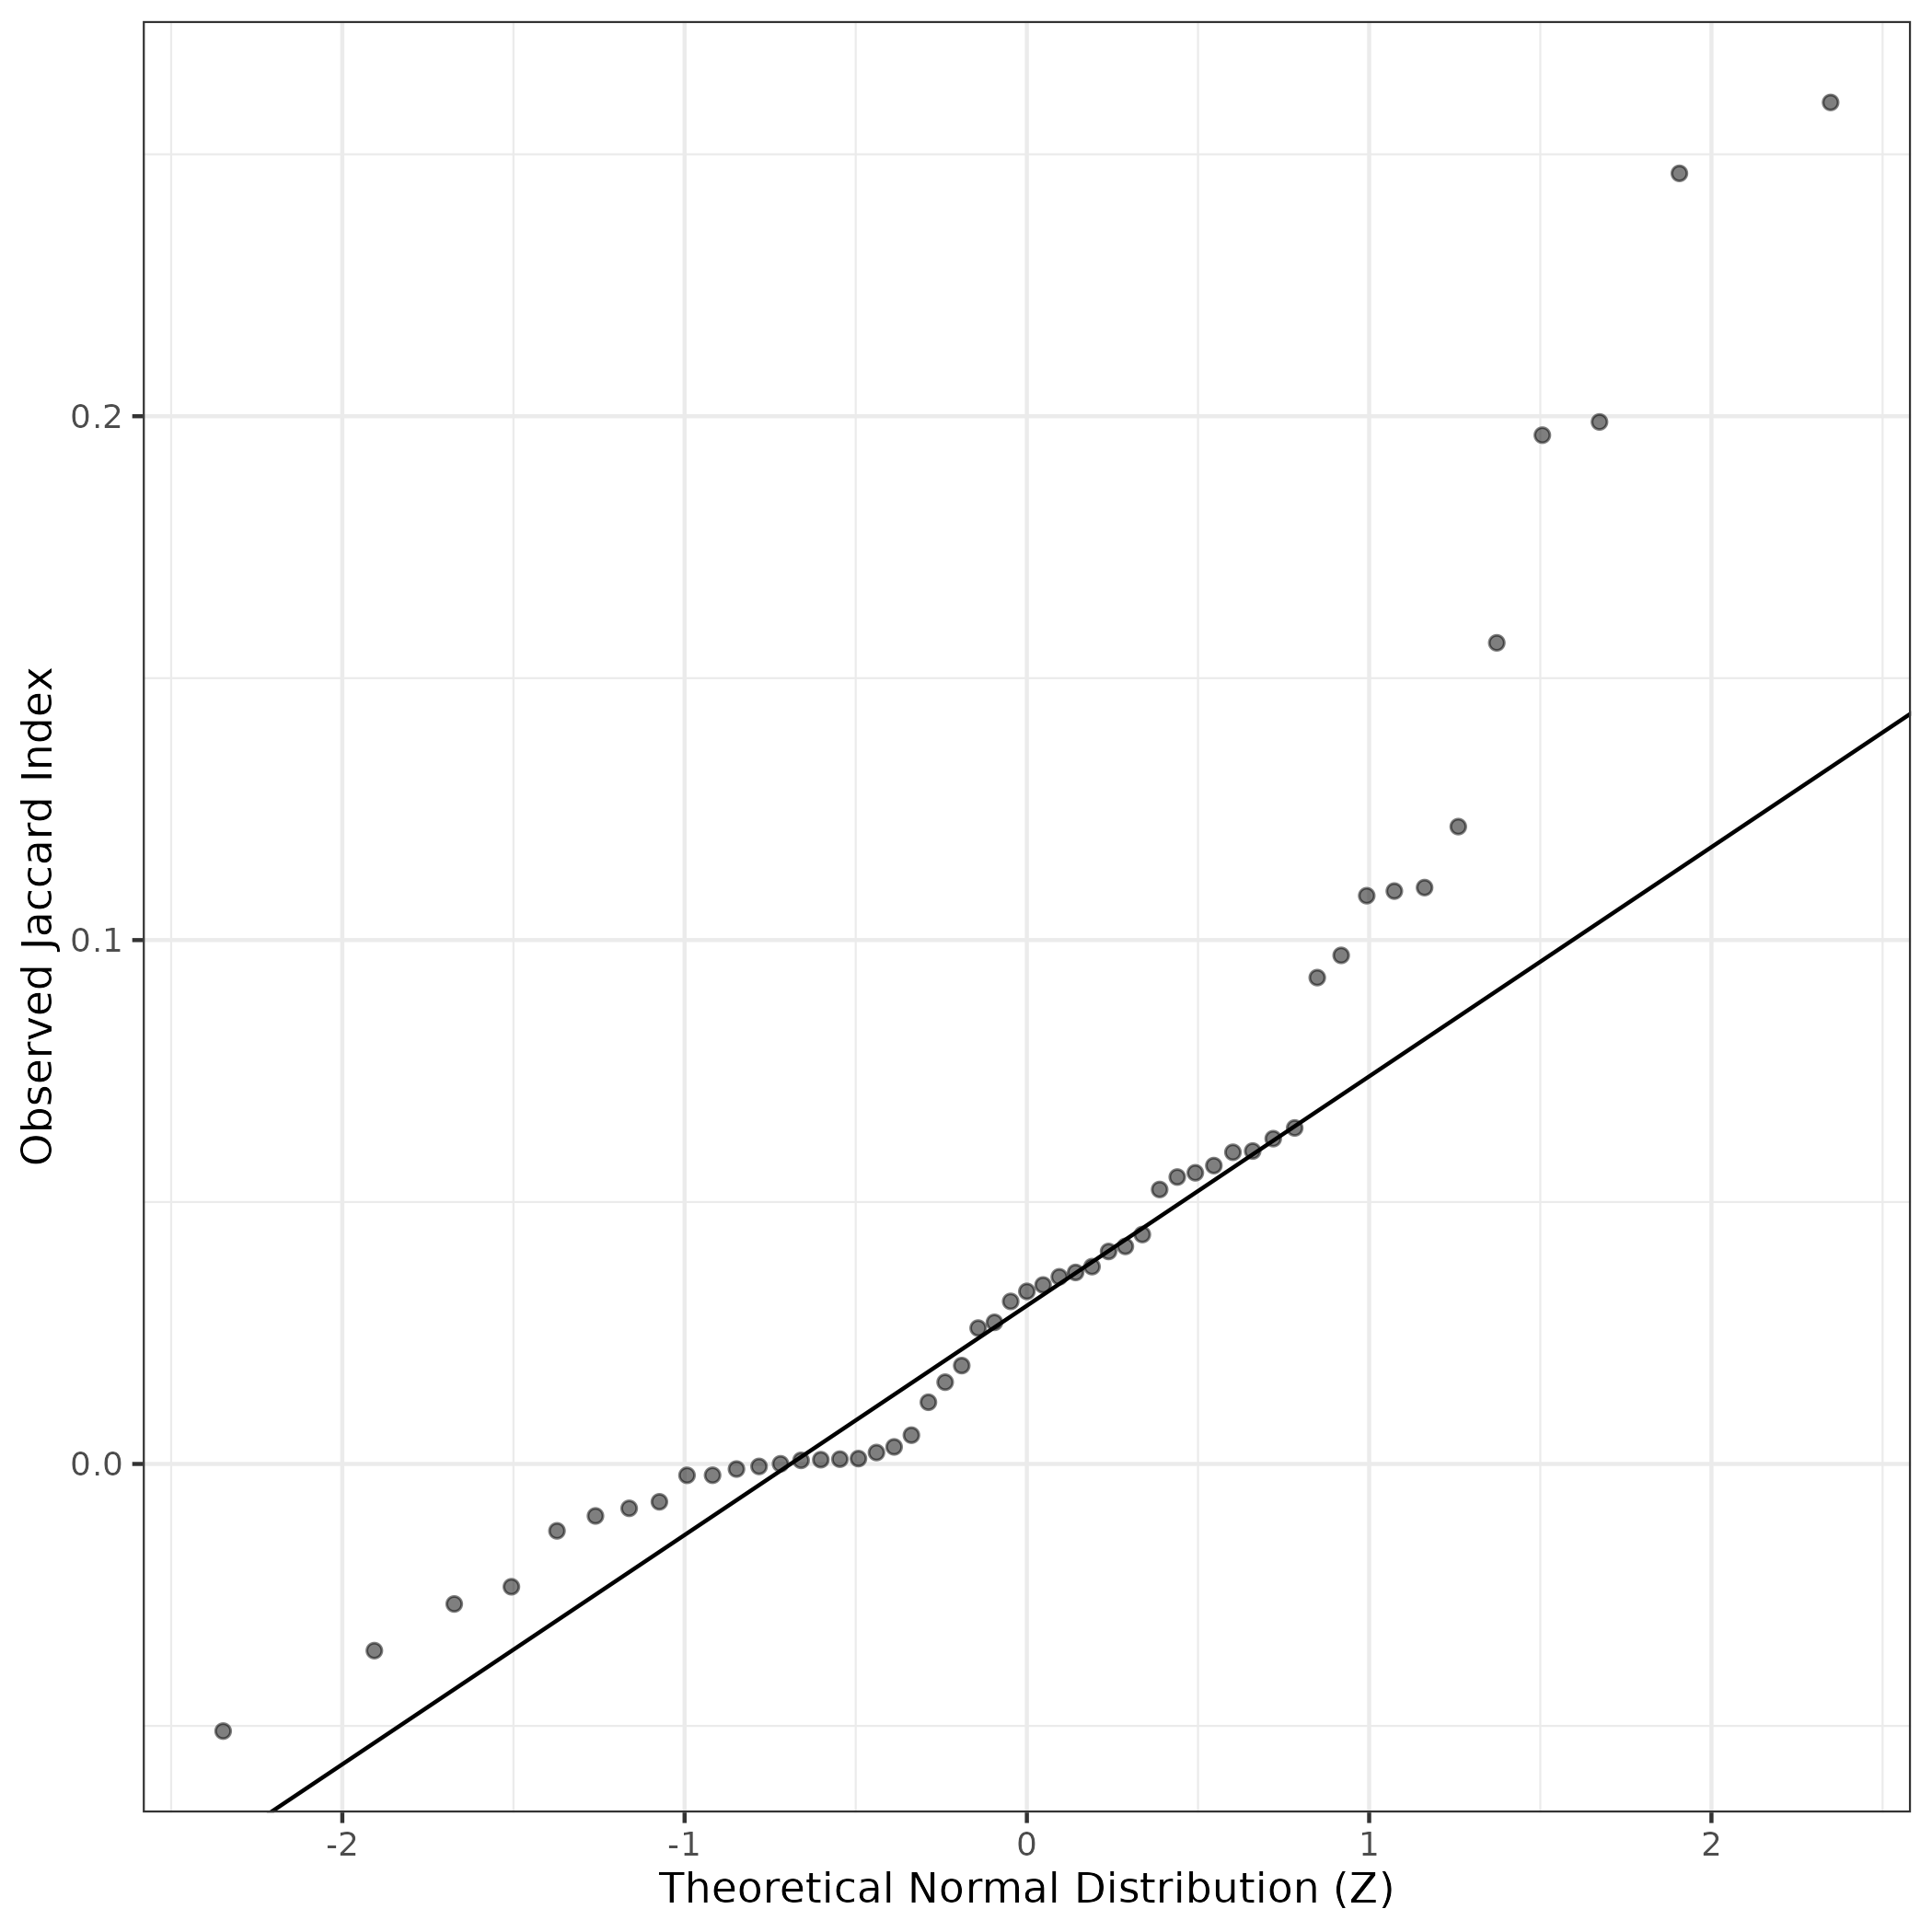
A similar QQ-plot as above, but only for instances where the H value is e.g. > 25, i.e. we are confident that the expression program is active above noise. Agreemenet between these binary vectors is tested using the Jaccard Index, with the P-values calculated by an exact test:
Interactive QQ-plot:
Singler cell type annotations for the top 50 cells on this program.
| Cell ID | Singler label | Singler Delta | Activity Score | Top Singler Raw Scores |
|---|---|---|---|---|
| CTCAATTAGGATACGC-1_HTA4_1021_4082 | Fibroblasts | 0.29 | 3070.77 | Raw ScoresFibroblasts: 0.46, Smooth_muscle_cells: 0.44, Chondrocytes: 0.44, Osteoblasts: 0.43, Tissue_stem_cells: 0.42, iPS_cells: 0.4, MSC: 0.4, Astrocyte: 0.36, Neurons: 0.35, Neuroepithelial_cell: 0.35 |
| CAACAGTGTTTGGGTT-1_HTA4_1020_4077 | Smooth_muscle_cells | 0.17 | 2692.88 | Raw ScoresSmooth_muscle_cells: 0.28, Fibroblasts: 0.28, Osteoblasts: 0.27, Tissue_stem_cells: 0.27, Chondrocytes: 0.26, MSC: 0.25, iPS_cells: 0.25, Neurons: 0.22, Astrocyte: 0.22, Neuroepithelial_cell: 0.21 |
| ATTATCCCATCTGGGC-1_HTA4_1012_4045 | Tissue_stem_cells | 0.21 | 2628.37 | Raw ScoresFibroblasts: 0.36, Smooth_muscle_cells: 0.35, Tissue_stem_cells: 0.34, Chondrocytes: 0.33, Osteoblasts: 0.33, iPS_cells: 0.31, MSC: 0.3, Neurons: 0.26, Endothelial_cells: 0.24, Embryonic_stem_cells: 0.22 |
| TAACTTCGTATCGTAC-1_HTA4_1009_4031 | Fibroblasts | 0.26 | 2595.25 | Raw ScoresFibroblasts: 0.38, Smooth_muscle_cells: 0.36, Osteoblasts: 0.36, Chondrocytes: 0.35, Tissue_stem_cells: 0.33, iPS_cells: 0.32, MSC: 0.31, Neurons: 0.26, Astrocyte: 0.25, Endothelial_cells: 0.23 |
| CTCAACCCACTTGTCC-1_HTA4_1009_4031 | Smooth_muscle_cells | 0.20 | 2349.01 | Raw ScoresFibroblasts: 0.32, Osteoblasts: 0.3, Smooth_muscle_cells: 0.3, Tissue_stem_cells: 0.3, Chondrocytes: 0.29, iPS_cells: 0.27, MSC: 0.27, Endothelial_cells: 0.22, Neurons: 0.21, Astrocyte: 0.21 |
| AGTTCCCGTGTTTGCA-1_HTA4_1009_4032 | Smooth_muscle_cells | 0.21 | 2151.14 | Raw ScoresFibroblasts: 0.34, Osteoblasts: 0.33, Smooth_muscle_cells: 0.32, Chondrocytes: 0.31, Tissue_stem_cells: 0.3, MSC: 0.29, iPS_cells: 0.29, Neurons: 0.26, Astrocyte: 0.26, Endothelial_cells: 0.24 |
| CCGGACATCGCTGATA-1_HTA4_1009_4031 | Smooth_muscle_cells | 0.16 | 2090.99 | Raw ScoresFibroblasts: 0.36, Osteoblasts: 0.35, Smooth_muscle_cells: 0.34, Astrocyte: 0.34, Chondrocytes: 0.32, Tissue_stem_cells: 0.31, MSC: 0.31, Neurons: 0.31, iPS_cells: 0.3, Neuroepithelial_cell: 0.28 |
| TCCTTCTTCCGCATAA-1_HTA4_1012_4046 | Smooth_muscle_cells | 0.29 | 2081.39 | Raw ScoresFibroblasts: 0.5, Smooth_muscle_cells: 0.48, Chondrocytes: 0.48, Osteoblasts: 0.47, Tissue_stem_cells: 0.46, iPS_cells: 0.44, MSC: 0.44, Neurons: 0.37, Endothelial_cells: 0.36, Embryonic_stem_cells: 0.34 |
| CCTGTTGGTCCGGCAT-1_HTA4_1001_4003 | Smooth_muscle_cells | 0.24 | 1997.93 | Raw ScoresFibroblasts: 0.42, Smooth_muscle_cells: 0.41, Osteoblasts: 0.39, Tissue_stem_cells: 0.39, Chondrocytes: 0.38, iPS_cells: 0.37, MSC: 0.36, Neurons: 0.31, Astrocyte: 0.3, Endothelial_cells: 0.3 |
| GGTGATTGTACAAGCG-1_HTA4_1009_4031 | Fibroblasts | 0.26 | 1982.83 | Raw ScoresFibroblasts: 0.36, Osteoblasts: 0.34, Smooth_muscle_cells: 0.32, Chondrocytes: 0.31, Tissue_stem_cells: 0.31, MSC: 0.3, iPS_cells: 0.3, Neurons: 0.25, Astrocyte: 0.23, Neuroepithelial_cell: 0.23 |
| TCTCCGAGTATCGTTG-1_HTA4_1009_4031 | Fibroblasts | 0.26 | 1975.32 | Raw ScoresFibroblasts: 0.37, Chondrocytes: 0.35, Osteoblasts: 0.35, Smooth_muscle_cells: 0.35, Tissue_stem_cells: 0.34, iPS_cells: 0.32, MSC: 0.32, Neurons: 0.27, Astrocyte: 0.24, Endothelial_cells: 0.23 |
| TTGACCCGTACCCAGC-1_HTA4_1009_4032 | Fibroblasts | 0.19 | 1918.76 | Raw ScoresFibroblasts: 0.26, Smooth_muscle_cells: 0.24, Osteoblasts: 0.24, Tissue_stem_cells: 0.24, Chondrocytes: 0.24, MSC: 0.21, iPS_cells: 0.21, Neurons: 0.18, Endothelial_cells: 0.16, Astrocyte: 0.15 |
| GCTACCTAGGAACATT-1_HTA4_1009_4031 | Smooth_muscle_cells | 0.23 | 1859.16 | Raw ScoresFibroblasts: 0.36, Smooth_muscle_cells: 0.36, Osteoblasts: 0.36, Chondrocytes: 0.34, Tissue_stem_cells: 0.33, MSC: 0.32, iPS_cells: 0.32, Neurons: 0.27, Astrocyte: 0.26, Endothelial_cells: 0.25 |
| AGCTCAACACGCGGTT-1_HTA4_1009_4031 | Fibroblasts | 0.24 | 1830.62 | Raw ScoresFibroblasts: 0.35, Osteoblasts: 0.34, Smooth_muscle_cells: 0.33, Chondrocytes: 0.33, Tissue_stem_cells: 0.32, MSC: 0.3, iPS_cells: 0.3, Neurons: 0.24, Endothelial_cells: 0.23, Astrocyte: 0.22 |
| CCTACGTCACATGACT-1_HTA4_1020_4077 | Tissue_stem_cells | 0.18 | 1727.28 | Raw ScoresFibroblasts: 0.31, Osteoblasts: 0.31, Smooth_muscle_cells: 0.31, Tissue_stem_cells: 0.3, Chondrocytes: 0.3, MSC: 0.28, iPS_cells: 0.27, Neurons: 0.24, Astrocyte: 0.23, Endothelial_cells: 0.23 |
| TCAGTGATCACTGAAC-1_HTA4_1009_4032 | Smooth_muscle_cells | 0.23 | 1711.73 | Raw ScoresFibroblasts: 0.33, Smooth_muscle_cells: 0.32, Osteoblasts: 0.3, Chondrocytes: 0.29, Tissue_stem_cells: 0.28, iPS_cells: 0.28, MSC: 0.27, Neurons: 0.23, Endothelial_cells: 0.23, Astrocyte: 0.23 |
| TGCACGGGTATGCTTG-1_HTA4_1020_4077 | Smooth_muscle_cells | 0.20 | 1709.41 | Raw ScoresFibroblasts: 0.32, Smooth_muscle_cells: 0.31, Osteoblasts: 0.31, Chondrocytes: 0.29, Tissue_stem_cells: 0.29, MSC: 0.28, iPS_cells: 0.27, Neurons: 0.23, Astrocyte: 0.22, Endothelial_cells: 0.22 |
| CCTGCATGTGTCCATA-1_HTA4_1009_4033 | Smooth_muscle_cells | 0.15 | 1686.84 | Raw ScoresFibroblasts: 0.33, Smooth_muscle_cells: 0.33, Osteoblasts: 0.32, Chondrocytes: 0.3, Tissue_stem_cells: 0.3, iPS_cells: 0.29, MSC: 0.28, Astrocyte: 0.26, Neurons: 0.25, Endothelial_cells: 0.24 |
| TAAGCACCATGCCATA-1_HTA4_1009_4031 | Smooth_muscle_cells | 0.22 | 1673.99 | Raw ScoresFibroblasts: 0.3, Osteoblasts: 0.29, Smooth_muscle_cells: 0.28, Chondrocytes: 0.28, Tissue_stem_cells: 0.26, iPS_cells: 0.25, MSC: 0.25, Astrocyte: 0.22, Neurons: 0.2, Neuroepithelial_cell: 0.18 |
| TGAGGTTGTGGAACCA-1_HTA4_1009_4031 | Fibroblasts | 0.25 | 1660.51 | Raw ScoresFibroblasts: 0.35, Osteoblasts: 0.33, Chondrocytes: 0.33, Smooth_muscle_cells: 0.32, Tissue_stem_cells: 0.31, iPS_cells: 0.3, MSC: 0.3, Neurons: 0.24, Endothelial_cells: 0.22, Astrocyte: 0.21 |
| CTTCTCTGTGTCCACG-1_HTA4_1009_4031 | Fibroblasts | 0.25 | 1654.35 | Raw ScoresFibroblasts: 0.4, Osteoblasts: 0.39, Chondrocytes: 0.38, Tissue_stem_cells: 0.38, Smooth_muscle_cells: 0.37, MSC: 0.35, iPS_cells: 0.35, Neurons: 0.29, Endothelial_cells: 0.26, Astrocyte: 0.26 |
| ATCCGTCTCACTTGGA-1_HTA4_1009_4031 | Fibroblasts | 0.23 | 1630.55 | Raw ScoresFibroblasts: 0.3, Smooth_muscle_cells: 0.29, Osteoblasts: 0.28, Chondrocytes: 0.27, Tissue_stem_cells: 0.27, iPS_cells: 0.26, MSC: 0.25, Astrocyte: 0.21, Neurons: 0.2, Neuroepithelial_cell: 0.19 |
| CTACAGAGTTGCCAAT-1_HTA4_1020_4077 | Fibroblasts | 0.20 | 1618.69 | Raw ScoresFibroblasts: 0.31, Smooth_muscle_cells: 0.29, Osteoblasts: 0.29, Chondrocytes: 0.28, Tissue_stem_cells: 0.28, MSC: 0.25, iPS_cells: 0.25, Endothelial_cells: 0.22, Neurons: 0.22, Astrocyte: 0.2 |
| AGGCATTCACCCTTAC-1_HTA4_1009_4031 | Smooth_muscle_cells | 0.18 | 1614.69 | Raw ScoresFibroblasts: 0.31, Osteoblasts: 0.3, Smooth_muscle_cells: 0.3, Chondrocytes: 0.29, Tissue_stem_cells: 0.29, MSC: 0.27, iPS_cells: 0.27, Neurons: 0.22, Astrocyte: 0.21, Endothelial_cells: 0.21 |
| CACGAATAGGTATCTC-1_HTA4_1012_4045 | Tissue_stem_cells | 0.16 | 1607.33 | Raw ScoresTissue_stem_cells: 0.31, Fibroblasts: 0.31, Smooth_muscle_cells: 0.3, Osteoblasts: 0.3, Chondrocytes: 0.3, iPS_cells: 0.27, MSC: 0.27, Astrocyte: 0.26, Neurons: 0.24, Endothelial_cells: 0.24 |
| GACTTCCTCGGCATCG-1_HTA4_1020_4077 | Smooth_muscle_cells | 0.24 | 1606.69 | Raw ScoresFibroblasts: 0.34, Smooth_muscle_cells: 0.33, Osteoblasts: 0.31, Chondrocytes: 0.31, Tissue_stem_cells: 0.3, MSC: 0.29, iPS_cells: 0.29, Neurons: 0.24, Astrocyte: 0.24, Neuroepithelial_cell: 0.22 |
| TGATCAGAGTCCGCGT-1_HTA4_1009_4031 | Fibroblasts | 0.34 | 1576.56 | Raw ScoresFibroblasts: 0.48, Osteoblasts: 0.47, Chondrocytes: 0.45, Smooth_muscle_cells: 0.45, Tissue_stem_cells: 0.44, iPS_cells: 0.42, MSC: 0.42, Neurons: 0.36, Astrocyte: 0.33, Endothelial_cells: 0.32 |
| CTCCTTTCAACCTAAC-1_HTA4_1009_4033 | Smooth_muscle_cells | 0.19 | 1556.87 | Raw ScoresSmooth_muscle_cells: 0.3, Fibroblasts: 0.28, Osteoblasts: 0.27, MSC: 0.27, Chondrocytes: 0.27, iPS_cells: 0.27, Tissue_stem_cells: 0.27, Astrocyte: 0.25, Neuroepithelial_cell: 0.25, Neurons: 0.24 |
| CCAATGATCATCGACA-1_HTA4_1009_4031 | Fibroblasts | 0.28 | 1523.41 | Raw ScoresFibroblasts: 0.42, Osteoblasts: 0.4, Smooth_muscle_cells: 0.4, Chondrocytes: 0.39, Tissue_stem_cells: 0.39, iPS_cells: 0.37, MSC: 0.36, Neurons: 0.3, Astrocyte: 0.26, Endothelial_cells: 0.26 |
| ATCACTTCACCATAAC-1_HTA4_1012_4046 | Chondrocytes | 0.26 | 1481.29 | Raw ScoresChondrocytes: 0.41, Fibroblasts: 0.4, Smooth_muscle_cells: 0.39, Osteoblasts: 0.39, Tissue_stem_cells: 0.38, MSC: 0.36, iPS_cells: 0.35, Neurons: 0.29, Endothelial_cells: 0.27, Astrocyte: 0.26 |
| CCTAACCGTGACCGAA-1_HTA4_1012_4046 | Tissue_stem_cells | 0.23 | 1455.50 | Raw ScoresFibroblasts: 0.41, Smooth_muscle_cells: 0.4, Osteoblasts: 0.39, Chondrocytes: 0.38, Tissue_stem_cells: 0.38, iPS_cells: 0.37, MSC: 0.36, Neurons: 0.32, Endothelial_cells: 0.31, Astrocyte: 0.29 |
| CCCATTGAGCCTCTCT-1_HTA4_1009_4031 | Fibroblasts | 0.23 | 1423.94 | Raw ScoresFibroblasts: 0.32, Smooth_muscle_cells: 0.31, Osteoblasts: 0.3, Chondrocytes: 0.3, Tissue_stem_cells: 0.3, MSC: 0.27, iPS_cells: 0.27, Neurons: 0.23, Astrocyte: 0.21, Endothelial_cells: 0.21 |
| ACTATCTGTCCACTCT-1_HTA4_1009_4033 | Fibroblasts | 0.20 | 1422.71 | Raw ScoresFibroblasts: 0.34, Osteoblasts: 0.33, Smooth_muscle_cells: 0.33, MSC: 0.32, Tissue_stem_cells: 0.32, Chondrocytes: 0.32, iPS_cells: 0.31, Astrocyte: 0.28, Neurons: 0.28, Neuroepithelial_cell: 0.27 |
| GTTGCGGCACTCCACT-1_HTA4_1017_4062 | Smooth_muscle_cells | 0.24 | 1416.47 | Raw ScoresFibroblasts: 0.35, Smooth_muscle_cells: 0.34, Osteoblasts: 0.33, Chondrocytes: 0.32, Tissue_stem_cells: 0.31, iPS_cells: 0.3, MSC: 0.3, Neurons: 0.25, Endothelial_cells: 0.24, Astrocyte: 0.22 |
| ATCACGAGTAGTGATA-1_HTA4_1020_4077 | Smooth_muscle_cells | 0.14 | 1409.46 | Raw ScoresFibroblasts: 0.25, Smooth_muscle_cells: 0.24, Tissue_stem_cells: 0.24, Osteoblasts: 0.23, Chondrocytes: 0.23, MSC: 0.22, iPS_cells: 0.22, Neurons: 0.19, Astrocyte: 0.18, Neuroepithelial_cell: 0.18 |
| CTCATGCCACCCTGTT-1_HTA4_1009_4032 | Fibroblasts | 0.21 | 1406.35 | Raw ScoresFibroblasts: 0.28, Smooth_muscle_cells: 0.27, Osteoblasts: 0.26, Chondrocytes: 0.25, Tissue_stem_cells: 0.24, iPS_cells: 0.22, MSC: 0.22, Neurons: 0.19, Astrocyte: 0.19, Neuroepithelial_cell: 0.17 |
| CGTTCTGCATCTATCT-1_HTA4_1009_4032 | Tissue_stem_cells | 0.18 | 1393.02 | Raw ScoresFibroblasts: 0.34, Osteoblasts: 0.34, Smooth_muscle_cells: 0.32, Chondrocytes: 0.32, Tissue_stem_cells: 0.31, iPS_cells: 0.29, MSC: 0.29, Neurons: 0.27, Astrocyte: 0.27, Endothelial_cells: 0.24 |
| TAGCACAAGACTTCAC-1_HTA4_1009_4032 | Fibroblasts | 0.23 | 1392.28 | Raw ScoresFibroblasts: 0.34, Smooth_muscle_cells: 0.33, Osteoblasts: 0.32, Chondrocytes: 0.31, Tissue_stem_cells: 0.3, iPS_cells: 0.29, MSC: 0.28, Neurons: 0.25, Endothelial_cells: 0.23, Astrocyte: 0.23 |
| TCCTTTCTCGCAACAT-1_HTA4_1020_4077 | Fibroblasts | 0.19 | 1382.54 | Raw ScoresFibroblasts: 0.28, Smooth_muscle_cells: 0.27, Osteoblasts: 0.26, Chondrocytes: 0.26, Tissue_stem_cells: 0.25, MSC: 0.25, iPS_cells: 0.23, Astrocyte: 0.22, Neurons: 0.21, Endothelial_cells: 0.21 |
| CTTCCGATCTTCTTCC-1_HTA4_1020_4077 | Fibroblasts | 0.18 | 1372.13 | Raw ScoresFibroblasts: 0.28, Smooth_muscle_cells: 0.27, Osteoblasts: 0.26, Chondrocytes: 0.26, Tissue_stem_cells: 0.26, MSC: 0.26, iPS_cells: 0.24, Neuroepithelial_cell: 0.22, Endothelial_cells: 0.21, Astrocyte: 0.21 |
| GACTCTCAGAATCCCT-1_HTA4_1020_4077 | Smooth_muscle_cells | 0.19 | 1359.22 | Raw ScoresFibroblasts: 0.31, Smooth_muscle_cells: 0.31, Osteoblasts: 0.29, Chondrocytes: 0.28, Tissue_stem_cells: 0.28, iPS_cells: 0.27, MSC: 0.26, Neurons: 0.23, Astrocyte: 0.22, Endothelial_cells: 0.22 |
| AGACACTGTTCCACGG-1_HTA4_1009_4032 | Osteoblasts | 0.23 | 1359.12 | Raw ScoresFibroblasts: 0.33, Osteoblasts: 0.33, Chondrocytes: 0.3, Smooth_muscle_cells: 0.29, Tissue_stem_cells: 0.29, MSC: 0.28, iPS_cells: 0.27, Neurons: 0.26, Astrocyte: 0.25, Neuroepithelial_cell: 0.23 |
| AACCACACAAGCGCTC-1_HTA4_1009_4031 | Fibroblasts | 0.25 | 1357.81 | Raw ScoresFibroblasts: 0.36, Osteoblasts: 0.35, Smooth_muscle_cells: 0.35, Chondrocytes: 0.34, Tissue_stem_cells: 0.33, MSC: 0.32, iPS_cells: 0.31, Neurons: 0.26, Astrocyte: 0.26, Endothelial_cells: 0.24 |
| GGGACAACAAATAGCA-1_HTA4_1009_4031 | Smooth_muscle_cells | 0.20 | 1356.50 | Raw ScoresFibroblasts: 0.32, Osteoblasts: 0.31, Smooth_muscle_cells: 0.3, Tissue_stem_cells: 0.29, Chondrocytes: 0.28, MSC: 0.28, Neurons: 0.28, iPS_cells: 0.28, Astrocyte: 0.26, Neuroepithelial_cell: 0.24 |
| CACGTGGGTCCGGACT-1_HTA4_1009_4031 | Smooth_muscle_cells | 0.15 | 1350.30 | Raw ScoresFibroblasts: 0.36, Osteoblasts: 0.36, Smooth_muscle_cells: 0.35, Astrocyte: 0.34, Tissue_stem_cells: 0.32, Chondrocytes: 0.32, Neurons: 0.32, MSC: 0.31, iPS_cells: 0.31, Neuroepithelial_cell: 0.3 |
| GGGCCATGTTGGTAGG-1_HTA4_1020_4077 | Smooth_muscle_cells | 0.18 | 1347.30 | Raw ScoresFibroblasts: 0.3, Smooth_muscle_cells: 0.3, Tissue_stem_cells: 0.29, Osteoblasts: 0.29, Chondrocytes: 0.28, MSC: 0.27, iPS_cells: 0.26, Neurons: 0.24, Endothelial_cells: 0.23, Astrocyte: 0.23 |
| GTAACCAGTCTCGACG-1_HTA4_1009_4031 | Smooth_muscle_cells | 0.17 | 1335.84 | Raw ScoresFibroblasts: 0.39, Smooth_muscle_cells: 0.37, Osteoblasts: 0.37, Astrocyte: 0.36, Chondrocytes: 0.35, Tissue_stem_cells: 0.35, Endothelial_cells: 0.35, MSC: 0.34, Neurons: 0.34, iPS_cells: 0.34 |
| GTCTACCCACGAAGAC-1_HTA4_1009_4031 | Smooth_muscle_cells | 0.20 | 1330.71 | Raw ScoresFibroblasts: 0.3, Osteoblasts: 0.29, Smooth_muscle_cells: 0.28, Chondrocytes: 0.27, Tissue_stem_cells: 0.26, MSC: 0.25, iPS_cells: 0.25, Neurons: 0.23, Astrocyte: 0.21, Endothelial_cells: 0.19 |
| TCCCACATCCGAGTGC-1_HTA4_1009_4032 | Fibroblasts | 0.23 | 1328.86 | Raw ScoresFibroblasts: 0.32, Smooth_muscle_cells: 0.31, Osteoblasts: 0.29, Tissue_stem_cells: 0.28, Chondrocytes: 0.28, iPS_cells: 0.26, MSC: 0.25, Neurons: 0.21, Astrocyte: 0.21, Endothelial_cells: 0.21 |
| GTGGGAATCTTAGCCC-1_HTA4_1009_4032 | Smooth_muscle_cells | 0.19 | 1327.61 | Raw ScoresFibroblasts: 0.3, Smooth_muscle_cells: 0.28, Osteoblasts: 0.28, Chondrocytes: 0.27, Tissue_stem_cells: 0.26, iPS_cells: 0.26, MSC: 0.25, Neurons: 0.21, Endothelial_cells: 0.2, Astrocyte: 0.2 |
Below shows the significant enrichments of this GEP for literature curated gene lists
This data was procured from existing single cell RNA-seq maps of neuroblastoma or related relevant data.
High ranks indicate this gene is a driver of this GEP.
These curated gene list are ranked by the P-value (on this GEP) of their constituent genes.
The Mean Count column shows the mean read count in cells scoring highly (H > 50) on this gene expression program.
Inflammatory CAF
These marker genes were curated across cancer subtypes in multiple organ systems as reviewed in Lavie et. al. (PMID 35883004) and contain inflammatory specific CAF genes:
Wilcoxon ranksum test P-value for gene set overrepresentation: 2.01e-16
Mean rank of genes in gene set: 2654.22
Rank on gene expression program of genes in gene set:
| Genes | Weight | Rank | GTEx | DepMap | Decartes | Mean.Counts | Mean.TPM |
|---|---|---|---|---|---|---|---|
| IL1R1 | 0.0053024 | 23 | GTEx | DepMap | Descartes | 2.47 | 378.89 |
| IL6 | 0.0035210 | 67 | GTEx | DepMap | Descartes | 0.16 | 93.60 |
| CCL2 | 0.0027366 | 132 | GTEx | DepMap | Descartes | 0.84 | 651.59 |
| CFD | 0.0023247 | 166 | GTEx | DepMap | Descartes | 0.16 | 135.33 |
| C7 | 0.0020133 | 209 | GTEx | DepMap | Descartes | 3.17 | 416.76 |
| CXCL14 | 0.0019637 | 220 | GTEx | DepMap | Descartes | 0.21 | 108.74 |
| CXCL2 | 0.0017104 | 271 | GTEx | DepMap | Descartes | 0.58 | 268.62 |
| C3 | 0.0015218 | 314 | GTEx | DepMap | Descartes | 4.11 | 335.41 |
| C1R | 0.0014796 | 325 | GTEx | DepMap | Descartes | 0.71 | 132.68 |
| C1S | 0.0014392 | 337 | GTEx | DepMap | Descartes | 1.25 | 258.28 |
| PDPN | 0.0012221 | 429 | GTEx | DepMap | Descartes | 0.15 | 36.40 |
| IGF1 | 0.0011718 | 456 | GTEx | DepMap | Descartes | 0.65 | 62.50 |
| CXCL12 | 0.0011286 | 481 | GTEx | DepMap | Descartes | 0.41 | 85.73 |
| SCARA5 | 0.0010717 | 510 | GTEx | DepMap | Descartes | 0.03 | 7.00 |
| LIF | 0.0010293 | 532 | GTEx | DepMap | Descartes | 0.07 | 12.45 |
| IL33 | 0.0009806 | 566 | GTEx | DepMap | Descartes | 0.28 | 82.98 |
| PDGFD | 0.0009610 | 580 | GTEx | DepMap | Descartes | 1.36 | 177.85 |
| RGMA | 0.0008989 | 640 | GTEx | DepMap | Descartes | 0.13 | 8.42 |
| PDGFRB | 0.0007031 | 795 | GTEx | DepMap | Descartes | 0.79 | 99.38 |
| SERPING1 | 0.0006437 | 858 | GTEx | DepMap | Descartes | 0.83 | 183.25 |
| PDGFRA | 0.0004345 | 1193 | GTEx | DepMap | Descartes | 0.16 | 17.02 |
| SOD2 | 0.0002805 | 1555 | GTEx | DepMap | Descartes | 0.06 | 1.92 |
| SAA1 | 0.0002419 | 1681 | GTEx | DepMap | Descartes | 0.06 | 31.84 |
| HGF | 0.0001725 | 1964 | GTEx | DepMap | Descartes | 0.39 | 39.23 |
| CXCL1 | 0.0001665 | 2001 | GTEx | DepMap | Descartes | 0.04 | 17.40 |
| IGFBP6 | 0.0001420 | 2133 | GTEx | DepMap | Descartes | 0.13 | 81.22 |
| CCL21 | 0.0001399 | 2144 | GTEx | DepMap | Descartes | 0.47 | 358.20 |
| SCARA3 | 0.0001397 | 2145 | GTEx | DepMap | Descartes | 0.09 | 14.76 |
| CCL8 | 0.0001240 | 2234 | GTEx | DepMap | Descartes | 0.02 | 11.55 |
| GPX3 | 0.0001174 | 2277 | GTEx | DepMap | Descartes | 0.23 | 70.95 |
| ADH1B | 0.0001124 | 2317 | GTEx | DepMap | Descartes | 0.92 | 75.78 |
| CFB | 0.0000996 | 2433 | GTEx | DepMap | Descartes | 0.04 | 6.00 |
| CXCL9 | 0.0000391 | 3094 | GTEx | DepMap | Descartes | 0.02 | 5.20 |
| CCL7 | 0.0000298 | 3248 | GTEx | DepMap | Descartes | 0.00 | 1.02 |
| IL10 | -0.0000098 | 6291 | GTEx | DepMap | Descartes | 0.01 | 1.88 |
| C4B | -0.0000218 | 7572 | GTEx | DepMap | Descartes | 0.01 | 0.41 |
| CXCL10 | -0.0000504 | 9668 | GTEx | DepMap | Descartes | 0.03 | 11.35 |
| CXCL13 | -0.0001327 | 13880 | GTEx | DepMap | Descartes | 0.02 | 9.76 |
| C1QC | -0.0001483 | 14564 | GTEx | DepMap | Descartes | 0.06 | 29.74 |
| C1QA | -0.0001825 | 15864 | GTEx | DepMap | Descartes | 0.11 | 63.94 |
Stroma (Hanemaaijer)
Marker genes obtained from Supplementary Table SD of Hanemaaijer et al (PMID 33500353). The authors generated single-cell RNA-seq data (sort-seq, 2,229 cells total) from mouse adrenal glads at E13.5, E14.5, E17.5, E18.5, P1 and P5. These were marker genes that matched with a similar dataset generated by Furlan et al (PMID 28684471). This particular set of markers are for the broad Stroma cluster:
Wilcoxon ranksum test P-value for gene set overrepresentation: 2.66e-04
Mean rank of genes in gene set: 1087.4
Rank on gene expression program of genes in gene set:
| Genes | Weight | Rank | GTEx | DepMap | Decartes | Mean.Counts | Mean.TPM |
|---|---|---|---|---|---|---|---|
| GPC3 | 0.0015370 | 309 | GTEx | DepMap | Descartes | 0.63 | 240.52 |
| COL6A1 | 0.0009909 | 559 | GTEx | DepMap | Descartes | 1.16 | 188.71 |
| COL5A1 | 0.0009332 | 607 | GTEx | DepMap | Descartes | 1.57 | 132.45 |
| FN1 | 0.0002499 | 1654 | GTEx | DepMap | Descartes | 7.97 | 506.91 |
| COL3A1 | 0.0001135 | 2308 | GTEx | DepMap | Descartes | 5.38 | 584.38 |
Myofibroblastic CAF
These marker genes were curated across cancer subtypes in multiple organ systems as reviewed in Lavie et. al. (PMID 35883004) and contain myofibroblastic specific CAF genes:
Wilcoxon ranksum test P-value for gene set overrepresentation: 3.64e-04
Mean rank of genes in gene set: 7428.2
Rank on gene expression program of genes in gene set:
| Genes | Weight | Rank | GTEx | DepMap | Decartes | Mean.Counts | Mean.TPM |
|---|---|---|---|---|---|---|---|
| THBS1 | 0.0040045 | 49 | GTEx | DepMap | Descartes | 5.13 | 501.17 |
| COL5A2 | 0.0035144 | 68 | GTEx | DepMap | Descartes | 3.37 | 374.12 |
| COL4A1 | 0.0031169 | 93 | GTEx | DepMap | Descartes | 8.07 | 953.18 |
| TNC | 0.0029182 | 110 | GTEx | DepMap | Descartes | 3.35 | 326.56 |
| COL14A1 | 0.0024358 | 155 | GTEx | DepMap | Descartes | 1.52 | 136.20 |
| VCAN | 0.0020448 | 205 | GTEx | DepMap | Descartes | 3.44 | 184.38 |
| COL12A1 | 0.0020241 | 208 | GTEx | DepMap | Descartes | 2.23 | 141.98 |
| THBS2 | 0.0014910 | 321 | GTEx | DepMap | Descartes | 1.68 | 192.53 |
| VEGFA | 0.0013846 | 357 | GTEx | DepMap | Descartes | 1.26 | 58.38 |
| IGFBP7 | 0.0013663 | 363 | GTEx | DepMap | Descartes | 8.25 | 4186.75 |
| MMP2 | 0.0011523 | 471 | GTEx | DepMap | Descartes | 0.34 | 72.52 |
| COL5A1 | 0.0009332 | 607 | GTEx | DepMap | Descartes | 1.57 | 132.45 |
| DCN | 0.0006219 | 879 | GTEx | DepMap | Descartes | 1.41 | 144.64 |
| TAGLN | 0.0005131 | 1044 | GTEx | DepMap | Descartes | 1.03 | 200.95 |
| CNN3 | 0.0004893 | 1089 | GTEx | DepMap | Descartes | 1.18 | 405.92 |
| TGFBR2 | 0.0004884 | 1092 | GTEx | DepMap | Descartes | 2.25 | 226.51 |
| ITGA7 | 0.0004603 | 1133 | GTEx | DepMap | Descartes | 0.23 | 37.85 |
| CNN2 | 0.0003805 | 1292 | GTEx | DepMap | Descartes | 0.19 | 55.60 |
| IGFBP3 | 0.0003702 | 1311 | GTEx | DepMap | Descartes | 0.35 | 80.02 |
| TGFB1 | 0.0003377 | 1388 | GTEx | DepMap | Descartes | 0.58 | 139.23 |
| TPM1 | 0.0002873 | 1535 | GTEx | DepMap | Descartes | 2.78 | 434.52 |
| LUM | 0.0002728 | 1576 | GTEx | DepMap | Descartes | 0.92 | 228.00 |
| FN1 | 0.0002499 | 1654 | GTEx | DepMap | Descartes | 7.97 | 506.91 |
| WNT5A | 0.0002261 | 1740 | GTEx | DepMap | Descartes | 0.04 | 5.73 |
| TGFBR1 | 0.0001441 | 2120 | GTEx | DepMap | Descartes | 0.83 | 73.14 |
| COL3A1 | 0.0001135 | 2308 | GTEx | DepMap | Descartes | 5.38 | 584.38 |
| TPM2 | 0.0001087 | 2349 | GTEx | DepMap | Descartes | 0.40 | 169.62 |
| MYL9 | 0.0000874 | 2539 | GTEx | DepMap | Descartes | 0.47 | 117.16 |
| COL15A1 | 0.0000583 | 2843 | GTEx | DepMap | Descartes | 1.19 | 109.51 |
| TMEM119 | 0.0000050 | 4011 | GTEx | DepMap | Descartes | 0.07 | 15.75 |
| TGFB2 | -0.0000616 | 10314 | GTEx | DepMap | Descartes | 0.28 | 30.28 |
| COL13A1 | -0.0000738 | 11016 | GTEx | DepMap | Descartes | 0.03 | 5.45 |
| ACTG2 | -0.0001269 | 13611 | GTEx | DepMap | Descartes | 0.03 | 11.22 |
| THY1 | -0.0001326 | 13878 | GTEx | DepMap | Descartes | 0.67 | 77.93 |
| BGN | -0.0001617 | 15093 | GTEx | DepMap | Descartes | 0.60 | 160.56 |
| HOPX | -0.0001748 | 15588 | GTEx | DepMap | Descartes | 0.18 | 21.12 |
| PGF | -0.0002042 | 16560 | GTEx | DepMap | Descartes | 0.05 | 8.26 |
| COL8A1 | -0.0002239 | 17112 | GTEx | DepMap | Descartes | 1.48 | 164.10 |
| COL1A2 | -0.0002336 | 17374 | GTEx | DepMap | Descartes | 5.55 | 556.81 |
| MYH11 | -0.0002849 | 18481 | GTEx | DepMap | Descartes | 0.38 | 38.60 |
| MYLK | -0.0003278 | 19074 | GTEx | DepMap | Descartes | 0.53 | 30.68 |
| COL1A1 | -0.0003563 | 19387 | GTEx | DepMap | Descartes | 5.07 | 486.77 |
| MMP11 | -0.0003668 | 19471 | GTEx | DepMap | Descartes | 0.08 | 10.78 |
| MEF2C | -0.0004534 | 20018 | GTEx | DepMap | Descartes | 1.28 | 95.55 |
| COL10A1 | -0.0004972 | 20167 | GTEx | DepMap | Descartes | 0.12 | 14.05 |
| COL11A1 | -0.0005490 | 20288 | GTEx | DepMap | Descartes | 0.46 | 30.90 |
| RGS5 | -0.0007252 | 20510 | GTEx | DepMap | Descartes | 1.09 | 92.27 |
| ACTA2 | -0.0008446 | 20558 | GTEx | DepMap | Descartes | 0.73 | 336.28 |
| POSTN | -0.0009171 | 20572 | GTEx | DepMap | Descartes | 1.06 | 162.87 |
Below shows ranks on this GEP for literature curated gene lists for large gene sets
These include those reported as mesenchymal/adrenergic by Van Groningen et al.
High ranks indicate this gene is a driver of this GEP (note these results are not ordered).
The Mean Count column shows the mean read count in cells scoring highly (H > 50) on this gene expression program.
VanGroningen Adrenergic Genes
Adrenergic marker genes from Supplementary Table 2 of Van Groningen et al. Nature Genetics 2017. These genes were identified by differential expression analysis of mesenchymal-like and adrenergic-like neuroblastoma cell lines.
Wilcoxon ranksum test P-value for gene set overrepresentation: 1.00e+00
Mean rank of genes in gene set: 15734.02
Median rank of genes in gene set: 17750
Rank on gene expression program of top 30 genes in gene set:
| Genes | Weight | Rank | GTEx | DepMap | Descartes | Mean.Counts | Mean.TPM |
|---|---|---|---|---|---|---|---|
| DPYSL3 | 0.0043736 | 39 | GTEx | DepMap | Descartes | 2.80 | 357.64 |
| FOXO3 | 0.0027897 | 124 | GTEx | DepMap | Descartes | 5.59 | 513.54 |
| CELF2 | 0.0025269 | 150 | GTEx | DepMap | Descartes | 4.01 | 410.73 |
| NFIL3 | 0.0022116 | 182 | GTEx | DepMap | Descartes | 0.96 | 254.83 |
| AKAP12 | 0.0019096 | 232 | GTEx | DepMap | Descartes | 5.87 | 470.60 |
| NCS1 | 0.0016572 | 284 | GTEx | DepMap | Descartes | 0.83 | 106.66 |
| EML4 | 0.0012681 | 406 | GTEx | DepMap | Descartes | 4.66 | 431.81 |
| SLIT3 | 0.0011853 | 448 | GTEx | DepMap | Descartes | 6.71 | 430.61 |
| RBMS3 | 0.0010260 | 536 | GTEx | DepMap | Descartes | 4.45 | 349.31 |
| TENM4 | 0.0009434 | 600 | GTEx | DepMap | Descartes | 2.80 | NA |
| KLF13 | 0.0009164 | 623 | GTEx | DepMap | Descartes | 0.89 | 77.48 |
| GCH1 | 0.0008924 | 648 | GTEx | DepMap | Descartes | 1.70 | 268.07 |
| GNB1 | 0.0007829 | 725 | GTEx | DepMap | Descartes | 3.64 | 664.83 |
| ANK2 | 0.0006988 | 800 | GTEx | DepMap | Descartes | 8.40 | 301.37 |
| ABLIM1 | 0.0006476 | 855 | GTEx | DepMap | Descartes | 4.92 | 279.00 |
| TIAM1 | 0.0005029 | 1067 | GTEx | DepMap | Descartes | 1.55 | 141.24 |
| HK2 | 0.0004896 | 1088 | GTEx | DepMap | Descartes | 0.19 | 22.49 |
| PTS | 0.0003961 | 1263 | GTEx | DepMap | Descartes | 0.79 | 365.34 |
| KLC1 | 0.0003106 | 1463 | GTEx | DepMap | Descartes | 1.06 | 42.61 |
| TACC2 | 0.0002948 | 1511 | GTEx | DepMap | Descartes | 0.90 | 49.40 |
| GRB10 | 0.0002420 | 1679 | GTEx | DepMap | Descartes | 2.29 | 230.04 |
| BMP7 | 0.0002406 | 1686 | GTEx | DepMap | Descartes | 0.43 | 48.79 |
| GNG4 | 0.0002201 | 1762 | GTEx | DepMap | Descartes | 1.51 | 128.27 |
| STXBP1 | 0.0001833 | 1913 | GTEx | DepMap | Descartes | 1.43 | 139.10 |
| NCOA7 | 0.0001814 | 1922 | GTEx | DepMap | Descartes | 2.48 | NA |
| DNAJB1 | 0.0001698 | 1981 | GTEx | DepMap | Descartes | 0.26 | 62.67 |
| EVL | 0.0001560 | 2048 | GTEx | DepMap | Descartes | 2.28 | 319.54 |
| RUFY3 | 0.0000768 | 2643 | GTEx | DepMap | Descartes | 2.61 | 306.53 |
| MAGI3 | 0.0000607 | 2815 | GTEx | DepMap | Descartes | 2.24 | 160.79 |
| NPTX2 | 0.0000380 | 3115 | GTEx | DepMap | Descartes | 0.07 | 12.88 |
VanGroningen Mesenchymal Genes
Mesenchymal marker genes from Supplementary Table 2 of Van Groningen et al. Nature Genetics 2017. These genes were identified by differential expression analysis of mesenchymal-like and adrenergic-like neuroblastoma cell lines.
Wilcoxon ranksum test P-value for gene set overrepresentation: 3.95e-41
Mean rank of genes in gene set: 6667.87
Median rank of genes in gene set: 2445
Rank on gene expression program of top 30 genes in gene set:
| Genes | Weight | Rank | GTEx | DepMap | Descartes | Mean.Counts | Mean.TPM |
|---|---|---|---|---|---|---|---|
| LMNA | 0.0084675 | 2 | GTEx | DepMap | Descartes | 6.62 | 1852.26 |
| EMP1 | 0.0073940 | 6 | GTEx | DepMap | Descartes | 6.85 | 1059.63 |
| FGFR1 | 0.0063647 | 10 | GTEx | DepMap | Descartes | 2.30 | 322.99 |
| UAP1 | 0.0054367 | 21 | GTEx | DepMap | Descartes | 1.06 | 310.86 |
| STAT3 | 0.0051113 | 28 | GTEx | DepMap | Descartes | 6.62 | 822.99 |
| EGFR | 0.0048645 | 33 | GTEx | DepMap | Descartes | 3.98 | 301.96 |
| PRRX1 | 0.0044597 | 37 | GTEx | DepMap | Descartes | 1.66 | 335.61 |
| THBS1 | 0.0040045 | 49 | GTEx | DepMap | Descartes | 5.13 | 501.17 |
| ERRFI1 | 0.0039704 | 50 | GTEx | DepMap | Descartes | 2.93 | 551.92 |
| TSC22D2 | 0.0039197 | 51 | GTEx | DepMap | Descartes | 3.61 | 194.77 |
| EGR1 | 0.0038581 | 53 | GTEx | DepMap | Descartes | 2.99 | 662.65 |
| TUBB6 | 0.0037511 | 57 | GTEx | DepMap | Descartes | 0.98 | 369.51 |
| CBLB | 0.0037253 | 59 | GTEx | DepMap | Descartes | 6.64 | 706.89 |
| COL5A2 | 0.0035144 | 68 | GTEx | DepMap | Descartes | 3.37 | 374.12 |
| HIPK3 | 0.0034959 | 69 | GTEx | DepMap | Descartes | 3.10 | 279.70 |
| EPS8 | 0.0034951 | 70 | GTEx | DepMap | Descartes | 4.17 | 651.47 |
| CCDC80 | 0.0033400 | 74 | GTEx | DepMap | Descartes | 1.07 | 63.97 |
| COL4A2 | 0.0032710 | 79 | GTEx | DepMap | Descartes | 7.02 | 857.28 |
| FSTL1 | 0.0032112 | 83 | GTEx | DepMap | Descartes | 1.60 | 224.34 |
| COL6A2 | 0.0031832 | 85 | GTEx | DepMap | Descartes | 2.00 | 465.37 |
| LATS2 | 0.0031779 | 86 | GTEx | DepMap | Descartes | 1.44 | 189.94 |
| ALDH1A3 | 0.0031729 | 88 | GTEx | DepMap | Descartes | 0.64 | 145.93 |
| HOMER1 | 0.0031574 | 89 | GTEx | DepMap | Descartes | 2.48 | 244.43 |
| COL4A1 | 0.0031169 | 93 | GTEx | DepMap | Descartes | 8.07 | 953.18 |
| ZFP36L1 | 0.0030922 | 95 | GTEx | DepMap | Descartes | 1.70 | 396.29 |
| BNC2 | 0.0030624 | 100 | GTEx | DepMap | Descartes | 4.20 | 288.21 |
| ANXA1 | 0.0030476 | 102 | GTEx | DepMap | Descartes | 1.73 | 644.13 |
| CFH | 0.0029780 | 106 | GTEx | DepMap | Descartes | 3.95 | 318.10 |
| TNC | 0.0029182 | 110 | GTEx | DepMap | Descartes | 3.35 | 326.56 |
| EPHA3 | 0.0029169 | 111 | GTEx | DepMap | Descartes | 1.63 | 233.73 |
Descartes adrenocortical markers
Top 50 marker genes of adrenocortical cells in the Decartes fetal adrenal single cell map (https://atlas.brotmanbaty.org/bbi/human-gene-expression-during-development/cell/adrenocortical/in/adrenal)
Wilcoxon ranksum test P-value for gene set overrepresentation: 1.00e+00
Mean rank of genes in gene set: 14116.11
Median rank of genes in gene set: 16858
Rank on gene expression program of top 30 genes in gene set:
| Genes | Weight | Rank | GTEx | DepMap | Descartes | Mean.Counts | Mean.TPM |
|---|---|---|---|---|---|---|---|
| SH3PXD2B | 0.0028176 | 118 | GTEx | DepMap | Descartes | 1.43 | 135.34 |
| LDLR | 0.0004912 | 1083 | GTEx | DepMap | Descartes | 2.51 | 214.48 |
| PAPSS2 | 0.0003980 | 1259 | GTEx | DepMap | Descartes | 2.00 | 266.54 |
| SH3BP5 | 0.0002866 | 1538 | GTEx | DepMap | Descartes | 2.44 | 423.20 |
| PDE10A | 0.0001223 | 2247 | GTEx | DepMap | Descartes | 4.27 | 268.28 |
| ERN1 | 0.0000428 | 3043 | GTEx | DepMap | Descartes | 1.68 | 85.15 |
| APOC1 | 0.0000030 | 4126 | GTEx | DepMap | Descartes | 1.22 | 793.76 |
| IGF1R | -0.0000346 | 8613 | GTEx | DepMap | Descartes | 4.44 | 191.24 |
| SLC2A14 | -0.0000380 | 8859 | GTEx | DepMap | Descartes | 0.07 | 7.26 |
| PEG3 | -0.0000419 | 9129 | GTEx | DepMap | Descartes | 0.01 | NA |
| FREM2 | -0.0000743 | 11050 | GTEx | DepMap | Descartes | 0.05 | 1.64 |
| SULT2A1 | -0.0000815 | 11410 | GTEx | DepMap | Descartes | 0.77 | 130.57 |
| INHA | -0.0000869 | 11668 | GTEx | DepMap | Descartes | 0.03 | 8.20 |
| HMGCS1 | -0.0001117 | 12900 | GTEx | DepMap | Descartes | 1.23 | 98.06 |
| HSPD1 | -0.0001120 | 12917 | GTEx | DepMap | Descartes | 2.01 | 388.94 |
| CLU | -0.0001179 | 13193 | GTEx | DepMap | Descartes | 2.12 | 284.74 |
| FDXR | -0.0001571 | 14909 | GTEx | DepMap | Descartes | 0.09 | 15.12 |
| TM7SF2 | -0.0001596 | 15008 | GTEx | DepMap | Descartes | 0.13 | 29.07 |
| POR | -0.0001661 | 15286 | GTEx | DepMap | Descartes | 2.63 | 370.63 |
| DHCR7 | -0.0001668 | 15303 | GTEx | DepMap | Descartes | 0.09 | 14.62 |
| MSMO1 | -0.0001736 | 15539 | GTEx | DepMap | Descartes | 0.55 | 109.58 |
| HMGCR | -0.0001931 | 16199 | GTEx | DepMap | Descartes | 0.58 | 58.11 |
| SGCZ | -0.0002152 | 16858 | GTEx | DepMap | Descartes | 3.72 | 221.86 |
| NPC1 | -0.0002155 | 16866 | GTEx | DepMap | Descartes | 1.02 | 103.04 |
| CYP17A1 | -0.0002195 | 16988 | GTEx | DepMap | Descartes | 0.27 | 69.42 |
| STAR | -0.0002352 | 17415 | GTEx | DepMap | Descartes | 0.54 | 61.78 |
| CYP21A2 | -0.0002581 | 17979 | GTEx | DepMap | Descartes | 0.38 | 58.17 |
| CYP11A1 | -0.0002617 | 18039 | GTEx | DepMap | Descartes | 0.48 | 77.12 |
| BAIAP2L1 | -0.0002654 | 18098 | GTEx | DepMap | Descartes | 0.84 | 76.05 |
| DHCR24 | -0.0002658 | 18109 | GTEx | DepMap | Descartes | 0.85 | 60.19 |
Descartes chromaffin markers
Top 50 marker genes of chromaffin cells in the Decartes fetal adrenal single cell map (https://atlas.brotmanbaty.org/bbi/human-gene-expression-during-development/cell/chromaffin/in/adrenal)
Wilcoxon ranksum test P-value for gene set overrepresentation: 1.00e+00
Mean rank of genes in gene set: 17845.3
Median rank of genes in gene set: 18985
Rank on gene expression program of top 30 genes in gene set:
| Genes | Weight | Rank | GTEx | DepMap | Descartes | Mean.Counts | Mean.TPM |
|---|---|---|---|---|---|---|---|
| PTCHD1 | 0.0002978 | 1501 | GTEx | DepMap | Descartes | 0.72 | 23.93 |
| GREM1 | 0.0000751 | 2661 | GTEx | DepMap | Descartes | 0.36 | 15.33 |
| PLXNA4 | -0.0000582 | 10133 | GTEx | DepMap | Descartes | 1.23 | 41.12 |
| CNTFR | -0.0001010 | 12362 | GTEx | DepMap | Descartes | 0.32 | 65.32 |
| NTRK1 | -0.0001533 | 14766 | GTEx | DepMap | Descartes | 0.30 | 30.04 |
| TUBB2A | -0.0001801 | 15785 | GTEx | DepMap | Descartes | 0.73 | 225.55 |
| MLLT11 | -0.0002060 | 16601 | GTEx | DepMap | Descartes | 0.49 | 104.88 |
| RPH3A | -0.0002141 | 16823 | GTEx | DepMap | Descartes | 0.13 | 8.51 |
| PRPH | -0.0002243 | 17124 | GTEx | DepMap | Descartes | 0.82 | 174.52 |
| BASP1 | -0.0002551 | 17913 | GTEx | DepMap | Descartes | 1.42 | 399.25 |
| STMN4 | -0.0002559 | 17938 | GTEx | DepMap | Descartes | 0.51 | 105.49 |
| RGMB | -0.0002574 | 17966 | GTEx | DepMap | Descartes | 0.29 | 32.04 |
| MAP1B | -0.0002650 | 18092 | GTEx | DepMap | Descartes | 5.60 | 232.38 |
| SYNPO2 | -0.0002862 | 18500 | GTEx | DepMap | Descartes | 1.72 | 73.75 |
| FAT3 | -0.0002896 | 18547 | GTEx | DepMap | Descartes | 0.42 | 10.94 |
| EYA4 | -0.0002933 | 18612 | GTEx | DepMap | Descartes | 0.56 | 38.51 |
| HMX1 | -0.0002947 | 18638 | GTEx | DepMap | Descartes | 0.40 | 72.33 |
| MAB21L1 | -0.0002969 | 18684 | GTEx | DepMap | Descartes | 0.07 | 12.23 |
| TMEFF2 | -0.0002996 | 18730 | GTEx | DepMap | Descartes | 0.80 | 96.82 |
| MAB21L2 | -0.0003022 | 18768 | GTEx | DepMap | Descartes | 0.04 | 7.37 |
| GAP43 | -0.0003089 | 18869 | GTEx | DepMap | Descartes | 1.85 | 390.45 |
| IL7 | -0.0003191 | 18985 | GTEx | DepMap | Descartes | 1.88 | 350.72 |
| REEP1 | -0.0003257 | 19051 | GTEx | DepMap | Descartes | 0.66 | 57.98 |
| ANKFN1 | -0.0003361 | 19179 | GTEx | DepMap | Descartes | 0.98 | 84.38 |
| TUBA1A | -0.0003401 | 19232 | GTEx | DepMap | Descartes | 3.47 | 1008.85 |
| GAL | -0.0003492 | 19329 | GTEx | DepMap | Descartes | 0.39 | 250.33 |
| SLC6A2 | -0.0003567 | 19391 | GTEx | DepMap | Descartes | 0.22 | 27.02 |
| RYR2 | -0.0003843 | 19607 | GTEx | DepMap | Descartes | 5.64 | 128.79 |
| EPHA6 | -0.0003866 | 19625 | GTEx | DepMap | Descartes | 1.66 | 153.24 |
| TUBB2B | -0.0003893 | 19646 | GTEx | DepMap | Descartes | 1.02 | 292.00 |
Descartes Vascular_endothelial markers
Top 50 marker genes of Vascular_endothelial cells in the Decartes fetal adrenal single cell map (https://atlas.brotmanbaty.org/bbi/human-gene-expression-during-development/cell/vascular_endothelial/in/adrenal)
Wilcoxon ranksum test P-value for gene set overrepresentation: 9.71e-01
Mean rank of genes in gene set: 11991.2
Median rank of genes in gene set: 13176.5
Rank on gene expression program of top 30 genes in gene set:
| Genes | Weight | Rank | GTEx | DepMap | Descartes | Mean.Counts | Mean.TPM |
|---|---|---|---|---|---|---|---|
| TMEM88 | 0.0007259 | 768 | GTEx | DepMap | Descartes | 0.09 | 61.51 |
| NPR1 | 0.0001913 | 1884 | GTEx | DepMap | Descartes | 0.04 | 5.48 |
| CHRM3 | 0.0001243 | 2232 | GTEx | DepMap | Descartes | 1.19 | 76.06 |
| BTNL9 | 0.0000372 | 3126 | GTEx | DepMap | Descartes | 0.08 | 12.56 |
| APLNR | 0.0000341 | 3169 | GTEx | DepMap | Descartes | 0.05 | 8.42 |
| ESM1 | 0.0000126 | 3697 | GTEx | DepMap | Descartes | 0.03 | 7.09 |
| CLDN5 | 0.0000106 | 3765 | GTEx | DepMap | Descartes | 0.11 | 25.38 |
| PLVAP | 0.0000090 | 3835 | GTEx | DepMap | Descartes | 0.16 | 38.83 |
| RASIP1 | 0.0000064 | 3948 | GTEx | DepMap | Descartes | 0.10 | 18.57 |
| CYP26B1 | -0.0000147 | 6857 | GTEx | DepMap | Descartes | 0.03 | 3.28 |
| ID1 | -0.0000165 | 7053 | GTEx | DepMap | Descartes | 0.29 | 104.15 |
| NOTCH4 | -0.0000233 | 7688 | GTEx | DepMap | Descartes | 0.07 | 5.57 |
| ECSCR | -0.0000311 | 8337 | GTEx | DepMap | Descartes | 0.00 | 0.04 |
| MMRN2 | -0.0000440 | 9265 | GTEx | DepMap | Descartes | 0.09 | 11.81 |
| CDH5 | -0.0000591 | 10185 | GTEx | DepMap | Descartes | 0.14 | 19.88 |
| CRHBP | -0.0000687 | 10715 | GTEx | DepMap | Descartes | 0.04 | 11.58 |
| IRX3 | -0.0000849 | 11563 | GTEx | DepMap | Descartes | 0.01 | 1.55 |
| SOX18 | -0.0000901 | 11846 | GTEx | DepMap | Descartes | 0.06 | 15.24 |
| SHE | -0.0000909 | 11881 | GTEx | DepMap | Descartes | 0.07 | 5.42 |
| KDR | -0.0001050 | 12564 | GTEx | DepMap | Descartes | 0.07 | 6.09 |
| TM4SF18 | -0.0001141 | 13005 | GTEx | DepMap | Descartes | 0.03 | 4.45 |
| GALNT15 | -0.0001159 | 13092 | GTEx | DepMap | Descartes | 0.08 | NA |
| F8 | -0.0001196 | 13261 | GTEx | DepMap | Descartes | 0.14 | 8.01 |
| TIE1 | -0.0001213 | 13342 | GTEx | DepMap | Descartes | 0.09 | 12.68 |
| KANK3 | -0.0001357 | 14013 | GTEx | DepMap | Descartes | 0.08 | 17.60 |
| FLT4 | -0.0001358 | 14014 | GTEx | DepMap | Descartes | 0.06 | 6.03 |
| HYAL2 | -0.0001369 | 14060 | GTEx | DepMap | Descartes | 0.12 | 14.96 |
| ROBO4 | -0.0001379 | 14100 | GTEx | DepMap | Descartes | 0.05 | 5.83 |
| RAMP2 | -0.0001557 | 14864 | GTEx | DepMap | Descartes | 0.08 | 52.29 |
| FCGR2B | -0.0001580 | 14945 | GTEx | DepMap | Descartes | 0.02 | 2.55 |
Descartes stromal markers
Top 50 marker genes of stromal cells in the Decartes fetal adrenal single cell map (https://atlas.brotmanbaty.org/bbi/human-gene-expression-during-development/cell/stromal/in/adrenal)
Wilcoxon ranksum test P-value for gene set overrepresentation: 2.86e-09
Mean rank of genes in gene set: 5354.53
Median rank of genes in gene set: 1455
Rank on gene expression program of top 30 genes in gene set:
| Genes | Weight | Rank | GTEx | DepMap | Descartes | Mean.Counts | Mean.TPM |
|---|---|---|---|---|---|---|---|
| PRRX1 | 0.0044597 | 37 | GTEx | DepMap | Descartes | 1.66 | 335.61 |
| CCDC80 | 0.0033400 | 74 | GTEx | DepMap | Descartes | 1.07 | 63.97 |
| BICC1 | 0.0027636 | 128 | GTEx | DepMap | Descartes | 5.50 | 655.33 |
| GLI2 | 0.0027046 | 134 | GTEx | DepMap | Descartes | 0.82 | 104.18 |
| COL12A1 | 0.0020241 | 208 | GTEx | DepMap | Descartes | 2.23 | 141.98 |
| C7 | 0.0020133 | 209 | GTEx | DepMap | Descartes | 3.17 | 416.76 |
| COL6A3 | 0.0017676 | 261 | GTEx | DepMap | Descartes | 2.70 | 187.94 |
| COL27A1 | 0.0014141 | 350 | GTEx | DepMap | Descartes | 0.75 | 68.16 |
| HHIP | 0.0013064 | 388 | GTEx | DepMap | Descartes | 0.29 | 24.21 |
| FREM1 | 0.0012914 | 395 | GTEx | DepMap | Descartes | 0.68 | 54.03 |
| MGP | 0.0012038 | 437 | GTEx | DepMap | Descartes | 2.62 | 1018.63 |
| ADAMTSL3 | 0.0011502 | 472 | GTEx | DepMap | Descartes | 1.76 | 142.68 |
| SCARA5 | 0.0010717 | 510 | GTEx | DepMap | Descartes | 0.03 | 7.00 |
| CCDC102B | 0.0009901 | 562 | GTEx | DepMap | Descartes | 3.38 | 863.94 |
| CDH11 | 0.0009003 | 639 | GTEx | DepMap | Descartes | 2.10 | 213.12 |
| ADAMTS2 | 0.0008316 | 696 | GTEx | DepMap | Descartes | 1.09 | 110.91 |
| ABCA6 | 0.0008167 | 709 | GTEx | DepMap | Descartes | 1.25 | 112.95 |
| SFRP2 | 0.0007488 | 748 | GTEx | DepMap | Descartes | 0.44 | 120.21 |
| ABCC9 | 0.0006507 | 849 | GTEx | DepMap | Descartes | 0.32 | 24.82 |
| DCN | 0.0006219 | 879 | GTEx | DepMap | Descartes | 1.41 | 144.64 |
| ELN | 0.0005801 | 937 | GTEx | DepMap | Descartes | 0.60 | 108.48 |
| CD248 | 0.0005393 | 1002 | GTEx | DepMap | Descartes | 0.07 | 21.78 |
| PDGFRA | 0.0004345 | 1193 | GTEx | DepMap | Descartes | 0.16 | 17.02 |
| IGFBP3 | 0.0003702 | 1311 | GTEx | DepMap | Descartes | 0.35 | 80.02 |
| ZNF385D | 0.0003130 | 1455 | GTEx | DepMap | Descartes | 0.69 | 40.32 |
| LUM | 0.0002728 | 1576 | GTEx | DepMap | Descartes | 0.92 | 228.00 |
| ISLR | 0.0002420 | 1680 | GTEx | DepMap | Descartes | 0.14 | 42.89 |
| OGN | 0.0002152 | 1784 | GTEx | DepMap | Descartes | 0.18 | 37.57 |
| LOX | 0.0002093 | 1797 | GTEx | DepMap | Descartes | 0.11 | 13.30 |
| MXRA5 | 0.0001804 | 1925 | GTEx | DepMap | Descartes | 0.16 | 9.60 |
Descartes sympathoblasts markers
Top 50 marker genes of sympathoblasts cells in the Decartes fetal adrenal single cell map (https://atlas.brotmanbaty.org/bbi/human-gene-expression-during-development/cell/sympathoblasts/in/adrenal)
Wilcoxon ranksum test P-value for gene set overrepresentation: 1.00e+00
Mean rank of genes in gene set: 13960.3
Median rank of genes in gene set: 15917
Rank on gene expression program of top 30 genes in gene set:
| Genes | Weight | Rank | GTEx | DepMap | Descartes | Mean.Counts | Mean.TPM |
|---|---|---|---|---|---|---|---|
| GRM7 | 0.0013112 | 387 | GTEx | DepMap | Descartes | 0.75 | 118.12 |
| GCH1 | 0.0008924 | 648 | GTEx | DepMap | Descartes | 1.70 | 268.07 |
| ARC | 0.0007271 | 767 | GTEx | DepMap | Descartes | 0.45 | 74.04 |
| TIAM1 | 0.0005029 | 1067 | GTEx | DepMap | Descartes | 1.55 | 141.24 |
| LAMA3 | 0.0003583 | 1334 | GTEx | DepMap | Descartes | 0.54 | 30.65 |
| PENK | 0.0001730 | 1962 | GTEx | DepMap | Descartes | 0.05 | 39.67 |
| MGAT4C | 0.0000850 | 2567 | GTEx | DepMap | Descartes | 1.46 | 36.31 |
| PCSK2 | 0.0000072 | 3916 | GTEx | DepMap | Descartes | 0.49 | 64.79 |
| PNMT | -0.0000263 | 7951 | GTEx | DepMap | Descartes | 0.02 | 7.15 |
| NTNG1 | -0.0000367 | 8761 | GTEx | DepMap | Descartes | 1.22 | 118.47 |
| EML6 | -0.0000676 | 10649 | GTEx | DepMap | Descartes | 1.48 | 58.86 |
| DGKK | -0.0000722 | 10924 | GTEx | DepMap | Descartes | 0.18 | 9.24 |
| GALNTL6 | -0.0000926 | 11963 | GTEx | DepMap | Descartes | 1.18 | 145.26 |
| HTATSF1 | -0.0001355 | 13998 | GTEx | DepMap | Descartes | 0.20 | 38.10 |
| SORCS3 | -0.0001485 | 14574 | GTEx | DepMap | Descartes | 0.25 | 18.34 |
| PCSK1N | -0.0001490 | 14600 | GTEx | DepMap | Descartes | 1.21 | 584.14 |
| SLC24A2 | -0.0001549 | 14830 | GTEx | DepMap | Descartes | 0.20 | 5.85 |
| SLC18A1 | -0.0001557 | 14865 | GTEx | DepMap | Descartes | 0.13 | 16.27 |
| C1QL1 | -0.0001672 | 15321 | GTEx | DepMap | Descartes | 0.06 | 19.28 |
| PACRG | -0.0001819 | 15843 | GTEx | DepMap | Descartes | 1.10 | 248.05 |
| TBX20 | -0.0001837 | 15901 | GTEx | DepMap | Descartes | 0.34 | 80.61 |
| CHGA | -0.0001843 | 15917 | GTEx | DepMap | Descartes | 0.42 | 116.75 |
| INSM1 | -0.0002000 | 16419 | GTEx | DepMap | Descartes | 0.08 | 11.49 |
| CHGB | -0.0002060 | 16602 | GTEx | DepMap | Descartes | 2.10 | 467.95 |
| TENM1 | -0.0002248 | 17135 | GTEx | DepMap | Descartes | 1.10 | NA |
| CNTN3 | -0.0002287 | 17241 | GTEx | DepMap | Descartes | 0.20 | 17.54 |
| TMEM130 | -0.0002312 | 17307 | GTEx | DepMap | Descartes | 0.39 | 40.80 |
| GRID2 | -0.0002720 | 18244 | GTEx | DepMap | Descartes | 1.24 | 72.63 |
| CNTNAP5 | -0.0002825 | 18427 | GTEx | DepMap | Descartes | 0.54 | 33.05 |
| SCG2 | -0.0002829 | 18432 | GTEx | DepMap | Descartes | 2.34 | 418.30 |
Descartes erythroblasts markers
Top 50 marker genes of erythroblasts cells in the Decartes fetal adrenal single cell map (https://atlas.brotmanbaty.org/bbi/human-gene-expression-during-development/cell/erythroblasts/in/adrenal)
Wilcoxon ranksum test P-value for gene set overrepresentation: 6.68e-01
Mean rank of genes in gene set: 10674.28
Median rank of genes in gene set: 11103.5
Rank on gene expression program of top 30 genes in gene set:
| Genes | Weight | Rank | GTEx | DepMap | Descartes | Mean.Counts | Mean.TPM |
|---|---|---|---|---|---|---|---|
| MICAL2 | 0.0011874 | 447 | GTEx | DepMap | Descartes | 1.67 | 173.19 |
| RAPGEF2 | 0.0011355 | 477 | GTEx | DepMap | Descartes | 3.44 | 284.33 |
| DENND4A | 0.0008012 | 717 | GTEx | DepMap | Descartes | 4.55 | 247.51 |
| SELENBP1 | 0.0003455 | 1368 | GTEx | DepMap | Descartes | 0.05 | 11.00 |
| SLC25A21 | 0.0001180 | 2271 | GTEx | DepMap | Descartes | 0.14 | 18.36 |
| SLC25A37 | 0.0000882 | 2533 | GTEx | DepMap | Descartes | 0.77 | 83.51 |
| TSPAN5 | 0.0000690 | 2725 | GTEx | DepMap | Descartes | 1.64 | 251.98 |
| HBA2 | 0.0000100 | 3785 | GTEx | DepMap | Descartes | 0.08 | 98.23 |
| HEMGN | 0.0000033 | 4097 | GTEx | DepMap | Descartes | 0.00 | 0.88 |
| HBG2 | 0.0000000 | 4705 | GTEx | DepMap | Descartes | 0.00 | 0.00 |
| HBA1 | -0.0000001 | 4933 | GTEx | DepMap | Descartes | 0.03 | 36.45 |
| HBB | -0.0000047 | 5553 | GTEx | DepMap | Descartes | 0.15 | 151.48 |
| HBG1 | -0.0000079 | 6027 | GTEx | DepMap | Descartes | 0.00 | 0.00 |
| GCLC | -0.0000152 | 6897 | GTEx | DepMap | Descartes | 1.68 | 155.32 |
| HBZ | -0.0000247 | 7828 | GTEx | DepMap | Descartes | 0.00 | 3.18 |
| AHSP | -0.0000306 | 8289 | GTEx | DepMap | Descartes | 0.00 | 1.76 |
| SPTA1 | -0.0000358 | 8700 | GTEx | DepMap | Descartes | 0.01 | 0.39 |
| HBM | -0.0000440 | 9263 | GTEx | DepMap | Descartes | 0.00 | 2.99 |
| ALAS2 | -0.0000450 | 9338 | GTEx | DepMap | Descartes | 0.00 | 0.68 |
| EPB42 | -0.0000510 | 9702 | GTEx | DepMap | Descartes | 0.00 | 0.36 |
| GYPA | -0.0000548 | 9939 | GTEx | DepMap | Descartes | 0.00 | 0.62 |
| SLC4A1 | -0.0000674 | 10634 | GTEx | DepMap | Descartes | 0.01 | 0.68 |
| GYPB | -0.0000736 | 11004 | GTEx | DepMap | Descartes | 0.01 | 4.62 |
| RHCE | -0.0000775 | 11203 | GTEx | DepMap | Descartes | 0.04 | 8.12 |
| SPECC1 | -0.0000792 | 11303 | GTEx | DepMap | Descartes | 0.87 | 76.49 |
| RHAG | -0.0000804 | 11355 | GTEx | DepMap | Descartes | 0.01 | 1.33 |
| GYPC | -0.0000880 | 11733 | GTEx | DepMap | Descartes | 0.12 | 41.60 |
| BLVRB | -0.0000891 | 11794 | GTEx | DepMap | Descartes | 0.18 | 66.59 |
| GYPE | -0.0000916 | 11913 | GTEx | DepMap | Descartes | 0.03 | 8.35 |
| SPTB | -0.0000969 | 12159 | GTEx | DepMap | Descartes | 0.20 | 8.10 |
Descartes myeloid markers
Top 50 marker genes of myeloid cells in the Decartes fetal adrenal single cell map (https://atlas.brotmanbaty.org/bbi/human-gene-expression-during-development/cell/myeloid/in/adrenal)
Wilcoxon ranksum test P-value for gene set overrepresentation: 9.99e-01
Mean rank of genes in gene set: 12892.06
Median rank of genes in gene set: 15511
Rank on gene expression program of top 30 genes in gene set:
| Genes | Weight | Rank | GTEx | DepMap | Descartes | Mean.Counts | Mean.TPM |
|---|---|---|---|---|---|---|---|
| AXL | 0.0044290 | 38 | GTEx | DepMap | Descartes | 1.29 | 243.26 |
| CTSC | 0.0016633 | 283 | GTEx | DepMap | Descartes | 0.55 | 65.57 |
| HRH1 | 0.0008719 | 667 | GTEx | DepMap | Descartes | 0.96 | 122.89 |
| ABCA1 | 0.0006824 | 814 | GTEx | DepMap | Descartes | 2.05 | 110.50 |
| SLC9A9 | 0.0006495 | 851 | GTEx | DepMap | Descartes | 1.61 | 305.31 |
| FGL2 | 0.0003111 | 1459 | GTEx | DepMap | Descartes | 0.14 | 26.96 |
| SLC1A3 | 0.0002913 | 1522 | GTEx | DepMap | Descartes | 0.51 | 72.00 |
| HLA-DRB1 | 0.0000016 | 4224 | GTEx | DepMap | Descartes | 0.10 | 57.28 |
| LGMN | 0.0000015 | 4235 | GTEx | DepMap | Descartes | 0.58 | 154.96 |
| CTSD | -0.0000093 | 6215 | GTEx | DepMap | Descartes | 0.00 | 0.06 |
| RNASE1 | -0.0000141 | 6794 | GTEx | DepMap | Descartes | 0.07 | 46.20 |
| CSF1R | -0.0000648 | 10496 | GTEx | DepMap | Descartes | 0.11 | 18.04 |
| CYBB | -0.0000734 | 10995 | GTEx | DepMap | Descartes | 0.01 | 0.76 |
| MS4A7 | -0.0000862 | 11639 | GTEx | DepMap | Descartes | 0.02 | 3.09 |
| IFNGR1 | -0.0000893 | 11807 | GTEx | DepMap | Descartes | 0.54 | 108.31 |
| CST3 | -0.0000931 | 11980 | GTEx | DepMap | Descartes | 0.70 | 135.70 |
| VSIG4 | -0.0000967 | 12145 | GTEx | DepMap | Descartes | 0.02 | 4.43 |
| MPEG1 | -0.0001002 | 12323 | GTEx | DepMap | Descartes | 0.04 | 6.23 |
| PTPRE | -0.0001176 | 13185 | GTEx | DepMap | Descartes | 1.97 | 217.48 |
| CD14 | -0.0001199 | 13283 | GTEx | DepMap | Descartes | 0.13 | 44.80 |
| C1QC | -0.0001483 | 14564 | GTEx | DepMap | Descartes | 0.06 | 29.74 |
| SPP1 | -0.0001631 | 15143 | GTEx | DepMap | Descartes | 0.64 | 210.40 |
| ITPR2 | -0.0001639 | 15178 | GTEx | DepMap | Descartes | 3.96 | 137.46 |
| MS4A4A | -0.0001672 | 15319 | GTEx | DepMap | Descartes | 0.10 | 28.65 |
| CD163 | -0.0001730 | 15511 | GTEx | DepMap | Descartes | 0.12 | 11.70 |
| RBPJ | -0.0001773 | 15675 | GTEx | DepMap | Descartes | 1.77 | 162.55 |
| CD163L1 | -0.0001790 | 15735 | GTEx | DepMap | Descartes | 0.34 | 28.58 |
| C1QA | -0.0001825 | 15864 | GTEx | DepMap | Descartes | 0.11 | 63.94 |
| SLCO2B1 | -0.0001901 | 16109 | GTEx | DepMap | Descartes | 0.66 | 49.20 |
| FGD2 | -0.0002029 | 16520 | GTEx | DepMap | Descartes | 0.05 | 4.49 |
Descartes Schwann markers
Top 50 marker genes of Schwann cells in the Decartes fetal adrenal single cell map (https://atlas.brotmanbaty.org/bbi/human-gene-expression-during-development/cell/schwann/in/adrenal)
Wilcoxon ranksum test P-value for gene set overrepresentation: 2.59e-01
Mean rank of genes in gene set: 9745.24
Median rank of genes in gene set: 11170
Rank on gene expression program of top 30 genes in gene set:
| Genes | Weight | Rank | GTEx | DepMap | Descartes | Mean.Counts | Mean.TPM |
|---|---|---|---|---|---|---|---|
| COL5A2 | 0.0035144 | 68 | GTEx | DepMap | Descartes | 3.37 | 374.12 |
| GAS7 | 0.0030890 | 96 | GTEx | DepMap | Descartes | 2.48 | 276.58 |
| COL18A1 | 0.0020762 | 202 | GTEx | DepMap | Descartes | 2.52 | 276.73 |
| VCAN | 0.0020448 | 205 | GTEx | DepMap | Descartes | 3.44 | 184.38 |
| LAMC1 | 0.0018036 | 254 | GTEx | DepMap | Descartes | 2.28 | 204.73 |
| VIM | 0.0017931 | 255 | GTEx | DepMap | Descartes | 2.76 | 742.58 |
| ABCA8 | 0.0013144 | 385 | GTEx | DepMap | Descartes | 1.62 | 214.78 |
| FIGN | 0.0008294 | 700 | GTEx | DepMap | Descartes | 1.38 | 108.12 |
| LAMB1 | 0.0007750 | 734 | GTEx | DepMap | Descartes | 1.87 | 246.93 |
| CDH19 | 0.0005681 | 951 | GTEx | DepMap | Descartes | 2.17 | 318.90 |
| LAMA4 | 0.0005448 | 992 | GTEx | DepMap | Descartes | 2.02 | 196.99 |
| XKR4 | 0.0003665 | 1322 | GTEx | DepMap | Descartes | 2.17 | 100.24 |
| COL25A1 | 0.0003107 | 1462 | GTEx | DepMap | Descartes | 0.46 | 38.93 |
| IL1RAPL1 | 0.0003032 | 1488 | GTEx | DepMap | Descartes | 1.42 | 319.88 |
| STARD13 | 0.0002810 | 1549 | GTEx | DepMap | Descartes | 3.80 | 455.87 |
| PLCE1 | 0.0002763 | 1568 | GTEx | DepMap | Descartes | 0.59 | 33.98 |
| EDNRB | 0.0002522 | 1645 | GTEx | DepMap | Descartes | 0.21 | 32.04 |
| PMP22 | 0.0001657 | 2007 | GTEx | DepMap | Descartes | 1.06 | 328.36 |
| GRIK3 | 0.0001092 | 2345 | GTEx | DepMap | Descartes | 0.36 | 33.73 |
| ADAMTS5 | 0.0000872 | 2543 | GTEx | DepMap | Descartes | 0.14 | 9.45 |
| IL1RAPL2 | 0.0000740 | 2679 | GTEx | DepMap | Descartes | 1.46 | 307.54 |
| KCTD12 | 0.0000304 | 3232 | GTEx | DepMap | Descartes | 0.25 | 25.50 |
| PLP1 | -0.0000281 | 8085 | GTEx | DepMap | Descartes | 0.09 | 24.43 |
| GFRA3 | -0.0000491 | 9585 | GTEx | DepMap | Descartes | 0.08 | 31.74 |
| EGFLAM | -0.0000768 | 11170 | GTEx | DepMap | Descartes | 0.46 | 55.07 |
| SFRP1 | -0.0000939 | 12019 | GTEx | DepMap | Descartes | 0.41 | 45.74 |
| MPZ | -0.0001008 | 12352 | GTEx | DepMap | Descartes | 0.07 | 22.96 |
| DST | -0.0001185 | 13212 | GTEx | DepMap | Descartes | 10.01 | 217.26 |
| SOX10 | -0.0001251 | 13527 | GTEx | DepMap | Descartes | 0.06 | 15.95 |
| ZNF536 | -0.0001296 | 13744 | GTEx | DepMap | Descartes | 1.64 | 187.22 |
Descartes Megakaryocytes markers
Top 50 marker genes of Megakaryocytes cells in the Decartes fetal adrenal single cell map (https://atlas.brotmanbaty.org/bbi/human-gene-expression-during-development/cell/megakaryocytes/in/adrenal)
Wilcoxon ranksum test P-value for gene set overrepresentation: 1.95e-03
Mean rank of genes in gene set: 7846.51
Median rank of genes in gene set: 4024
Rank on gene expression program of top 30 genes in gene set:
| Genes | Weight | Rank | GTEx | DepMap | Descartes | Mean.Counts | Mean.TPM |
|---|---|---|---|---|---|---|---|
| SLC2A3 | 0.0040398 | 47 | GTEx | DepMap | Descartes | 3.01 | 544.69 |
| THBS1 | 0.0040045 | 49 | GTEx | DepMap | Descartes | 5.13 | 501.17 |
| PDE3A | 0.0022140 | 180 | GTEx | DepMap | Descartes | 5.43 | 497.63 |
| VCL | 0.0021447 | 194 | GTEx | DepMap | Descartes | 3.45 | 285.81 |
| TPM4 | 0.0019656 | 219 | GTEx | DepMap | Descartes | 2.71 | 392.46 |
| GSN | 0.0017465 | 266 | GTEx | DepMap | Descartes | 1.59 | 192.71 |
| STOM | 0.0016108 | 292 | GTEx | DepMap | Descartes | 0.97 | 179.24 |
| ACTN1 | 0.0012427 | 416 | GTEx | DepMap | Descartes | 2.57 | 342.55 |
| ARHGAP6 | 0.0011829 | 450 | GTEx | DepMap | Descartes | 0.82 | 102.19 |
| LIMS1 | 0.0011666 | 461 | GTEx | DepMap | Descartes | 3.07 | 416.11 |
| RAP1B | 0.0011030 | 496 | GTEx | DepMap | Descartes | 2.65 | 120.77 |
| UBASH3B | 0.0008689 | 669 | GTEx | DepMap | Descartes | 1.09 | 115.94 |
| ZYX | 0.0007167 | 774 | GTEx | DepMap | Descartes | 0.39 | 103.13 |
| FLNA | 0.0006293 | 872 | GTEx | DepMap | Descartes | 0.80 | 63.24 |
| SLC24A3 | 0.0005725 | 946 | GTEx | DepMap | Descartes | 1.12 | 185.06 |
| STON2 | 0.0005667 | 956 | GTEx | DepMap | Descartes | 0.44 | 61.42 |
| HIPK2 | 0.0005656 | 958 | GTEx | DepMap | Descartes | 2.55 | 95.38 |
| TGFB1 | 0.0003377 | 1388 | GTEx | DepMap | Descartes | 0.58 | 139.23 |
| MYH9 | 0.0002255 | 1743 | GTEx | DepMap | Descartes | 3.13 | 217.20 |
| TLN1 | 0.0001604 | 2027 | GTEx | DepMap | Descartes | 0.62 | 38.49 |
| DOK6 | 0.0001071 | 2362 | GTEx | DepMap | Descartes | 1.13 | 67.71 |
| PPBP | 0.0000188 | 3521 | GTEx | DepMap | Descartes | 0.00 | 0.69 |
| CD9 | 0.0000153 | 3622 | GTEx | DepMap | Descartes | 0.89 | 260.44 |
| GP9 | 0.0000146 | 3636 | GTEx | DepMap | Descartes | 0.00 | 0.04 |
| GP1BA | 0.0000047 | 4024 | GTEx | DepMap | Descartes | 0.01 | 3.12 |
| TUBB1 | 0.0000028 | 4134 | GTEx | DepMap | Descartes | 0.02 | 2.33 |
| SPN | 0.0000005 | 4309 | GTEx | DepMap | Descartes | 0.00 | 0.01 |
| PF4 | -0.0000160 | 6996 | GTEx | DepMap | Descartes | 0.00 | 0.19 |
| ITGB3 | -0.0000502 | 9654 | GTEx | DepMap | Descartes | 0.00 | 0.03 |
| ANGPT1 | -0.0000579 | 10114 | GTEx | DepMap | Descartes | 0.22 | 32.37 |
Descartes Lyphoid markers
Top 50 marker genes of Lyphoid cells in the Decartes fetal adrenal single cell map (https://atlas.brotmanbaty.org/bbi/human-gene-expression-during-development/cell/lymphoid/in/adrenal)
Wilcoxon ranksum test P-value for gene set overrepresentation: 9.61e-01
Mean rank of genes in gene set: 11817.57
Median rank of genes in gene set: 14948
Rank on gene expression program of top 30 genes in gene set:
| Genes | Weight | Rank | GTEx | DepMap | Descartes | Mean.Counts | Mean.TPM |
|---|---|---|---|---|---|---|---|
| NCALD | 0.0031868 | 84 | GTEx | DepMap | Descartes | 1.69 | 334.68 |
| ARID5B | 0.0030242 | 103 | GTEx | DepMap | Descartes | 3.18 | 282.33 |
| CELF2 | 0.0025269 | 150 | GTEx | DepMap | Descartes | 4.01 | 410.73 |
| MBNL1 | 0.0014335 | 340 | GTEx | DepMap | Descartes | 8.27 | 809.80 |
| BACH2 | 0.0011114 | 489 | GTEx | DepMap | Descartes | 4.83 | 296.21 |
| CD44 | 0.0010842 | 503 | GTEx | DepMap | Descartes | 3.01 | 341.30 |
| PITPNC1 | 0.0009122 | 627 | GTEx | DepMap | Descartes | 5.11 | 499.41 |
| ABLIM1 | 0.0006476 | 855 | GTEx | DepMap | Descartes | 4.92 | 279.00 |
| MSN | 0.0006186 | 885 | GTEx | DepMap | Descartes | 1.11 | 185.21 |
| IFI16 | 0.0006078 | 892 | GTEx | DepMap | Descartes | 0.81 | 138.03 |
| FYN | 0.0002367 | 1699 | GTEx | DepMap | Descartes | 2.72 | 401.49 |
| FOXP1 | 0.0001984 | 1849 | GTEx | DepMap | Descartes | 0.39 | 25.03 |
| ITPKB | 0.0001945 | 1869 | GTEx | DepMap | Descartes | 0.57 | 68.33 |
| EVL | 0.0001560 | 2048 | GTEx | DepMap | Descartes | 2.28 | 319.54 |
| ETS1 | 0.0000882 | 2532 | GTEx | DepMap | Descartes | 1.05 | 137.79 |
| BCL2 | 0.0000743 | 2676 | GTEx | DepMap | Descartes | 5.35 | 383.92 |
| SAMD3 | 0.0000270 | 3323 | GTEx | DepMap | Descartes | 0.34 | 57.20 |
| NKG7 | -0.0000751 | 11088 | GTEx | DepMap | Descartes | 0.01 | 10.58 |
| WIPF1 | -0.0000957 | 12093 | GTEx | DepMap | Descartes | 1.09 | 155.14 |
| SP100 | -0.0001205 | 13307 | GTEx | DepMap | Descartes | 1.23 | 124.85 |
| PLEKHA2 | -0.0001274 | 13638 | GTEx | DepMap | Descartes | 0.74 | 88.49 |
| CCL5 | -0.0001310 | 13806 | GTEx | DepMap | Descartes | 0.04 | 22.40 |
| ARHGAP15 | -0.0001382 | 14116 | GTEx | DepMap | Descartes | 1.61 | 378.89 |
| HLA-A | -0.0001581 | 14948 | GTEx | DepMap | Descartes | 0.77 | 81.34 |
| ARHGDIB | -0.0002096 | 16703 | GTEx | DepMap | Descartes | 0.09 | 49.23 |
| PRKCH | -0.0002109 | 16741 | GTEx | DepMap | Descartes | 1.09 | 180.15 |
| HLA-C | -0.0002117 | 16758 | GTEx | DepMap | Descartes | 0.32 | 95.18 |
| MCTP2 | -0.0002349 | 17406 | GTEx | DepMap | Descartes | 0.39 | 24.33 |
| HLA-B | -0.0002381 | 17485 | GTEx | DepMap | Descartes | 0.55 | 198.26 |
| CCND3 | -0.0003173 | 18967 | GTEx | DepMap | Descartes | 1.01 | 237.18 |
Embryonic Pausing Signatures Up
Embryonic pausing signature upregulated genes from Supplementary Table 6 of Rehman et al. Cell 2021. These genes are upregulated in paused ESCs and diapaused embryos.
Wilcoxon ranksum test P-value for gene set overrepresentation: 6.68e-01
Mean rank of genes in gene set: 10995.79
Median rank of genes in gene set: 12829
Rank on gene expression program of top 30 genes in gene set:
| Genes | Weight | Rank | GTEx | DepMap | Descartes | Mean.Counts | Mean.TPM |
|---|---|---|---|---|---|---|---|
| YPEL2 | 0.0006626 | 839 | GTEx | DepMap | Descartes | 0.90 | 91.93 |
| SPRY1 | 0.0003414 | 1378 | GTEx | DepMap | Descartes | 0.46 | 113.18 |
| CTSL | 0.0000926 | 2493 | GTEx | DepMap | Descartes | 0.57 | NA |
| ACSS1 | 0.0000386 | 3107 | GTEx | DepMap | Descartes | 0.10 | 14.82 |
| LY6G6E | 0.0000000 | 4798 | GTEx | DepMap | Descartes | 0.00 | 0.00 |
| HEXA | -0.0000604 | 10249 | GTEx | DepMap | Descartes | 0.04 | 2.87 |
| ALDH6A1 | -0.0001073 | 12674 | GTEx | DepMap | Descartes | 0.15 | 12.69 |
| HEXB | -0.0001136 | 12984 | GTEx | DepMap | Descartes | 0.39 | 93.97 |
| APOE | -0.0001655 | 15257 | GTEx | DepMap | Descartes | 1.80 | 823.62 |
| RENBP | -0.0001738 | 15547 | GTEx | DepMap | Descartes | 0.06 | 21.66 |
| CCNG2 | -0.0002581 | 17978 | GTEx | DepMap | Descartes | 0.20 | 19.59 |
| DPP7 | -0.0002606 | 18021 | GTEx | DepMap | Descartes | 0.23 | 70.79 |
| PDCD4 | -0.0003072 | 18849 | GTEx | DepMap | Descartes | 0.70 | 94.67 |
| AUH | -0.0004088 | 19767 | GTEx | DepMap | Descartes | 1.40 | 385.82 |
Embryonic Pausing Signatures Down
Embryonic pausing signature downregulated genes from Supplementary Table 6 of Rehman et al. Cell 2021. These genes are downregulated in paused ESCs and diapaused embryos.
Wilcoxon ranksum test P-value for gene set overrepresentation: 1.00e+00
Mean rank of genes in gene set: 12952.85
Median rank of genes in gene set: 14326
Rank on gene expression program of top 30 genes in gene set:
| Genes | Weight | Rank | GTEx | DepMap | Descartes | Mean.Counts | Mean.TPM |
|---|---|---|---|---|---|---|---|
| DUSP14 | 0.0006712 | 829 | GTEx | DepMap | Descartes | 0.20 | 47.41 |
| SMS | 0.0006653 | 836 | GTEx | DepMap | Descartes | 1.00 | 345.61 |
| LDHA | 0.0003985 | 1258 | GTEx | DepMap | Descartes | 0.71 | 168.92 |
| EIF3B | 0.0003122 | 1456 | GTEx | DepMap | Descartes | 0.78 | 114.20 |
| PPA1 | 0.0002045 | 1819 | GTEx | DepMap | Descartes | 1.04 | 149.57 |
| HDLBP | 0.0001877 | 1892 | GTEx | DepMap | Descartes | 1.30 | 110.86 |
| ANKRD37 | 0.0001872 | 1897 | GTEx | DepMap | Descartes | 0.08 | 32.59 |
| MGMT | 0.0001583 | 2036 | GTEx | DepMap | Descartes | 1.13 | 121.09 |
| MRPL12 | 0.0000343 | 3167 | GTEx | DepMap | Descartes | 0.00 | 0.02 |
| HILPDA | 0.0000218 | 3442 | GTEx | DepMap | Descartes | 0.07 | 28.24 |
| TOMM40 | 0.0000154 | 3619 | GTEx | DepMap | Descartes | 0.19 | 28.30 |
| PMF1 | 0.0000151 | 3628 | GTEx | DepMap | Descartes | 0.00 | 0.29 |
| TMEM109 | 0.0000067 | 3935 | GTEx | DepMap | Descartes | 0.07 | 19.30 |
| SEC13 | 0.0000031 | 4110 | GTEx | DepMap | Descartes | 0.35 | 81.47 |
| DGCR6 | -0.0000049 | 5589 | GTEx | DepMap | Descartes | 0.00 | 0.05 |
| BYSL | -0.0000059 | 5742 | GTEx | DepMap | Descartes | 0.04 | 12.84 |
| NUDC | -0.0000193 | 7342 | GTEx | DepMap | Descartes | 0.38 | 108.38 |
| CITED1 | -0.0000196 | 7367 | GTEx | DepMap | Descartes | 0.00 | 0.08 |
| UBE2V1 | -0.0000276 | 8053 | GTEx | DepMap | Descartes | 0.02 | 3.11 |
| TOMM40L | -0.0000339 | 8553 | GTEx | DepMap | Descartes | 0.04 | 6.73 |
| GNG10 | -0.0000422 | 9155 | GTEx | DepMap | Descartes | 0.00 | 1.19 |
| PELO | -0.0000432 | 9219 | GTEx | DepMap | Descartes | 0.00 | 0.03 |
| PSMB10 | -0.0000507 | 9685 | GTEx | DepMap | Descartes | 0.02 | 9.01 |
| DPH3 | -0.0000522 | 9782 | GTEx | DepMap | Descartes | 0.07 | 8.72 |
| BRMS1 | -0.0000589 | 10174 | GTEx | DepMap | Descartes | 0.06 | 17.73 |
| DRG2 | -0.0000661 | 10570 | GTEx | DepMap | Descartes | 0.11 | 10.69 |
| NAA10 | -0.0000744 | 11053 | GTEx | DepMap | Descartes | 0.03 | 10.09 |
| ID3 | -0.0000775 | 11204 | GTEx | DepMap | Descartes | 0.30 | 167.50 |
| YKT6 | -0.0000810 | 11380 | GTEx | DepMap | Descartes | 0.14 | 24.60 |
| EXOSC2 | -0.0000811 | 11382 | GTEx | DepMap | Descartes | 0.09 | 16.29 |
Below shows the ranks on this GEP for immune marker gene lists curated by CellTypist (https://www.celltypist.org/encyclopedia).
High ranks indicate this gene is a driver of this GEP.
These curated gene list are ranked by P-value (on this GEP) of their constituent genes.
The Mean Count column shows the mean read count in cells scoring highly (H > 50) on this gene expression program.
Fibroblasts: Fibroblasts (model markers)
the most common cells of connective tissues which synthesize the extracellular matrix and collagen to maintain tissue homeostasis:
Wilcoxon ranksum test P-value for gene set overrepresentation: 1.08e-04
Mean rank of genes in gene set: 3340.9
Rank on gene expression program of genes in gene set:
| Genes | Weight | Rank | GTEx | DepMap | Decartes | Mean.Counts | Mean.TPM |
|---|---|---|---|---|---|---|---|
| PRRX1 | 0.0044597 | 37 | GTEx | DepMap | Descartes | 1.66 | 335.61 |
| NTRK2 | 0.0026102 | 144 | GTEx | DepMap | Descartes | 0.90 | 75.75 |
| SMOC2 | 0.0016188 | 290 | GTEx | DepMap | Descartes | 0.92 | 225.60 |
| EBF2 | 0.0009593 | 583 | GTEx | DepMap | Descartes | 1.33 | 233.77 |
| PDGFRA | 0.0004345 | 1193 | GTEx | DepMap | Descartes | 0.16 | 17.02 |
| MXRA5 | 0.0001804 | 1925 | GTEx | DepMap | Descartes | 0.16 | 9.60 |
| ANGPTL1 | 0.0001034 | 2394 | GTEx | DepMap | Descartes | 0.17 | 25.90 |
| F10 | 0.0000834 | 2579 | GTEx | DepMap | Descartes | 0.07 | 19.68 |
| SFRP1 | -0.0000939 | 12019 | GTEx | DepMap | Descartes | 0.41 | 45.74 |
| OLFML1 | -0.0000986 | 12245 | GTEx | DepMap | Descartes | 0.03 | 6.46 |
ILC: ILC (curated markers)
specialised innate immune cells from the lymphoid lineage but without antigen-specific T-cell receptors on the surface:
Wilcoxon ranksum test P-value for gene set overrepresentation: 5.37e-03
Mean rank of genes in gene set: 1541.67
Rank on gene expression program of genes in gene set:
| Genes | Weight | Rank | GTEx | DepMap | Decartes | Mean.Counts | Mean.TPM |
|---|---|---|---|---|---|---|---|
| TLE1 | 0.0008481 | 681 | GTEx | DepMap | Descartes | 1.22 | 176.48 |
| AREG | 0.0002052 | 1813 | GTEx | DepMap | Descartes | 0.10 | 65.45 |
| S100A13 | 0.0001422 | 2131 | GTEx | DepMap | Descartes | 0.12 | 32.75 |
Double-negative thymocytes: Double-negative thymocytes (curated markers)
the early immature thymocytes from the thymus in the double negative (co-receptors CD4- and CD8-) stage:
Wilcoxon ranksum test P-value for gene set overrepresentation: 1.16e-02
Mean rank of genes in gene set: 2502.67
Rank on gene expression program of genes in gene set:
| Genes | Weight | Rank | GTEx | DepMap | Decartes | Mean.Counts | Mean.TPM |
|---|---|---|---|---|---|---|---|
| CD99 | 0.0003021 | 1492 | GTEx | DepMap | Descartes | 0.77 | 379.12 |
| HES1 | 0.0000834 | 2580 | GTEx | DepMap | Descartes | 0.19 | 63.08 |
| FXYD2 | 0.0000222 | 3436 | GTEx | DepMap | Descartes | 0.00 | 0.76 |