Program: 31. Cancer-Associated Fibroblasts.
Program description and justification of annotation generated by GPT5: Perivascular mural/pericyte and myofibroblastic CAF program (vascular smooth muscle-like).
Submit a comment on this gene expression program's interpretation: CLICK
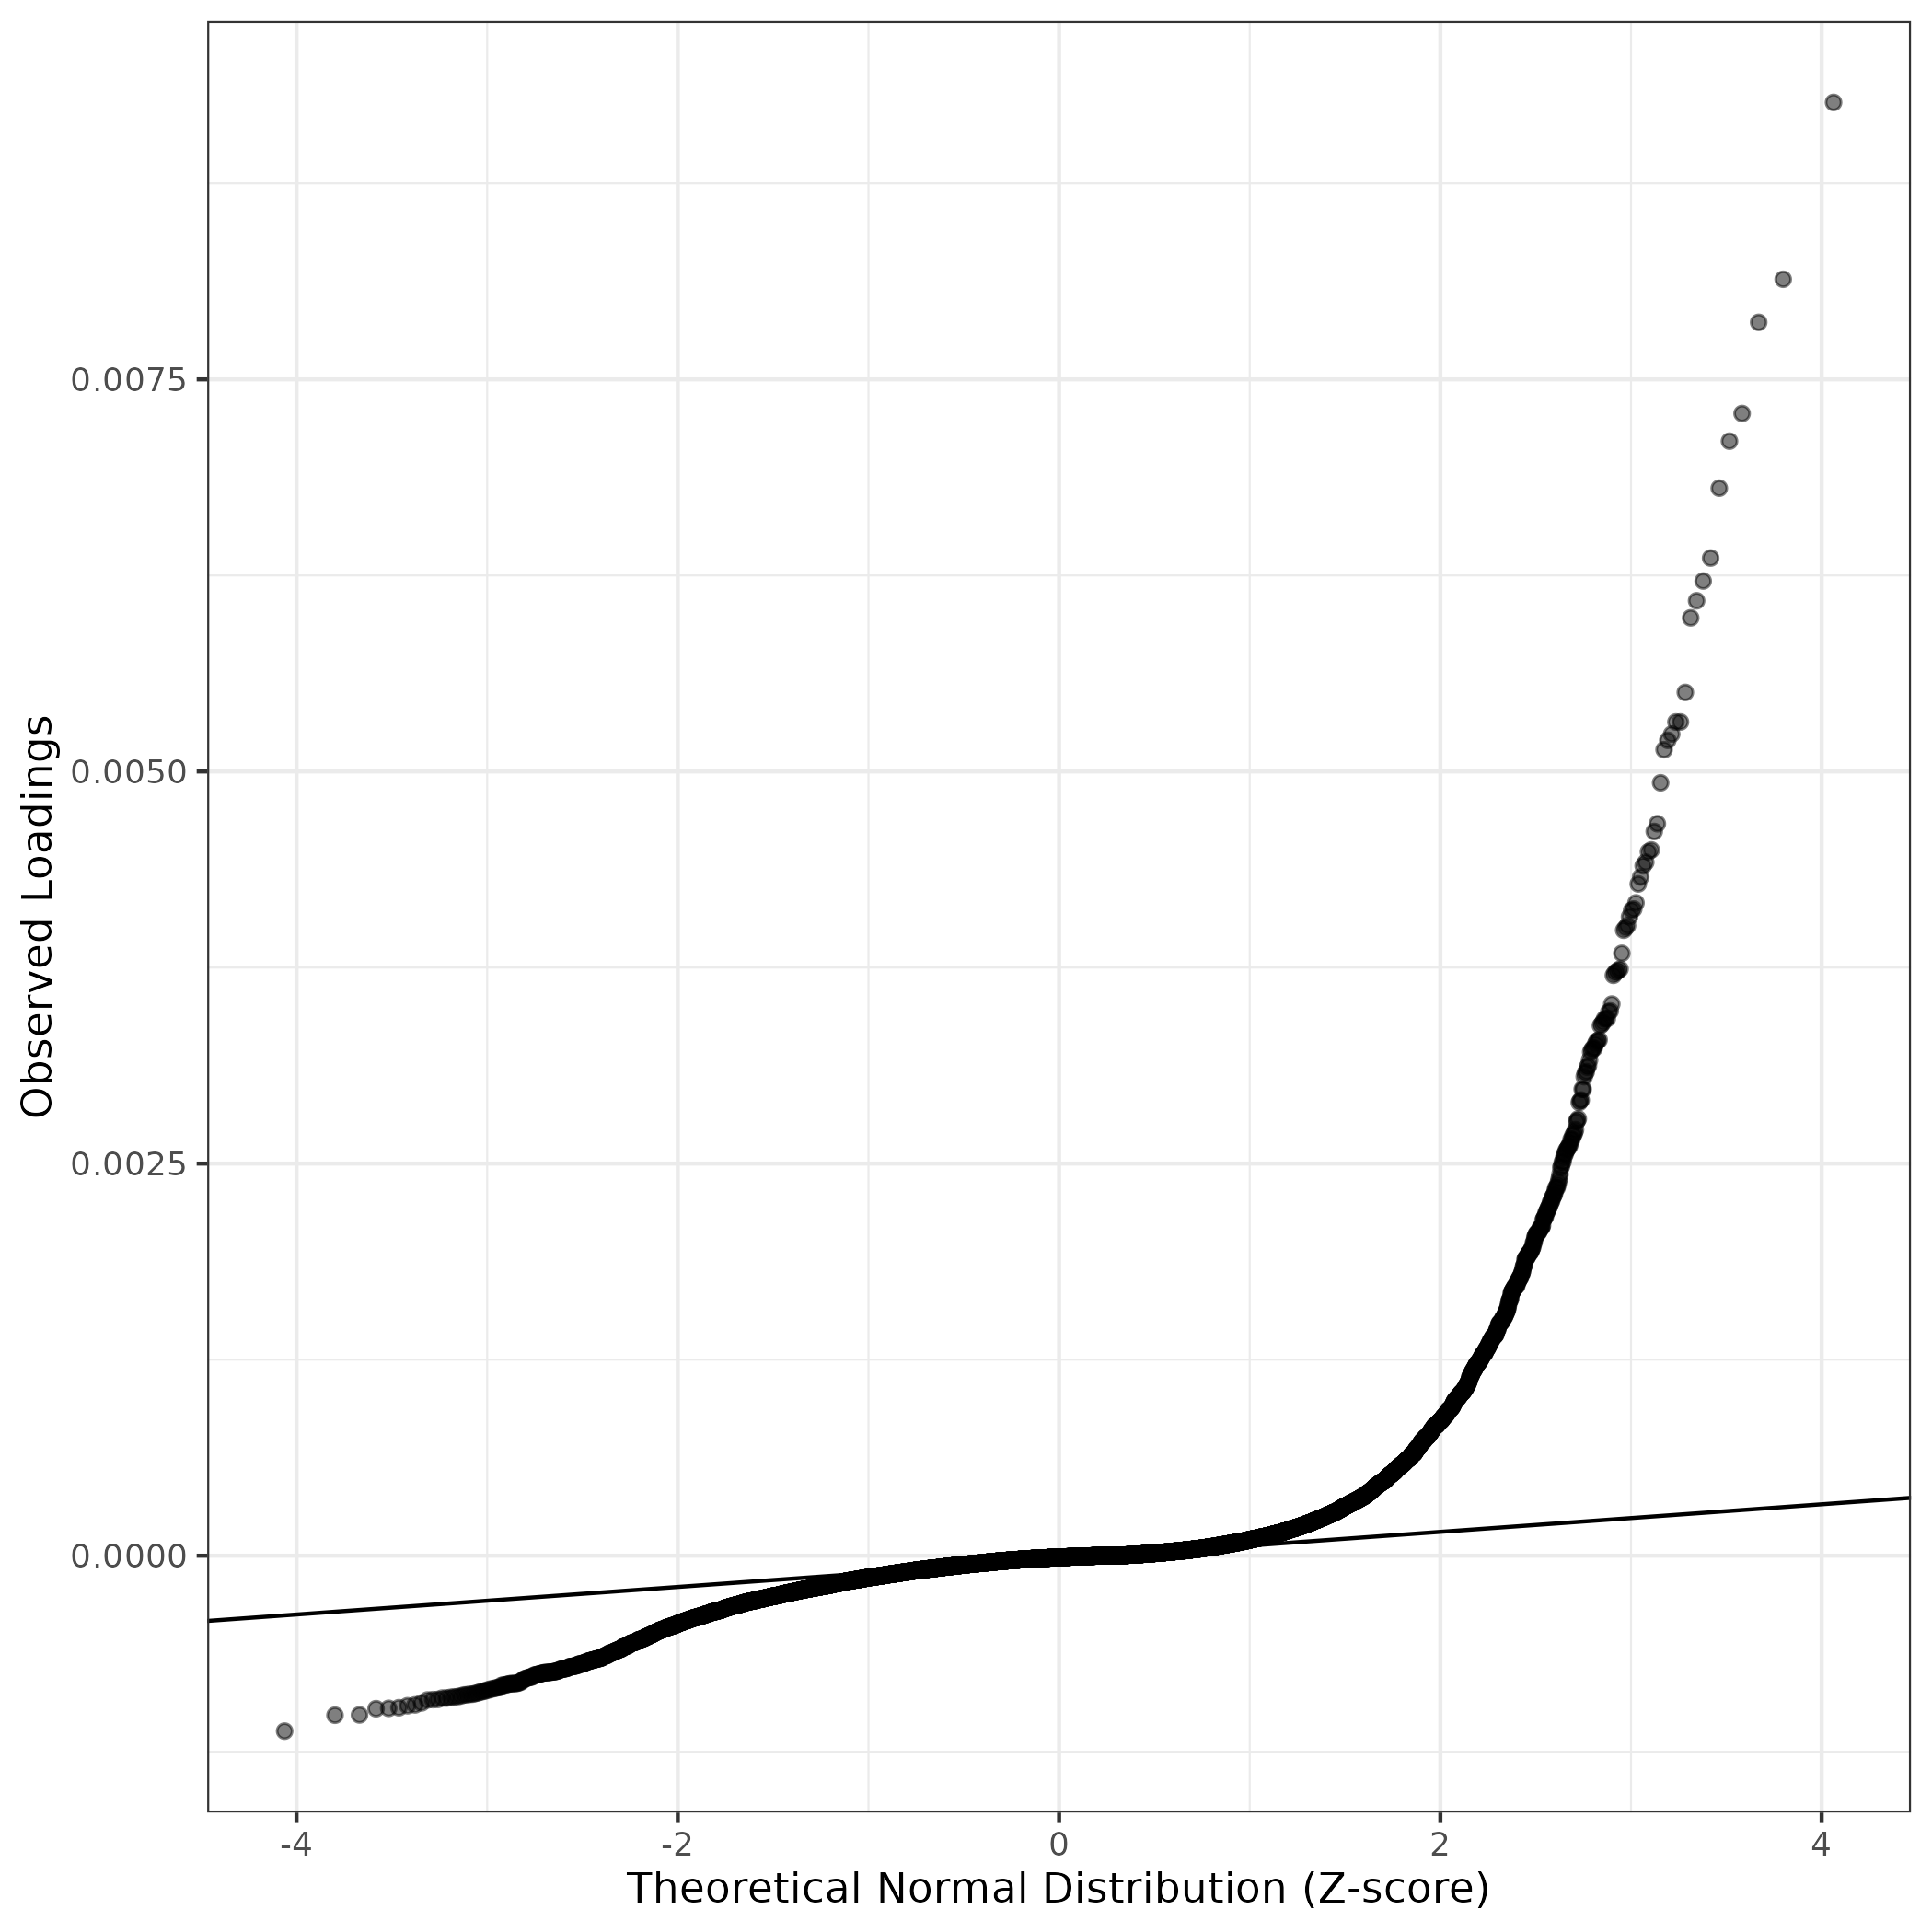
QQ-plot of gene loadings, averaged over both independent splits of the data
This plot highlights the relative contribution of each gene to the GEP
Top genes driving this program.
Note: Decartes website is buggy, try refreshing. Also, Decartes fetal adrenal data have been collected at specific time points (89-122 days), all possible cell types of interest may not be represented, do not overinterpret.
The Mean Count column shows the mean read count in cells scoring highly (H > 50) on this gene expression program.
| Gene | Loading | Gene.Name | GTEx | DepMap | Descartes | Mean.Counts | Mean.Tpm | |
|---|---|---|---|---|---|---|---|---|
| 1 | PDGFRB | 0.0092657 | platelet derived growth factor receptor beta | GTEx | DepMap | Descartes | 2.47 | 355.96 |
| 2 | CCDC102B | 0.0081381 | coiled-coil domain containing 102B | GTEx | DepMap | Descartes | 8.98 | 2569.01 |
| 3 | NOTCH3 | 0.0078635 | notch receptor 3 | GTEx | DepMap | Descartes | 1.20 | 121.25 |
| 4 | UACA | 0.0072823 | uveal autoantigen with coiled-coil domains and ankyrin repeats | GTEx | DepMap | Descartes | 5.98 | 631.89 |
| 5 | PRKG1 | 0.0071061 | protein kinase cGMP-dependent 1 | GTEx | DepMap | Descartes | 17.79 | 1873.76 |
| 6 | PLXDC1 | 0.0068063 | plexin domain containing 1 | GTEx | DepMap | Descartes | 1.23 | 168.26 |
| 7 | RNF152 | 0.0063609 | ring finger protein 152 | GTEx | DepMap | Descartes | 2.55 | 214.71 |
| 8 | EDNRA | 0.0062143 | endothelin receptor type A | GTEx | DepMap | Descartes | 1.42 | 255.37 |
| 9 | ENPEP | 0.0060884 | glutamyl aminopeptidase | GTEx | DepMap | Descartes | 1.27 | 145.07 |
| 10 | ANO1 | 0.0059796 | anoctamin 1 | GTEx | DepMap | Descartes | 1.48 | 235.16 |
| 11 | COL18A1 | 0.0055041 | collagen type XVIII alpha 1 chain | GTEx | DepMap | Descartes | 3.67 | 411.97 |
| 12 | ABCC9 | 0.0053157 | ATP binding cassette subfamily C member 9 | GTEx | DepMap | Descartes | 0.74 | 69.71 |
| 13 | EPS8 | 0.0053155 | EGFR pathway substrate 8, signaling adaptor | GTEx | DepMap | Descartes | 5.53 | 807.95 |
| 14 | PDE1A | 0.0052383 | phosphodiesterase 1A | GTEx | DepMap | Descartes | 3.65 | 517.54 |
| 15 | GUCY1A2 | 0.0051988 | guanylate cyclase 1 soluble subunit alpha 2 | GTEx | DepMap | Descartes | 2.28 | 105.28 |
| 16 | HEYL | 0.0051389 | hes related family bHLH transcription factor with YRPW motif like | GTEx | DepMap | Descartes | 0.83 | 151.42 |
| 17 | LHFPL6 | 0.0049279 | LHFPL tetraspan subfamily member 6 | GTEx | DepMap | Descartes | 9.98 | NA |
| 18 | CACNA1C | 0.0046669 | calcium voltage-gated channel subunit alpha1 C | GTEx | DepMap | Descartes | 9.38 | 473.32 |
| 19 | SPECC1 | 0.0046175 | sperm antigen with calponin homology and coiled-coil domains 1 | GTEx | DepMap | Descartes | 1.77 | 158.44 |
| 20 | ITGA1 | 0.0045000 | integrin subunit alpha 1 | GTEx | DepMap | Descartes | 5.91 | 361.85 |
| 21 | ADGRF5 | 0.0044881 | adhesion G protein-coupled receptor F5 | GTEx | DepMap | Descartes | 2.36 | NA |
| 22 | GUCY1A1 | 0.0044214 | guanylate cyclase 1 soluble subunit alpha 1 | GTEx | DepMap | Descartes | 2.37 | NA |
| 23 | NEURL1B | 0.0043987 | neuralized E3 ubiquitin protein ligase 1B | GTEx | DepMap | Descartes | 0.79 | 98.22 |
| 24 | COL5A3 | 0.0043273 | collagen type V alpha 3 chain | GTEx | DepMap | Descartes | 0.61 | 85.50 |
| 25 | COL4A2 | 0.0042830 | collagen type IV alpha 2 chain | GTEx | DepMap | Descartes | 9.48 | 1043.05 |
| 26 | TRPC4 | 0.0041622 | transient receptor potential cation channel subfamily C member 4 | GTEx | DepMap | Descartes | 0.66 | 57.10 |
| 27 | STEAP4 | 0.0041233 | STEAP4 metalloreductase | GTEx | DepMap | Descartes | 0.38 | 29.32 |
| 28 | SEMA5B | 0.0041148 | semaphorin 5B | GTEx | DepMap | Descartes | 0.42 | 73.62 |
| 29 | KIRREL1 | 0.0040736 | kirre like nephrin family adhesion molecule 1 | GTEx | DepMap | Descartes | 1.47 | NA |
| 30 | COL4A1 | 0.0040172 | collagen type IV alpha 1 chain | GTEx | DepMap | Descartes | 10.82 | 1150.26 |
| 31 | TRPC6 | 0.0040030 | transient receptor potential cation channel subfamily C member 6 | GTEx | DepMap | Descartes | 0.54 | 90.07 |
| 32 | SEMA5A | 0.0039881 | semaphorin 5A | GTEx | DepMap | Descartes | 3.24 | 199.70 |
| 33 | PEAK1 | 0.0038406 | pseudopodium enriched atypical kinase 1 | GTEx | DepMap | Descartes | 5.84 | NA |
| 34 | PIEZO2 | 0.0037406 | piezo type mechanosensitive ion channel component 2 | GTEx | DepMap | Descartes | 2.12 | 157.05 |
| 35 | EBF2 | 0.0037318 | EBF transcription factor 2 | GTEx | DepMap | Descartes | 1.87 | 272.71 |
| 36 | SLC6A1 | 0.0037249 | solute carrier family 6 member 1 | GTEx | DepMap | Descartes | 0.35 | 36.68 |
| 37 | PDE3A | 0.0037155 | phosphodiesterase 3A | GTEx | DepMap | Descartes | 7.15 | 621.34 |
| 38 | ARHGEF17 | 0.0037006 | Rho guanine nucleotide exchange factor 17 | GTEx | DepMap | Descartes | 0.86 | 81.49 |
| 39 | ADAMTS14 | 0.0035170 | ADAM metallopeptidase with thrombospondin type 1 motif 14 | GTEx | DepMap | Descartes | 0.27 | 40.40 |
| 40 | CSPG4 | 0.0034733 | chondroitin sulfate proteoglycan 4 | GTEx | DepMap | Descartes | 0.20 | 21.39 |
| 41 | IGFBP7 | 0.0034665 | insulin like growth factor binding protein 7 | GTEx | DepMap | Descartes | 14.78 | 6708.68 |
| 42 | CALD1 | 0.0034248 | caldesmon 1 | GTEx | DepMap | Descartes | 12.46 | 1676.00 |
| 43 | RCAN2 | 0.0034244 | regulator of calcineurin 2 | GTEx | DepMap | Descartes | 1.52 | 336.65 |
| 44 | NGF | 0.0034217 | nerve growth factor | GTEx | DepMap | Descartes | 0.47 | 350.47 |
| 45 | ARHGAP6 | 0.0034017 | Rho GTPase activating protein 6 | GTEx | DepMap | Descartes | 1.46 | 177.81 |
| 46 | COL6A2 | 0.0033889 | collagen type VI alpha 2 chain | GTEx | DepMap | Descartes | 2.83 | 574.80 |
| 47 | FRY | 0.0033797 | FRY microtubule binding protein | GTEx | DepMap | Descartes | 4.31 | 207.56 |
| 48 | NHSL2 | 0.0032892 | NHS like 2 | GTEx | DepMap | Descartes | 1.45 | 75.55 |
| 49 | JAG1 | 0.0032844 | jagged canonical Notch ligand 1 | GTEx | DepMap | Descartes | 1.48 | 169.88 |
| 50 | ARHGAP42 | 0.0032771 | Rho GTPase activating protein 42 | GTEx | DepMap | Descartes | 2.57 | 218.54 |
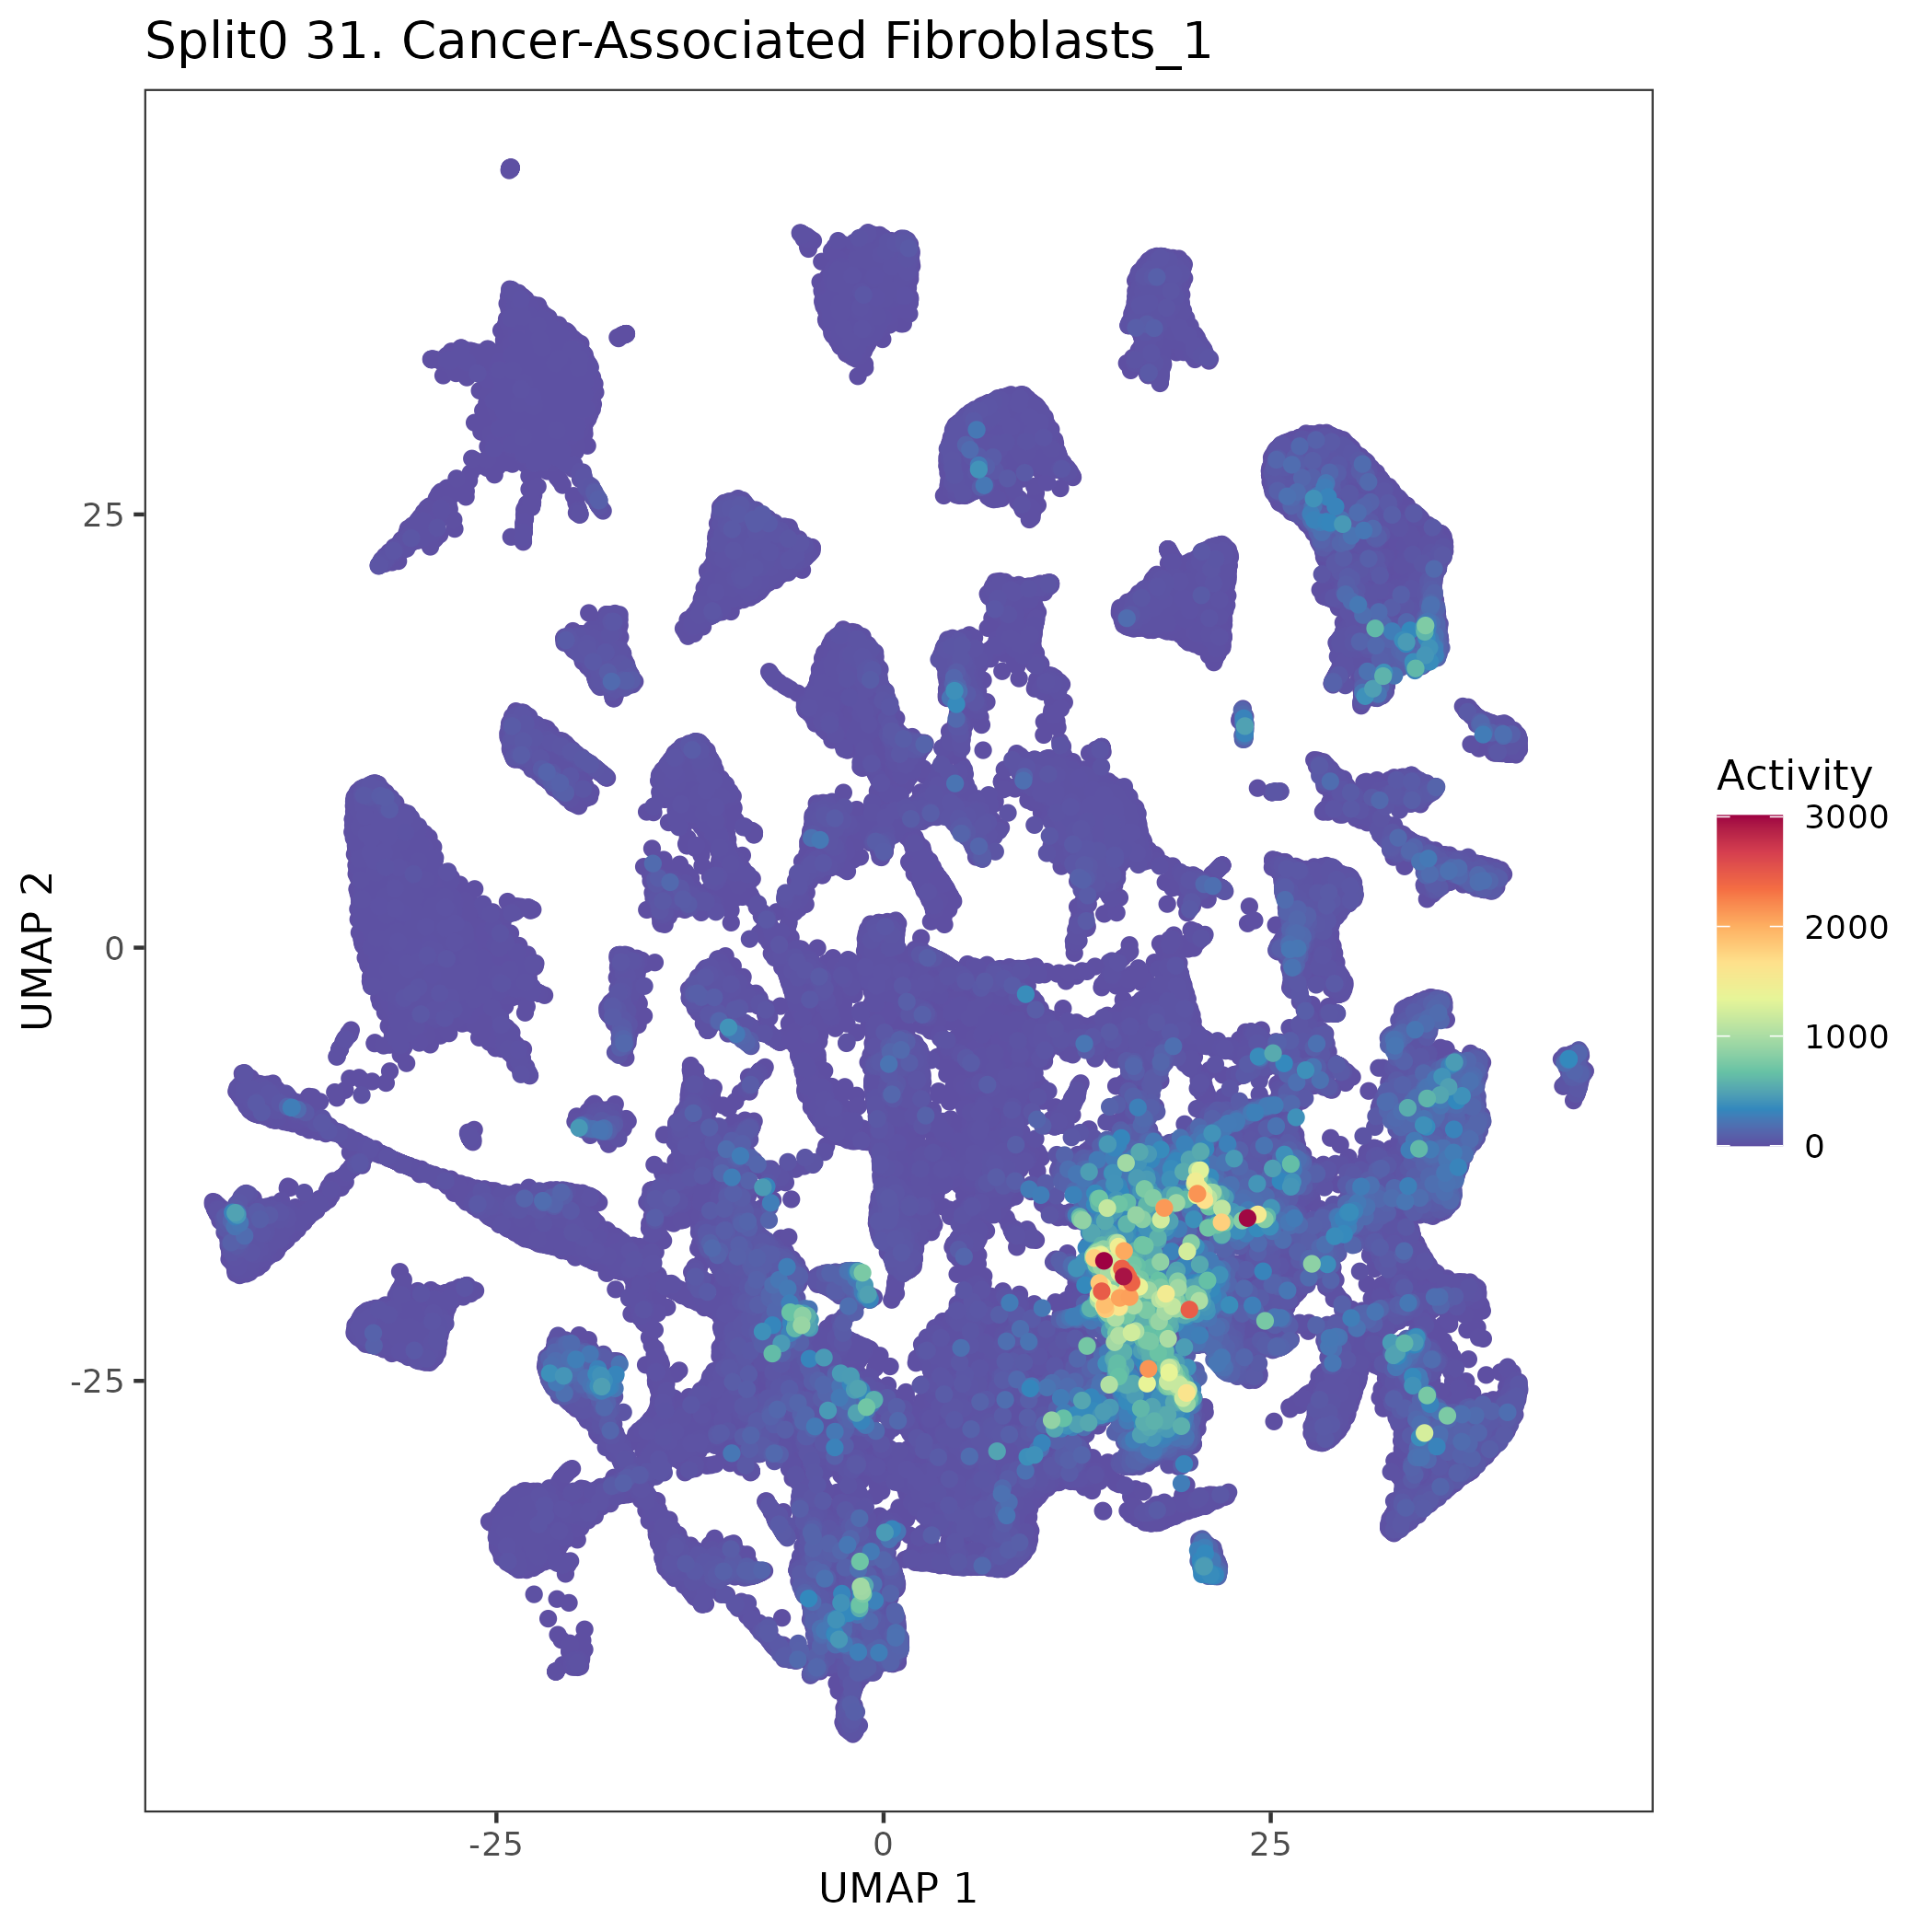
UMAP plots showing activity of gene expression program identified in GEP 31. Cancer-Associated Fibroblasts:
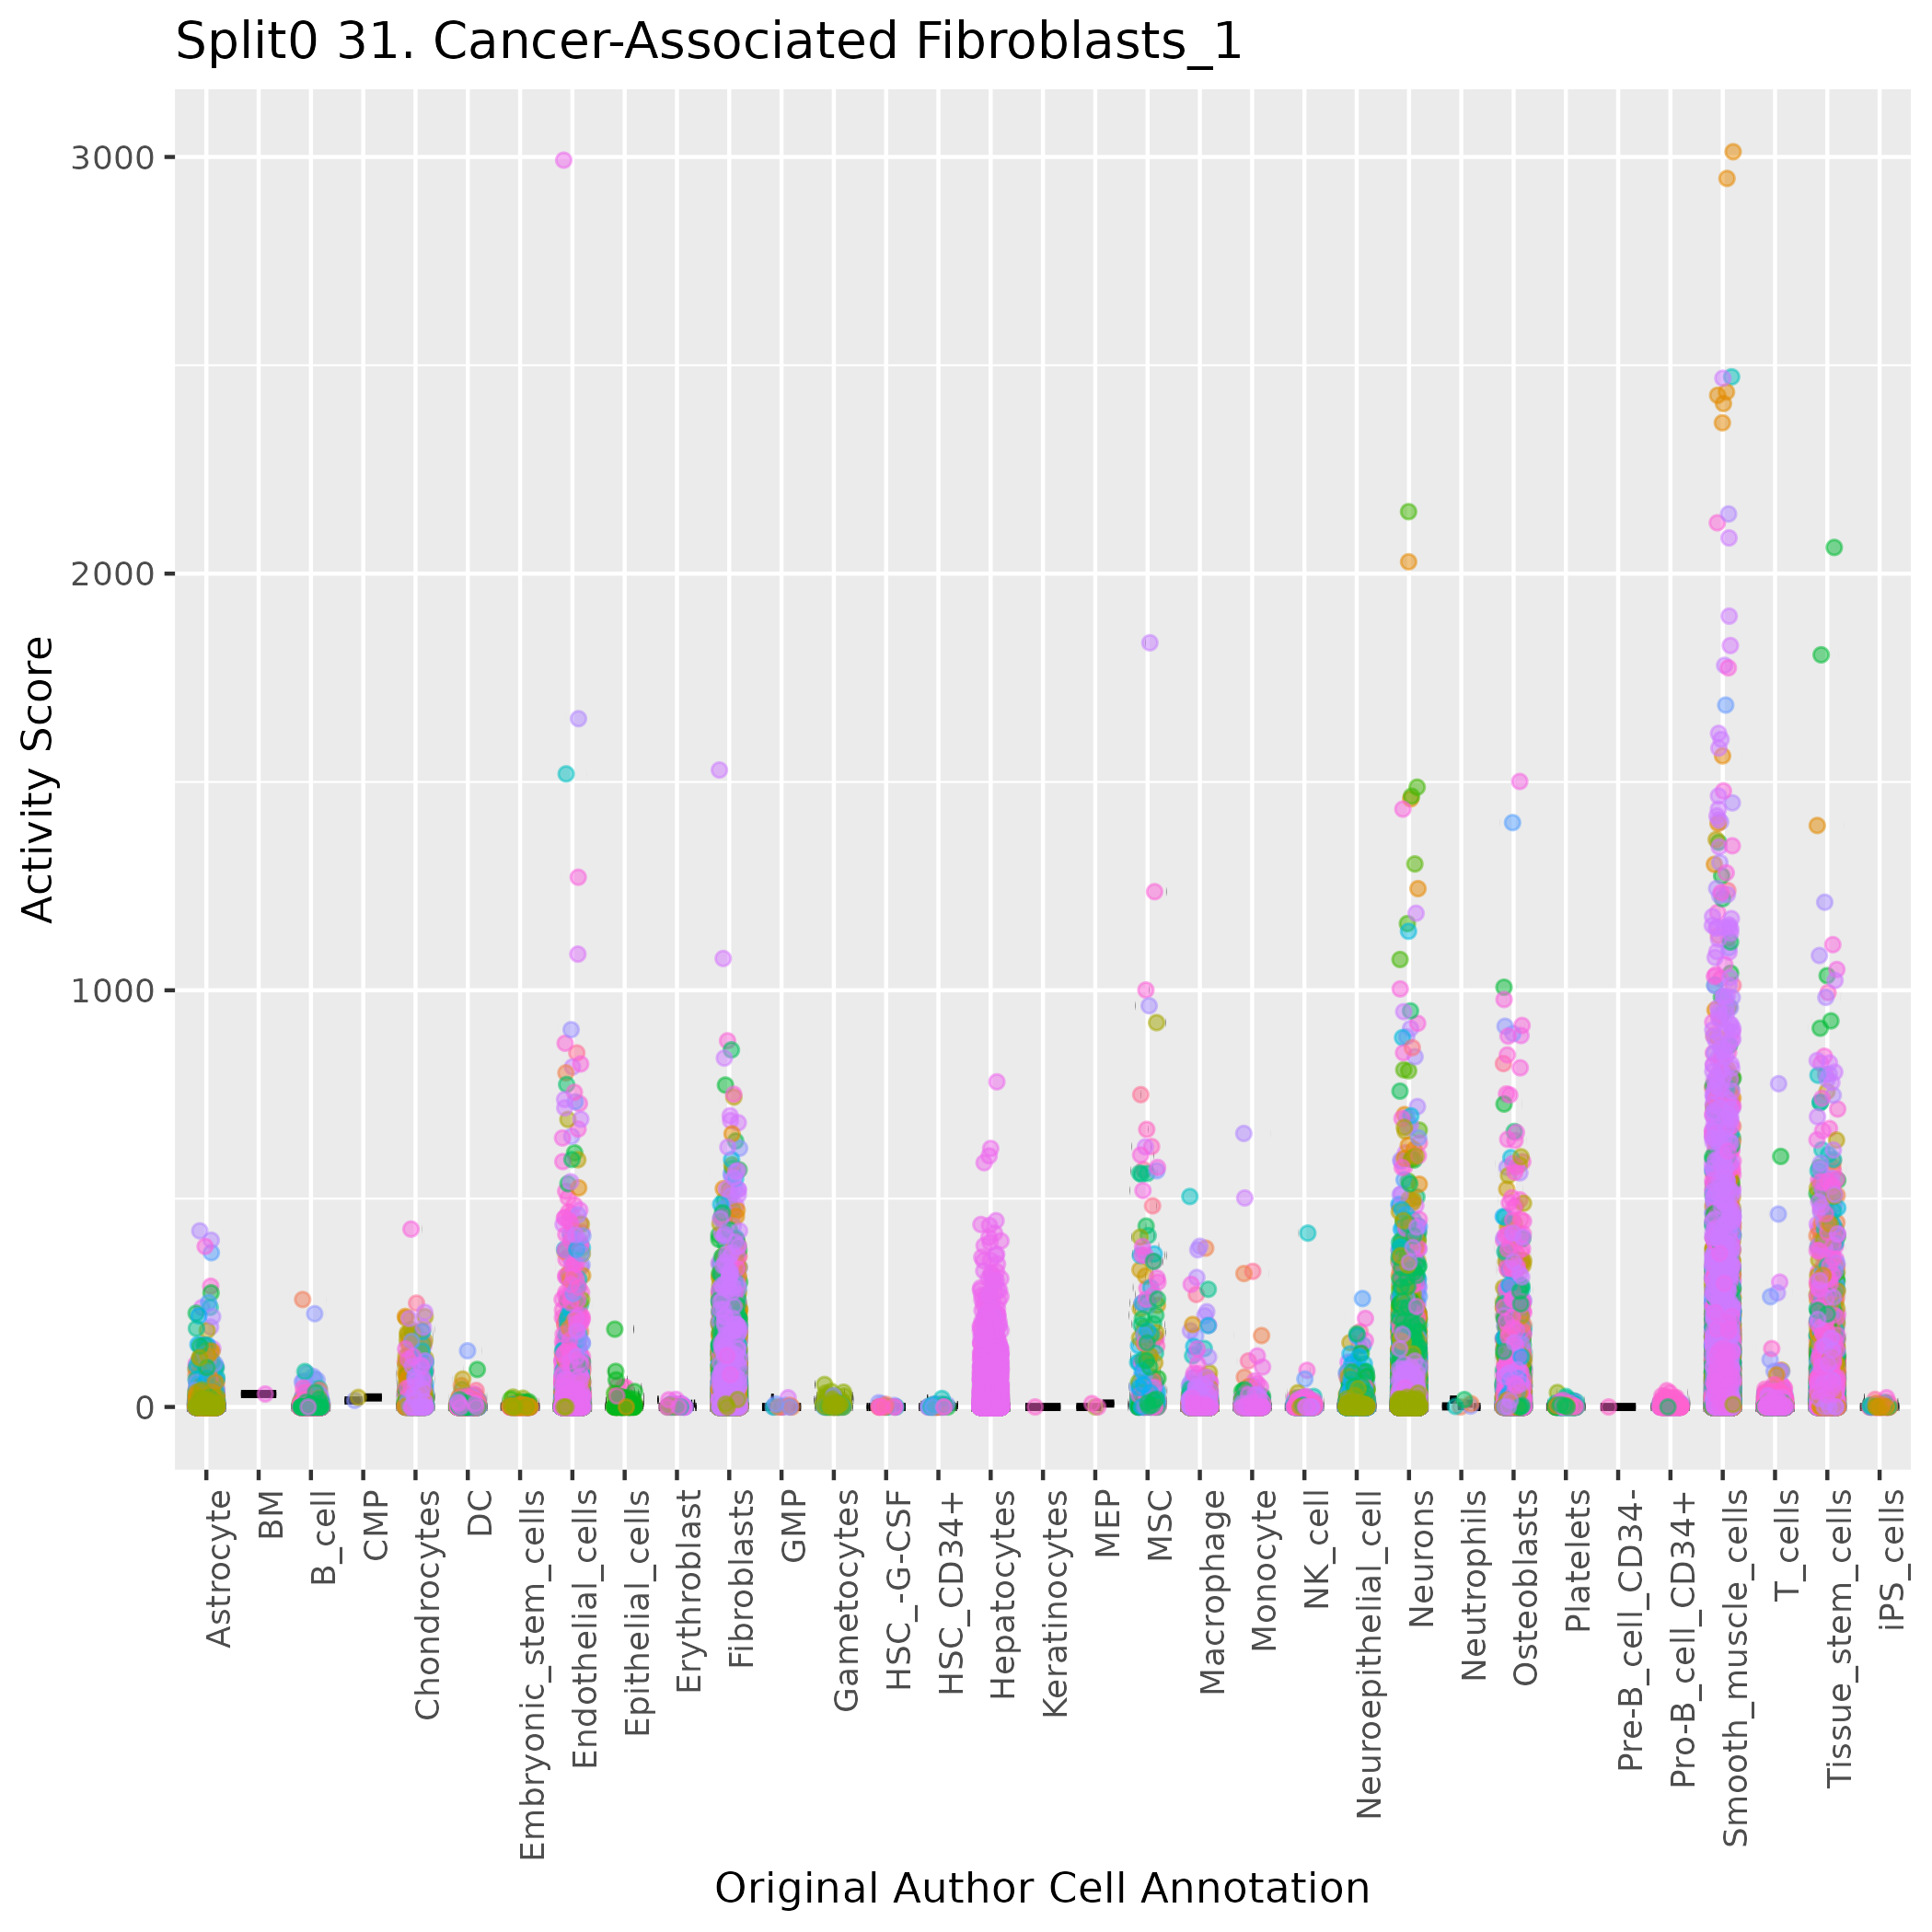
Boxlot showing activity of gene expression program identified in GEP 31. Cancer-Associated Fibroblasts:
Gene set Enrichments for this program, caculated from top 50 genes
mSigDB Cell Types Gene Set:
| P-value | OR | Lower 95% CI | FDR | FWER | Genes Found | Gene Set Size | |
|---|---|---|---|---|---|---|---|
| DESCARTES_FETAL_MUSCLE_SMOOTH_MUSCLE_CELLS | 3.74e-19 | 97.90 | 44.62 | 4.18e-17 | 2.51e-16 | 12PDGFRB, EDNRA, ENPEP, ANO1, ABCC9, GUCY1A2, CACNA1C, TRPC4, STEAP4, SEMA5B, SLC6A1, RCAN2 |
78 |
| FAN_EMBRYONIC_CTX_BRAIN_ENDOTHELIAL_2 | 4.76e-35 | 80.25 | 43.67 | 1.60e-32 | 3.19e-32 | 26PDGFRB, CCDC102B, NOTCH3, UACA, PRKG1, PLXDC1, EDNRA, COL18A1, ABCC9, EPS8, GUCY1A2, HEYL, LHFPL6, ITGA1, GUCY1A1, COL4A2, COL4A1, TRPC6, SEMA5A, SLC6A1, ARHGEF17, CSPG4, IGFBP7, CALD1, COL6A2, ARHGAP42 |
303 |
| TRAVAGLINI_LUNG_VASCULAR_SMOOTH_MUSCLE_CELL | 2.19e-16 | 100.49 | 42.45 | 1.33e-14 | 1.47e-13 | 10NOTCH3, EPS8, HEYL, ITGA1, ADGRF5, SEMA5A, IGFBP7, CALD1, RCAN2, JAG1 |
61 |
| AIZARANI_LIVER_C33_STELLATE_CELLS_2 | 3.53e-20 | 71.20 | 34.48 | 4.73e-18 | 2.37e-17 | 14NOTCH3, UACA, PRKG1, LHFPL6, ITGA1, ADGRF5, COL4A2, COL4A1, SEMA5A, ARHGEF17, IGFBP7, CALD1, RCAN2, COL6A2 |
126 |
| TRAVAGLINI_LUNG_PERICYTE_CELL | 6.34e-19 | 71.32 | 33.74 | 5.81e-17 | 4.25e-16 | 13PDGFRB, CCDC102B, NOTCH3, PLXDC1, GUCY1A2, ITGA1, ADGRF5, COL4A2, COL4A1, TRPC6, SEMA5A, ARHGEF17, CSPG4 |
114 |
| MANNO_MIDBRAIN_NEUROTYPES_HPERIC | 5.85e-39 | 63.17 | 33.42 | 3.92e-36 | 3.92e-36 | 35PDGFRB, NOTCH3, UACA, PRKG1, PLXDC1, EDNRA, ENPEP, COL18A1, ABCC9, EPS8, GUCY1A2, HEYL, LHFPL6, CACNA1C, SPECC1, ITGA1, ADGRF5, GUCY1A1, COL5A3, COL4A2, KIRREL1, COL4A1, TRPC6, SEMA5A, PEAK1, PIEZO2, SLC6A1, PDE3A, ARHGEF17, CSPG4, IGFBP7, CALD1, ARHGAP6, JAG1, ARHGAP42 |
795 |
| DESCARTES_MAIN_FETAL_SMOOTH_MUSCLE_CELLS | 1.13e-11 | 90.13 | 32.11 | 4.01e-10 | 7.62e-09 | 7PDGFRB, CCDC102B, NOTCH3, ANO1, ABCC9, EBF2, CSPG4 |
44 |
| LAKE_ADULT_KIDNEY_C28_INTERSTITIUM | 8.12e-15 | 67.43 | 29.01 | 4.19e-13 | 5.45e-12 | 10UACA, PRKG1, EPS8, LHFPL6, CACNA1C, ITGA1, COL4A2, COL4A1, IGFBP7, CALD1 |
86 |
| LAKE_ADULT_KIDNEY_C27_VASCULAR_SMOOTH_MUSCLE_CELLS_AND_PERICYTES | 6.93e-19 | 56.64 | 27.54 | 5.81e-17 | 4.65e-16 | 14PRKG1, COL18A1, EPS8, PDE1A, LHFPL6, CACNA1C, ITGA1, COL4A2, COL4A1, PDE3A, CALD1, RCAN2, ARHGAP6, FRY |
155 |
| DESCARTES_FETAL_HEART_SMOOTH_MUSCLE_CELLS | 1.13e-09 | 71.60 | 23.58 | 3.29e-08 | 7.56e-07 | 6PDGFRB, NOTCH3, ENPEP, ABCC9, SEMA5B, ARHGEF17 |
45 |
| DESCARTES_FETAL_PLACENTA_SMOOTH_MUSCLE_CELLS | 8.06e-13 | 55.54 | 22.97 | 3.38e-11 | 5.41e-10 | 9CCDC102B, NOTCH3, ABCC9, GUCY1A2, HEYL, CACNA1C, COL5A3, SEMA5B, CSPG4 |
90 |
| LAKE_ADULT_KIDNEY_C26_MESANGIAL_CELLS | 2.17e-16 | 43.95 | 21.05 | 1.33e-14 | 1.45e-13 | 13PDGFRB, UACA, PRKG1, EPS8, LHFPL6, ITGA1, ADGRF5, COL4A2, COL4A1, PIEZO2, PDE3A, IGFBP7, CALD1 |
177 |
| RUBENSTEIN_SKELETAL_MUSCLE_PERICYTES | 3.65e-14 | 43.53 | 19.65 | 1.67e-12 | 2.45e-11 | 11PDGFRB, NOTCH3, ABCC9, EPS8, LHFPL6, COL4A2, STEAP4, COL4A1, IGFBP7, CALD1, COL6A2 |
144 |
| DURANTE_ADULT_OLFACTORY_NEUROEPITHELIUM_VASCULAR_SMOOTH_MUSCLE_CELLS | 5.66e-11 | 46.00 | 18.09 | 1.81e-09 | 3.80e-08 | 8PDGFRB, NOTCH3, LHFPL6, GUCY1A1, STEAP4, IGFBP7, CALD1, RCAN2 |
93 |
| GAO_LARGE_INTESTINE_ADULT_CJ_IMMUNE_CELLS | 6.67e-23 | 33.40 | 18.07 | 1.12e-20 | 4.47e-20 | 22PDGFRB, CCDC102B, NOTCH3, EDNRA, COL18A1, PDE1A, LHFPL6, ITGA1, ADGRF5, GUCY1A1, COL5A3, COL4A2, STEAP4, KIRREL1, COL4A1, ARHGEF17, CSPG4, IGFBP7, CALD1, ARHGAP6, COL6A2, FRY |
505 |
| MURARO_PANCREAS_MESENCHYMAL_STROMAL_CELL | 1.61e-24 | 31.37 | 17.19 | 3.61e-22 | 1.08e-21 | 25PDGFRB, CCDC102B, NOTCH3, UACA, PRKG1, PLXDC1, EDNRA, ANO1, COL18A1, EPS8, GUCY1A2, HEYL, LHFPL6, ITGA1, COL5A3, COL4A2, COL4A1, PEAK1, PIEZO2, PDE3A, ARHGEF17, IGFBP7, CALD1, COL6A2, JAG1 |
680 |
| FAN_EMBRYONIC_CTX_BIG_GROUPS_BRAIN_ENDOTHELIAL | 5.05e-18 | 30.40 | 15.72 | 3.77e-16 | 3.39e-15 | 17PDGFRB, NOTCH3, UACA, PLXDC1, EDNRA, COL18A1, LHFPL6, ITGA1, ADGRF5, COL4A2, COL4A1, SEMA5A, CSPG4, IGFBP7, CALD1, COL6A2, JAG1 |
365 |
| LAKE_ADULT_KIDNEY_C22_ENDOTHELIAL_CELLS_GLOMERULAR_CAPILLARIES | 3.68e-11 | 35.19 | 14.72 | 1.24e-09 | 2.47e-08 | 9UACA, PRKG1, CACNA1C, ITGA1, ADGRF5, COL4A2, COL4A1, PEAK1, CALD1 |
137 |
| DESCARTES_FETAL_LIVER_STELLATE_CELLS | 1.39e-10 | 30.04 | 12.61 | 4.25e-09 | 9.34e-08 | 9PDGFRB, EDNRA, ABCC9, GUCY1A2, ITGA1, NEURL1B, STEAP4, SEMA5A, CSPG4 |
159 |
| CUI_DEVELOPING_HEART_CORONARY_VASCULAR_ENDOTHELIAL_CELL | 2.90e-06 | 48.15 | 11.99 | 6.48e-05 | 1.94e-03 | 4UACA, COL4A2, COL4A1, IGFBP7 |
41 |
Dowload full table
mSigDB Hallmark Gene Sets:
| P-value | OR | Lower 95% CI | FDR | FWER | Genes Found | Gene Set Size | |
|---|---|---|---|---|---|---|---|
| HALLMARK_NOTCH_SIGNALING | 6.33e-05 | 45.10 | 8.51 | 1.58e-03 | 3.17e-03 | 3NOTCH3, HEYL, JAG1 |
32 |
| HALLMARK_EPITHELIAL_MESENCHYMAL_TRANSITION | 8.22e-06 | 14.43 | 4.97 | 4.11e-04 | 4.11e-04 | 6PDGFRB, COL5A3, COL4A2, COL4A1, CALD1, COL6A2 |
200 |
| HALLMARK_MYOGENESIS | 1.23e-02 | 6.65 | 1.31 | 1.54e-01 | 6.17e-01 | 3COL4A2, IGFBP7, COL6A2 |
200 |
| HALLMARK_KRAS_SIGNALING_UP | 1.23e-02 | 6.65 | 1.31 | 1.54e-01 | 6.17e-01 | 3ANO1, GUCY1A1, NGF |
200 |
| HALLMARK_ANDROGEN_RESPONSE | 2.44e-02 | 8.73 | 1.01 | 2.44e-01 | 1.00e+00 | 2GUCY1A1, STEAP4 |
100 |
| HALLMARK_ANGIOGENESIS | 8.37e-02 | 11.97 | 0.29 | 6.93e-01 | 1.00e+00 | 1JAG1 |
36 |
| HALLMARK_WNT_BETA_CATENIN_SIGNALING | 9.70e-02 | 10.22 | 0.25 | 6.93e-01 | 1.00e+00 | 1JAG1 |
42 |
| HALLMARK_CHOLESTEROL_HOMEOSTASIS | 1.64e-01 | 5.74 | 0.14 | 1.00e+00 | 1.00e+00 | 1JAG1 |
74 |
| HALLMARK_PI3K_AKT_MTOR_SIGNALING | 2.25e-01 | 4.03 | 0.10 | 1.00e+00 | 1.00e+00 | 1NGF |
105 |
| HALLMARK_UV_RESPONSE_DN | 2.95e-01 | 2.93 | 0.07 | 1.00e+00 | 1.00e+00 | 1PDGFRB |
144 |
| HALLMARK_APOPTOSIS | 3.23e-01 | 2.62 | 0.06 | 1.00e+00 | 1.00e+00 | 1PDGFRB |
161 |
| HALLMARK_TNFA_SIGNALING_VIA_NFKB | 3.84e-01 | 2.11 | 0.05 | 1.00e+00 | 1.00e+00 | 1JAG1 |
200 |
| HALLMARK_ADIPOGENESIS | 3.84e-01 | 2.11 | 0.05 | 1.00e+00 | 1.00e+00 | 1COL4A1 |
200 |
| HALLMARK_COMPLEMENT | 3.84e-01 | 2.11 | 0.05 | 1.00e+00 | 1.00e+00 | 1COL4A2 |
200 |
| HALLMARK_XENOBIOTIC_METABOLISM | 3.84e-01 | 2.11 | 0.05 | 1.00e+00 | 1.00e+00 | 1ENPEP |
200 |
| HALLMARK_HYPOXIA | 1.00e+00 | 0.00 | 0.00 | 1.00e+00 | 1.00e+00 | 0 |
200 |
| HALLMARK_MITOTIC_SPINDLE | 1.00e+00 | 0.00 | 0.00 | 1.00e+00 | 1.00e+00 | 0 |
199 |
| HALLMARK_TGF_BETA_SIGNALING | 1.00e+00 | 0.00 | 0.00 | 1.00e+00 | 1.00e+00 | 0 |
54 |
| HALLMARK_IL6_JAK_STAT3_SIGNALING | 1.00e+00 | 0.00 | 0.00 | 1.00e+00 | 1.00e+00 | 0 |
87 |
| HALLMARK_DNA_REPAIR | 1.00e+00 | 0.00 | 0.00 | 1.00e+00 | 1.00e+00 | 0 |
150 |
Dowload full table
KEGG Pathways:
| P-value | OR | Lower 95% CI | FDR | FWER | Genes Found | Gene Set Size | |
|---|---|---|---|---|---|---|---|
| KEGG_VASCULAR_SMOOTH_MUSCLE_CONTRACTION | 3.36e-07 | 25.65 | 8.76 | 6.24e-05 | 6.24e-05 | 6PRKG1, EDNRA, GUCY1A2, CACNA1C, GUCY1A1, CALD1 |
115 |
| KEGG_ECM_RECEPTOR_INTERACTION | 1.80e-06 | 28.86 | 8.71 | 1.68e-04 | 3.35e-04 | 5ITGA1, COL5A3, COL4A2, COL4A1, COL6A2 |
84 |
| KEGG_GAP_JUNCTION | 6.63e-05 | 20.75 | 5.31 | 3.08e-03 | 1.23e-02 | 4PDGFRB, PRKG1, GUCY1A2, GUCY1A1 |
90 |
| KEGG_FOCAL_ADHESION | 7.99e-06 | 14.51 | 4.99 | 4.96e-04 | 1.49e-03 | 6PDGFRB, ITGA1, COL5A3, COL4A2, COL4A1, COL6A2 |
199 |
| KEGG_LONG_TERM_DEPRESSION | 6.52e-04 | 19.56 | 3.80 | 2.02e-02 | 1.21e-01 | 3PRKG1, GUCY1A2, GUCY1A1 |
70 |
| KEGG_PURINE_METABOLISM | 5.82e-04 | 11.52 | 2.97 | 2.02e-02 | 1.08e-01 | 4PDE1A, GUCY1A2, GUCY1A1, PDE3A |
159 |
| KEGG_CALCIUM_SIGNALING_PATHWAY | 8.84e-04 | 10.26 | 2.65 | 2.35e-02 | 1.64e-01 | 4PDGFRB, EDNRA, PDE1A, CACNA1C |
178 |
| KEGG_NOTCH_SIGNALING_PATHWAY | 5.80e-03 | 19.01 | 2.17 | 1.35e-01 | 1.00e+00 | 2NOTCH3, JAG1 |
47 |
| KEGG_ARRHYTHMOGENIC_RIGHT_VENTRICULAR_CARDIOMYOPATHY_ARVC | 1.39e-02 | 11.88 | 1.37 | 2.87e-01 | 1.00e+00 | 2CACNA1C, ITGA1 |
74 |
| KEGG_HYPERTROPHIC_CARDIOMYOPATHY_HCM | 1.72e-02 | 10.56 | 1.22 | 2.98e-01 | 1.00e+00 | 2CACNA1C, ITGA1 |
83 |
| KEGG_SMALL_CELL_LUNG_CANCER | 1.76e-02 | 10.43 | 1.21 | 2.98e-01 | 1.00e+00 | 2COL4A2, COL4A1 |
84 |
| KEGG_DILATED_CARDIOMYOPATHY | 2.00e-02 | 9.72 | 1.13 | 3.11e-01 | 1.00e+00 | 2CACNA1C, ITGA1 |
90 |
| KEGG_MAPK_SIGNALING_PATHWAY | 2.62e-02 | 4.96 | 0.98 | 3.74e-01 | 1.00e+00 | 3PDGFRB, CACNA1C, NGF |
267 |
| KEGG_PATHWAYS_IN_CANCER | 4.27e-02 | 4.07 | 0.81 | 4.96e-01 | 1.00e+00 | 3PDGFRB, COL4A2, COL4A1 |
325 |
| KEGG_AXON_GUIDANCE | 3.88e-02 | 6.74 | 0.78 | 4.96e-01 | 1.00e+00 | 2SEMA5B, SEMA5A |
129 |
| KEGG_RENIN_ANGIOTENSIN_SYSTEM | 4.05e-02 | 26.18 | 0.61 | 4.96e-01 | 1.00e+00 | 1ENPEP |
17 |
| KEGG_REGULATION_OF_ACTIN_CYTOSKELETON | 9.29e-02 | 4.06 | 0.47 | 9.60e-01 | 1.00e+00 | 2PDGFRB, ITGA1 |
213 |
| KEGG_DORSO_VENTRAL_AXIS_FORMATION | 5.67e-02 | 18.21 | 0.43 | 6.20e-01 | 1.00e+00 | 1NOTCH3 |
24 |
| KEGG_ABC_TRANSPORTERS | 1.01e-01 | 9.74 | 0.24 | 9.92e-01 | 1.00e+00 | 1ABCC9 |
44 |
| KEGG_TYPE_II_DIABETES_MELLITUS | 1.08e-01 | 9.11 | 0.22 | 1.00e+00 | 1.00e+00 | 1CACNA1C |
47 |
Dowload full table
CHR Positional Gene Sets:
| P-value | OR | Lower 95% CI | FDR | FWER | Genes Found | Gene Set Size | |
|---|---|---|---|---|---|---|---|
| chr11q22 | 1.72e-03 | 13.80 | 2.70 | 3.07e-01 | 4.78e-01 | 3GUCY1A2, TRPC6, ARHGAP42 |
98 |
| chr12p12 | 2.21e-03 | 12.60 | 2.47 | 3.07e-01 | 6.14e-01 | 3ABCC9, EPS8, PDE3A |
107 |
| chr13q13 | 1.53e-02 | 11.25 | 1.30 | 1.00e+00 | 1.00e+00 | 2TRPC4, FRY |
78 |
| chr15q24 | 3.20e-02 | 7.50 | 0.87 | 1.00e+00 | 1.00e+00 | 2PEAK1, CSPG4 |
116 |
| chr21q22 | 2.06e-01 | 2.44 | 0.29 | 1.00e+00 | 1.00e+00 | 2COL18A1, COL6A2 |
353 |
| chr11q13 | 2.65e-01 | 2.04 | 0.24 | 1.00e+00 | 1.00e+00 | 2ANO1, ARHGEF17 |
421 |
| chr7q33 | 1.19e-01 | 8.21 | 0.20 | 1.00e+00 | 1.00e+00 | 1CALD1 |
52 |
| chr18q22 | 1.38e-01 | 6.98 | 0.17 | 1.00e+00 | 1.00e+00 | 1CCDC102B |
61 |
| chr15q23 | 1.46e-01 | 6.55 | 0.16 | 1.00e+00 | 1.00e+00 | 1UACA |
65 |
| chr4q12 | 1.74e-01 | 5.37 | 0.13 | 1.00e+00 | 1.00e+00 | 1IGFBP7 |
79 |
| chr19p13 | 7.03e-01 | 1.11 | 0.13 | 1.00e+00 | 1.00e+00 | 2NOTCH3, COL5A3 |
773 |
| chr5q11 | 1.86e-01 | 4.99 | 0.12 | 1.00e+00 | 1.00e+00 | 1ITGA1 |
85 |
| chr4q25 | 1.90e-01 | 4.87 | 0.12 | 1.00e+00 | 1.00e+00 | 1ENPEP |
87 |
| chr20p12 | 2.23e-01 | 4.07 | 0.10 | 1.00e+00 | 1.00e+00 | 1JAG1 |
104 |
| chr2q32 | 2.30e-01 | 3.92 | 0.10 | 1.00e+00 | 1.00e+00 | 1PDE1A |
108 |
| chr4q32 | 2.40e-01 | 3.74 | 0.09 | 1.00e+00 | 1.00e+00 | 1GUCY1A1 |
113 |
| chr8p21 | 2.67e-01 | 3.30 | 0.08 | 1.00e+00 | 1.00e+00 | 1EBF2 |
128 |
| chr3q21 | 2.84e-01 | 3.06 | 0.08 | 1.00e+00 | 1.00e+00 | 1SEMA5B |
138 |
| chr17q12 | 2.93e-01 | 2.95 | 0.07 | 1.00e+00 | 1.00e+00 | 1PLXDC1 |
143 |
| chr3p25 | 2.96e-01 | 2.91 | 0.07 | 1.00e+00 | 1.00e+00 | 1SLC6A1 |
145 |
Dowload full table
Transcription Factor Targets:
| P-value | OR | Lower 95% CI | FDR | FWER | Genes Found | Gene Set Size | |
|---|---|---|---|---|---|---|---|
| OCT1_02 | 1.60e-04 | 10.91 | 3.35 | 1.81e-01 | 1.81e-01 | 5PDE1A, CACNA1C, TRPC4, ARHGAP6, JAG1 |
214 |
| PAX4_04 | 2.01e-03 | 8.15 | 2.11 | 4.61e-01 | 1.00e+00 | 4PDE1A, STEAP4, EBF2, CALD1 |
223 |
| AP3_Q6 | 3.07e-03 | 7.23 | 1.88 | 4.61e-01 | 1.00e+00 | 4EDNRA, ENPEP, EBF2, CALD1 |
251 |
| ICSBP_Q6 | 3.15e-03 | 7.17 | 1.86 | 4.61e-01 | 1.00e+00 | 4CACNA1C, COL4A2, COL4A1, FRY |
253 |
| TEF_Q6 | 3.57e-03 | 6.92 | 1.80 | 4.61e-01 | 1.00e+00 | 4ENPEP, ITGA1, EBF2, FRY |
262 |
| IRF1_Q6 | 3.62e-03 | 6.89 | 1.79 | 4.61e-01 | 1.00e+00 | 4EPS8, CACNA1C, SEMA5B, CALD1 |
263 |
| RAAGNYNNCTTY_UNKNOWN | 5.47e-03 | 9.04 | 1.78 | 5.16e-01 | 1.00e+00 | 3RNF152, ITGA1, ARHGAP6 |
148 |
| TTAYRTAA_E4BP4_01 | 3.86e-03 | 6.76 | 1.76 | 4.61e-01 | 1.00e+00 | 4PRKG1, ENPEP, ANO1, FRY |
268 |
| NR2E3_TARGET_GENES | 1.45e-02 | 83.52 | 1.74 | 6.84e-01 | 1.00e+00 | 1EPS8 |
6 |
| CEBP_Q2_01 | 4.07e-03 | 6.66 | 1.73 | 4.61e-01 | 1.00e+00 | 4PRKG1, ANO1, EBF2, CALD1 |
272 |
| FREAC4_01 | 5.99e-03 | 8.74 | 1.72 | 5.22e-01 | 1.00e+00 | 3SEMA5B, CALD1, FRY |
153 |
| HAND1E47_01 | 4.73e-03 | 6.38 | 1.66 | 4.87e-01 | 1.00e+00 | 4ITGA1, EBF2, CALD1, ARHGAP6 |
284 |
| AACTTT_UNKNOWN | 8.42e-04 | 3.39 | 1.61 | 3.26e-01 | 9.55e-01 | 12RNF152, PDE1A, ITGA1, TRPC4, STEAP4, SEMA5A, EBF2, SLC6A1, ARHGEF17, CALD1, RCAN2, JAG1 |
1928 |
| TGGAAA_NFAT_Q4_01 | 8.64e-04 | 3.38 | 1.60 | 3.26e-01 | 9.79e-01 | 12RNF152, EDNRA, CACNA1C, EBF2, ADAMTS14, CSPG4, IGFBP7, CALD1, RCAN2, NGF, ARHGAP6, JAG1 |
1934 |
| YAATNANRNNNCAG_UNKNOWN | 1.25e-02 | 12.58 | 1.45 | 6.84e-01 | 1.00e+00 | 2PDE1A, CALD1 |
70 |
| AP2REP_01 | 9.59e-03 | 7.32 | 1.44 | 6.41e-01 | 1.00e+00 | 3EBF2, CALD1, ARHGAP6 |
182 |
| WTTGKCTG_UNKNOWN | 7.52e-03 | 4.44 | 1.37 | 5.88e-01 | 1.00e+00 | 5NOTCH3, RNF152, SEMA5B, CALD1, FRY |
519 |
| HNF3_Q6 | 1.11e-02 | 6.93 | 1.37 | 6.81e-01 | 1.00e+00 | 3EBF2, ADAMTS14, CALD1 |
192 |
| TGTTTGY_HNF3_Q6 | 7.79e-03 | 3.78 | 1.31 | 5.88e-01 | 1.00e+00 | 6SEMA5B, KIRREL1, EBF2, SLC6A1, CALD1, JAG1 |
748 |
| CATTGTYY_SOX9_B1 | 1.14e-02 | 4.91 | 1.28 | 6.81e-01 | 1.00e+00 | 4NOTCH3, SPECC1, ADGRF5, CALD1 |
368 |
Dowload full table
GO Biological Processes:
| P-value | OR | Lower 95% CI | FDR | FWER | Genes Found | Gene Set Size | |
|---|---|---|---|---|---|---|---|
| GOBP_POSITIVE_REGULATION_OF_NITRIC_OXIDE_MEDIATED_SIGNAL_TRANSDUCTION | 5.75e-05 | 281.71 | 23.16 | 2.39e-02 | 4.30e-01 | 2GUCY1A2, GUCY1A1 |
5 |
| GOBP_NEGATIVE_REGULATION_OF_SMOOTH_MUSCLE_CONTRACTION | 4.81e-06 | 118.70 | 20.61 | 3.99e-03 | 3.60e-02 | 3PRKG1, GUCY1A1, ARHGAP42 |
14 |
| GOBP_CGMP_METABOLIC_PROCESS | 8.93e-06 | 93.38 | 16.66 | 6.07e-03 | 6.68e-02 | 3PDE1A, GUCY1A2, GUCY1A1 |
17 |
| GOBP_RELAXATION_OF_VASCULAR_ASSOCIATED_SMOOTH_MUSCLE | 1.20e-04 | 169.99 | 15.84 | 3.21e-02 | 9.01e-01 | 2PRKG1, GUCY1A1 |
7 |
| GOBP_NEGATIVE_REGULATION_OF_MUSCLE_CONTRACTION | 2.00e-05 | 68.91 | 12.62 | 9.99e-03 | 1.50e-01 | 3PRKG1, GUCY1A1, ARHGAP42 |
22 |
| GOBP_REGULATION_OF_NITRIC_OXIDE_MEDIATED_SIGNAL_TRANSDUCTION | 2.06e-04 | 121.74 | 12.04 | 4.66e-02 | 1.00e+00 | 2GUCY1A2, GUCY1A1 |
9 |
| GOBP_RELAXATION_OF_SMOOTH_MUSCLE | 2.06e-04 | 121.74 | 12.04 | 4.66e-02 | 1.00e+00 | 2PRKG1, GUCY1A1 |
9 |
| GOBP_CGMP_BIOSYNTHETIC_PROCESS | 3.13e-04 | 94.83 | 9.72 | 6.17e-02 | 1.00e+00 | 2GUCY1A2, GUCY1A1 |
11 |
| GOBP_NOTCH_SIGNALING_INVOLVED_IN_HEART_DEVELOPMENT | 3.13e-04 | 94.83 | 9.72 | 6.17e-02 | 1.00e+00 | 2HEYL, JAG1 |
11 |
| GOBP_COLLAGEN_ACTIVATED_TYROSINE_KINASE_RECEPTOR_SIGNALING_PATHWAY | 3.75e-04 | 85.24 | 8.86 | 7.02e-02 | 1.00e+00 | 2COL4A2, COL4A1 |
12 |
| GOBP_GAMMA_AMINOBUTYRIC_ACID_TRANSPORT | 4.43e-04 | 77.52 | 8.14 | 7.70e-02 | 1.00e+00 | 2TRPC4, SLC6A1 |
13 |
| GOBP_GLOMERULUS_DEVELOPMENT | 1.53e-05 | 30.76 | 7.79 | 8.81e-03 | 1.14e-01 | 4PDGFRB, ENPEP, HEYL, JAG1 |
62 |
| GOBP_VASODILATION | 9.05e-05 | 39.67 | 7.53 | 2.75e-02 | 6.77e-01 | 3PRKG1, ITGA1, GUCY1A1 |
36 |
| GOBP_MANGANESE_ION_TRANSPORT | 5.94e-04 | 65.66 | 7.01 | 9.88e-02 | 1.00e+00 | 2TRPC4, TRPC6 |
15 |
| GOBP_COLLAGEN_ACTIVATED_SIGNALING_PATHWAY | 5.94e-04 | 65.66 | 7.01 | 9.88e-02 | 1.00e+00 | 2COL4A2, COL4A1 |
15 |
| GOBP_CYCLIC_NUCLEOTIDE_METABOLIC_PROCESS | 1.24e-04 | 35.36 | 6.75 | 3.21e-02 | 9.30e-01 | 3PDE1A, GUCY1A2, GUCY1A1 |
40 |
| GOBP_VASCULAR_PROCESS_IN_CIRCULATORY_SYSTEM | 1.15e-07 | 16.50 | 6.62 | 3.53e-04 | 8.57e-04 | 8PRKG1, EDNRA, ABCC9, ITGA1, GUCY1A1, SLC6A1, PDE3A, ARHGAP42 |
245 |
| GOBP_PULMONARY_VALVE_MORPHOGENESIS | 7.67e-04 | 56.94 | 6.15 | 1.15e-01 | 1.00e+00 | 2HEYL, JAG1 |
17 |
| GOBP_REGULATION_OF_PHOSPHOLIPASE_C_ACTIVITY | 1.89e-04 | 30.45 | 5.84 | 4.56e-02 | 1.00e+00 | 3PDGFRB, EDNRA, ARHGAP6 |
46 |
| GOBP_POSITIVE_REGULATION_OF_TRANSCRIPTION_OF_NOTCH_RECEPTOR_TARGET | 8.61e-04 | 53.39 | 5.80 | 1.20e-01 | 1.00e+00 | 2NOTCH3, HEYL |
18 |
Dowload full table
Immunological Gene Sets:
| P-value | OR | Lower 95% CI | FDR | FWER | Genes Found | Gene Set Size | |
|---|---|---|---|---|---|---|---|
| GSE28783_ANTI_MIR33_VS_CTRL_ATHEROSCLEROSIS_MACROPHAGE_DN | 1.12e-04 | 11.82 | 3.62 | 2.85e-01 | 5.44e-01 | 5EDNRA, ENPEP, TRPC6, ARHGEF17, FRY |
198 |
| GSE6259_FLT3L_INDUCED_DEC205_POS_DC_VS_CD4_TCELL_DN | 2.89e-04 | 13.95 | 3.59 | 4.13e-01 | 1.00e+00 | 4PDGFRB, GUCY1A2, ARHGEF17, CSPG4 |
132 |
| GSE21670_STAT3_KO_VS_WT_CD4_TCELL_IL6_TREATED_DN | 1.17e-04 | 11.70 | 3.59 | 2.85e-01 | 5.70e-01 | 5PRKG1, COL4A2, COL4A1, TRPC6, FRY |
200 |
| GSE27859_MACROPHAGE_VS_CD11C_INT_F480_INT_DC_UP | 7.62e-04 | 10.69 | 2.76 | 4.13e-01 | 1.00e+00 | 4PDGFRB, UACA, LHFPL6, SPECC1 |
171 |
| GSE36476_YOUNG_VS_OLD_DONOR_MEMORY_CD4_TCELL_DN | 1.31e-03 | 9.20 | 2.38 | 4.13e-01 | 1.00e+00 | 4GUCY1A1, TRPC6, SEMA5A, PEAK1 |
198 |
| GSE21670_UNTREATED_VS_TGFB_TREATED_CD4_TCELL_DN | 1.31e-03 | 9.20 | 2.38 | 4.13e-01 | 1.00e+00 | 4PRKG1, COL4A2, COL4A1, FRY |
198 |
| GSE24574_BCL6_HIGH_TFH_VS_TCONV_CD4_TCELL_DN | 1.31e-03 | 9.20 | 2.38 | 4.13e-01 | 1.00e+00 | 4ENPEP, GUCY1A2, TRPC6, CALD1 |
198 |
| GSE3982_MEMORY_CD4_TCELL_VS_BCELL_UP | 1.33e-03 | 9.16 | 2.37 | 4.13e-01 | 1.00e+00 | 4PLXDC1, EDNRA, ANO1, FRY |
199 |
| GSE9006_TYPE_1_VS_TYPE_2_DIABETES_PBMC_AT_DX_DN | 1.33e-03 | 9.16 | 2.37 | 4.13e-01 | 1.00e+00 | 4EPS8, LHFPL6, GUCY1A1, TRPC4 |
199 |
| GSE28783_ANTI_MIR33_VS_UNTREATED_ATHEROSCLEROSIS_MACROPHAGE_DN | 1.33e-03 | 9.16 | 2.37 | 4.13e-01 | 1.00e+00 | 4PRKG1, GUCY1A2, TRPC6, ARHGEF17 |
199 |
| GSE33374_CD8_ALPHAALPHA_VS_ALPHABETA_CD161_HIGH_TCELL_UP | 1.33e-03 | 9.16 | 2.37 | 4.13e-01 | 1.00e+00 | 4COL18A1, TRPC4, SEMA5B, NHSL2 |
199 |
| GSE13306_TREG_RA_VS_TCONV_RA_DN | 1.36e-03 | 9.11 | 2.36 | 4.13e-01 | 1.00e+00 | 4ANO1, COL18A1, ADGRF5, FRY |
200 |
| GSE1460_INTRATHYMIC_T_PROGENITOR_VS_THYMIC_STROMAL_CELL_DN | 1.36e-03 | 9.11 | 2.36 | 4.13e-01 | 1.00e+00 | 4EDNRA, SLC6A1, COL6A2, JAG1 |
200 |
| GSE12003_MIR223_KO_VS_WT_BM_PROGENITOR_4D_CULTURE_DN | 1.36e-03 | 9.11 | 2.36 | 4.13e-01 | 1.00e+00 | 4COL18A1, COL5A3, TRPC4, EBF2 |
200 |
| GSE21379_WT_VS_SAP_KO_TFH_CD4_TCELL_UP | 1.36e-03 | 9.11 | 2.36 | 4.13e-01 | 1.00e+00 | 4LHFPL6, COL4A2, COL4A1, NHSL2 |
200 |
| GSE41978_ID2_KO_VS_ID2_KO_AND_BIM_KO_KLRG1_LOW_EFFECTOR_CD8_TCELL_UP | 1.36e-03 | 9.11 | 2.36 | 4.13e-01 | 1.00e+00 | 4PLXDC1, SPECC1, GUCY1A1, NHSL2 |
200 |
| GSE3720_UNSTIM_VS_LPS_STIM_VD1_GAMMADELTA_TCELL_DN | 5.26e-03 | 9.16 | 1.80 | 6.68e-01 | 1.00e+00 | 3NOTCH3, EPS8, ADAMTS14 |
146 |
| GSE13522_CTRL_VS_T_CRUZI_BRAZIL_STRAIN_INF_SKIN_UP | 5.36e-03 | 9.10 | 1.79 | 6.68e-01 | 1.00e+00 | 3PDGFRB, ADAMTS14, ARHGAP6 |
147 |
| GSE5589_WT_VS_IL6_KO_LPS_AND_IL10_STIM_MACROPHAGE_180MIN_DN | 5.57e-03 | 8.98 | 1.77 | 6.68e-01 | 1.00e+00 | 3ITGA1, TRPC4, RCAN2 |
149 |
| GSE3720_UNSTIM_VS_LPS_STIM_VD2_GAMMADELTA_TCELL_DN | 5.99e-03 | 8.74 | 1.72 | 6.68e-01 | 1.00e+00 | 3EPS8, COL4A1, FRY |
153 |
Top Ranked Transcription Factors for this Gene Expression Program:
| Gene Symbol | Gene Loading Rank | DNA Binding Domain | Motif Status | IUPAC PWM | GTEx | DepMap | Decartes |
|---|---|---|---|---|---|---|---|
| NOTCH3 | 3 | No | Unlikely to be sequence specific TF | Not a DNA binding protein | No motif | None | Fragment of NOTCH. Is a coactivator. |
| HEYL | 16 | Yes | Inferred motif | Monomer or homomultimer | High-throughput in vitro | None | None |
| EBF2 | 35 | Yes | Known motif | Monomer or homomultimer | In vivo/Misc source | Only known motifs are from Transfac or HocoMoco - origin is uncertain | EBF1 has a nice HT-SELEX model and based on this paper (PMID:23499423). EBF2 binds similar motif to control brown/beige fat cell identity. |
| NR2F2 | 54 | Yes | Known motif | Monomer or homomultimer | 100 perc ID - in vitro | None | None |
| ZBTB46 | 57 | Yes | Likely to be sequence specific TF | Monomer or homomultimer | No motif | None | Specificity is unknown; functions in dendritic cells (PMID: 22615130). |
| HEY2 | 70 | Yes | Known motif | Monomer or homomultimer | High-throughput in vitro | None | None |
| EBF1 | 71 | Yes | Known motif | Monomer or homomultimer | High-throughput in vitro | None | None |
| LZTS1 | 83 | No | Unlikely to be sequence specific TF | Not a DNA binding protein | No motif | None | Does not contain a bZIP domain. (PMID: 10097140) does not examine TF activity or DNA binding - GO needs to be corrected. |
| MEF2C | 91 | Yes | Known motif | Monomer or homomultimer | High-throughput in vitro | None | None |
| ID3 | 94 | No | Unlikely to be sequence specific TF | Not a DNA binding protein | No motif | None | ID bHLH proteins lack the basic region and should not be able to bind DNA. The HT-SELEX motif for ID4 is likely by a co-precipitated protein or it is a contamination |
| STK3 | 101 | No | Unlikely to be sequence specific TF | Not a DNA binding protein | No motif | None | Kinase - included only because GO says it regulates TFs |
| GLI3 | 103 | Yes | Known motif | Monomer or homomultimer | High-throughput in vitro | None | None |
| PRRX1 | 117 | Yes | Known motif | Monomer or homomultimer | High-throughput in vitro | None | None |
| RUNX1 | 120 | Yes | Known motif | Monomer or homomultimer | In vivo/Misc source | Only known motifs are from Transfac or HocoMoco - origin is uncertain | None |
| ZEB2 | 125 | Yes | Inferred motif | Monomer or homomultimer | In vivo/Misc source | None | None |
| SOX5 | 131 | Yes | Known motif | Monomer or homomultimer | High-throughput in vitro | None | None |
| HES4 | 132 | Yes | Inferred motif | Monomer or homomultimer | High-throughput in vitro | None | None |
| LPP | 154 | No | Unlikely to be sequence specific TF | Not a DNA binding protein | No motif | None | znfLIM is probably not a DNA binding domain (PMID: 8506279). The protein has been reported to be coactivator for ETV4 (PMID: 16738319). |
| TBX15 | 172 | Yes | Known motif | Monomer or homomultimer | High-throughput in vitro | None | None |
| ID4 | 187 | No | Unlikely to be sequence specific TF | Not a DNA binding protein | No motif | None | ID bHLH proteins lack the basic region and should not be able to bind DNA. The HT-SELEX motif for ID4 is likely by a co-precipitated protein or it is a contamination |
Druggable Genes for this Gene Expression Program:
| Gene Symbol | Gene Loading Rank | Drug Names | Drug Category | GTEx | DepMap |
|---|---|---|---|---|---|
| PDGFRB | 1 | 7SORAFENIB, IMATINIB, REGORAFENIB, PAZOPANIB, NINTEDANIB, SUNITINIB, DASATINIB |
Small molecule | GTEx | DepMap |
| EDNRA | 8 | 3MACITENTAN, BOSENTAN, AMBRISENTAN |
Small molecule | GTEx | DepMap |
| ANO1 | 10 | 1CROFELEMER |
Small molecule | GTEx | DepMap |
| ABCC9 | 12 | 2PINACIDIL, MINOXIDIL |
Small molecule | GTEx | DepMap |
| PDE1A | 14 | 2PENTOXIFYLLINE, DIPYRIDAMOLE |
Small molecule | GTEx | DepMap |
| CACNA1C | 18 | 15DILTIAZEM, NISOLDIPINE, ISRADIPINE, AMLODIPINE, BEPRIDIL, NICARDIPINE, GABAPENTIN ENACARBIL, CLEVIDIPINE, DRONEDARONE, VERAPAMIL, FELODIPINE, NIFEDIPINE, NIMODIPINE, GABAPENTIN, PREGABALIN |
Small molecule | GTEx | DepMap |
| SLC6A1 | 36 | 1TIAGABINE |
Small molecule | GTEx | DepMap |
| PDE3A | 37 | 9THEOPHYLLINE SODIUM GLYCINATE, ANAGRELIDE, PENTOXIFYLLINE, THEOPHYLLINE, DYPHYLLINE, INAMRINONE, MILRINONE, CILOSTAZOL, DIPYRIDAMOLE |
Small molecule | GTEx | DepMap |
| NGF | 44 | 2TANEZUMAB, FULRANUMAB |
Antibody | GTEx | DepMap |
| EPHA3 | 64 | 1VANDETANIB |
Small molecule | GTEx | DepMap |
| PTGIR | 92 | 4TREPROSTINIL, ILOPROST, SELEXIPAG, EPOPROSTENOL |
Small molecule | GTEx | DepMap |
| PDE1C | 110 | 2PENTOXIFYLLINE, DIPYRIDAMOLE |
Small molecule | GTEx | DepMap |
| ADRA1B | 118 | 28DOXAZOSIN, MIDODRINE, PHENOXYBENZAMINE, HYDROXYAMPHETAMINE, ALFUZOSIN, NAPHAZOLINE, TOLAZOLINE, TETRAHYDROZOLINE, PHENYLEPHRINE, LABETALOL, NOREPINEPHRINE, EPINEPHRINE, METARAMINOL, ERGOTAMINE, ERGOLOID MESYLATES, RAUWOLFIA SERPENTINA, METHOXAMINE, DROXIDOPA, TAMSULOSIN, PHENTOLAMINE, TRIMIPRAMINE, OXYMETAZOLINE, DIPIVEFRIN, TERAZOSIN, ALSEROXYLON, CARVEDILOL, MEPHENTERMINE, PRAZOSIN |
Small molecule | GTEx | DepMap |
| HTR1F | 164 | 2ALMOTRIPTAN, ELETRIPTAN |
Small molecule | GTEx | DepMap |
| KCNJ8 | 174 | 1DIAZOXIDE |
Small molecule | GTEx | DepMap |
| AVPR1A | 178 | 1CONIVAPTAN |
Small molecule | GTEx | DepMap |
| PDE5A | 206 | 6SILDENAFIL, AVANAFIL, PENTOXIFYLLINE, TADALAFIL, VARDENAFIL, DIPYRIDAMOLE |
Small molecule | GTEx | DepMap |
| CACNA1H | 216 | 10PREGABALIN, BEPRIDIL, MIBEFRADIL, GABAPENTIN ENACARBIL, ETHOSUXIMIDE, METHSUXIMIDE, TRIMETHADIONE, PHENSUXIMIDE, GABAPENTIN, PARAMETHADIONE |
Small molecule | GTEx | DepMap |
| S1PR3 | 222 | 1FINGOLIMOD |
Small molecule | GTEx | DepMap |
| PTK2 | 230 | 5PF-562271, CEP-37440, BI-853520, GSK-2256098, VS-4718 |
Small molecule | GTEx | DepMap |
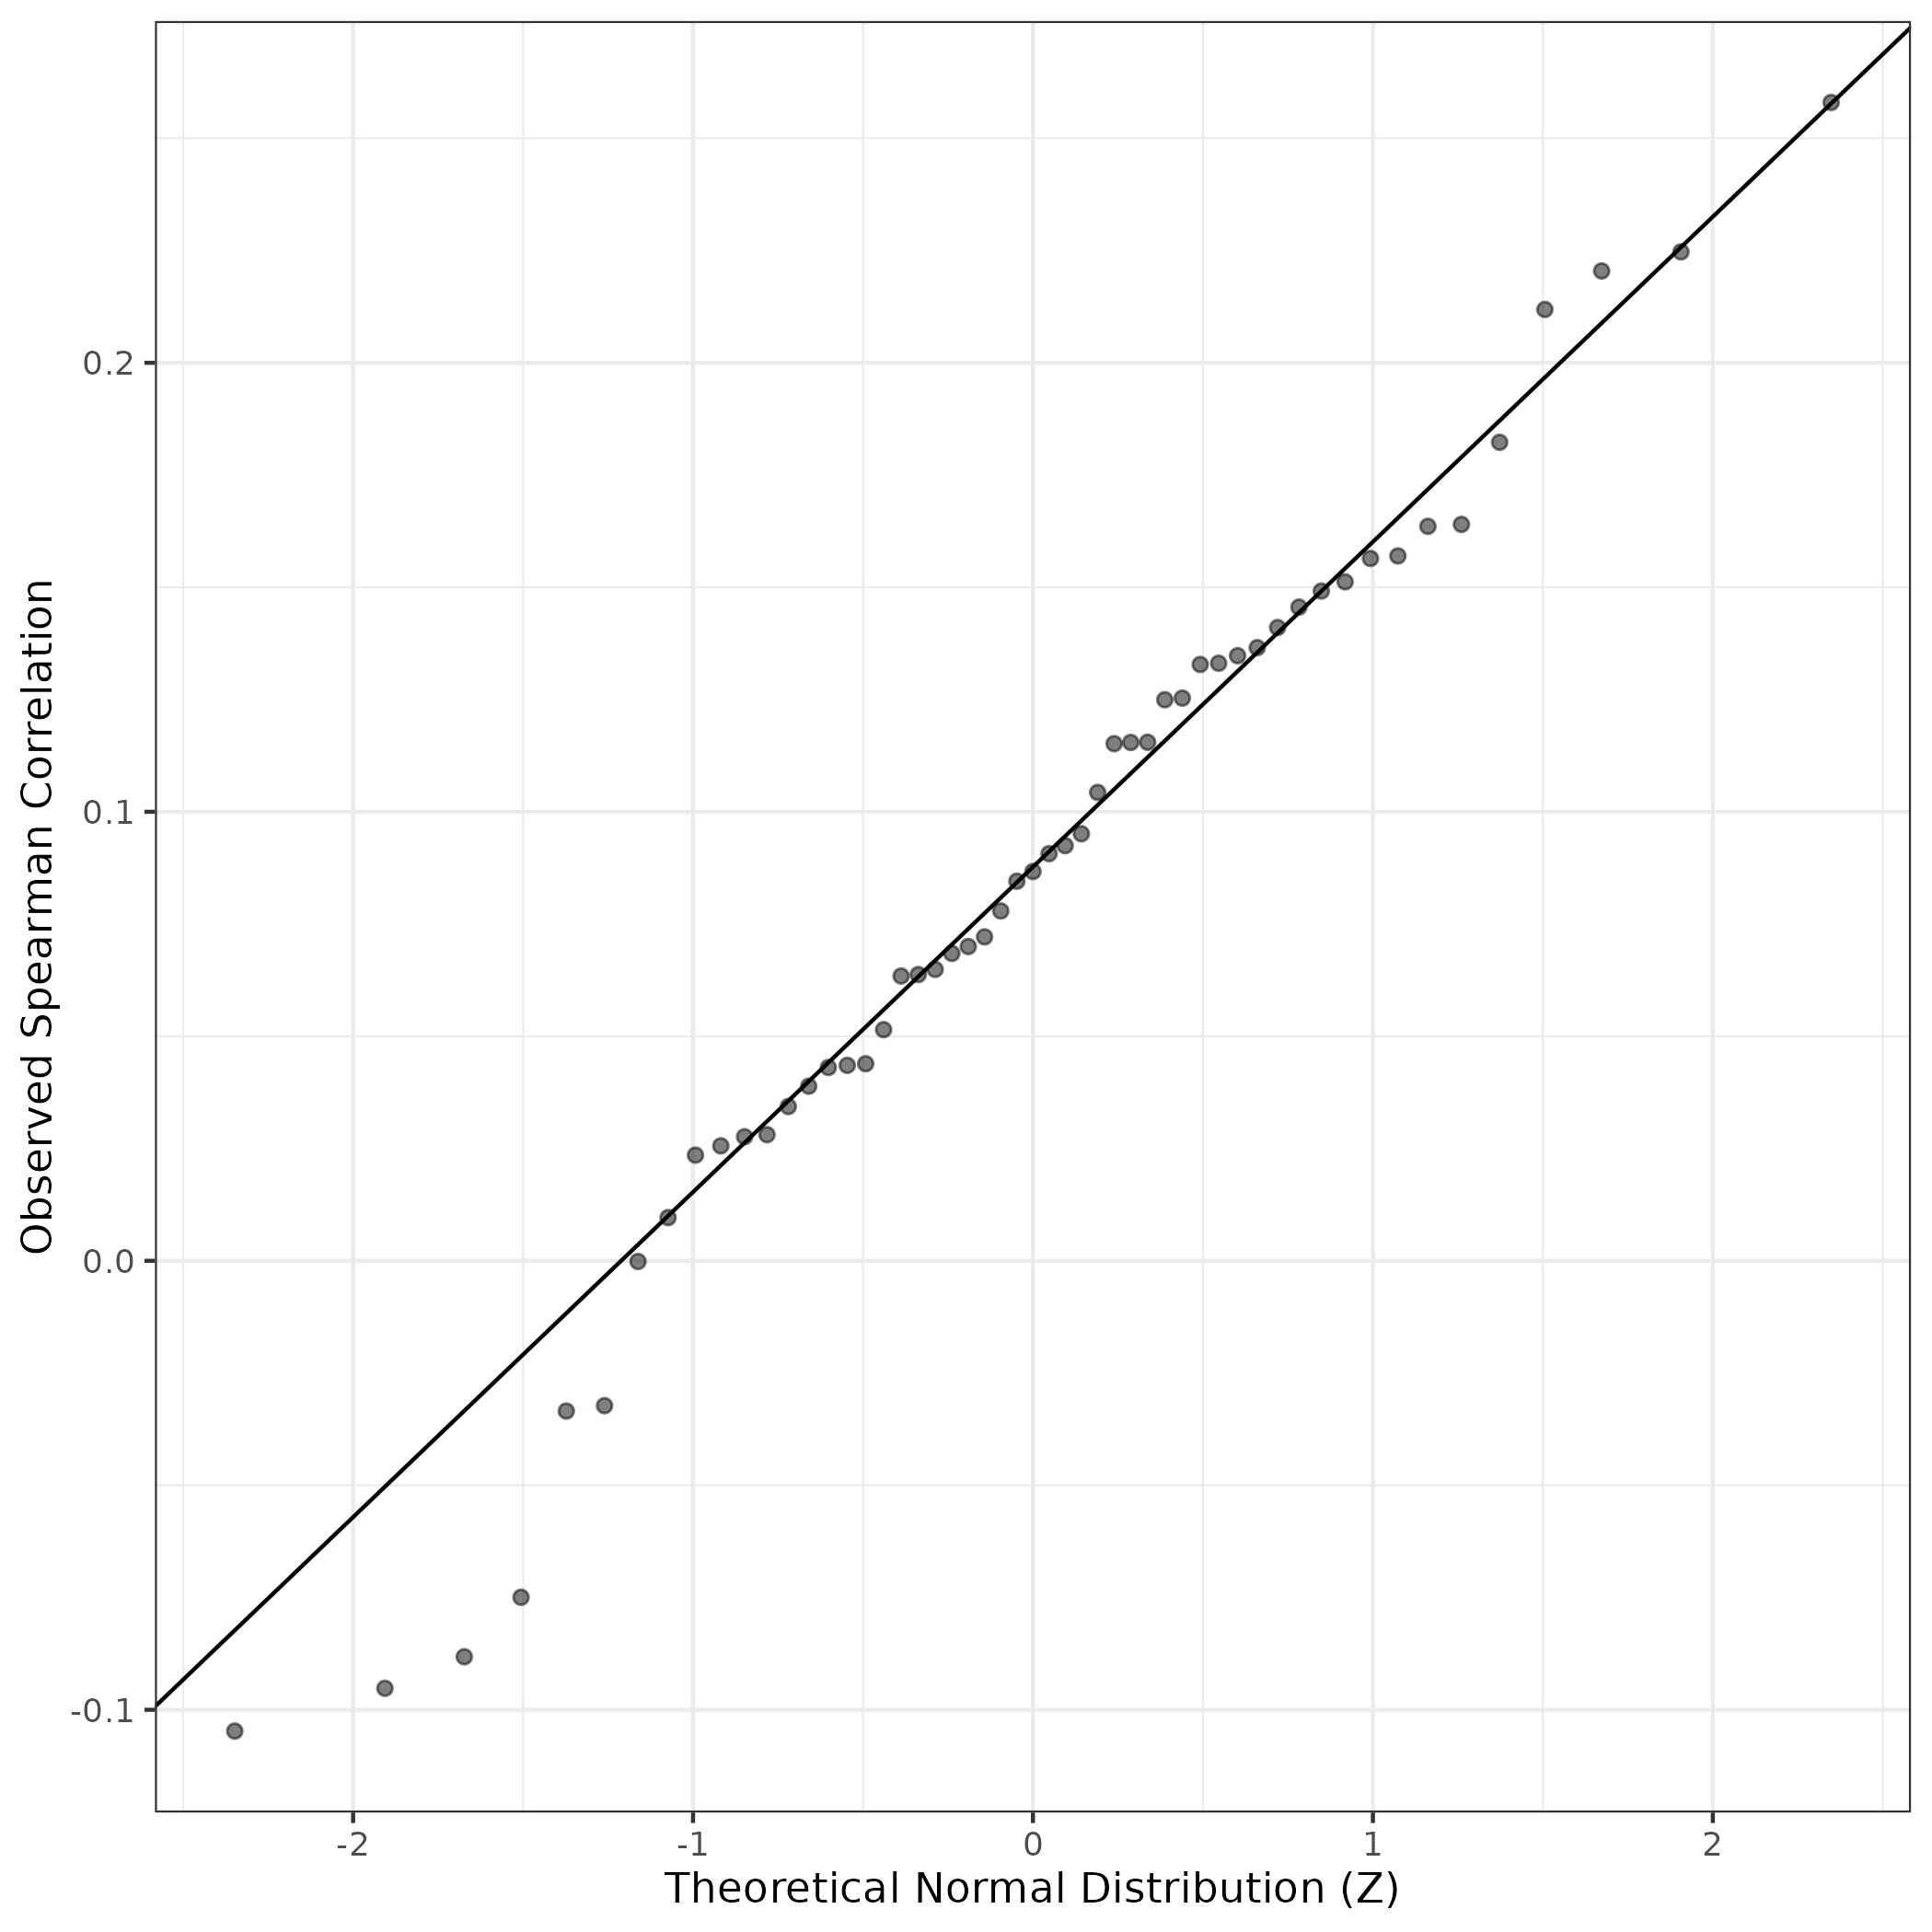
QQ Plot showing correlations with other GEPs in this dataset, calculated by Spearman correlation:
Interactive QQ-plot of gene loadings:
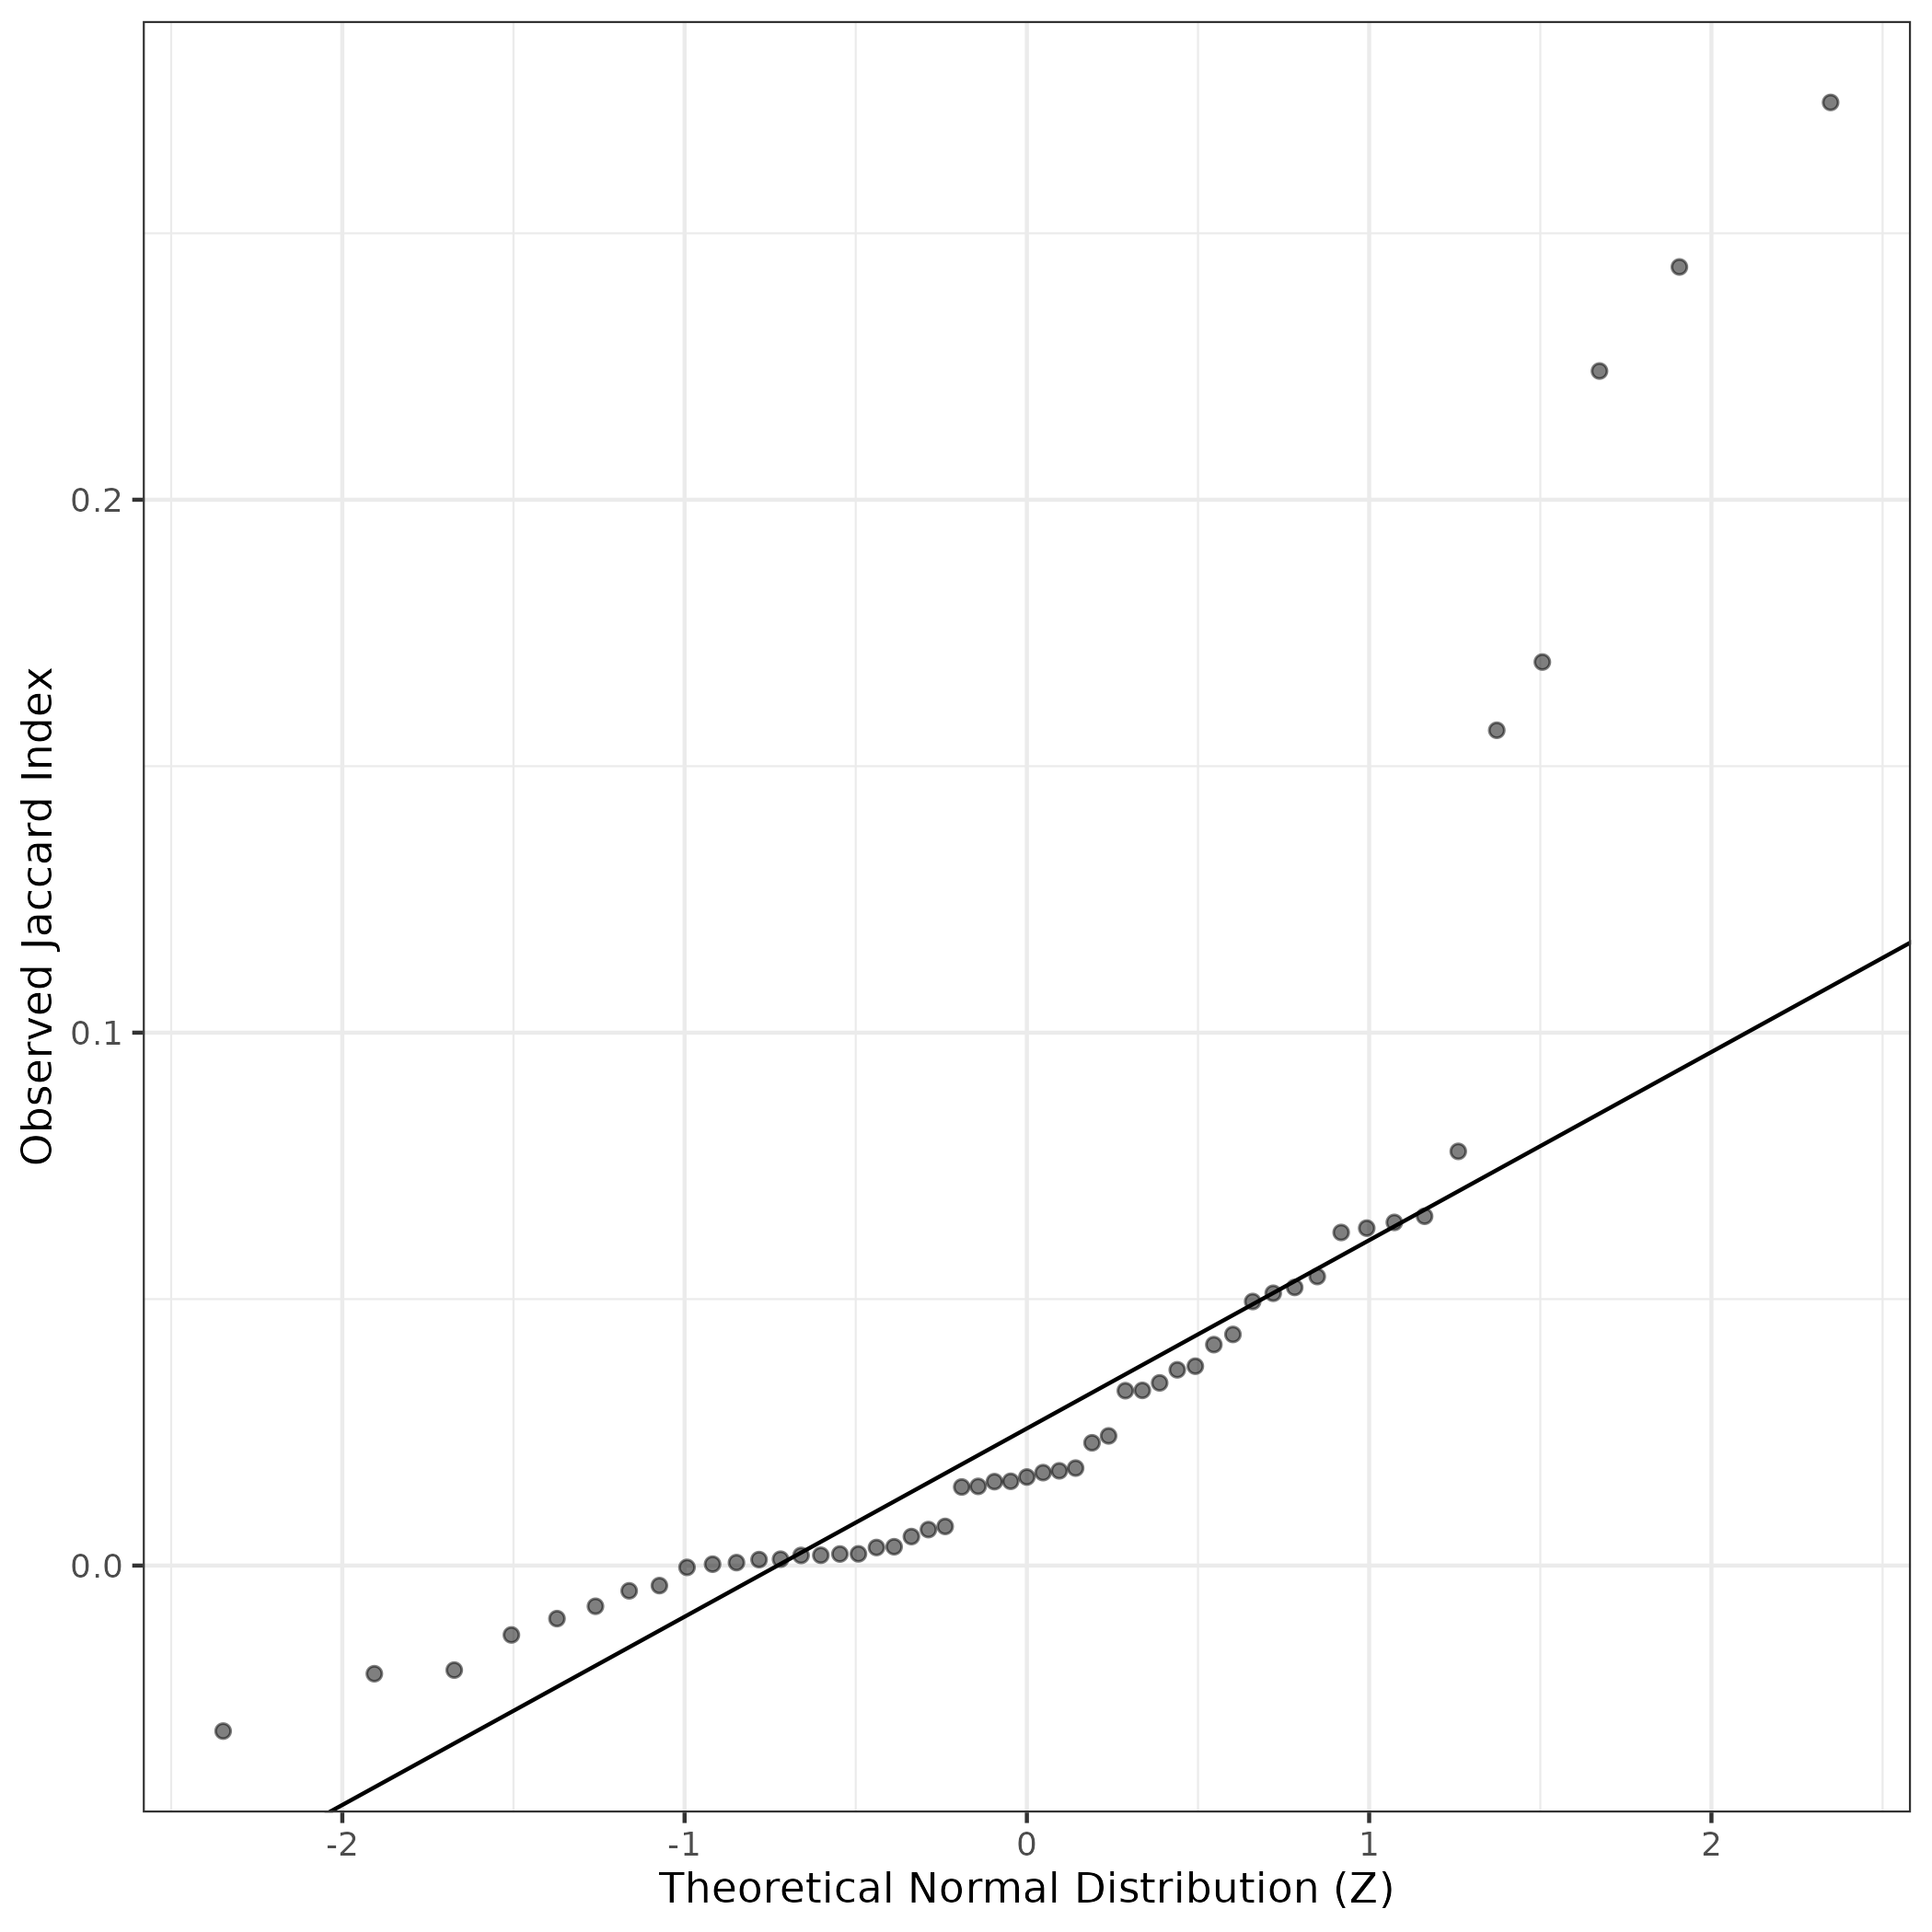
A similar QQ-plot as above, but only for instances where the H value is e.g. > 25, i.e. we are confident that the expression program is active above noise. Agreemenet between these binary vectors is tested using the Jaccard Index, with the P-values calculated by an exact test:
Interactive QQ-plot:
Singler cell type annotations for the top 50 cells on this program.
| Cell ID | Singler label | Singler Delta | Activity Score | Top Singler Raw Scores |
|---|---|---|---|---|
| AATCGACCAAATGGTA-1_HTA4_1002_4007 | Smooth_muscle_cells | 0.18 | 3012.58 | Raw ScoresOsteoblasts: 0.29, Fibroblasts: 0.29, Smooth_muscle_cells: 0.29, MSC: 0.29, Chondrocytes: 0.27, iPS_cells: 0.26, Tissue_stem_cells: 0.26, Astrocyte: 0.26, Neurons: 0.26, Neuroepithelial_cell: 0.25 |
| GAGCTGCCAAGTGGGT-1_HTA4_1019_4075 | Endothelial_cells | 0.22 | 2992.32 | Raw ScoresEndothelial_cells: 0.41, Osteoblasts: 0.4, Smooth_muscle_cells: 0.4, Fibroblasts: 0.39, Tissue_stem_cells: 0.38, Chondrocytes: 0.38, MSC: 0.37, iPS_cells: 0.36, Astrocyte: 0.33, Neurons: 0.33 |
| CATAGACGTTAAGCAA-1_HTA4_1002_4007 | Smooth_muscle_cells | 0.25 | 2948.48 | Raw ScoresFibroblasts: 0.38, Smooth_muscle_cells: 0.38, Osteoblasts: 0.37, MSC: 0.35, Chondrocytes: 0.35, Tissue_stem_cells: 0.35, iPS_cells: 0.35, Neurons: 0.31, Endothelial_cells: 0.3, Astrocyte: 0.29 |
| GTCTCACTCAAAGGAT-1_HTA4_1012_4045 | Smooth_muscle_cells | 0.32 | 2472.32 | Raw ScoresFibroblasts: 0.55, Osteoblasts: 0.55, Smooth_muscle_cells: 0.54, MSC: 0.52, iPS_cells: 0.51, Tissue_stem_cells: 0.51, Chondrocytes: 0.51, Neurons: 0.44, Endothelial_cells: 0.43, Astrocyte: 0.37 |
| GTCATTTCATCTGGGC-1_HTA4_1018_4070 | Smooth_muscle_cells | 0.20 | 2468.99 | Raw ScoresSmooth_muscle_cells: 0.33, Osteoblasts: 0.33, Fibroblasts: 0.33, Tissue_stem_cells: 0.32, MSC: 0.31, Chondrocytes: 0.31, iPS_cells: 0.3, Neurons: 0.28, Endothelial_cells: 0.27, Astrocyte: 0.27 |
| ACCAAACCACCATTCC-1_HTA4_1002_4008 | Smooth_muscle_cells | 0.21 | 2435.99 | Raw ScoresSmooth_muscle_cells: 0.31, Fibroblasts: 0.31, Osteoblasts: 0.3, MSC: 0.29, Chondrocytes: 0.28, Tissue_stem_cells: 0.28, iPS_cells: 0.27, Astrocyte: 0.26, Neurons: 0.26, Neuroepithelial_cell: 0.25 |
| TCCTGCAAGCTGGTGA-1_HTA4_1002_4008 | Smooth_muscle_cells | 0.25 | 2428.04 | Raw ScoresFibroblasts: 0.36, Smooth_muscle_cells: 0.36, Osteoblasts: 0.35, Chondrocytes: 0.35, Tissue_stem_cells: 0.33, MSC: 0.33, iPS_cells: 0.32, Neurons: 0.29, Astrocyte: 0.28, Endothelial_cells: 0.27 |
| CGAGTTATCTTAGCAG-1_HTA4_1002_4008 | Smooth_muscle_cells | 0.22 | 2408.23 | Raw ScoresFibroblasts: 0.33, Osteoblasts: 0.32, MSC: 0.31, Smooth_muscle_cells: 0.31, Chondrocytes: 0.29, iPS_cells: 0.29, Tissue_stem_cells: 0.28, Neurons: 0.26, Astrocyte: 0.24, Neuroepithelial_cell: 0.24 |
| ACCTACCAGCACCAGA-1_HTA4_1002_4007 | Smooth_muscle_cells | 0.23 | 2362.08 | Raw ScoresOsteoblasts: 0.36, Fibroblasts: 0.36, Smooth_muscle_cells: 0.36, Chondrocytes: 0.35, Tissue_stem_cells: 0.34, MSC: 0.34, iPS_cells: 0.32, Neurons: 0.29, Astrocyte: 0.28, Neuroepithelial_cell: 0.28 |
| TCGACCTAGAAACCAT-1_HTA4_1008_4028 | Neurons | 0.22 | 2148.76 | Raw ScoresMSC: 0.42, Fibroblasts: 0.4, Neuroepithelial_cell: 0.39, Neurons: 0.39, Endothelial_cells: 0.39, Osteoblasts: 0.39, Smooth_muscle_cells: 0.38, Astrocyte: 0.38, iPS_cells: 0.38, Tissue_stem_cells: 0.38 |
| TTTGACTGTAGGACCA-1_HTA4_1018_4067 | Smooth_muscle_cells | 0.25 | 2143.22 | Raw ScoresFibroblasts: 0.46, Osteoblasts: 0.46, Smooth_muscle_cells: 0.45, Chondrocytes: 0.45, Tissue_stem_cells: 0.44, MSC: 0.44, iPS_cells: 0.42, Neurons: 0.39, Endothelial_cells: 0.38, Astrocyte: 0.35 |
| TTCCGTGCAACAGCCC-1_HTA4_1020_4079 | Smooth_muscle_cells | 0.23 | 2122.02 | Raw ScoresSmooth_muscle_cells: 0.41, Fibroblasts: 0.41, Osteoblasts: 0.41, MSC: 0.4, Chondrocytes: 0.4, Endothelial_cells: 0.39, Tissue_stem_cells: 0.39, iPS_cells: 0.38, Astrocyte: 0.35, Neurons: 0.35 |
| TACTGCCTCTAGTGTG-1_HTA4_1018_4070 | Smooth_muscle_cells | 0.24 | 2085.73 | Raw ScoresFibroblasts: 0.4, Osteoblasts: 0.4, Smooth_muscle_cells: 0.4, Tissue_stem_cells: 0.37, Chondrocytes: 0.37, MSC: 0.37, iPS_cells: 0.36, Neurons: 0.32, Endothelial_cells: 0.31, Astrocyte: 0.29 |
| TACCCGTTCCACTTTA-1_HTA4_1009_4031 | Tissue_stem_cells | 0.17 | 2062.84 | Raw ScoresOsteoblasts: 0.36, Fibroblasts: 0.36, Smooth_muscle_cells: 0.34, Tissue_stem_cells: 0.34, MSC: 0.34, Chondrocytes: 0.33, iPS_cells: 0.32, Neurons: 0.3, Astrocyte: 0.29, Endothelial_cells: 0.29 |
| ATCCACCCATTCGATG-1_HTA4_1002_4007 | Neurons | 0.22 | 2028.42 | Raw ScoresAstrocyte: 0.31, Neuroepithelial_cell: 0.31, Neurons: 0.31, MSC: 0.31, Osteoblasts: 0.3, Fibroblasts: 0.3, Smooth_muscle_cells: 0.29, iPS_cells: 0.27, Embryonic_stem_cells: 0.27, Chondrocytes: 0.26 |
| GGAACCCAGAAAGCGA-1_HTA4_1018_4070 | Smooth_muscle_cells | 0.20 | 1898.05 | Raw ScoresFibroblasts: 0.34, Smooth_muscle_cells: 0.34, Osteoblasts: 0.34, Tissue_stem_cells: 0.32, Chondrocytes: 0.32, MSC: 0.32, iPS_cells: 0.3, Neurons: 0.29, Astrocyte: 0.28, Endothelial_cells: 0.27 |
| CGATGCGAGTATTGCC-1_HTA4_1018_4069 | MSC | 0.18 | 1834.08 | Raw ScoresMSC: 0.32, Smooth_muscle_cells: 0.31, Fibroblasts: 0.31, Osteoblasts: 0.31, Endothelial_cells: 0.3, Neurons: 0.3, Neuroepithelial_cell: 0.29, iPS_cells: 0.29, Astrocyte: 0.29, Tissue_stem_cells: 0.29 |
| GAAACCTTCGCTTGAA-1_HTA4_1018_4071 | Smooth_muscle_cells | 0.20 | 1827.47 | Raw ScoresSmooth_muscle_cells: 0.36, Fibroblasts: 0.35, Osteoblasts: 0.35, Tissue_stem_cells: 0.34, Chondrocytes: 0.34, MSC: 0.33, iPS_cells: 0.32, Neurons: 0.3, Endothelial_cells: 0.29, Astrocyte: 0.28 |
| TCAGCCTCAAAGCTAA-1_HTA4_1009_4031 | Tissue_stem_cells | 0.19 | 1805.15 | Raw ScoresFibroblasts: 0.36, Osteoblasts: 0.36, Tissue_stem_cells: 0.35, Smooth_muscle_cells: 0.34, Chondrocytes: 0.34, MSC: 0.32, iPS_cells: 0.32, Neurons: 0.29, Endothelial_cells: 0.28, Astrocyte: 0.27 |
| TACGCTCCAAGTAGTA-1_HTA4_1018_4069 | Smooth_muscle_cells | 0.25 | 1779.91 | Raw ScoresFibroblasts: 0.44, Smooth_muscle_cells: 0.43, Osteoblasts: 0.43, MSC: 0.4, Chondrocytes: 0.4, Tissue_stem_cells: 0.4, iPS_cells: 0.39, Endothelial_cells: 0.39, Astrocyte: 0.38, Neurons: 0.37 |
| CCACAAACACCTCTAC-1_HTA4_1020_4078 | Smooth_muscle_cells | 0.18 | 1773.92 | Raw ScoresOsteoblasts: 0.3, Smooth_muscle_cells: 0.29, Fibroblasts: 0.29, MSC: 0.29, Tissue_stem_cells: 0.27, Chondrocytes: 0.27, iPS_cells: 0.27, Endothelial_cells: 0.26, Astrocyte: 0.26, Neurons: 0.25 |
| TCTTCCTGTCCGCAGT-1_HTA4_1017_4062 | Smooth_muscle_cells | 0.20 | 1684.57 | Raw ScoresFibroblasts: 0.34, Osteoblasts: 0.34, Smooth_muscle_cells: 0.33, Tissue_stem_cells: 0.32, MSC: 0.31, Chondrocytes: 0.3, iPS_cells: 0.3, Endothelial_cells: 0.28, Neurons: 0.27, Astrocyte: 0.26 |
| CATTGCCCATACACCA-1_HTA4_1018_4067 | Endothelial_cells | 0.17 | 1651.93 | Raw ScoresEndothelial_cells: 0.34, Osteoblasts: 0.33, Smooth_muscle_cells: 0.33, Fibroblasts: 0.33, Chondrocytes: 0.31, Tissue_stem_cells: 0.31, MSC: 0.3, iPS_cells: 0.3, Astrocyte: 0.29, Neurons: 0.28 |
| GTCATCCGTCTCTCAC-1_HTA4_1018_4070 | Smooth_muscle_cells | 0.34 | 1616.66 | Raw ScoresFibroblasts: 0.47, Smooth_muscle_cells: 0.47, Osteoblasts: 0.46, Chondrocytes: 0.44, Tissue_stem_cells: 0.42, MSC: 0.41, iPS_cells: 0.41, Neurons: 0.34, Astrocyte: 0.32, Endothelial_cells: 0.31 |
| TCCGAAAAGGGAGGAC-1_HTA4_1018_4069 | Smooth_muscle_cells | 0.25 | 1602.09 | Raw ScoresSmooth_muscle_cells: 0.46, Osteoblasts: 0.46, Fibroblasts: 0.46, Tissue_stem_cells: 0.45, Chondrocytes: 0.45, MSC: 0.44, iPS_cells: 0.43, Neurons: 0.39, Endothelial_cells: 0.39, Astrocyte: 0.37 |
| TTCATGTGTGCTGATT-1_HTA4_1018_4070 | Smooth_muscle_cells | 0.21 | 1581.30 | Raw ScoresOsteoblasts: 0.37, Smooth_muscle_cells: 0.37, Fibroblasts: 0.36, Tissue_stem_cells: 0.35, Chondrocytes: 0.35, MSC: 0.34, iPS_cells: 0.33, Neurons: 0.32, Endothelial_cells: 0.3, Astrocyte: 0.27 |
| TTGGATGGTATGCAAA-1_HTA4_1002_4007 | Smooth_muscle_cells | 0.24 | 1562.66 | Raw ScoresFibroblasts: 0.37, Osteoblasts: 0.37, Smooth_muscle_cells: 0.37, Chondrocytes: 0.35, Tissue_stem_cells: 0.35, MSC: 0.34, iPS_cells: 0.33, Neurons: 0.3, Endothelial_cells: 0.29, Astrocyte: 0.28 |
| ACCTGTCTCCTCTAAT-1_HTA4_1018_4070 | Fibroblasts | 0.20 | 1528.73 | Raw ScoresSmooth_muscle_cells: 0.31, Fibroblasts: 0.31, Osteoblasts: 0.3, Tissue_stem_cells: 0.28, Chondrocytes: 0.28, MSC: 0.27, iPS_cells: 0.27, Neurons: 0.24, Endothelial_cells: 0.23, Astrocyte: 0.23 |
| TGAGCATAGCACGATG-1_HTA4_1012_4046 | Endothelial_cells | 0.21 | 1519.40 | Raw ScoresEndothelial_cells: 0.47, Fibroblasts: 0.46, Smooth_muscle_cells: 0.46, Osteoblasts: 0.45, Tissue_stem_cells: 0.44, Chondrocytes: 0.44, MSC: 0.42, iPS_cells: 0.42, Neurons: 0.4, Astrocyte: 0.37 |
| GCACATAGTGCTCTTC-1_HTA4_1020_4077 | Osteoblasts | 0.23 | 1501.21 | Raw ScoresOsteoblasts: 0.41, Fibroblasts: 0.39, Smooth_muscle_cells: 0.38, MSC: 0.38, Chondrocytes: 0.37, Tissue_stem_cells: 0.37, iPS_cells: 0.36, Endothelial_cells: 0.33, Neurons: 0.31, Astrocyte: 0.3 |
| AGGGAGTAGTTTGGCT-1_HTA4_1008_4028 | Neurons | 0.22 | 1487.51 | Raw ScoresNeuroepithelial_cell: 0.39, Neurons: 0.39, MSC: 0.38, Endothelial_cells: 0.38, Astrocyte: 0.38, Fibroblasts: 0.36, Embryonic_stem_cells: 0.35, Osteoblasts: 0.35, Smooth_muscle_cells: 0.35, iPS_cells: 0.35 |
| TCAATTCTCCTCCACA-1_HTA4_1020_4078 | Smooth_muscle_cells | 0.18 | 1478.45 | Raw ScoresOsteoblasts: 0.28, MSC: 0.27, Smooth_muscle_cells: 0.27, Fibroblasts: 0.26, Tissue_stem_cells: 0.25, iPS_cells: 0.25, Chondrocytes: 0.25, Neurons: 0.23, Endothelial_cells: 0.22, Astrocyte: 0.22 |
| ATACCTTCACAGAGAC-1_HTA4_1018_4070 | Smooth_muscle_cells | 0.17 | 1466.55 | Raw ScoresOsteoblasts: 0.32, Fibroblasts: 0.32, Smooth_muscle_cells: 0.31, Tissue_stem_cells: 0.3, MSC: 0.3, Chondrocytes: 0.3, iPS_cells: 0.3, Neurons: 0.27, Endothelial_cells: 0.26, Astrocyte: 0.25 |
| TGATGGTGTGTAAATG-1_HTA4_1008_4028 | Neurons | 0.23 | 1465.94 | Raw ScoresNeuroepithelial_cell: 0.38, Astrocyte: 0.37, Neurons: 0.37, MSC: 0.36, Embryonic_stem_cells: 0.34, Fibroblasts: 0.33, Osteoblasts: 0.32, iPS_cells: 0.32, Smooth_muscle_cells: 0.31, Tissue_stem_cells: 0.31 |
| GAGTTACAGCCTGCCA-1_HTA4_1002_4007 | Neurons | 0.20 | 1459.47 | Raw ScoresNeuroepithelial_cell: 0.34, Astrocyte: 0.33, Neurons: 0.33, Fibroblasts: 0.33, MSC: 0.33, Smooth_muscle_cells: 0.33, Osteoblasts: 0.32, iPS_cells: 0.31, Tissue_stem_cells: 0.3, Embryonic_stem_cells: 0.3 |
| TGATGCAAGTTGCTGT-1_HTA4_1018_4067 | Smooth_muscle_cells | 0.20 | 1449.88 | Raw ScoresOsteoblasts: 0.35, Fibroblasts: 0.34, Smooth_muscle_cells: 0.34, Chondrocytes: 0.33, Tissue_stem_cells: 0.33, MSC: 0.32, iPS_cells: 0.31, Neurons: 0.29, Astrocyte: 0.28, Endothelial_cells: 0.28 |
| GCGTTTCTCGCTGACG-1_HTA4_1018_4070 | Smooth_muscle_cells | 0.21 | 1435.03 | Raw ScoresOsteoblasts: 0.35, Smooth_muscle_cells: 0.35, Fibroblasts: 0.34, Chondrocytes: 0.33, Tissue_stem_cells: 0.33, MSC: 0.31, iPS_cells: 0.31, Endothelial_cells: 0.29, Neurons: 0.28, Astrocyte: 0.27 |
| CATGCAACAAGTAGTA-1_HTA4_1020_4078 | Neurons | 0.09 | 1434.85 | Raw ScoresAstrocyte: 0.22, Smooth_muscle_cells: 0.22, Osteoblasts: 0.22, Fibroblasts: 0.22, MSC: 0.21, Neurons: 0.21, Neuroepithelial_cell: 0.2, Tissue_stem_cells: 0.2, Endothelial_cells: 0.19, iPS_cells: 0.19 |
| ACATCGACAACTGATC-1_HTA4_1018_4070 | Smooth_muscle_cells | 0.16 | 1418.49 | Raw ScoresFibroblasts: 0.3, Osteoblasts: 0.3, Smooth_muscle_cells: 0.29, Chondrocytes: 0.29, Tissue_stem_cells: 0.28, MSC: 0.28, iPS_cells: 0.28, Neurons: 0.26, Endothelial_cells: 0.24, Astrocyte: 0.22 |
| AGTACCATCTATACTC-1_HTA4_1018_4070 | Smooth_muscle_cells | 0.18 | 1409.61 | Raw ScoresOsteoblasts: 0.33, Fibroblasts: 0.33, Smooth_muscle_cells: 0.33, Chondrocytes: 0.33, Tissue_stem_cells: 0.32, MSC: 0.32, iPS_cells: 0.31, Neurons: 0.29, Astrocyte: 0.27, Endothelial_cells: 0.26 |
| CCACACTGTTTAGACC-1_HTA4_1018_4067 | Smooth_muscle_cells | 0.16 | 1404.26 | Raw ScoresFibroblasts: 0.27, Osteoblasts: 0.27, Smooth_muscle_cells: 0.27, MSC: 0.25, Tissue_stem_cells: 0.25, Chondrocytes: 0.25, Endothelial_cells: 0.24, iPS_cells: 0.24, Neurons: 0.24, Astrocyte: 0.23 |
| AGATCCATCCATTGCC-1_HTA4_1016_4061 | Osteoblasts | 0.15 | 1402.49 | Raw ScoresFibroblasts: 0.26, Osteoblasts: 0.26, Tissue_stem_cells: 0.25, Smooth_muscle_cells: 0.25, MSC: 0.25, Neuroepithelial_cell: 0.25, Astrocyte: 0.24, Chondrocytes: 0.24, Neurons: 0.24, Endothelial_cells: 0.23 |
| AAGAACAAGCAACCAG-1_HTA4_1002_4008 | Smooth_muscle_cells | 0.27 | 1400.61 | Raw ScoresFibroblasts: 0.41, Osteoblasts: 0.39, Smooth_muscle_cells: 0.38, Chondrocytes: 0.38, iPS_cells: 0.36, MSC: 0.36, Tissue_stem_cells: 0.36, Neurons: 0.31, Neuroepithelial_cell: 0.29, Endothelial_cells: 0.28 |
| TGTTCTATCAGGACAG-1_HTA4_1002_4008 | Tissue_stem_cells | 0.18 | 1395.49 | Raw ScoresFibroblasts: 0.3, Osteoblasts: 0.3, Chondrocytes: 0.29, Smooth_muscle_cells: 0.29, MSC: 0.29, Tissue_stem_cells: 0.28, Astrocyte: 0.28, iPS_cells: 0.28, Neuroepithelial_cell: 0.27, Neurons: 0.27 |
| TAGACCATCTCTGGTC-1_HTA4_1005_4016 | Smooth_muscle_cells | 0.20 | 1361.78 | Raw ScoresFibroblasts: 0.35, Smooth_muscle_cells: 0.35, Osteoblasts: 0.34, Chondrocytes: 0.33, MSC: 0.33, iPS_cells: 0.31, Tissue_stem_cells: 0.31, Astrocyte: 0.3, Neurons: 0.29, Neuroepithelial_cell: 0.27 |
| AAAGGGCCAACACGAG-1_HTA4_1009_4031 | Smooth_muscle_cells | 0.28 | 1355.21 | Raw ScoresFibroblasts: 0.43, Smooth_muscle_cells: 0.43, Osteoblasts: 0.42, Chondrocytes: 0.41, Tissue_stem_cells: 0.4, MSC: 0.39, iPS_cells: 0.39, Neurons: 0.36, Astrocyte: 0.33, Endothelial_cells: 0.31 |
| CTCATTATCTCATTGT-1_HTA4_1020_4078 | Smooth_muscle_cells | 0.23 | 1346.84 | Raw ScoresOsteoblasts: 0.39, Fibroblasts: 0.38, Smooth_muscle_cells: 0.38, MSC: 0.37, Chondrocytes: 0.36, Endothelial_cells: 0.36, Tissue_stem_cells: 0.36, iPS_cells: 0.35, Neurons: 0.31, Astrocyte: 0.3 |
| ATGTCCCGTTGGTGTT-1_HTA4_1018_4071 | Smooth_muscle_cells | 0.17 | 1344.00 | Raw ScoresSmooth_muscle_cells: 0.31, Fibroblasts: 0.31, Osteoblasts: 0.3, Tissue_stem_cells: 0.3, Chondrocytes: 0.29, MSC: 0.28, iPS_cells: 0.28, Neurons: 0.26, Endothelial_cells: 0.25, Astrocyte: 0.23 |
| CTAGGTATCCGGTAAT-1_HTA4_1018_4067 | Smooth_muscle_cells | 0.13 | 1306.53 | Raw ScoresOsteoblasts: 0.33, Smooth_muscle_cells: 0.33, Fibroblasts: 0.32, Tissue_stem_cells: 0.32, Chondrocytes: 0.31, MSC: 0.29, iPS_cells: 0.29, Endothelial_cells: 0.29, Neurons: 0.29, Astrocyte: 0.26 |
| GATCACAGTTAACCTG-1_HTA4_1008_4027 | Neurons | 0.26 | 1303.26 | Raw ScoresNeuroepithelial_cell: 0.47, Neurons: 0.46, Astrocyte: 0.44, MSC: 0.43, Embryonic_stem_cells: 0.42, iPS_cells: 0.39, Fibroblasts: 0.39, Endothelial_cells: 0.38, Tissue_stem_cells: 0.38, Smooth_muscle_cells: 0.37 |
Below shows the significant enrichments of this GEP for literature curated gene lists
This data was procured from existing single cell RNA-seq maps of neuroblastoma or related relevant data.
High ranks indicate this gene is a driver of this GEP.
These curated gene list are ranked by the P-value (on this GEP) of their constituent genes.
The Mean Count column shows the mean read count in cells scoring highly (H > 50) on this gene expression program.
Myofibroblastic CAF
These marker genes were curated across cancer subtypes in multiple organ systems as reviewed in Lavie et. al. (PMID 35883004) and contain myofibroblastic specific CAF genes:
Wilcoxon ranksum test P-value for gene set overrepresentation: 1.30e-12
Mean rank of genes in gene set: 4360.12
Rank on gene expression program of genes in gene set:
| Genes | Weight | Rank | GTEx | DepMap | Decartes | Mean.Counts | Mean.TPM |
|---|---|---|---|---|---|---|---|
| COL4A1 | 0.0040172 | 30 | GTEx | DepMap | Descartes | 10.82 | 1150.26 |
| IGFBP7 | 0.0034665 | 41 | GTEx | DepMap | Descartes | 14.78 | 6708.68 |
| ITGA7 | 0.0026557 | 74 | GTEx | DepMap | Descartes | 0.33 | 60.38 |
| MMP11 | 0.0025836 | 81 | GTEx | DepMap | Descartes | 0.30 | 56.68 |
| MEF2C | 0.0023838 | 91 | GTEx | DepMap | Descartes | 2.14 | 183.97 |
| COL5A1 | 0.0023439 | 95 | GTEx | DepMap | Descartes | 2.96 | 238.14 |
| BGN | 0.0021902 | 109 | GTEx | DepMap | Descartes | 1.48 | 408.48 |
| ACTA2 | 0.0017911 | 158 | GTEx | DepMap | Descartes | 1.79 | 888.81 |
| MYH11 | 0.0017872 | 159 | GTEx | DepMap | Descartes | 0.94 | 105.45 |
| MYLK | 0.0017175 | 173 | GTEx | DepMap | Descartes | 1.06 | 71.15 |
| COL5A2 | 0.0016322 | 186 | GTEx | DepMap | Descartes | 3.98 | 374.57 |
| MYL9 | 0.0015445 | 197 | GTEx | DepMap | Descartes | 0.83 | 197.98 |
| PGF | 0.0015205 | 202 | GTEx | DepMap | Descartes | 0.17 | 35.93 |
| TPM2 | 0.0015188 | 203 | GTEx | DepMap | Descartes | 0.74 | 314.57 |
| FN1 | 0.0014897 | 210 | GTEx | DepMap | Descartes | 8.83 | 595.20 |
| TPM1 | 0.0013352 | 251 | GTEx | DepMap | Descartes | 3.64 | 619.57 |
| COL1A2 | 0.0013263 | 254 | GTEx | DepMap | Descartes | 13.52 | 1351.25 |
| POSTN | 0.0013185 | 257 | GTEx | DepMap | Descartes | 2.98 | 535.40 |
| TNC | 0.0012629 | 276 | GTEx | DepMap | Descartes | 3.30 | 275.69 |
| RGS5 | 0.0012262 | 292 | GTEx | DepMap | Descartes | 2.08 | 228.40 |
| COL3A1 | 0.0011973 | 301 | GTEx | DepMap | Descartes | 12.13 | 1295.73 |
| THY1 | 0.0011098 | 326 | GTEx | DepMap | Descartes | 1.23 | 162.20 |
| COL1A1 | 0.0010090 | 374 | GTEx | DepMap | Descartes | 13.32 | 1330.68 |
| COL12A1 | 0.0008653 | 462 | GTEx | DepMap | Descartes | 2.57 | 137.47 |
| COL14A1 | 0.0008410 | 484 | GTEx | DepMap | Descartes | 2.15 | 172.96 |
| TAGLN | 0.0008049 | 518 | GTEx | DepMap | Descartes | 1.59 | 266.90 |
| TGFB1 | 0.0006164 | 691 | GTEx | DepMap | Descartes | 0.63 | 149.58 |
| COL13A1 | 0.0005273 | 825 | GTEx | DepMap | Descartes | 0.05 | 10.46 |
| THBS2 | 0.0005006 | 873 | GTEx | DepMap | Descartes | 2.82 | 284.14 |
| TMEM119 | 0.0002936 | 1454 | GTEx | DepMap | Descartes | 0.16 | 32.33 |
| COL10A1 | 0.0002896 | 1470 | GTEx | DepMap | Descartes | 0.34 | 51.05 |
| CNN3 | 0.0002726 | 1558 | GTEx | DepMap | Descartes | 1.17 | 353.81 |
| COL15A1 | 0.0001950 | 2053 | GTEx | DepMap | Descartes | 1.17 | 111.17 |
| TGFB2 | 0.0001732 | 2257 | GTEx | DepMap | Descartes | 0.31 | 32.04 |
| CNN2 | 0.0001424 | 2589 | GTEx | DepMap | Descartes | 0.21 | 59.44 |
| ACTG2 | 0.0001399 | 2629 | GTEx | DepMap | Descartes | 0.07 | 23.81 |
| LUM | 0.0000726 | 3898 | GTEx | DepMap | Descartes | 1.60 | 323.77 |
| WNT5A | 0.0000185 | 6181 | GTEx | DepMap | Descartes | 0.06 | 5.18 |
| HOPX | 0.0000131 | 6563 | GTEx | DepMap | Descartes | 0.19 | 28.32 |
| THBS1 | -0.0000087 | 10034 | GTEx | DepMap | Descartes | 3.83 | 308.94 |
| TGFBR1 | -0.0000379 | 13004 | GTEx | DepMap | Descartes | 0.89 | 78.63 |
| VCAN | -0.0001079 | 16387 | GTEx | DepMap | Descartes | 4.91 | 224.70 |
| COL8A1 | -0.0001746 | 18042 | GTEx | DepMap | Descartes | 2.29 | 217.97 |
| VEGFA | -0.0001754 | 18057 | GTEx | DepMap | Descartes | 0.66 | 29.84 |
| MMP2 | -0.0002988 | 19562 | GTEx | DepMap | Descartes | 0.25 | 43.39 |
| DCN | -0.0003064 | 19603 | GTEx | DepMap | Descartes | 1.90 | 162.81 |
| IGFBP3 | -0.0003404 | 19783 | GTEx | DepMap | Descartes | 0.31 | 68.00 |
| TGFBR2 | -0.0003496 | 19822 | GTEx | DepMap | Descartes | 1.63 | 151.93 |
| COL11A1 | -0.0007419 | 20507 | GTEx | DepMap | Descartes | 0.51 | 34.92 |
Stroma (Hanemaaijer)
Marker genes obtained from Supplementary Table SD of Hanemaaijer et al (PMID 33500353). The authors generated single-cell RNA-seq data (sort-seq, 2,229 cells total) from mouse adrenal glads at E13.5, E14.5, E17.5, E18.5, P1 and P5. These were marker genes that matched with a similar dataset generated by Furlan et al (PMID 28684471). This particular set of markers are for the broad Stroma cluster:
Wilcoxon ranksum test P-value for gene set overrepresentation: 8.96e-05
Mean rank of genes in gene set: 337.2
Rank on gene expression program of genes in gene set:
| Genes | Weight | Rank | GTEx | DepMap | Decartes | Mean.Counts | Mean.TPM |
|---|---|---|---|---|---|---|---|
| COL5A1 | 0.0023439 | 95 | GTEx | DepMap | Descartes | 2.96 | 238.14 |
| COL6A1 | 0.0021067 | 116 | GTEx | DepMap | Descartes | 1.83 | 286.96 |
| FN1 | 0.0014897 | 210 | GTEx | DepMap | Descartes | 8.83 | 595.20 |
| COL3A1 | 0.0011973 | 301 | GTEx | DepMap | Descartes | 12.13 | 1295.73 |
| GPC3 | 0.0004560 | 964 | GTEx | DepMap | Descartes | 0.72 | 199.23 |
Mesenchymal Fig 1D (Olsen)
Selected mesenchymal marker genes shown in Fig. 1D of Olsen et al. https://www.biorxiv.org/content/10.1101/2020.05.04.077057v1 - these are highly expressed in their mesenchymal cluster on their UMAP.:
Wilcoxon ranksum test P-value for gene set overrepresentation: 2.86e-04
Mean rank of genes in gene set: 4617.15
Rank on gene expression program of genes in gene set:
| Genes | Weight | Rank | GTEx | DepMap | Decartes | Mean.Counts | Mean.TPM |
|---|---|---|---|---|---|---|---|
| CALD1 | 0.0034248 | 42 | GTEx | DepMap | Descartes | 12.46 | 1676.00 |
| COL6A2 | 0.0033889 | 46 | GTEx | DepMap | Descartes | 2.83 | 574.80 |
| BGN | 0.0021902 | 109 | GTEx | DepMap | Descartes | 1.48 | 408.48 |
| PRRX1 | 0.0020963 | 117 | GTEx | DepMap | Descartes | 1.98 | 319.96 |
| SPARC | 0.0016324 | 185 | GTEx | DepMap | Descartes | 5.15 | 877.48 |
| COL1A2 | 0.0013263 | 254 | GTEx | DepMap | Descartes | 13.52 | 1351.25 |
| COL3A1 | 0.0011973 | 301 | GTEx | DepMap | Descartes | 12.13 | 1295.73 |
| COL1A1 | 0.0010090 | 374 | GTEx | DepMap | Descartes | 13.32 | 1330.68 |
| MGP | 0.0008822 | 451 | GTEx | DepMap | Descartes | 4.91 | 1600.61 |
| LUM | 0.0000726 | 3898 | GTEx | DepMap | Descartes | 1.60 | 323.77 |
| LEPR | -0.0000898 | 15749 | GTEx | DepMap | Descartes | 0.75 | 47.33 |
| PDGFRA | -0.0002293 | 18894 | GTEx | DepMap | Descartes | 0.25 | 21.86 |
| DCN | -0.0003064 | 19603 | GTEx | DepMap | Descartes | 1.90 | 162.81 |
Below shows ranks on this GEP for literature curated gene lists for large gene sets
These include those reported as mesenchymal/adrenergic by Van Groningen et al.
High ranks indicate this gene is a driver of this GEP (note these results are not ordered).
The Mean Count column shows the mean read count in cells scoring highly (H > 50) on this gene expression program.
VanGroningen Adrenergic Genes
Adrenergic marker genes from Supplementary Table 2 of Van Groningen et al. Nature Genetics 2017. These genes were identified by differential expression analysis of mesenchymal-like and adrenergic-like neuroblastoma cell lines.
Wilcoxon ranksum test P-value for gene set overrepresentation: 1.00e+00
Mean rank of genes in gene set: 17416.42
Median rank of genes in gene set: 19230
Rank on gene expression program of top 30 genes in gene set:
| Genes | Weight | Rank | GTEx | DepMap | Descartes | Mean.Counts | Mean.TPM |
|---|---|---|---|---|---|---|---|
| SLIT3 | 0.0019308 | 140 | GTEx | DepMap | Descartes | 7.80 | 501.55 |
| RGS5 | 0.0012262 | 292 | GTEx | DepMap | Descartes | 2.08 | 228.40 |
| ARHGEF7 | 0.0011440 | 318 | GTEx | DepMap | Descartes | 2.53 | 256.96 |
| SYNPO2 | 0.0008543 | 475 | GTEx | DepMap | Descartes | 2.82 | 124.05 |
| CYGB | 0.0007093 | 599 | GTEx | DepMap | Descartes | 0.35 | 113.99 |
| EML4 | 0.0004654 | 941 | GTEx | DepMap | Descartes | 3.10 | 326.76 |
| RUFY3 | 0.0002753 | 1539 | GTEx | DepMap | Descartes | 2.41 | 307.51 |
| KLF13 | 0.0002037 | 1989 | GTEx | DepMap | Descartes | 0.67 | 55.51 |
| KLHL23 | 0.0002021 | 2002 | GTEx | DepMap | Descartes | 0.78 | 111.54 |
| GNB1 | 0.0001683 | 2308 | GTEx | DepMap | Descartes | 2.86 | 518.11 |
| KLC1 | 0.0001630 | 2355 | GTEx | DepMap | Descartes | 1.05 | 41.26 |
| AKAP12 | 0.0001378 | 2661 | GTEx | DepMap | Descartes | 3.82 | 271.78 |
| HEY1 | 0.0000917 | 3449 | GTEx | DepMap | Descartes | 0.06 | 8.70 |
| GLRX | 0.0000888 | 3502 | GTEx | DepMap | Descartes | 0.27 | 43.68 |
| TENM4 | 0.0000699 | 3978 | GTEx | DepMap | Descartes | 2.91 | NA |
| ZNF91 | 0.0000512 | 4535 | GTEx | DepMap | Descartes | 1.25 | 124.63 |
| RBMS3 | 0.0000501 | 4576 | GTEx | DepMap | Descartes | 4.66 | 323.53 |
| TMEM108 | 0.0000487 | 4626 | GTEx | DepMap | Descartes | 1.73 | 131.69 |
| NAPB | 0.0000354 | 5175 | GTEx | DepMap | Descartes | 0.45 | 64.46 |
| ANP32A | 0.0000303 | 5453 | GTEx | DepMap | Descartes | 0.40 | 63.48 |
| PARP6 | 0.0000278 | 5589 | GTEx | DepMap | Descartes | 0.37 | 58.30 |
| DNAJC9 | 0.0000224 | 5914 | GTEx | DepMap | Descartes | 0.42 | 102.15 |
| ZNF22 | 0.0000200 | 6067 | GTEx | DepMap | Descartes | 0.13 | 35.02 |
| DKK1 | 0.0000138 | 6507 | GTEx | DepMap | Descartes | 0.01 | 2.38 |
| SETD7 | 0.0000112 | 6711 | GTEx | DepMap | Descartes | 0.45 | 33.47 |
| PPP2R3C | 0.0000038 | 7430 | GTEx | DepMap | Descartes | 0.53 | 164.71 |
| NPTX2 | 0.0000002 | 7913 | GTEx | DepMap | Descartes | 0.06 | 10.03 |
| HK2 | -0.0000021 | 8897 | GTEx | DepMap | Descartes | 0.12 | 12.24 |
| STRA6 | -0.0000034 | 9115 | GTEx | DepMap | Descartes | 0.09 | 18.06 |
| DIABLO | -0.0000039 | 9220 | GTEx | DepMap | Descartes | 0.00 | 0.09 |
VanGroningen Mesenchymal Genes
Mesenchymal marker genes from Supplementary Table 2 of Van Groningen et al. Nature Genetics 2017. These genes were identified by differential expression analysis of mesenchymal-like and adrenergic-like neuroblastoma cell lines.
Wilcoxon ranksum test P-value for gene set overrepresentation: 8.62e-67
Mean rank of genes in gene set: 5626.02
Median rank of genes in gene set: 2116
Rank on gene expression program of top 30 genes in gene set:
| Genes | Weight | Rank | GTEx | DepMap | Descartes | Mean.Counts | Mean.TPM |
|---|---|---|---|---|---|---|---|
| EDNRA | 0.0062143 | 8 | GTEx | DepMap | Descartes | 1.42 | 255.37 |
| EPS8 | 0.0053155 | 13 | GTEx | DepMap | Descartes | 5.53 | 807.95 |
| COL4A2 | 0.0042830 | 25 | GTEx | DepMap | Descartes | 9.48 | 1043.05 |
| COL4A1 | 0.0040172 | 30 | GTEx | DepMap | Descartes | 10.82 | 1150.26 |
| PEAK1 | 0.0038406 | 33 | GTEx | DepMap | Descartes | 5.84 | NA |
| PDE3A | 0.0037155 | 37 | GTEx | DepMap | Descartes | 7.15 | 621.34 |
| CALD1 | 0.0034248 | 42 | GTEx | DepMap | Descartes | 12.46 | 1676.00 |
| COL6A2 | 0.0033889 | 46 | GTEx | DepMap | Descartes | 2.83 | 574.80 |
| COL6A3 | 0.0032111 | 55 | GTEx | DepMap | Descartes | 4.68 | 302.41 |
| EPHA3 | 0.0029052 | 64 | GTEx | DepMap | Descartes | 2.52 | 316.83 |
| OLFML2A | 0.0026301 | 76 | GTEx | DepMap | Descartes | 0.24 | 27.49 |
| SPARCL1 | 0.0026104 | 77 | GTEx | DepMap | Descartes | 1.33 | 286.23 |
| PTPRG | 0.0024051 | 90 | GTEx | DepMap | Descartes | 8.94 | 613.93 |
| ID3 | 0.0023468 | 94 | GTEx | DepMap | Descartes | 0.72 | 455.07 |
| COL5A1 | 0.0023439 | 95 | GTEx | DepMap | Descartes | 2.96 | 238.14 |
| TNS1 | 0.0023239 | 96 | GTEx | DepMap | Descartes | 2.75 | 179.42 |
| NID2 | 0.0023053 | 97 | GTEx | DepMap | Descartes | 0.54 | 73.31 |
| MAML2 | 0.0022815 | 100 | GTEx | DepMap | Descartes | 7.63 | 715.82 |
| TFPI | 0.0022243 | 105 | GTEx | DepMap | Descartes | 1.98 | 170.61 |
| DLC1 | 0.0022182 | 106 | GTEx | DepMap | Descartes | 16.17 | 1383.65 |
| BGN | 0.0021902 | 109 | GTEx | DepMap | Descartes | 1.48 | 408.48 |
| OLFML2B | 0.0021544 | 113 | GTEx | DepMap | Descartes | 0.85 | 187.75 |
| COL6A1 | 0.0021067 | 116 | GTEx | DepMap | Descartes | 1.83 | 286.96 |
| PRRX1 | 0.0020963 | 117 | GTEx | DepMap | Descartes | 1.98 | 319.96 |
| KANK2 | 0.0020909 | 119 | GTEx | DepMap | Descartes | 0.53 | 78.03 |
| MICAL2 | 0.0019451 | 137 | GTEx | DepMap | Descartes | 2.30 | 235.28 |
| NID1 | 0.0019281 | 142 | GTEx | DepMap | Descartes | 1.38 | 166.74 |
| SVIL | 0.0019049 | 145 | GTEx | DepMap | Descartes | 6.13 | 475.87 |
| YAP1 | 0.0018603 | 151 | GTEx | DepMap | Descartes | 1.86 | 229.04 |
| SASH1 | 0.0018464 | 153 | GTEx | DepMap | Descartes | 3.01 | 282.72 |
Descartes adrenocortical markers
Top 50 marker genes of adrenocortical cells in the Decartes fetal adrenal single cell map (https://atlas.brotmanbaty.org/bbi/human-gene-expression-during-development/cell/adrenocortical/in/adrenal)
Wilcoxon ranksum test P-value for gene set overrepresentation: 1.00e+00
Mean rank of genes in gene set: 16808.02
Median rank of genes in gene set: 18262
Rank on gene expression program of top 30 genes in gene set:
| Genes | Weight | Rank | GTEx | DepMap | Descartes | Mean.Counts | Mean.TPM |
|---|---|---|---|---|---|---|---|
| SH3PXD2B | 0.0005851 | 734 | GTEx | DepMap | Descartes | 1.29 | 102.44 |
| PDE10A | 0.0000580 | 4309 | GTEx | DepMap | Descartes | 3.36 | 184.48 |
| SLC2A14 | 0.0000132 | 6547 | GTEx | DepMap | Descartes | 0.05 | 5.79 |
| NPC1 | -0.0000062 | 9624 | GTEx | DepMap | Descartes | 0.66 | 72.52 |
| APOC1 | -0.0000328 | 12630 | GTEx | DepMap | Descartes | 0.41 | 367.94 |
| PEG3 | -0.0000438 | 13381 | GTEx | DepMap | Descartes | 0.01 | NA |
| PAPSS2 | -0.0000455 | 13484 | GTEx | DepMap | Descartes | 1.19 | 145.91 |
| INHA | -0.0000463 | 13532 | GTEx | DepMap | Descartes | 0.02 | 9.14 |
| FREM2 | -0.0000478 | 13617 | GTEx | DepMap | Descartes | 0.04 | 1.05 |
| IGF1R | -0.0000852 | 15569 | GTEx | DepMap | Descartes | 4.21 | 180.73 |
| CYP11A1 | -0.0001028 | 16215 | GTEx | DepMap | Descartes | 0.38 | 50.92 |
| FDXR | -0.0001180 | 16709 | GTEx | DepMap | Descartes | 0.08 | 16.97 |
| SCAP | -0.0001349 | 17195 | GTEx | DepMap | Descartes | 0.43 | 49.06 |
| BAIAP2L1 | -0.0001448 | 17439 | GTEx | DepMap | Descartes | 0.22 | 24.10 |
| CYP11B1 | -0.0001453 | 17449 | GTEx | DepMap | Descartes | 0.52 | 39.87 |
| POR | -0.0001518 | 17598 | GTEx | DepMap | Descartes | 0.86 | 147.57 |
| MC2R | -0.0001628 | 17838 | GTEx | DepMap | Descartes | 0.09 | 7.92 |
| DHCR7 | -0.0001629 | 17840 | GTEx | DepMap | Descartes | 0.06 | 11.57 |
| CYP17A1 | -0.0001656 | 17895 | GTEx | DepMap | Descartes | 0.15 | 30.94 |
| GSTA4 | -0.0001667 | 17925 | GTEx | DepMap | Descartes | 0.44 | 126.69 |
| SCARB1 | -0.0001715 | 17988 | GTEx | DepMap | Descartes | 2.08 | 106.96 |
| SH3BP5 | -0.0001830 | 18179 | GTEx | DepMap | Descartes | 1.59 | 219.22 |
| GRAMD1B | -0.0001885 | 18262 | GTEx | DepMap | Descartes | 1.58 | 66.98 |
| FDX1 | -0.0001942 | 18368 | GTEx | DepMap | Descartes | 1.20 | 132.72 |
| HMGCS1 | -0.0001974 | 18428 | GTEx | DepMap | Descartes | 0.54 | 46.45 |
| FDPS | -0.0001976 | 18431 | GTEx | DepMap | Descartes | 0.57 | 143.53 |
| SULT2A1 | -0.0002012 | 18489 | GTEx | DepMap | Descartes | 0.11 | 22.17 |
| ERN1 | -0.0002204 | 18784 | GTEx | DepMap | Descartes | 0.82 | 42.57 |
| CYB5B | -0.0002279 | 18873 | GTEx | DepMap | Descartes | 0.51 | 55.89 |
| TM7SF2 | -0.0002320 | 18920 | GTEx | DepMap | Descartes | 0.10 | 24.31 |
Descartes chromaffin markers
Top 50 marker genes of chromaffin cells in the Decartes fetal adrenal single cell map (https://atlas.brotmanbaty.org/bbi/human-gene-expression-during-development/cell/chromaffin/in/adrenal)
Wilcoxon ranksum test P-value for gene set overrepresentation: 1.00e+00
Mean rank of genes in gene set: 18858.84
Median rank of genes in gene set: 19805
Rank on gene expression program of top 30 genes in gene set:
| Genes | Weight | Rank | GTEx | DepMap | Descartes | Mean.Counts | Mean.TPM |
|---|---|---|---|---|---|---|---|
| SYNPO2 | 0.0008543 | 475 | GTEx | DepMap | Descartes | 2.82 | 124.05 |
| FAT3 | 0.0001362 | 2683 | GTEx | DepMap | Descartes | 0.65 | 22.05 |
| RPH3A | -0.0001295 | 17040 | GTEx | DepMap | Descartes | 0.14 | 7.97 |
| NPY | -0.0002004 | 18474 | GTEx | DepMap | Descartes | 1.99 | 2254.69 |
| GREM1 | -0.0002037 | 18535 | GTEx | DepMap | Descartes | 0.33 | 12.90 |
| EYA4 | -0.0002150 | 18706 | GTEx | DepMap | Descartes | 0.39 | 28.85 |
| MAB21L1 | -0.0002189 | 18761 | GTEx | DepMap | Descartes | 0.15 | 30.94 |
| NTRK1 | -0.0002293 | 18897 | GTEx | DepMap | Descartes | 0.25 | 31.28 |
| TMEFF2 | -0.0002314 | 18914 | GTEx | DepMap | Descartes | 0.68 | 85.98 |
| GAL | -0.0002492 | 19110 | GTEx | DepMap | Descartes | 0.57 | 520.87 |
| SLC6A2 | -0.0002536 | 19149 | GTEx | DepMap | Descartes | 0.18 | 25.20 |
| RGMB | -0.0002560 | 19184 | GTEx | DepMap | Descartes | 0.31 | 34.62 |
| TUBB2A | -0.0002662 | 19285 | GTEx | DepMap | Descartes | 0.98 | 345.28 |
| MAP1B | -0.0002728 | 19343 | GTEx | DepMap | Descartes | 6.32 | 285.99 |
| PLXNA4 | -0.0002771 | 19387 | GTEx | DepMap | Descartes | 1.10 | 32.97 |
| ANKFN1 | -0.0002843 | 19444 | GTEx | DepMap | Descartes | 0.69 | 65.35 |
| CNTFR | -0.0002961 | 19542 | GTEx | DepMap | Descartes | 0.24 | 47.62 |
| PTCHD1 | -0.0003047 | 19595 | GTEx | DepMap | Descartes | 0.35 | 9.42 |
| HMX1 | -0.0003144 | 19652 | GTEx | DepMap | Descartes | 0.31 | 65.38 |
| REEP1 | -0.0003151 | 19655 | GTEx | DepMap | Descartes | 0.66 | 64.50 |
| IL7 | -0.0003325 | 19751 | GTEx | DepMap | Descartes | 2.18 | 486.08 |
| MAB21L2 | -0.0003461 | 19805 | GTEx | DepMap | Descartes | 0.06 | 14.54 |
| EPHA6 | -0.0003954 | 20010 | GTEx | DepMap | Descartes | 1.55 | 142.15 |
| PRPH | -0.0003978 | 20019 | GTEx | DepMap | Descartes | 0.90 | 249.97 |
| RYR2 | -0.0004031 | 20036 | GTEx | DepMap | Descartes | 4.47 | 103.71 |
| HS3ST5 | -0.0004053 | 20042 | GTEx | DepMap | Descartes | 0.80 | 85.48 |
| STMN4 | -0.0004061 | 20045 | GTEx | DepMap | Descartes | 0.46 | 109.84 |
| MLLT11 | -0.0004413 | 20133 | GTEx | DepMap | Descartes | 0.57 | 129.65 |
| SLC44A5 | -0.0004611 | 20185 | GTEx | DepMap | Descartes | 0.99 | 82.67 |
| GAP43 | -0.0004777 | 20216 | GTEx | DepMap | Descartes | 1.57 | 392.44 |
Descartes Vascular_endothelial markers
Top 50 marker genes of Vascular_endothelial cells in the Decartes fetal adrenal single cell map (https://atlas.brotmanbaty.org/bbi/human-gene-expression-during-development/cell/vascular_endothelial/in/adrenal)
Wilcoxon ranksum test P-value for gene set overrepresentation: 1.00e+00
Mean rank of genes in gene set: 14594.98
Median rank of genes in gene set: 17447
Rank on gene expression program of top 30 genes in gene set:
| Genes | Weight | Rank | GTEx | DepMap | Descartes | Mean.Counts | Mean.TPM |
|---|---|---|---|---|---|---|---|
| ARHGAP29 | 0.0007564 | 558 | GTEx | DepMap | Descartes | 1.16 | 76.22 |
| CYP26B1 | 0.0007143 | 597 | GTEx | DepMap | Descartes | 0.04 | 6.50 |
| CDH13 | 0.0004392 | 998 | GTEx | DepMap | Descartes | 2.23 | 159.46 |
| APLNR | 0.0003613 | 1190 | GTEx | DepMap | Descartes | 0.08 | 15.44 |
| CALCRL | 0.0001213 | 2898 | GTEx | DepMap | Descartes | 0.95 | 88.94 |
| MMRN2 | 0.0000659 | 4084 | GTEx | DepMap | Descartes | 0.10 | 13.09 |
| CLDN5 | 0.0000574 | 4334 | GTEx | DepMap | Descartes | 0.11 | 22.93 |
| SOX18 | 0.0000171 | 6266 | GTEx | DepMap | Descartes | 0.08 | 23.20 |
| EHD3 | 0.0000149 | 6415 | GTEx | DepMap | Descartes | 0.26 | 24.53 |
| ID1 | -0.0000051 | 9448 | GTEx | DepMap | Descartes | 0.21 | 85.03 |
| ECSCR | -0.0000215 | 11662 | GTEx | DepMap | Descartes | 0.00 | 0.10 |
| F8 | -0.0000400 | 13116 | GTEx | DepMap | Descartes | 0.14 | 7.84 |
| ROBO4 | -0.0000643 | 14545 | GTEx | DepMap | Descartes | 0.07 | 8.79 |
| IRX3 | -0.0000713 | 14913 | GTEx | DepMap | Descartes | 0.01 | 1.42 |
| TM4SF18 | -0.0000773 | 15177 | GTEx | DepMap | Descartes | 0.04 | 5.17 |
| PLVAP | -0.0000786 | 15242 | GTEx | DepMap | Descartes | 0.22 | 53.21 |
| ESM1 | -0.0000887 | 15708 | GTEx | DepMap | Descartes | 0.06 | 19.21 |
| HYAL2 | -0.0000952 | 15962 | GTEx | DepMap | Descartes | 0.13 | 16.64 |
| TMEM88 | -0.0001040 | 16246 | GTEx | DepMap | Descartes | 0.04 | 22.75 |
| CRHBP | -0.0001085 | 16407 | GTEx | DepMap | Descartes | 0.03 | 7.49 |
| FCGR2B | -0.0001356 | 17215 | GTEx | DepMap | Descartes | 0.02 | 1.54 |
| BTNL9 | -0.0001448 | 17440 | GTEx | DepMap | Descartes | 0.09 | 13.58 |
| RASIP1 | -0.0001455 | 17454 | GTEx | DepMap | Descartes | 0.09 | 13.09 |
| KANK3 | -0.0001460 | 17467 | GTEx | DepMap | Descartes | 0.08 | 13.75 |
| NPR1 | -0.0001778 | 18101 | GTEx | DepMap | Descartes | 0.03 | 3.52 |
| SHE | -0.0001810 | 18152 | GTEx | DepMap | Descartes | 0.08 | 5.44 |
| RAMP2 | -0.0001841 | 18196 | GTEx | DepMap | Descartes | 0.10 | 64.74 |
| TIE1 | -0.0002036 | 18530 | GTEx | DepMap | Descartes | 0.08 | 10.70 |
| CDH5 | -0.0002046 | 18547 | GTEx | DepMap | Descartes | 0.11 | 13.49 |
| KDR | -0.0002117 | 18651 | GTEx | DepMap | Descartes | 0.13 | 11.75 |
Descartes stromal markers
Top 50 marker genes of stromal cells in the Decartes fetal adrenal single cell map (https://atlas.brotmanbaty.org/bbi/human-gene-expression-during-development/cell/stromal/in/adrenal)
Wilcoxon ranksum test P-value for gene set overrepresentation: 3.85e-05
Mean rank of genes in gene set: 6941.24
Median rank of genes in gene set: 924
Rank on gene expression program of top 30 genes in gene set:
| Genes | Weight | Rank | GTEx | DepMap | Descartes | Mean.Counts | Mean.TPM |
|---|---|---|---|---|---|---|---|
| CCDC102B | 0.0081381 | 2 | GTEx | DepMap | Descartes | 8.98 | 2569.01 |
| EDNRA | 0.0062143 | 8 | GTEx | DepMap | Descartes | 1.42 | 255.37 |
| ABCC9 | 0.0053157 | 12 | GTEx | DepMap | Descartes | 0.74 | 69.71 |
| COL6A3 | 0.0032111 | 55 | GTEx | DepMap | Descartes | 4.68 | 302.41 |
| PRRX1 | 0.0020963 | 117 | GTEx | DepMap | Descartes | 1.98 | 319.96 |
| ADAMTS2 | 0.0020557 | 126 | GTEx | DepMap | Descartes | 1.94 | 208.41 |
| ITGA11 | 0.0020519 | 127 | GTEx | DepMap | Descartes | 1.36 | 97.31 |
| ACTA2 | 0.0017911 | 158 | GTEx | DepMap | Descartes | 1.79 | 888.81 |
| CDH11 | 0.0016807 | 181 | GTEx | DepMap | Descartes | 3.68 | 337.69 |
| COL1A2 | 0.0013263 | 254 | GTEx | DepMap | Descartes | 13.52 | 1351.25 |
| POSTN | 0.0013185 | 257 | GTEx | DepMap | Descartes | 2.98 | 535.40 |
| LAMC3 | 0.0013068 | 260 | GTEx | DepMap | Descartes | 0.25 | 23.70 |
| CD248 | 0.0012884 | 268 | GTEx | DepMap | Descartes | 0.13 | 30.96 |
| COL3A1 | 0.0011973 | 301 | GTEx | DepMap | Descartes | 12.13 | 1295.73 |
| PCDH18 | 0.0011239 | 323 | GTEx | DepMap | Descartes | 0.17 | 18.22 |
| GLI2 | 0.0010849 | 335 | GTEx | DepMap | Descartes | 1.09 | 110.21 |
| PAMR1 | 0.0010196 | 369 | GTEx | DepMap | Descartes | 0.54 | 99.63 |
| COL1A1 | 0.0010090 | 374 | GTEx | DepMap | Descartes | 13.32 | 1330.68 |
| FNDC1 | 0.0009891 | 388 | GTEx | DepMap | Descartes | 0.51 | 50.01 |
| COL27A1 | 0.0009331 | 416 | GTEx | DepMap | Descartes | 0.68 | 61.56 |
| MGP | 0.0008822 | 451 | GTEx | DepMap | Descartes | 4.91 | 1600.61 |
| ADAMTSL3 | 0.0008789 | 453 | GTEx | DepMap | Descartes | 1.58 | 137.90 |
| COL12A1 | 0.0008653 | 462 | GTEx | DepMap | Descartes | 2.57 | 137.47 |
| LRRC17 | 0.0007489 | 564 | GTEx | DepMap | Descartes | 0.22 | 66.27 |
| PCOLCE | 0.0004728 | 924 | GTEx | DepMap | Descartes | 0.51 | 205.44 |
| MXRA5 | 0.0004657 | 940 | GTEx | DepMap | Descartes | 0.22 | 13.75 |
| C7 | 0.0002686 | 1574 | GTEx | DepMap | Descartes | 4.44 | 500.50 |
| ELN | 0.0001540 | 2457 | GTEx | DepMap | Descartes | 0.86 | 172.20 |
| PRICKLE1 | 0.0001346 | 2704 | GTEx | DepMap | Descartes | 3.27 | 325.36 |
| LUM | 0.0000726 | 3898 | GTEx | DepMap | Descartes | 1.60 | 323.77 |
Descartes sympathoblasts markers
Top 50 marker genes of sympathoblasts cells in the Decartes fetal adrenal single cell map (https://atlas.brotmanbaty.org/bbi/human-gene-expression-during-development/cell/sympathoblasts/in/adrenal)
Wilcoxon ranksum test P-value for gene set overrepresentation: 1.00e+00
Mean rank of genes in gene set: 18637.21
Median rank of genes in gene set: 19629
Rank on gene expression program of top 30 genes in gene set:
| Genes | Weight | Rank | GTEx | DepMap | Descartes | Mean.Counts | Mean.TPM |
|---|---|---|---|---|---|---|---|
| LAMA3 | 0.0013579 | 245 | GTEx | DepMap | Descartes | 0.65 | 44.03 |
| PNMT | -0.0000472 | 13588 | GTEx | DepMap | Descartes | 0.01 | 5.80 |
| SLC24A2 | -0.0000873 | 15648 | GTEx | DepMap | Descartes | 0.17 | 5.53 |
| PENK | -0.0000917 | 15824 | GTEx | DepMap | Descartes | 0.03 | 22.58 |
| SCG2 | -0.0001063 | 16328 | GTEx | DepMap | Descartes | 2.87 | 770.92 |
| ARC | -0.0001474 | 17505 | GTEx | DepMap | Descartes | 0.08 | 13.17 |
| ST18 | -0.0001543 | 17661 | GTEx | DepMap | Descartes | 0.09 | 6.05 |
| HTATSF1 | -0.0001545 | 17667 | GTEx | DepMap | Descartes | 0.21 | 42.14 |
| SLC18A1 | -0.0001562 | 17704 | GTEx | DepMap | Descartes | 0.10 | 14.13 |
| DGKK | -0.0001668 | 17927 | GTEx | DepMap | Descartes | 0.07 | 3.89 |
| C1QL1 | -0.0001729 | 18013 | GTEx | DepMap | Descartes | 0.06 | 23.92 |
| CNTN3 | -0.0001881 | 18257 | GTEx | DepMap | Descartes | 0.17 | 12.15 |
| INSM1 | -0.0001900 | 18292 | GTEx | DepMap | Descartes | 0.05 | 10.61 |
| GRID2 | -0.0002090 | 18618 | GTEx | DepMap | Descartes | 0.80 | 51.52 |
| TMEM130 | -0.0002204 | 18783 | GTEx | DepMap | Descartes | 0.34 | 38.70 |
| SLC35F3 | -0.0002788 | 19401 | GTEx | DepMap | Descartes | 0.59 | 44.95 |
| SORCS3 | -0.0002846 | 19447 | GTEx | DepMap | Descartes | 0.25 | 14.56 |
| CDH18 | -0.0002933 | 19524 | GTEx | DepMap | Descartes | 0.55 | 42.74 |
| MGAT4C | -0.0002989 | 19565 | GTEx | DepMap | Descartes | 1.65 | 40.56 |
| PCSK2 | -0.0002991 | 19566 | GTEx | DepMap | Descartes | 0.35 | 28.00 |
| CNTNAP5 | -0.0003094 | 19618 | GTEx | DepMap | Descartes | 0.46 | 25.33 |
| TBX20 | -0.0003109 | 19629 | GTEx | DepMap | Descartes | 0.20 | 53.66 |
| CDH12 | -0.0003194 | 19683 | GTEx | DepMap | Descartes | 0.91 | 91.25 |
| KSR2 | -0.0003378 | 19773 | GTEx | DepMap | Descartes | 0.42 | 7.57 |
| CHGB | -0.0003477 | 19809 | GTEx | DepMap | Descartes | 1.58 | 421.04 |
| GRM7 | -0.0003482 | 19812 | GTEx | DepMap | Descartes | 0.70 | 76.19 |
| SPOCK3 | -0.0003484 | 19814 | GTEx | DepMap | Descartes | 0.34 | 46.25 |
| GALNTL6 | -0.0003516 | 19839 | GTEx | DepMap | Descartes | 0.82 | 96.86 |
| PACRG | -0.0003575 | 19862 | GTEx | DepMap | Descartes | 0.68 | 147.49 |
| PCSK1N | -0.0003742 | 19930 | GTEx | DepMap | Descartes | 1.26 | 655.64 |
Descartes erythroblasts markers
Top 50 marker genes of erythroblasts cells in the Decartes fetal adrenal single cell map (https://atlas.brotmanbaty.org/bbi/human-gene-expression-during-development/cell/erythroblasts/in/adrenal)
Wilcoxon ranksum test P-value for gene set overrepresentation: 5.41e-01
Mean rank of genes in gene set: 10384.78
Median rank of genes in gene set: 12510.5
Rank on gene expression program of top 30 genes in gene set:
| Genes | Weight | Rank | GTEx | DepMap | Descartes | Mean.Counts | Mean.TPM |
|---|---|---|---|---|---|---|---|
| SPECC1 | 0.0046175 | 19 | GTEx | DepMap | Descartes | 1.77 | 158.44 |
| MICAL2 | 0.0019451 | 137 | GTEx | DepMap | Descartes | 2.30 | 235.28 |
| RAPGEF2 | 0.0010087 | 375 | GTEx | DepMap | Descartes | 2.79 | 208.62 |
| SELENBP1 | 0.0006230 | 681 | GTEx | DepMap | Descartes | 0.04 | 10.45 |
| RGS6 | 0.0003997 | 1084 | GTEx | DepMap | Descartes | 0.87 | 94.36 |
| GYPC | 0.0003295 | 1315 | GTEx | DepMap | Descartes | 0.18 | 64.18 |
| SLC25A21 | 0.0002236 | 1849 | GTEx | DepMap | Descartes | 0.11 | 16.24 |
| SOX6 | 0.0001847 | 2140 | GTEx | DepMap | Descartes | 2.45 | 142.62 |
| TSPAN5 | 0.0001459 | 2542 | GTEx | DepMap | Descartes | 1.76 | 239.32 |
| ABCB10 | 0.0001384 | 2648 | GTEx | DepMap | Descartes | 0.30 | 43.87 |
| GYPE | 0.0001061 | 3176 | GTEx | DepMap | Descartes | 0.04 | 14.04 |
| TRAK2 | 0.0001052 | 3197 | GTEx | DepMap | Descartes | 0.53 | 43.81 |
| RHD | 0.0000983 | 3326 | GTEx | DepMap | Descartes | 0.10 | 20.97 |
| CPOX | 0.0000628 | 4175 | GTEx | DepMap | Descartes | 0.04 | 8.37 |
| SPTB | 0.0000500 | 4581 | GTEx | DepMap | Descartes | 0.15 | 6.80 |
| CAT | 0.0000324 | 5349 | GTEx | DepMap | Descartes | 0.29 | 68.17 |
| HBG2 | 0.0000000 | 8302 | GTEx | DepMap | Descartes | 0.00 | 0.00 |
| HBG1 | -0.0000124 | 10598 | GTEx | DepMap | Descartes | 0.00 | 0.00 |
| GYPA | -0.0000150 | 10937 | GTEx | DepMap | Descartes | 0.01 | 0.88 |
| HEMGN | -0.0000205 | 11557 | GTEx | DepMap | Descartes | 0.00 | 0.80 |
| HBZ | -0.0000253 | 12006 | GTEx | DepMap | Descartes | 0.00 | 3.21 |
| EPB42 | -0.0000269 | 12154 | GTEx | DepMap | Descartes | 0.00 | 0.33 |
| HBB | -0.0000304 | 12442 | GTEx | DepMap | Descartes | 0.15 | 143.42 |
| SPTA1 | -0.0000322 | 12579 | GTEx | DepMap | Descartes | 0.01 | 0.38 |
| RHCE | -0.0000378 | 12998 | GTEx | DepMap | Descartes | 0.04 | 8.94 |
| ALAS2 | -0.0000381 | 13016 | GTEx | DepMap | Descartes | 0.00 | 0.77 |
| RHAG | -0.0000407 | 13163 | GTEx | DepMap | Descartes | 0.01 | 0.99 |
| GYPB | -0.0000421 | 13259 | GTEx | DepMap | Descartes | 0.01 | 5.33 |
| HBM | -0.0000453 | 13466 | GTEx | DepMap | Descartes | 0.00 | 1.94 |
| AHSP | -0.0000468 | 13563 | GTEx | DepMap | Descartes | 0.00 | 0.47 |
Descartes myeloid markers
Top 50 marker genes of myeloid cells in the Decartes fetal adrenal single cell map (https://atlas.brotmanbaty.org/bbi/human-gene-expression-during-development/cell/myeloid/in/adrenal)
Wilcoxon ranksum test P-value for gene set overrepresentation: 1.00e+00
Mean rank of genes in gene set: 14574.94
Median rank of genes in gene set: 17198
Rank on gene expression program of top 30 genes in gene set:
| Genes | Weight | Rank | GTEx | DepMap | Descartes | Mean.Counts | Mean.TPM |
|---|---|---|---|---|---|---|---|
| AXL | 0.0009547 | 402 | GTEx | DepMap | Descartes | 0.98 | 141.94 |
| PTPRE | 0.0009410 | 411 | GTEx | DepMap | Descartes | 1.92 | 195.20 |
| ADAP2 | 0.0008936 | 442 | GTEx | DepMap | Descartes | 0.26 | 63.96 |
| TGFBI | 0.0006508 | 651 | GTEx | DepMap | Descartes | 0.64 | 85.26 |
| CSF1R | 0.0004679 | 934 | GTEx | DepMap | Descartes | 0.17 | 28.07 |
| CTSC | 0.0002144 | 1903 | GTEx | DepMap | Descartes | 0.60 | 58.86 |
| RGL1 | 0.0001512 | 2489 | GTEx | DepMap | Descartes | 1.10 | 120.55 |
| ITPR2 | 0.0000655 | 4091 | GTEx | DepMap | Descartes | 2.75 | 116.37 |
| CTSD | -0.0000058 | 9570 | GTEx | DepMap | Descartes | 0.00 | 0.06 |
| SLC9A9 | -0.0000139 | 10802 | GTEx | DepMap | Descartes | 1.68 | 281.95 |
| CST3 | -0.0000203 | 11535 | GTEx | DepMap | Descartes | 1.01 | 178.12 |
| IFNGR1 | -0.0000215 | 11665 | GTEx | DepMap | Descartes | 0.42 | 94.51 |
| CYBB | -0.0000505 | 13802 | GTEx | DepMap | Descartes | 0.01 | 1.10 |
| C1QA | -0.0000678 | 14736 | GTEx | DepMap | Descartes | 0.14 | 93.59 |
| C1QC | -0.0000713 | 14910 | GTEx | DepMap | Descartes | 0.08 | 44.31 |
| C1QB | -0.0000738 | 15024 | GTEx | DepMap | Descartes | 0.12 | 77.73 |
| VSIG4 | -0.0000763 | 15129 | GTEx | DepMap | Descartes | 0.02 | 4.06 |
| MS4A7 | -0.0000824 | 15429 | GTEx | DepMap | Descartes | 0.01 | 2.33 |
| CD14 | -0.0000899 | 15752 | GTEx | DepMap | Descartes | 0.10 | 40.52 |
| RNASE1 | -0.0000900 | 15759 | GTEx | DepMap | Descartes | 0.08 | 46.05 |
| MPEG1 | -0.0001140 | 16579 | GTEx | DepMap | Descartes | 0.04 | 6.56 |
| SPP1 | -0.0001172 | 16679 | GTEx | DepMap | Descartes | 0.71 | 252.37 |
| ABCA1 | -0.0001301 | 17051 | GTEx | DepMap | Descartes | 1.41 | 76.06 |
| WWP1 | -0.0001309 | 17074 | GTEx | DepMap | Descartes | 1.00 | 108.10 |
| HLA-DRB1 | -0.0001350 | 17198 | GTEx | DepMap | Descartes | 0.10 | 45.69 |
| LGMN | -0.0001418 | 17370 | GTEx | DepMap | Descartes | 0.46 | 111.14 |
| HLA-DPA1 | -0.0001591 | 17770 | GTEx | DepMap | Descartes | 0.21 | 26.48 |
| CTSS | -0.0001856 | 18216 | GTEx | DepMap | Descartes | 0.22 | 33.66 |
| HCK | -0.0001920 | 18329 | GTEx | DepMap | Descartes | 0.07 | 16.45 |
| FGL2 | -0.0001921 | 18331 | GTEx | DepMap | Descartes | 0.09 | 13.44 |
Descartes Schwann markers
Top 50 marker genes of Schwann cells in the Decartes fetal adrenal single cell map (https://atlas.brotmanbaty.org/bbi/human-gene-expression-during-development/cell/schwann/in/adrenal)
Wilcoxon ranksum test P-value for gene set overrepresentation: 7.46e-01
Mean rank of genes in gene set: 10854.57
Median rank of genes in gene set: 13979
Rank on gene expression program of top 30 genes in gene set:
| Genes | Weight | Rank | GTEx | DepMap | Descartes | Mean.Counts | Mean.TPM |
|---|---|---|---|---|---|---|---|
| COL18A1 | 0.0055041 | 11 | GTEx | DepMap | Descartes | 3.67 | 411.97 |
| OLFML2A | 0.0026301 | 76 | GTEx | DepMap | Descartes | 0.24 | 27.49 |
| LAMA4 | 0.0020313 | 129 | GTEx | DepMap | Descartes | 2.70 | 241.02 |
| SOX5 | 0.0020065 | 131 | GTEx | DepMap | Descartes | 6.60 | 628.56 |
| COL25A1 | 0.0019690 | 134 | GTEx | DepMap | Descartes | 0.68 | 61.61 |
| NRXN3 | 0.0018029 | 157 | GTEx | DepMap | Descartes | 5.87 | 385.35 |
| COL5A2 | 0.0016322 | 186 | GTEx | DepMap | Descartes | 3.98 | 374.57 |
| EDNRB | 0.0011958 | 302 | GTEx | DepMap | Descartes | 0.27 | 38.81 |
| LAMC1 | 0.0010900 | 333 | GTEx | DepMap | Descartes | 1.84 | 145.69 |
| EGFLAM | 0.0010090 | 373 | GTEx | DepMap | Descartes | 0.56 | 69.35 |
| HMGA2 | 0.0010050 | 377 | GTEx | DepMap | Descartes | 0.23 | 18.78 |
| LAMB1 | 0.0009592 | 401 | GTEx | DepMap | Descartes | 2.42 | 274.86 |
| STARD13 | 0.0009264 | 424 | GTEx | DepMap | Descartes | 3.48 | 349.69 |
| PLCE1 | 0.0008942 | 441 | GTEx | DepMap | Descartes | 0.78 | 40.83 |
| PAG1 | 0.0008308 | 496 | GTEx | DepMap | Descartes | 1.77 | 101.04 |
| IL1RAPL1 | 0.0008258 | 504 | GTEx | DepMap | Descartes | 1.61 | 264.48 |
| VIM | 0.0008063 | 517 | GTEx | DepMap | Descartes | 3.00 | 682.79 |
| ADAMTS5 | 0.0002443 | 1704 | GTEx | DepMap | Descartes | 0.17 | 11.93 |
| SLC35F1 | 0.0001383 | 2649 | GTEx | DepMap | Descartes | 0.98 | 96.62 |
| PMP22 | -0.0000084 | 9996 | GTEx | DepMap | Descartes | 1.02 | 298.53 |
| KCTD12 | -0.0000151 | 10955 | GTEx | DepMap | Descartes | 0.30 | 24.58 |
| PTN | -0.0000322 | 12575 | GTEx | DepMap | Descartes | 0.33 | 110.56 |
| FIGN | -0.0000463 | 13533 | GTEx | DepMap | Descartes | 1.75 | 116.20 |
| MPZ | -0.0000517 | 13863 | GTEx | DepMap | Descartes | 0.08 | 19.86 |
| TRPM3 | -0.0000535 | 13979 | GTEx | DepMap | Descartes | 0.70 | 23.38 |
| ERBB3 | -0.0000761 | 15120 | GTEx | DepMap | Descartes | 0.06 | 4.51 |
| GRIK3 | -0.0000780 | 15218 | GTEx | DepMap | Descartes | 0.31 | 18.38 |
| SOX10 | -0.0000963 | 16004 | GTEx | DepMap | Descartes | 0.07 | 11.87 |
| VCAN | -0.0001079 | 16387 | GTEx | DepMap | Descartes | 4.91 | 224.70 |
| MDGA2 | -0.0001134 | 16567 | GTEx | DepMap | Descartes | 1.06 | 57.55 |
Descartes Megakaryocytes markers
Top 50 marker genes of Megakaryocytes cells in the Decartes fetal adrenal single cell map (https://atlas.brotmanbaty.org/bbi/human-gene-expression-during-development/cell/megakaryocytes/in/adrenal)
Wilcoxon ranksum test P-value for gene set overrepresentation: 1.91e-03
Mean rank of genes in gene set: 7840.41
Median rank of genes in gene set: 4542
Rank on gene expression program of top 30 genes in gene set:
| Genes | Weight | Rank | GTEx | DepMap | Descartes | Mean.Counts | Mean.TPM |
|---|---|---|---|---|---|---|---|
| TRPC6 | 0.0040030 | 31 | GTEx | DepMap | Descartes | 0.54 | 90.07 |
| PDE3A | 0.0037155 | 37 | GTEx | DepMap | Descartes | 7.15 | 621.34 |
| ARHGAP6 | 0.0034017 | 45 | GTEx | DepMap | Descartes | 1.46 | 177.81 |
| INPP4B | 0.0032353 | 52 | GTEx | DepMap | Descartes | 2.94 | 231.80 |
| ANGPT1 | 0.0026846 | 72 | GTEx | DepMap | Descartes | 0.59 | 98.39 |
| MYH9 | 0.0017460 | 167 | GTEx | DepMap | Descartes | 2.86 | 244.84 |
| MYLK | 0.0017175 | 173 | GTEx | DepMap | Descartes | 1.06 | 71.15 |
| FLNA | 0.0012772 | 271 | GTEx | DepMap | Descartes | 1.08 | 81.67 |
| DOK6 | 0.0010552 | 346 | GTEx | DepMap | Descartes | 1.56 | 101.06 |
| HIPK2 | 0.0010378 | 360 | GTEx | DepMap | Descartes | 2.25 | 89.99 |
| LIMS1 | 0.0010221 | 367 | GTEx | DepMap | Descartes | 2.76 | 370.43 |
| VCL | 0.0009316 | 419 | GTEx | DepMap | Descartes | 2.60 | 210.79 |
| ACTN1 | 0.0008905 | 445 | GTEx | DepMap | Descartes | 2.40 | 325.33 |
| GSN | 0.0008729 | 458 | GTEx | DepMap | Descartes | 1.69 | 165.87 |
| SLC24A3 | 0.0008063 | 516 | GTEx | DepMap | Descartes | 1.62 | 271.27 |
| SLC2A3 | 0.0007768 | 537 | GTEx | DepMap | Descartes | 2.33 | 339.71 |
| TLN1 | 0.0007347 | 575 | GTEx | DepMap | Descartes | 0.63 | 44.96 |
| TGFB1 | 0.0006164 | 691 | GTEx | DepMap | Descartes | 0.63 | 149.58 |
| LTBP1 | 0.0006048 | 708 | GTEx | DepMap | Descartes | 1.62 | 155.59 |
| RAP1B | 0.0005561 | 785 | GTEx | DepMap | Descartes | 2.02 | 88.56 |
| STOM | 0.0005106 | 857 | GTEx | DepMap | Descartes | 0.60 | 114.97 |
| TPM4 | 0.0004315 | 1013 | GTEx | DepMap | Descartes | 2.23 | 289.19 |
| ITGB3 | 0.0001195 | 2935 | GTEx | DepMap | Descartes | 0.00 | 0.08 |
| ZYX | 0.0001107 | 3093 | GTEx | DepMap | Descartes | 0.26 | 70.12 |
| GP9 | 0.0000509 | 4542 | GTEx | DepMap | Descartes | 0.00 | 0.12 |
| GP1BA | 0.0000276 | 5603 | GTEx | DepMap | Descartes | 0.02 | 4.01 |
| PPBP | 0.0000068 | 7127 | GTEx | DepMap | Descartes | 0.00 | 0.72 |
| SPN | -0.0000023 | 8920 | GTEx | DepMap | Descartes | 0.00 | 0.01 |
| THBS1 | -0.0000087 | 10034 | GTEx | DepMap | Descartes | 3.83 | 308.94 |
| PF4 | -0.0000096 | 10177 | GTEx | DepMap | Descartes | 0.00 | 1.18 |
Descartes Lyphoid markers
Top 50 marker genes of Lyphoid cells in the Decartes fetal adrenal single cell map (https://atlas.brotmanbaty.org/bbi/human-gene-expression-during-development/cell/lymphoid/in/adrenal)
Wilcoxon ranksum test P-value for gene set overrepresentation: 6.34e-01
Mean rank of genes in gene set: 10589.23
Median rank of genes in gene set: 14997
Rank on gene expression program of top 30 genes in gene set:
| Genes | Weight | Rank | GTEx | DepMap | Descartes | Mean.Counts | Mean.TPM |
|---|---|---|---|---|---|---|---|
| DOCK10 | 0.0014324 | 224 | GTEx | DepMap | Descartes | 2.39 | 207.21 |
| NCALD | 0.0010546 | 347 | GTEx | DepMap | Descartes | 1.89 | 332.96 |
| SP100 | 0.0008894 | 446 | GTEx | DepMap | Descartes | 1.36 | 163.11 |
| ETS1 | 0.0008466 | 482 | GTEx | DepMap | Descartes | 1.23 | 152.94 |
| PLEKHA2 | 0.0008393 | 485 | GTEx | DepMap | Descartes | 0.90 | 107.21 |
| ARID5B | 0.0008312 | 493 | GTEx | DepMap | Descartes | 2.37 | 201.45 |
| IFI16 | 0.0008114 | 512 | GTEx | DepMap | Descartes | 0.99 | 154.31 |
| ARHGAP15 | 0.0007431 | 570 | GTEx | DepMap | Descartes | 2.20 | 516.88 |
| RCSD1 | 0.0006824 | 624 | GTEx | DepMap | Descartes | 0.32 | 42.04 |
| ITPKB | 0.0004508 | 972 | GTEx | DepMap | Descartes | 0.55 | 57.28 |
| HLA-B | 0.0004071 | 1059 | GTEx | DepMap | Descartes | 0.58 | 235.11 |
| ARHGDIB | 0.0003734 | 1152 | GTEx | DepMap | Descartes | 0.16 | 91.91 |
| MSN | 0.0003623 | 1185 | GTEx | DepMap | Descartes | 0.89 | 133.41 |
| PRKCH | 0.0003173 | 1363 | GTEx | DepMap | Descartes | 1.03 | 167.02 |
| HLA-C | 0.0002341 | 1777 | GTEx | DepMap | Descartes | 0.37 | 121.32 |
| WIPF1 | 0.0002272 | 1822 | GTEx | DepMap | Descartes | 1.18 | 151.31 |
| FOXP1 | 0.0001890 | 2104 | GTEx | DepMap | Descartes | 0.37 | 25.60 |
| SAMD3 | 0.0001718 | 2278 | GTEx | DepMap | Descartes | 0.48 | 78.05 |
| STK39 | 0.0001407 | 2622 | GTEx | DepMap | Descartes | 1.57 | 251.62 |
| HLA-A | 0.0001197 | 2932 | GTEx | DepMap | Descartes | 0.75 | 85.53 |
| B2M | 0.0001188 | 2948 | GTEx | DepMap | Descartes | 4.25 | 1112.82 |
| LEF1 | 0.0001011 | 3276 | GTEx | DepMap | Descartes | 0.75 | 117.42 |
| CCND3 | 0.0000074 | 7062 | GTEx | DepMap | Descartes | 1.02 | 274.84 |
| NKG7 | -0.0000732 | 14997 | GTEx | DepMap | Descartes | 0.01 | 7.56 |
| EVL | -0.0000823 | 15421 | GTEx | DepMap | Descartes | 2.08 | 310.45 |
| CCL5 | -0.0001233 | 16857 | GTEx | DepMap | Descartes | 0.04 | 15.43 |
| MBNL1 | -0.0001400 | 17329 | GTEx | DepMap | Descartes | 6.35 | 582.63 |
| CD44 | -0.0001636 | 17854 | GTEx | DepMap | Descartes | 2.11 | 202.87 |
| ANKRD44 | -0.0002249 | 18839 | GTEx | DepMap | Descartes | 2.06 | 147.80 |
| GNG2 | -0.0002464 | 19084 | GTEx | DepMap | Descartes | 1.08 | 144.97 |
Embryonic Pausing Signatures Up
Embryonic pausing signature upregulated genes from Supplementary Table 6 of Rehman et al. Cell 2021. These genes are upregulated in paused ESCs and diapaused embryos.
Wilcoxon ranksum test P-value for gene set overrepresentation: 2.70e-01
Mean rank of genes in gene set: 9331.79
Median rank of genes in gene set: 10737.5
Rank on gene expression program of top 30 genes in gene set:
| Genes | Weight | Rank | GTEx | DepMap | Descartes | Mean.Counts | Mean.TPM |
|---|---|---|---|---|---|---|---|
| YPEL2 | 0.0008580 | 470 | GTEx | DepMap | Descartes | 0.95 | 102.88 |
| ACSS1 | 0.0005416 | 802 | GTEx | DepMap | Descartes | 0.16 | 22.83 |
| SPRY1 | 0.0004579 | 961 | GTEx | DepMap | Descartes | 0.55 | 120.67 |
| APOE | 0.0002932 | 1458 | GTEx | DepMap | Descartes | 1.92 | 1037.61 |
| HEXB | 0.0000710 | 3939 | GTEx | DepMap | Descartes | 0.34 | 93.53 |
| LY6G6E | 0.0000000 | 8395 | GTEx | DepMap | Descartes | 0.00 | 0.00 |
| PDCD4 | -0.0000087 | 10040 | GTEx | DepMap | Descartes | 0.68 | 104.60 |
| HEXA | -0.0000194 | 11435 | GTEx | DepMap | Descartes | 0.04 | 3.35 |
| RENBP | -0.0000389 | 13064 | GTEx | DepMap | Descartes | 0.07 | 25.57 |
| ALDH6A1 | -0.0000761 | 15121 | GTEx | DepMap | Descartes | 0.11 | 11.37 |
| CCNG2 | -0.0000963 | 16008 | GTEx | DepMap | Descartes | 0.26 | 26.85 |
| CTSL | -0.0000996 | 16122 | GTEx | DepMap | Descartes | 0.45 | NA |
| DPP7 | -0.0001011 | 16157 | GTEx | DepMap | Descartes | 0.26 | 92.47 |
| AUH | -0.0001170 | 16673 | GTEx | DepMap | Descartes | 1.19 | 387.70 |
Embryonic Pausing Signatures Down
Embryonic pausing signature downregulated genes from Supplementary Table 6 of Rehman et al. Cell 2021. These genes are downregulated in paused ESCs and diapaused embryos.
Wilcoxon ranksum test P-value for gene set overrepresentation: 1.00e+00
Mean rank of genes in gene set: 13799.19
Median rank of genes in gene set: 15085
Rank on gene expression program of top 30 genes in gene set:
| Genes | Weight | Rank | GTEx | DepMap | Descartes | Mean.Counts | Mean.TPM |
|---|---|---|---|---|---|---|---|
| ID3 | 0.0023468 | 94 | GTEx | DepMap | Descartes | 0.72 | 455.07 |
| MGMT | 0.0002798 | 1512 | GTEx | DepMap | Descartes | 0.99 | 118.96 |
| DUSP14 | 0.0002334 | 1778 | GTEx | DepMap | Descartes | 0.11 | 28.34 |
| FAM118B | 0.0001996 | 2020 | GTEx | DepMap | Descartes | 0.19 | 55.26 |
| SEC13 | 0.0001666 | 2328 | GTEx | DepMap | Descartes | 0.40 | 101.25 |
| HDLBP | 0.0001352 | 2698 | GTEx | DepMap | Descartes | 1.20 | 109.84 |
| EIF2B2 | 0.0000994 | 3307 | GTEx | DepMap | Descartes | 0.11 | 14.25 |
| MRPS11 | 0.0000993 | 3309 | GTEx | DepMap | Descartes | 0.17 | 27.80 |
| TMEM109 | 0.0000700 | 3971 | GTEx | DepMap | Descartes | 0.09 | 24.29 |
| DRG2 | 0.0000645 | 4134 | GTEx | DepMap | Descartes | 0.12 | 12.47 |
| INO80E | 0.0000630 | 4166 | GTEx | DepMap | Descartes | 0.15 | 20.28 |
| TMEM39B | 0.0000528 | 4480 | GTEx | DepMap | Descartes | 0.16 | 45.31 |
| PELO | 0.0000400 | 4974 | GTEx | DepMap | Descartes | 0.00 | 0.08 |
| ANKRD37 | 0.0000326 | 5337 | GTEx | DepMap | Descartes | 0.07 | 24.72 |
| PRADC1 | 0.0000232 | 5852 | GTEx | DepMap | Descartes | 0.05 | 23.21 |
| MRPL12 | 0.0000204 | 6033 | GTEx | DepMap | Descartes | 0.00 | 0.02 |
| ARPC1B | 0.0000131 | 6562 | GTEx | DepMap | Descartes | 0.14 | 43.18 |
| TIPIN | 0.0000130 | 6571 | GTEx | DepMap | Descartes | 0.15 | 44.84 |
| UBE2V1 | 0.0000104 | 6783 | GTEx | DepMap | Descartes | 0.02 | 3.47 |
| RPS27L | 0.0000065 | 7157 | GTEx | DepMap | Descartes | 0.51 | 50.37 |
| PMF1 | 0.0000056 | 7243 | GTEx | DepMap | Descartes | 0.00 | 0.47 |
| PHGDH | 0.0000013 | 7748 | GTEx | DepMap | Descartes | 0.08 | 15.25 |
| TOMM40 | -0.0000021 | 8896 | GTEx | DepMap | Descartes | 0.15 | 25.42 |
| NAA10 | -0.0000040 | 9256 | GTEx | DepMap | Descartes | 0.05 | 16.05 |
| PSMB10 | -0.0000058 | 9554 | GTEx | DepMap | Descartes | 0.02 | 13.12 |
| CITED1 | -0.0000097 | 10192 | GTEx | DepMap | Descartes | 0.00 | 0.24 |
| DPH3 | -0.0000151 | 10952 | GTEx | DepMap | Descartes | 0.07 | 10.09 |
| DGCR6 | -0.0000202 | 11531 | GTEx | DepMap | Descartes | 0.00 | 0.06 |
| TOMM40L | -0.0000265 | 12097 | GTEx | DepMap | Descartes | 0.03 | 6.23 |
| CCNE1 | -0.0000283 | 12282 | GTEx | DepMap | Descartes | 0.03 | 8.57 |
Below shows the ranks on this GEP for immune marker gene lists curated by CellTypist (https://www.celltypist.org/encyclopedia).
High ranks indicate this gene is a driver of this GEP.
These curated gene list are ranked by P-value (on this GEP) of their constituent genes.
The Mean Count column shows the mean read count in cells scoring highly (H > 50) on this gene expression program.
Fibroblasts: Fibroblasts (model markers)
the most common cells of connective tissues which synthesize the extracellular matrix and collagen to maintain tissue homeostasis:
Wilcoxon ranksum test P-value for gene set overrepresentation: 9.48e-03
Mean rank of genes in gene set: 5885.5
Rank on gene expression program of genes in gene set:
| Genes | Weight | Rank | GTEx | DepMap | Decartes | Mean.Counts | Mean.TPM |
|---|---|---|---|---|---|---|---|
| EBF2 | 0.0037318 | 35 | GTEx | DepMap | Descartes | 1.87 | 272.71 |
| PRRX1 | 0.0020963 | 117 | GTEx | DepMap | Descartes | 1.98 | 319.96 |
| SMOC2 | 0.0019563 | 136 | GTEx | DepMap | Descartes | 1.34 | 308.13 |
| OLFML1 | 0.0006505 | 652 | GTEx | DepMap | Descartes | 0.07 | 16.31 |
| MXRA5 | 0.0004657 | 940 | GTEx | DepMap | Descartes | 0.22 | 13.75 |
| NTRK2 | 0.0003649 | 1179 | GTEx | DepMap | Descartes | 0.93 | 63.78 |
| F10 | 0.0000689 | 4005 | GTEx | DepMap | Descartes | 0.05 | 16.59 |
| ANGPTL1 | -0.0001029 | 16220 | GTEx | DepMap | Descartes | 0.16 | 25.74 |
| SFRP1 | -0.0001171 | 16677 | GTEx | DepMap | Descartes | 0.51 | 59.67 |
| PDGFRA | -0.0002293 | 18894 | GTEx | DepMap | Descartes | 0.25 | 21.86 |
Double-negative thymocytes: Double-negative thymocytes (curated markers)
the early immature thymocytes from the thymus in the double negative (co-receptors CD4- and CD8-) stage:
Wilcoxon ranksum test P-value for gene set overrepresentation: 9.52e-03
Mean rank of genes in gene set: 2249.33
Rank on gene expression program of genes in gene set:
| Genes | Weight | Rank | GTEx | DepMap | Decartes | Mean.Counts | Mean.TPM |
|---|---|---|---|---|---|---|---|
| CD99 | 0.0007294 | 585 | GTEx | DepMap | Descartes | 0.81 | 399.26 |
| HES1 | 0.0003612 | 1193 | GTEx | DepMap | Descartes | 0.21 | 71.25 |
| FXYD2 | 0.0000401 | 4970 | GTEx | DepMap | Descartes | 0.00 | 0.78 |
T cells: Follicular helper T cells (model markers)
specialised CD4+ T cell subpopulation found in the periphery within B cell follicles and stimulating the cognate follicular B cells for class-switching:
Wilcoxon ranksum test P-value for gene set overrepresentation: 7.90e-02
Mean rank of genes in gene set: 7122.57
Rank on gene expression program of genes in gene set:
| Genes | Weight | Rank | GTEx | DepMap | Decartes | Mean.Counts | Mean.TPM |
|---|---|---|---|---|---|---|---|
| CH25H | 0.0001413 | 2605 | GTEx | DepMap | Descartes | 0.04 | 13.53 |
| SOCS3 | 0.0000716 | 3925 | GTEx | DepMap | Descartes | 0.44 | 98.44 |
| GPIHBP1 | 0.0000545 | 4423 | GTEx | DepMap | Descartes | 0.01 | 2.44 |
| HOXB5 | 0.0000542 | 4434 | GTEx | DepMap | Descartes | 0.00 | 0.13 |
| IGHV5-78 | -0.0000024 | 8941 | GTEx | DepMap | Descartes | 0.00 | 0.00 |
| FOXH1 | -0.0000151 | 10950 | GTEx | DepMap | Descartes | 0.00 | 0.44 |
| KLRB1 | -0.0000648 | 14580 | GTEx | DepMap | Descartes | 0.02 | 5.78 |