Program: 29. Cancer-Associated Fibroblasts.
Program description and justification of annotation generated by GPT5: Cancer-Associated Fibroblasts (CAF) - myofibroblastic ECM remodeling with TGF-beta/iCAF features; stromal/perivascular continuum.
Submit a comment on this gene expression program's interpretation: CLICK
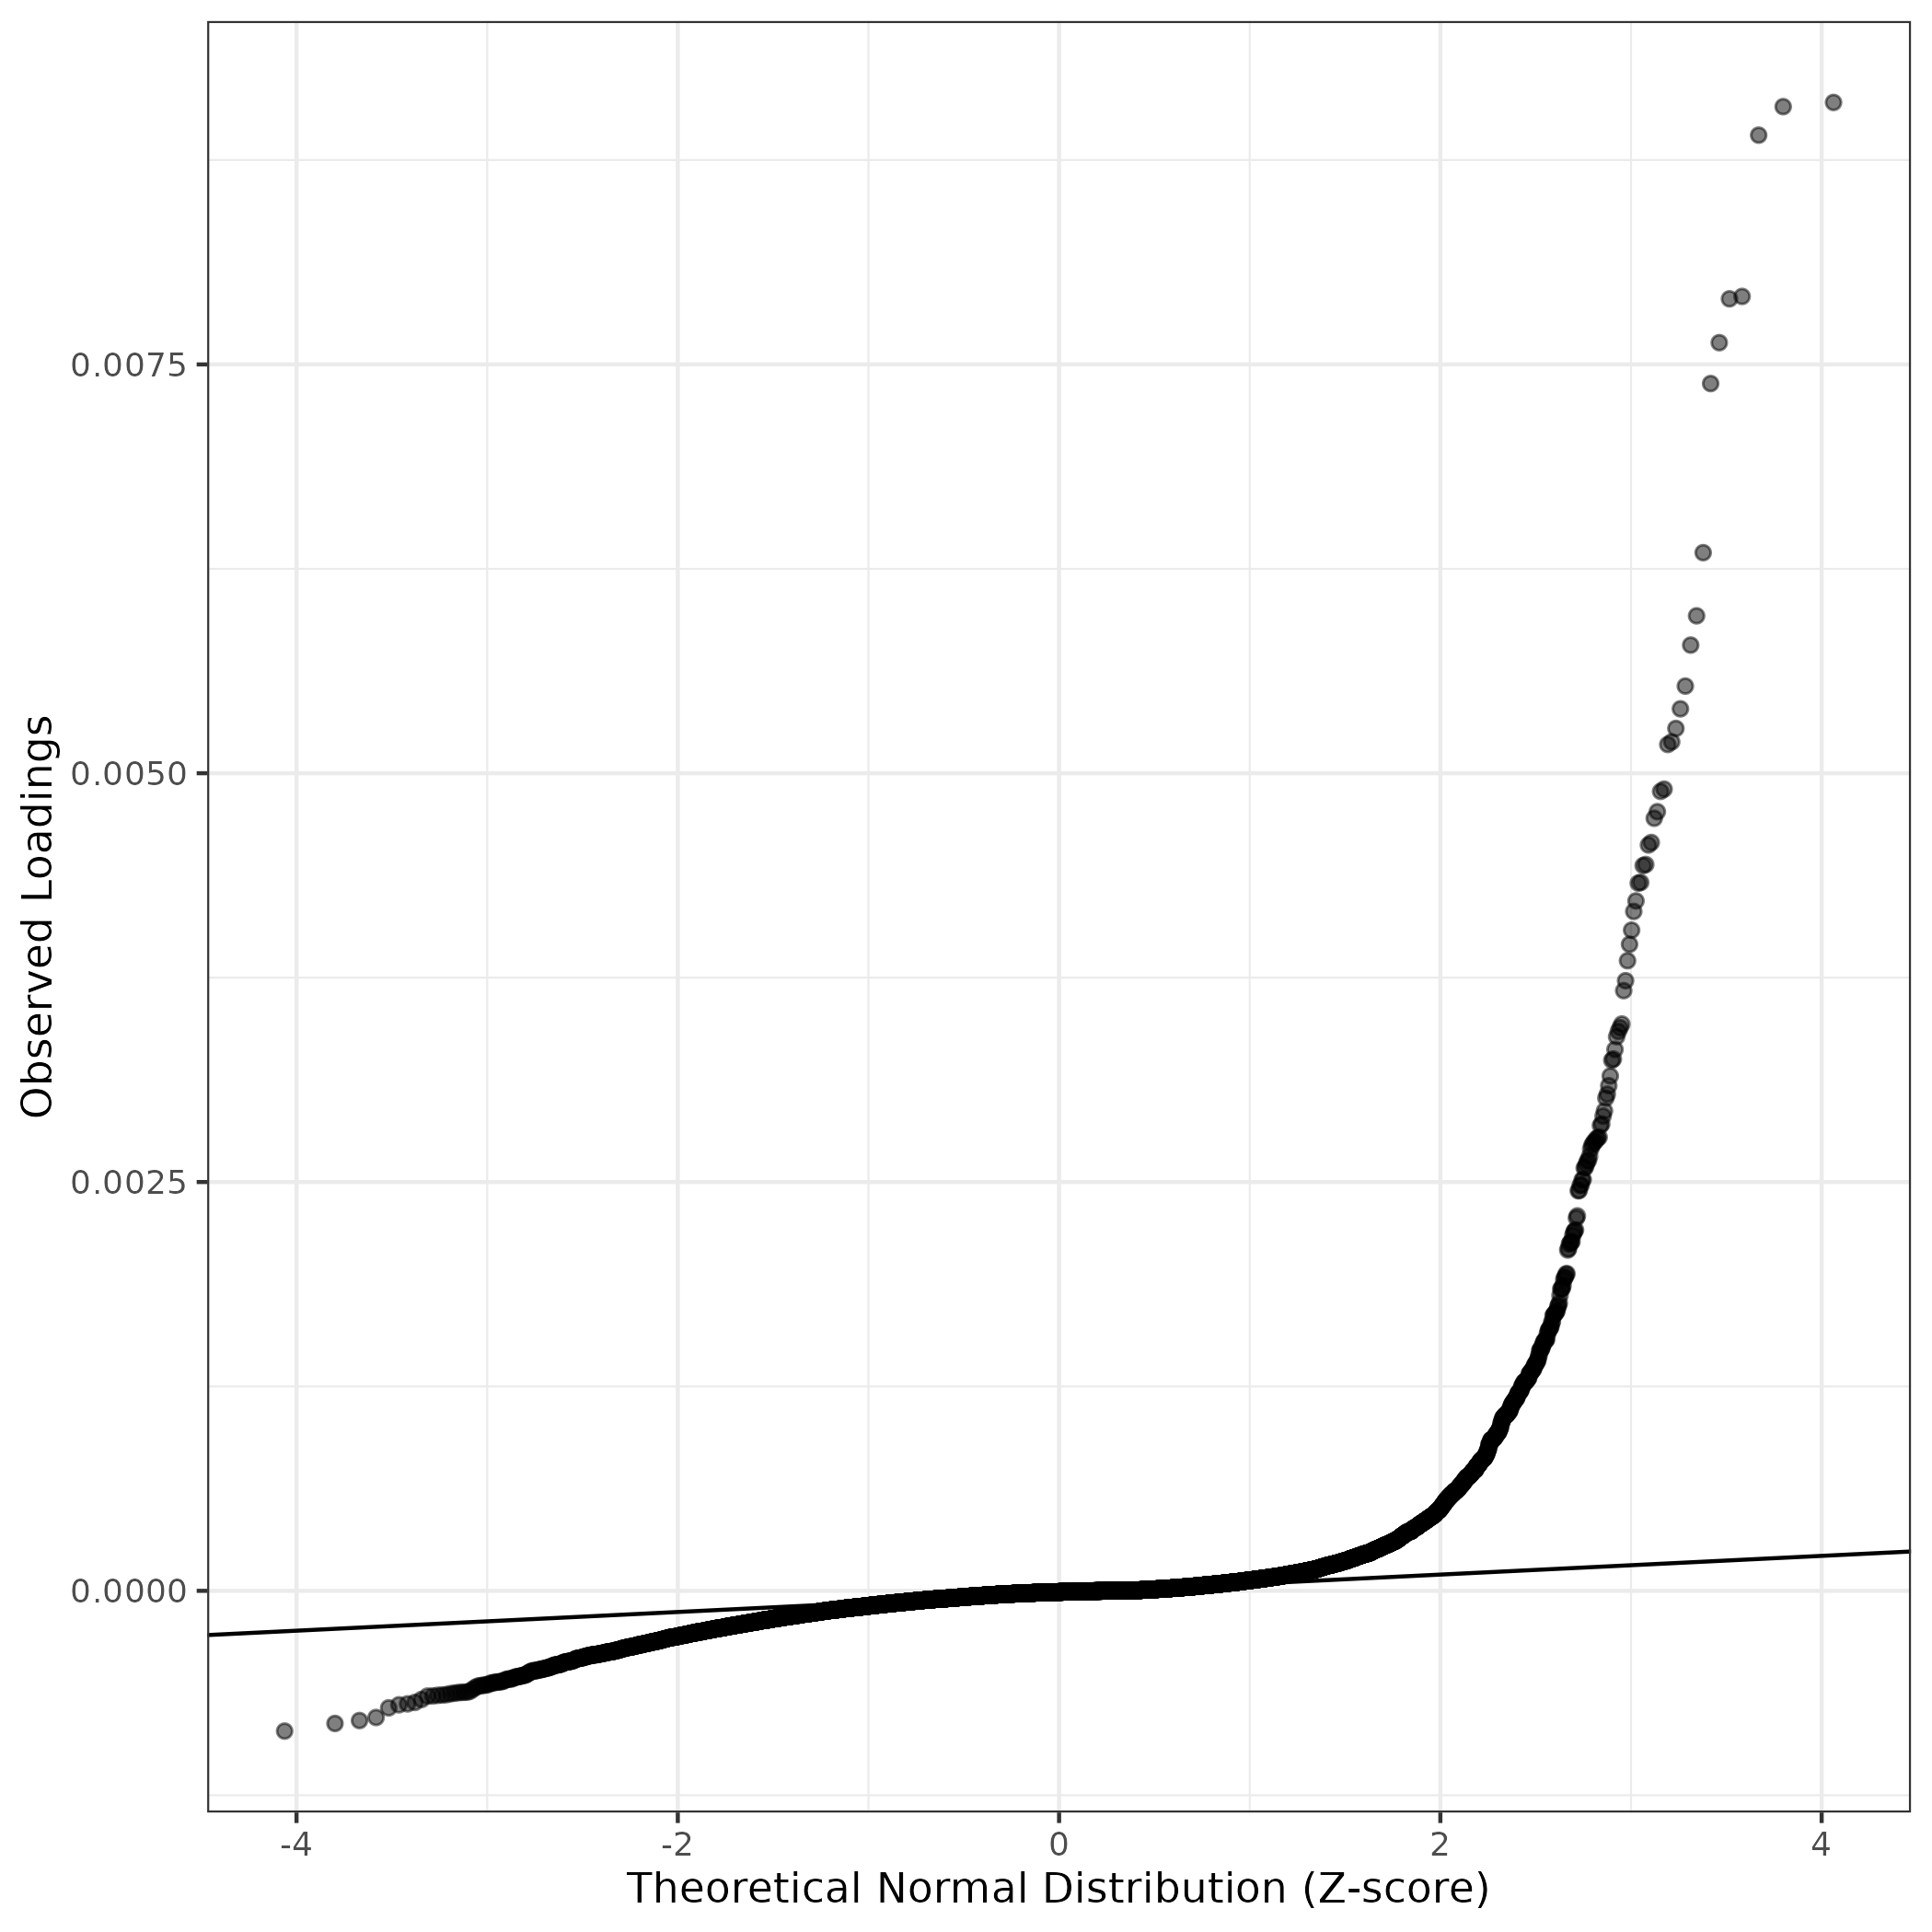
QQ-plot of gene loadings, averaged over both independent splits of the data
This plot highlights the relative contribution of each gene to the GEP
Top genes driving this program.
Note: Decartes website is buggy, try refreshing. Also, Decartes fetal adrenal data have been collected at specific time points (89-122 days), all possible cell types of interest may not be represented, do not overinterpret.
The Mean Count column shows the mean read count in cells scoring highly (H > 50) on this gene expression program.
| Gene | Loading | Gene.Name | GTEx | DepMap | Descartes | Mean.Counts | Mean.Tpm | |
|---|---|---|---|---|---|---|---|---|
| 1 | COL3A1 | 0.0091022 | collagen type III alpha 1 chain | GTEx | DepMap | Descartes | 22.70 | 2636.24 |
| 2 | COL1A2 | 0.0090765 | collagen type I alpha 2 chain | GTEx | DepMap | Descartes | 25.13 | 2704.87 |
| 3 | COL1A1 | 0.0089022 | collagen type I alpha 1 chain | GTEx | DepMap | Descartes | 26.11 | 2919.87 |
| 4 | SFRP4 | 0.0079158 | secreted frizzled related protein 4 | GTEx | DepMap | Descartes | 1.85 | 335.96 |
| 5 | LUM | 0.0079013 | lumican | GTEx | DepMap | Descartes | 3.34 | 760.33 |
| 6 | MGP | 0.0076330 | matrix Gla protein | GTEx | DepMap | Descartes | 9.18 | 3183.28 |
| 7 | SPARC | 0.0073831 | secreted protein acidic and cysteine rich | GTEx | DepMap | Descartes | 9.06 | 1554.29 |
| 8 | THBS2 | 0.0063489 | thrombospondin 2 | GTEx | DepMap | Descartes | 4.80 | 493.88 |
| 9 | SFRP2 | 0.0059625 | secreted frizzled related protein 2 | GTEx | DepMap | Descartes | 1.48 | 455.13 |
| 10 | DCN | 0.0057837 | decorin | GTEx | DepMap | Descartes | 3.84 | 333.99 |
| 11 | IGFBP5 | 0.0055329 | insulin like growth factor binding protein 5 | GTEx | DepMap | Descartes | 5.40 | 464.83 |
| 12 | POSTN | 0.0053938 | periostin | GTEx | DepMap | Descartes | 5.02 | 937.88 |
| 13 | TIMP1 | 0.0052738 | TIMP metallopeptidase inhibitor 1 | GTEx | DepMap | Descartes | 4.82 | 2591.36 |
| 14 | BGN | 0.0051920 | biglycan | GTEx | DepMap | Descartes | 2.39 | 648.30 |
| 15 | CCDC80 | 0.0051759 | coiled-coil domain containing 80 | GTEx | DepMap | Descartes | 2.32 | 114.52 |
| 16 | AEBP1 | 0.0049027 | AE binding protein 1 | GTEx | DepMap | Descartes | 2.41 | 382.98 |
| 17 | COL10A1 | 0.0048890 | collagen type X alpha 1 chain | GTEx | DepMap | Descartes | 0.60 | 97.47 |
| 18 | IGFBP7 | 0.0047647 | insulin like growth factor binding protein 7 | GTEx | DepMap | Descartes | 19.11 | 7926.95 |
| 19 | VCAN | 0.0047246 | versican | GTEx | DepMap | Descartes | 7.91 | 358.23 |
| 20 | CTHRC1 | 0.0045763 | collagen triple helix repeat containing 1 | GTEx | DepMap | Descartes | 0.99 | 462.15 |
| 21 | LOX | 0.0045611 | lysyl oxidase | GTEx | DepMap | Descartes | 0.39 | 45.05 |
| 22 | FBLN2 | 0.0044416 | fibulin 2 | GTEx | DepMap | Descartes | 0.80 | 113.59 |
| 23 | COL5A1 | 0.0044354 | collagen type V alpha 1 chain | GTEx | DepMap | Descartes | 4.10 | 307.10 |
| 24 | ITGBL1 | 0.0043320 | integrin subunit beta like 1 | GTEx | DepMap | Descartes | 2.82 | 330.12 |
| 25 | LAMP5 | 0.0043281 | lysosomal associated membrane protein family member 5 | GTEx | DepMap | Descartes | 0.32 | 99.22 |
| 26 | ISLR | 0.0042190 | immunoglobulin superfamily containing leucine rich repeat | GTEx | DepMap | Descartes | 0.48 | 125.10 |
| 27 | COMP | 0.0041548 | cartilage oligomeric matrix protein | GTEx | DepMap | Descartes | 0.27 | 63.35 |
| 28 | LTBP2 | 0.0040403 | latent transforming growth factor beta binding protein 2 | GTEx | DepMap | Descartes | 1.51 | 114.21 |
| 29 | PRSS23 | 0.0039537 | serine protease 23 | GTEx | DepMap | Descartes | 2.94 | 315.18 |
| 30 | COL6A3 | 0.0038533 | collagen type VI alpha 3 chain | GTEx | DepMap | Descartes | 6.38 | 385.35 |
| 31 | FNDC1 | 0.0037311 | fibronectin type III domain containing 1 | GTEx | DepMap | Descartes | 0.84 | 81.35 |
| 32 | C1R | 0.0036704 | complement C1r | GTEx | DepMap | Descartes | 1.10 | 194.74 |
| 33 | PRELP | 0.0034662 | proline and arginine rich end leucine rich repeat protein | GTEx | DepMap | Descartes | 0.48 | 51.27 |
| 34 | FBN1 | 0.0034442 | fibrillin 1 | GTEx | DepMap | Descartes | 3.67 | 183.67 |
| 35 | SULF1 | 0.0034207 | sulfatase 1 | GTEx | DepMap | Descartes | 9.02 | 933.45 |
| 36 | INHBA | 0.0033887 | inhibin subunit beta A | GTEx | DepMap | Descartes | 1.80 | 170.81 |
| 37 | FSTL1 | 0.0033109 | follistatin like 1 | GTEx | DepMap | Descartes | 2.43 | 245.20 |
| 38 | COL6A2 | 0.0032523 | collagen type VI alpha 2 chain | GTEx | DepMap | Descartes | 3.53 | 647.18 |
| 39 | TMEM119 | 0.0032448 | transmembrane protein 119 | GTEx | DepMap | Descartes | 0.28 | 61.50 |
| 40 | F2R | 0.0031486 | coagulation factor II thrombin receptor | GTEx | DepMap | Descartes | 1.07 | 164.79 |
| 41 | COL6A1 | 0.0030892 | collagen type VI alpha 1 chain | GTEx | DepMap | Descartes | 2.51 | 378.26 |
| 42 | IGFBP4 | 0.0030373 | insulin like growth factor binding protein 4 | GTEx | DepMap | Descartes | 2.09 | 536.09 |
| 43 | FAP | 0.0030129 | fibroblast activation protein alpha | GTEx | DepMap | Descartes | 2.08 | 439.00 |
| 44 | FN1 | 0.0029355 | fibronectin 1 | GTEx | DepMap | Descartes | 11.91 | 778.73 |
| 45 | COL14A1 | 0.0029033 | collagen type XIV alpha 1 chain | GTEx | DepMap | Descartes | 3.23 | 243.58 |
| 46 | LRRC32 | 0.0028550 | leucine rich repeat containing 32 | GTEx | DepMap | Descartes | 0.65 | 88.33 |
| 47 | CCN2 | 0.0028457 | cellular communication network factor 2 | GTEx | DepMap | Descartes | 3.80 | NA |
| 48 | FMO2 | 0.0027749 | flavin containing dimethylaniline monoxygenase 2 | GTEx | DepMap | Descartes | 0.74 | 77.44 |
| 49 | S100A11 | 0.0027685 | S100 calcium binding protein A11 | GTEx | DepMap | Descartes | 0.95 | 906.99 |
| 50 | CDH11 | 0.0027664 | cadherin 11 | GTEx | DepMap | Descartes | 4.77 | 393.24 |
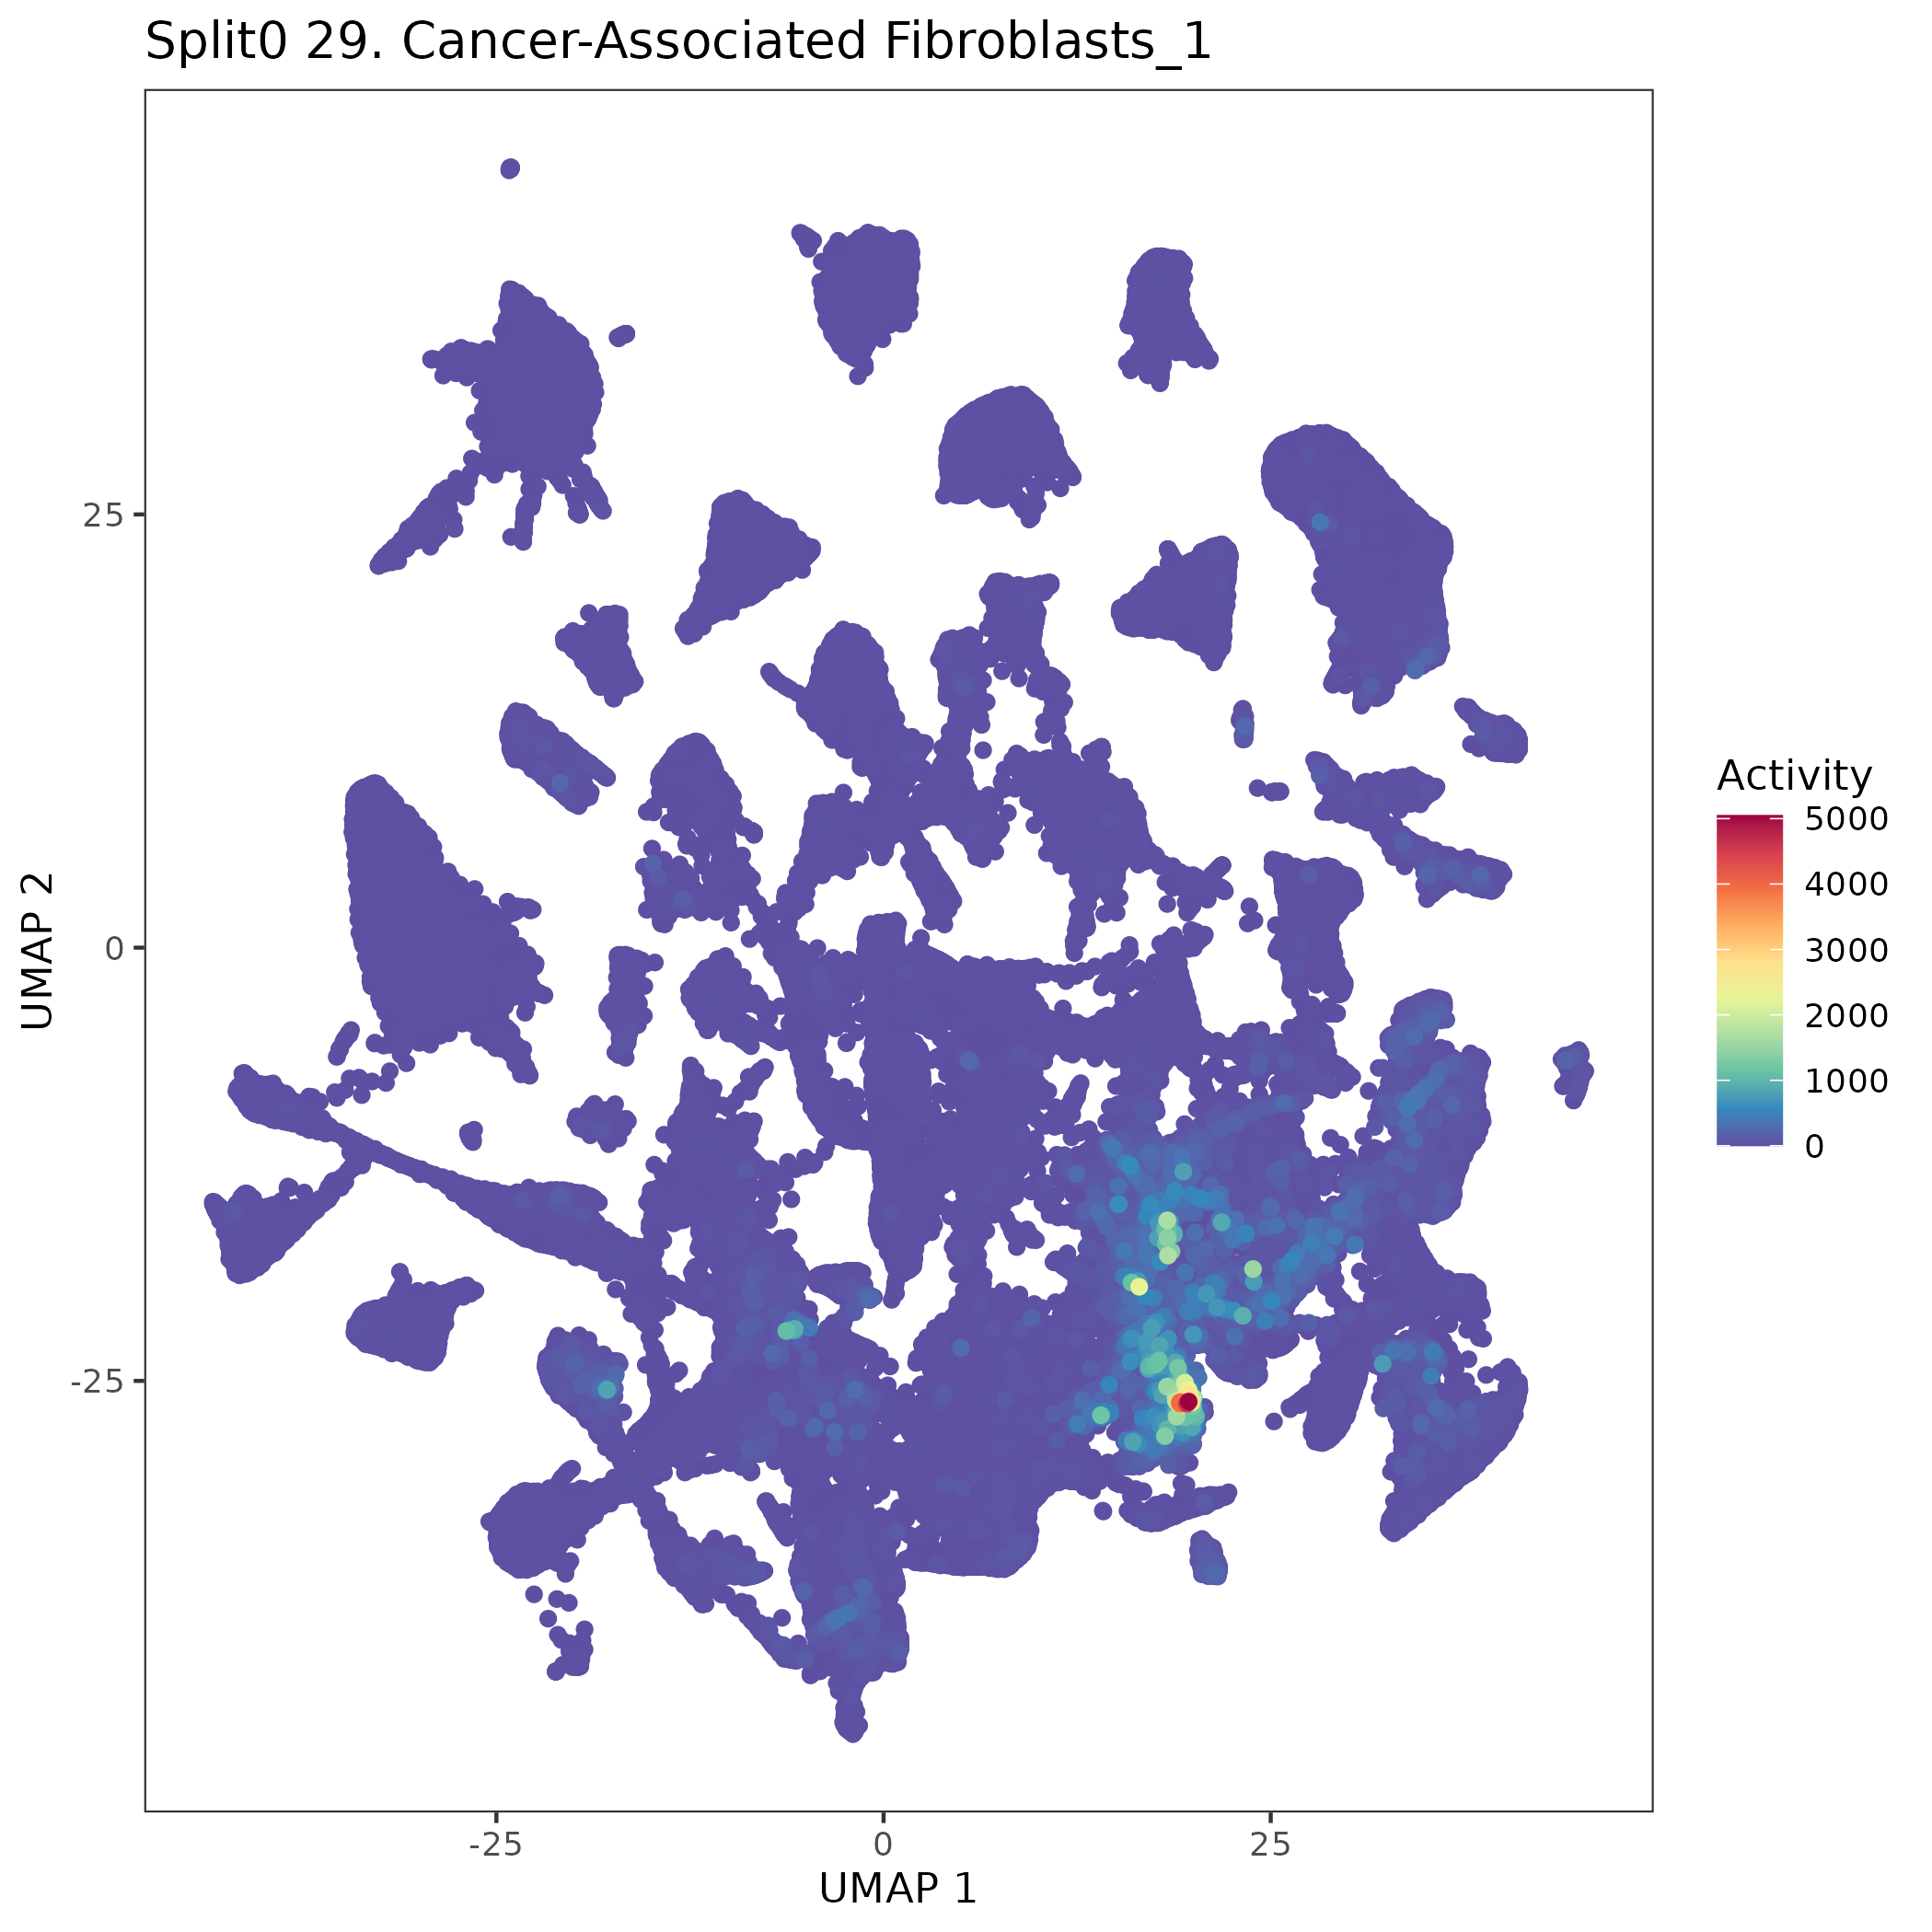
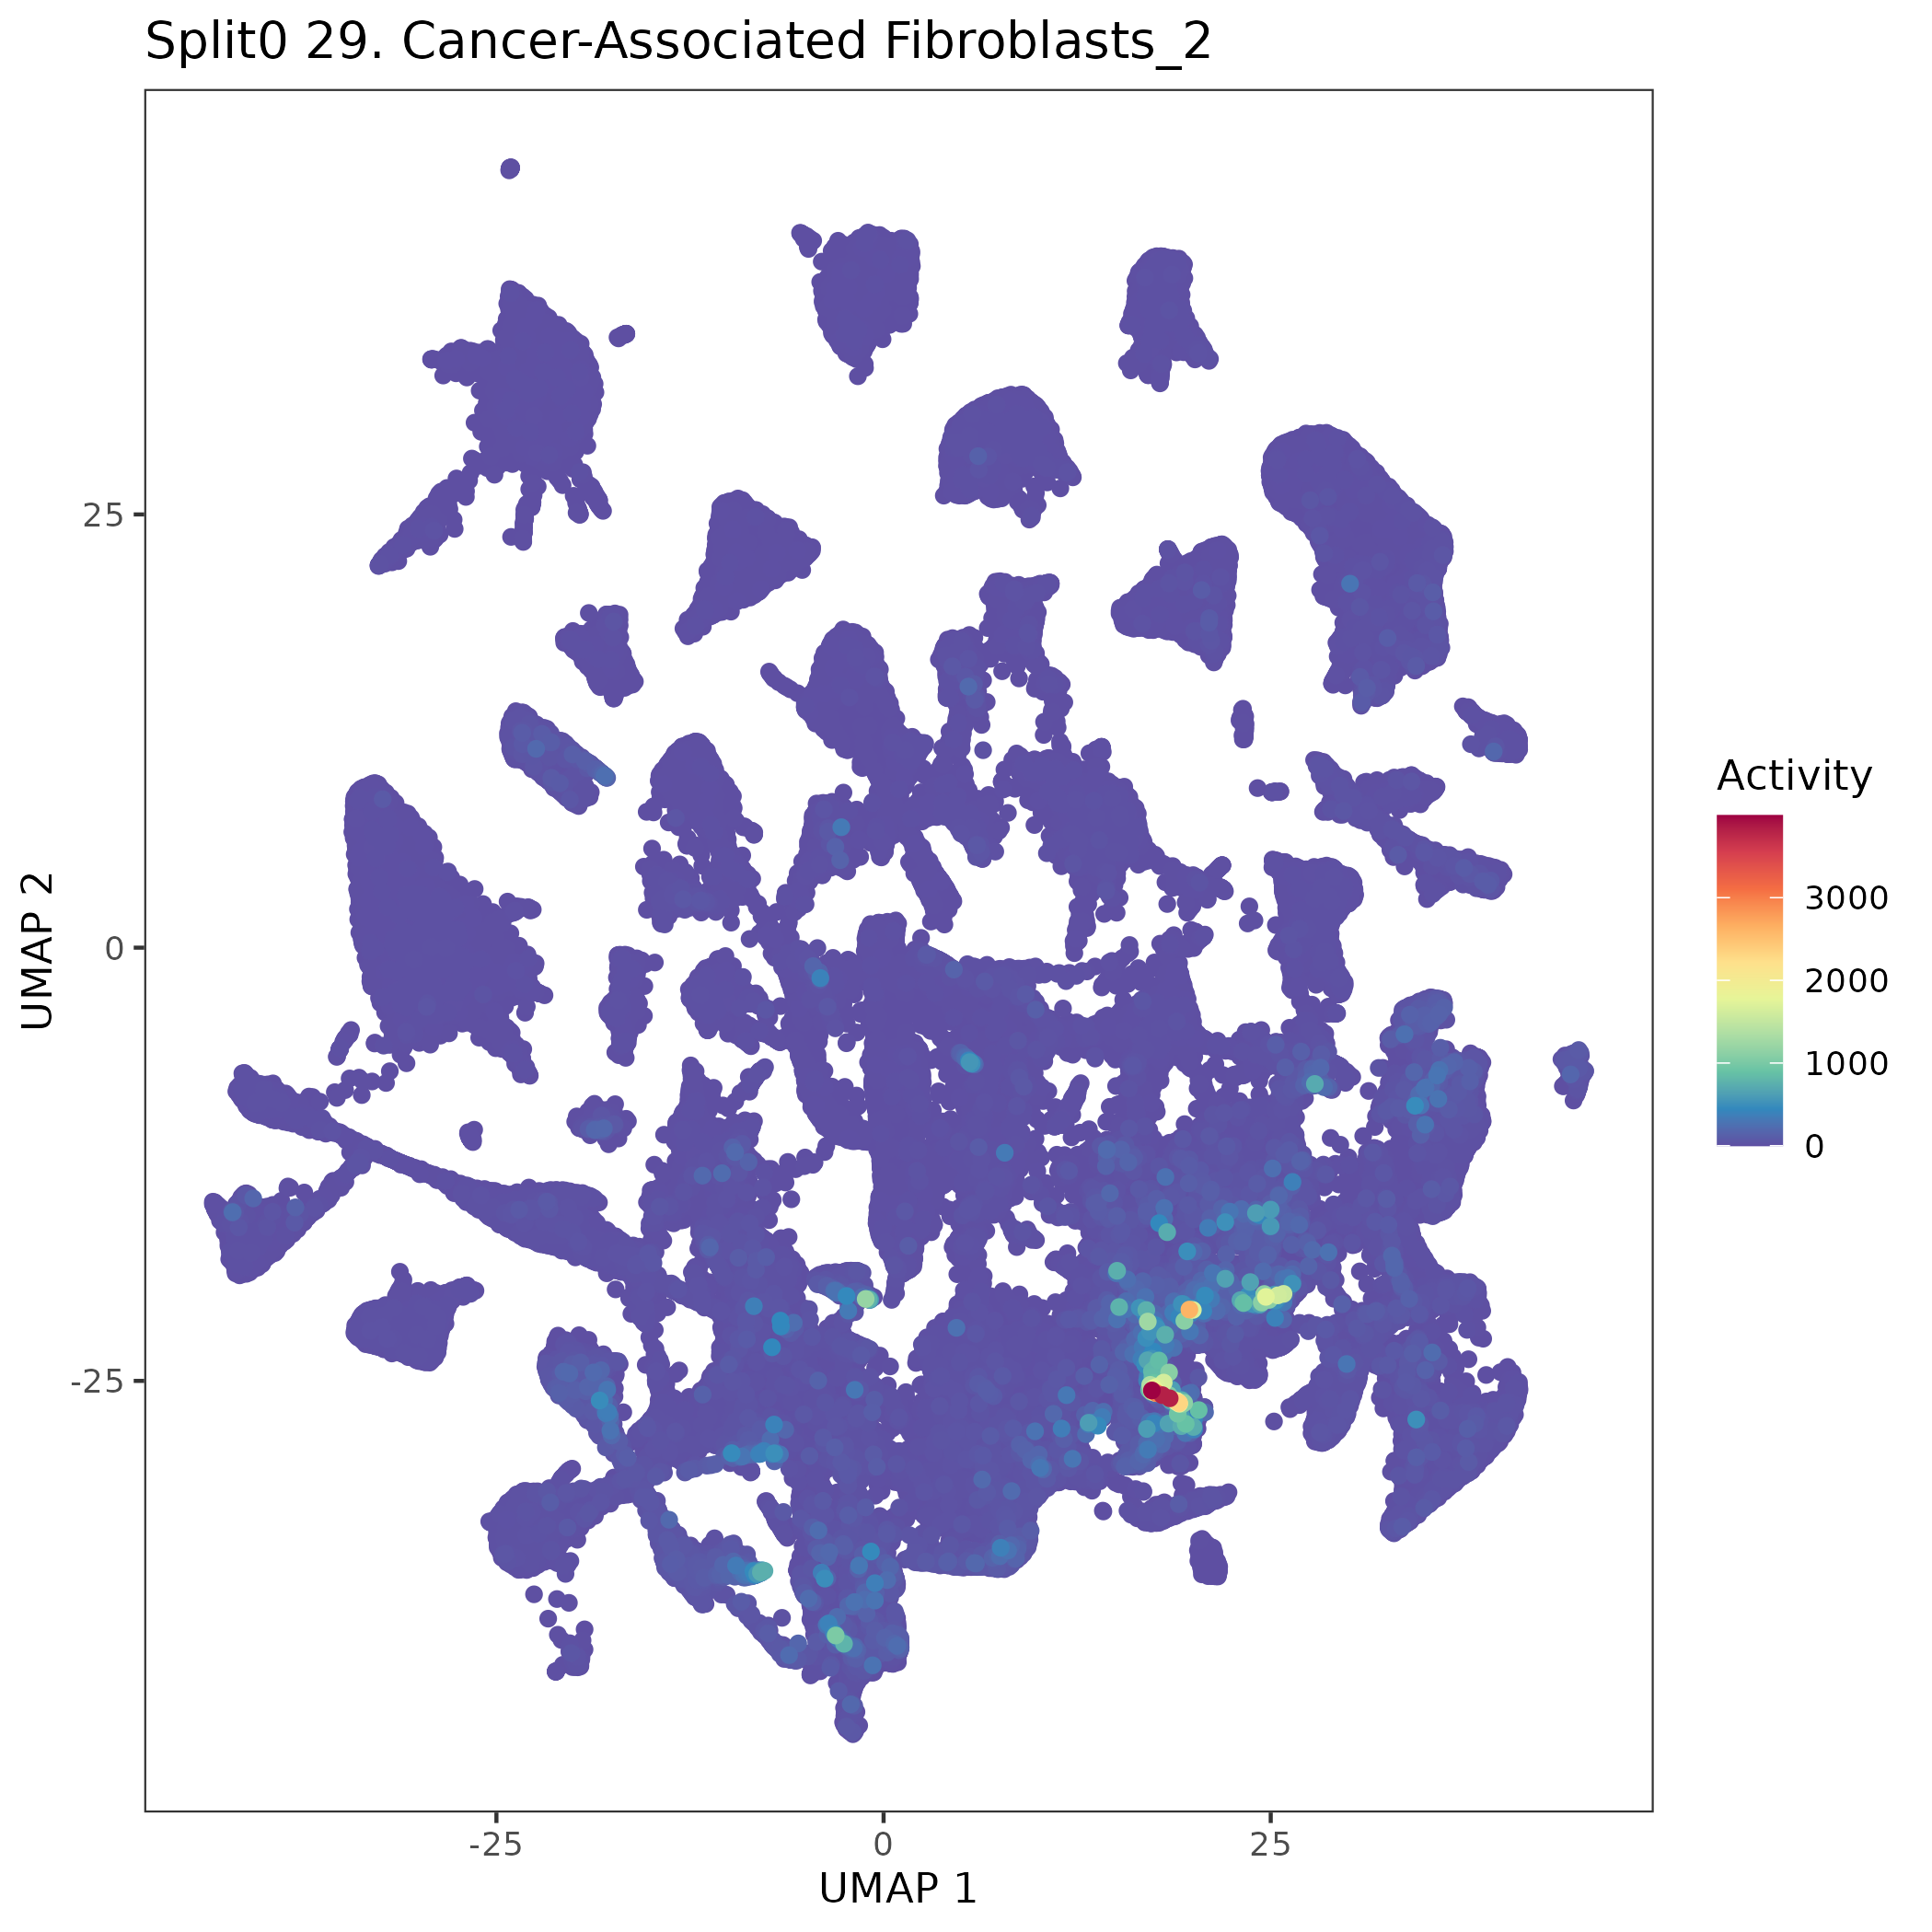
UMAP plots showing activity of gene expression program identified in GEP 29. Cancer-Associated Fibroblasts:
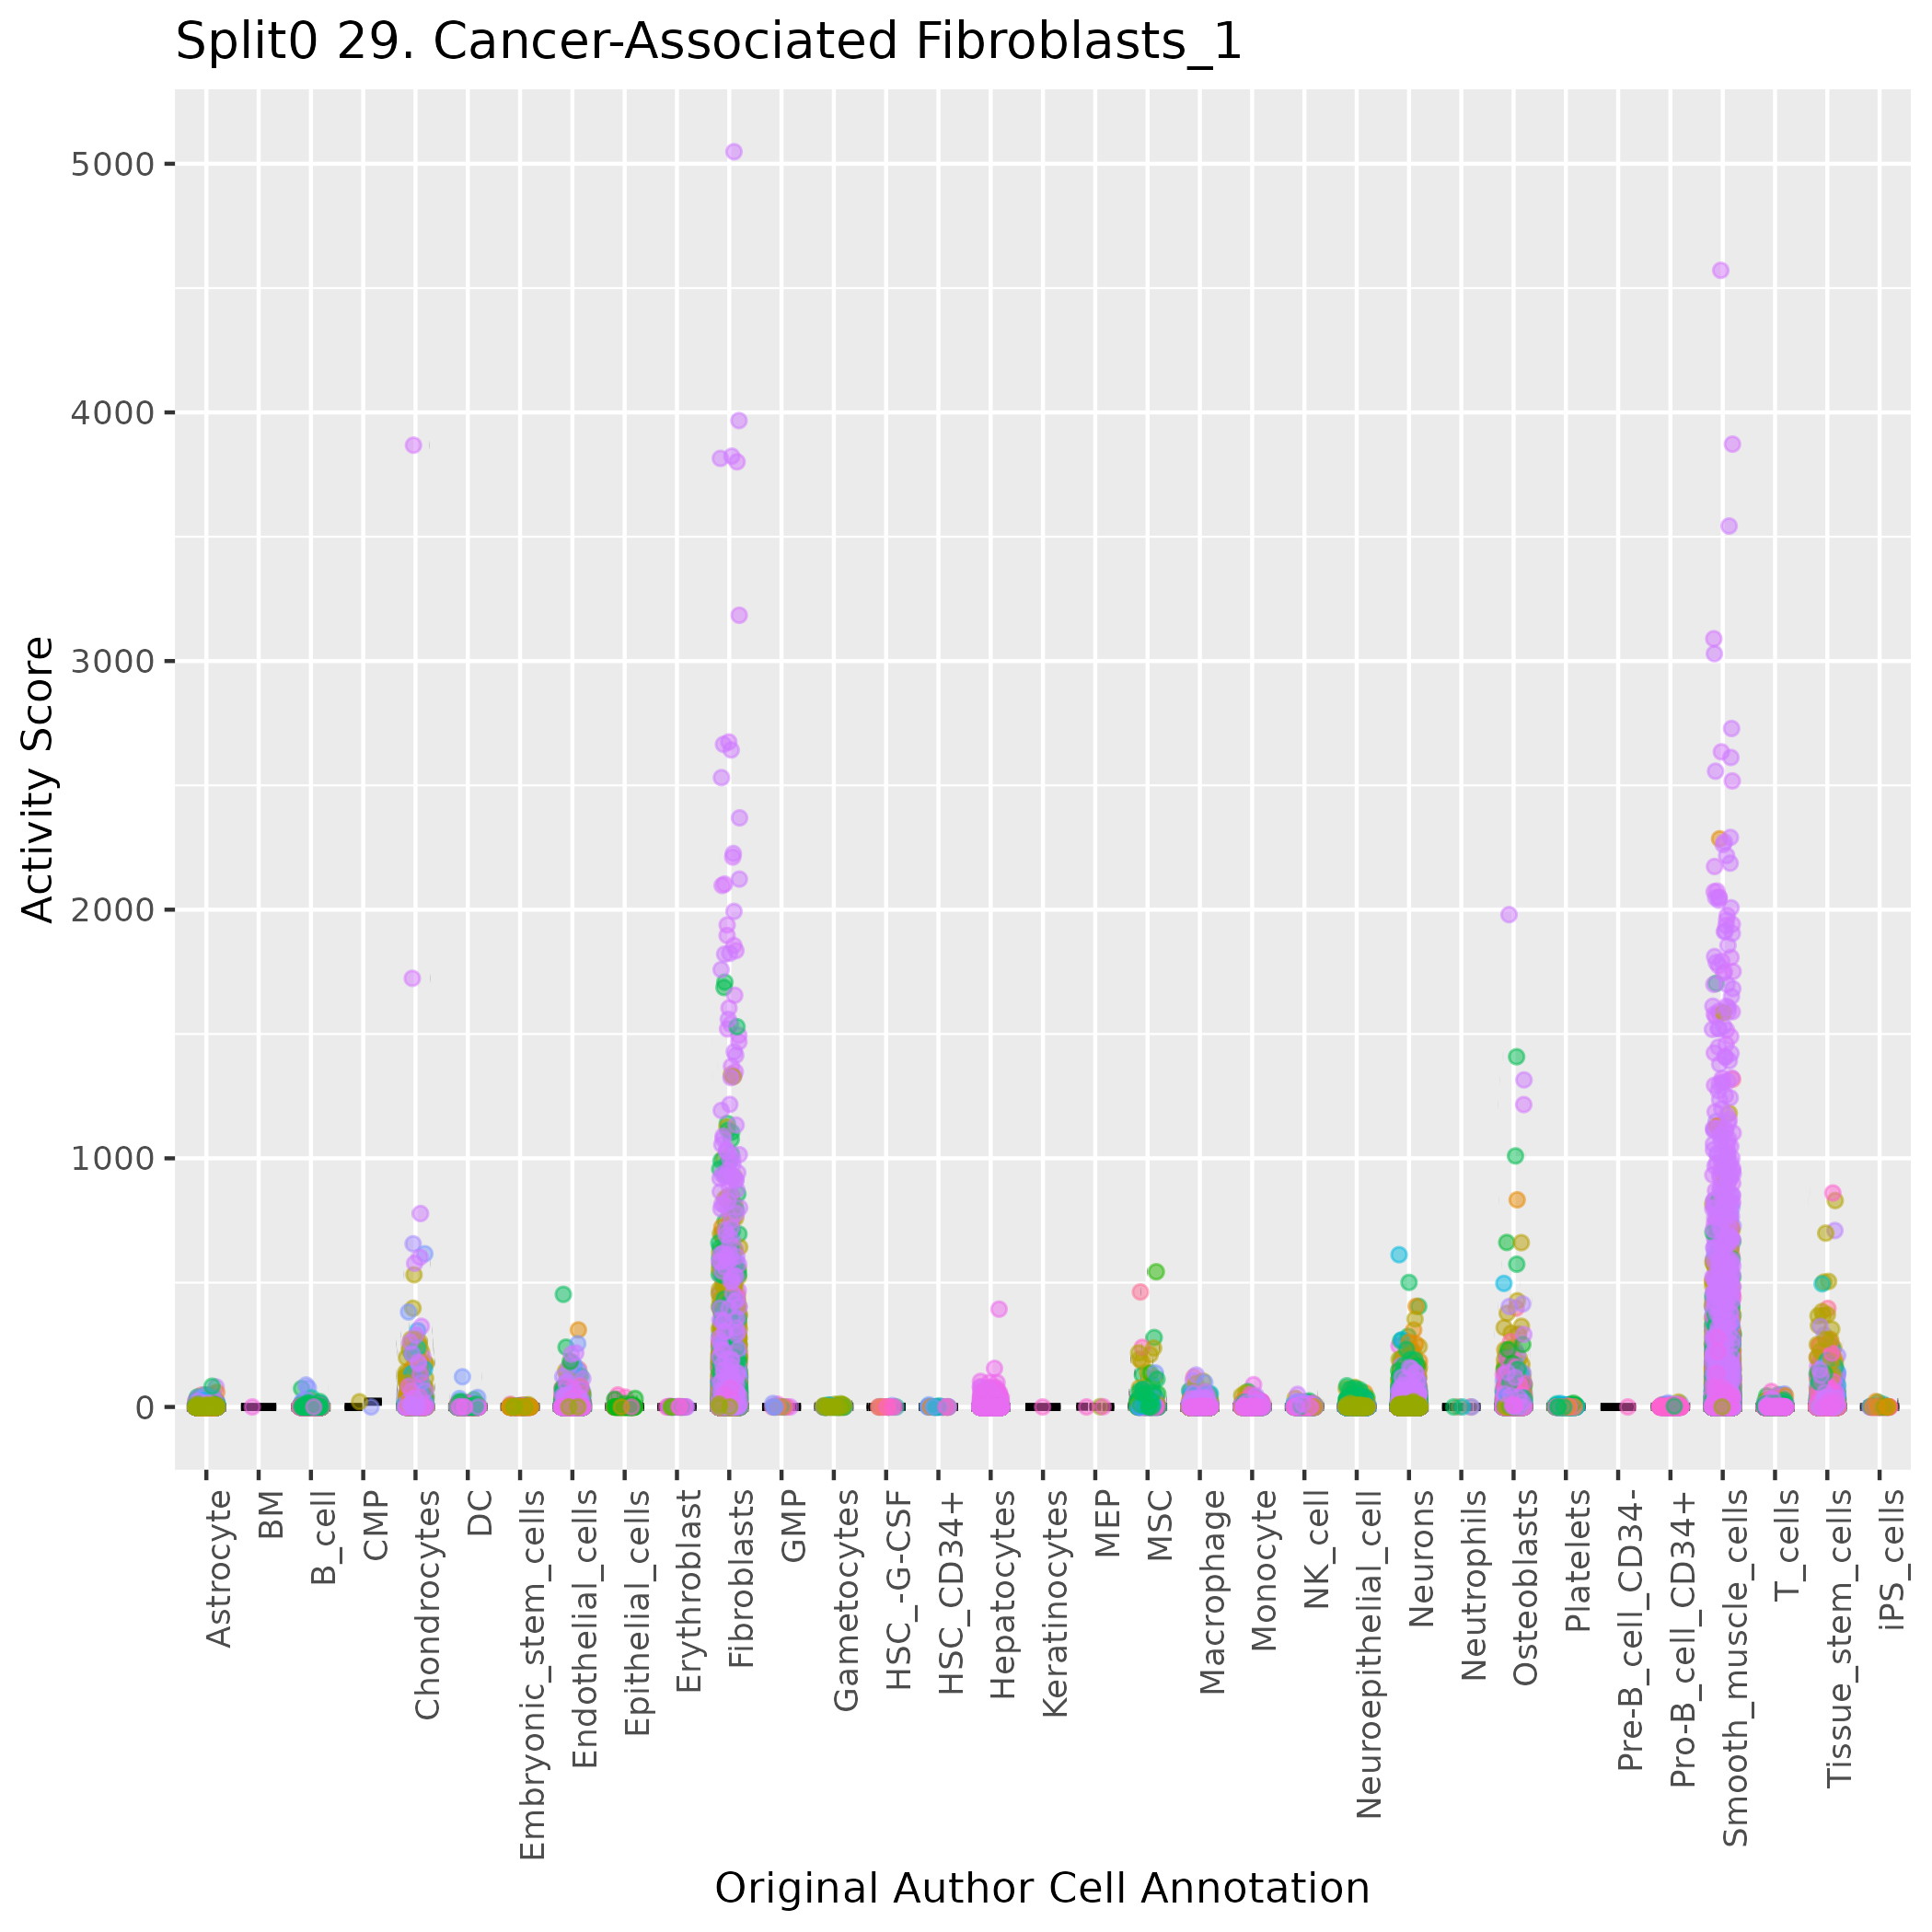
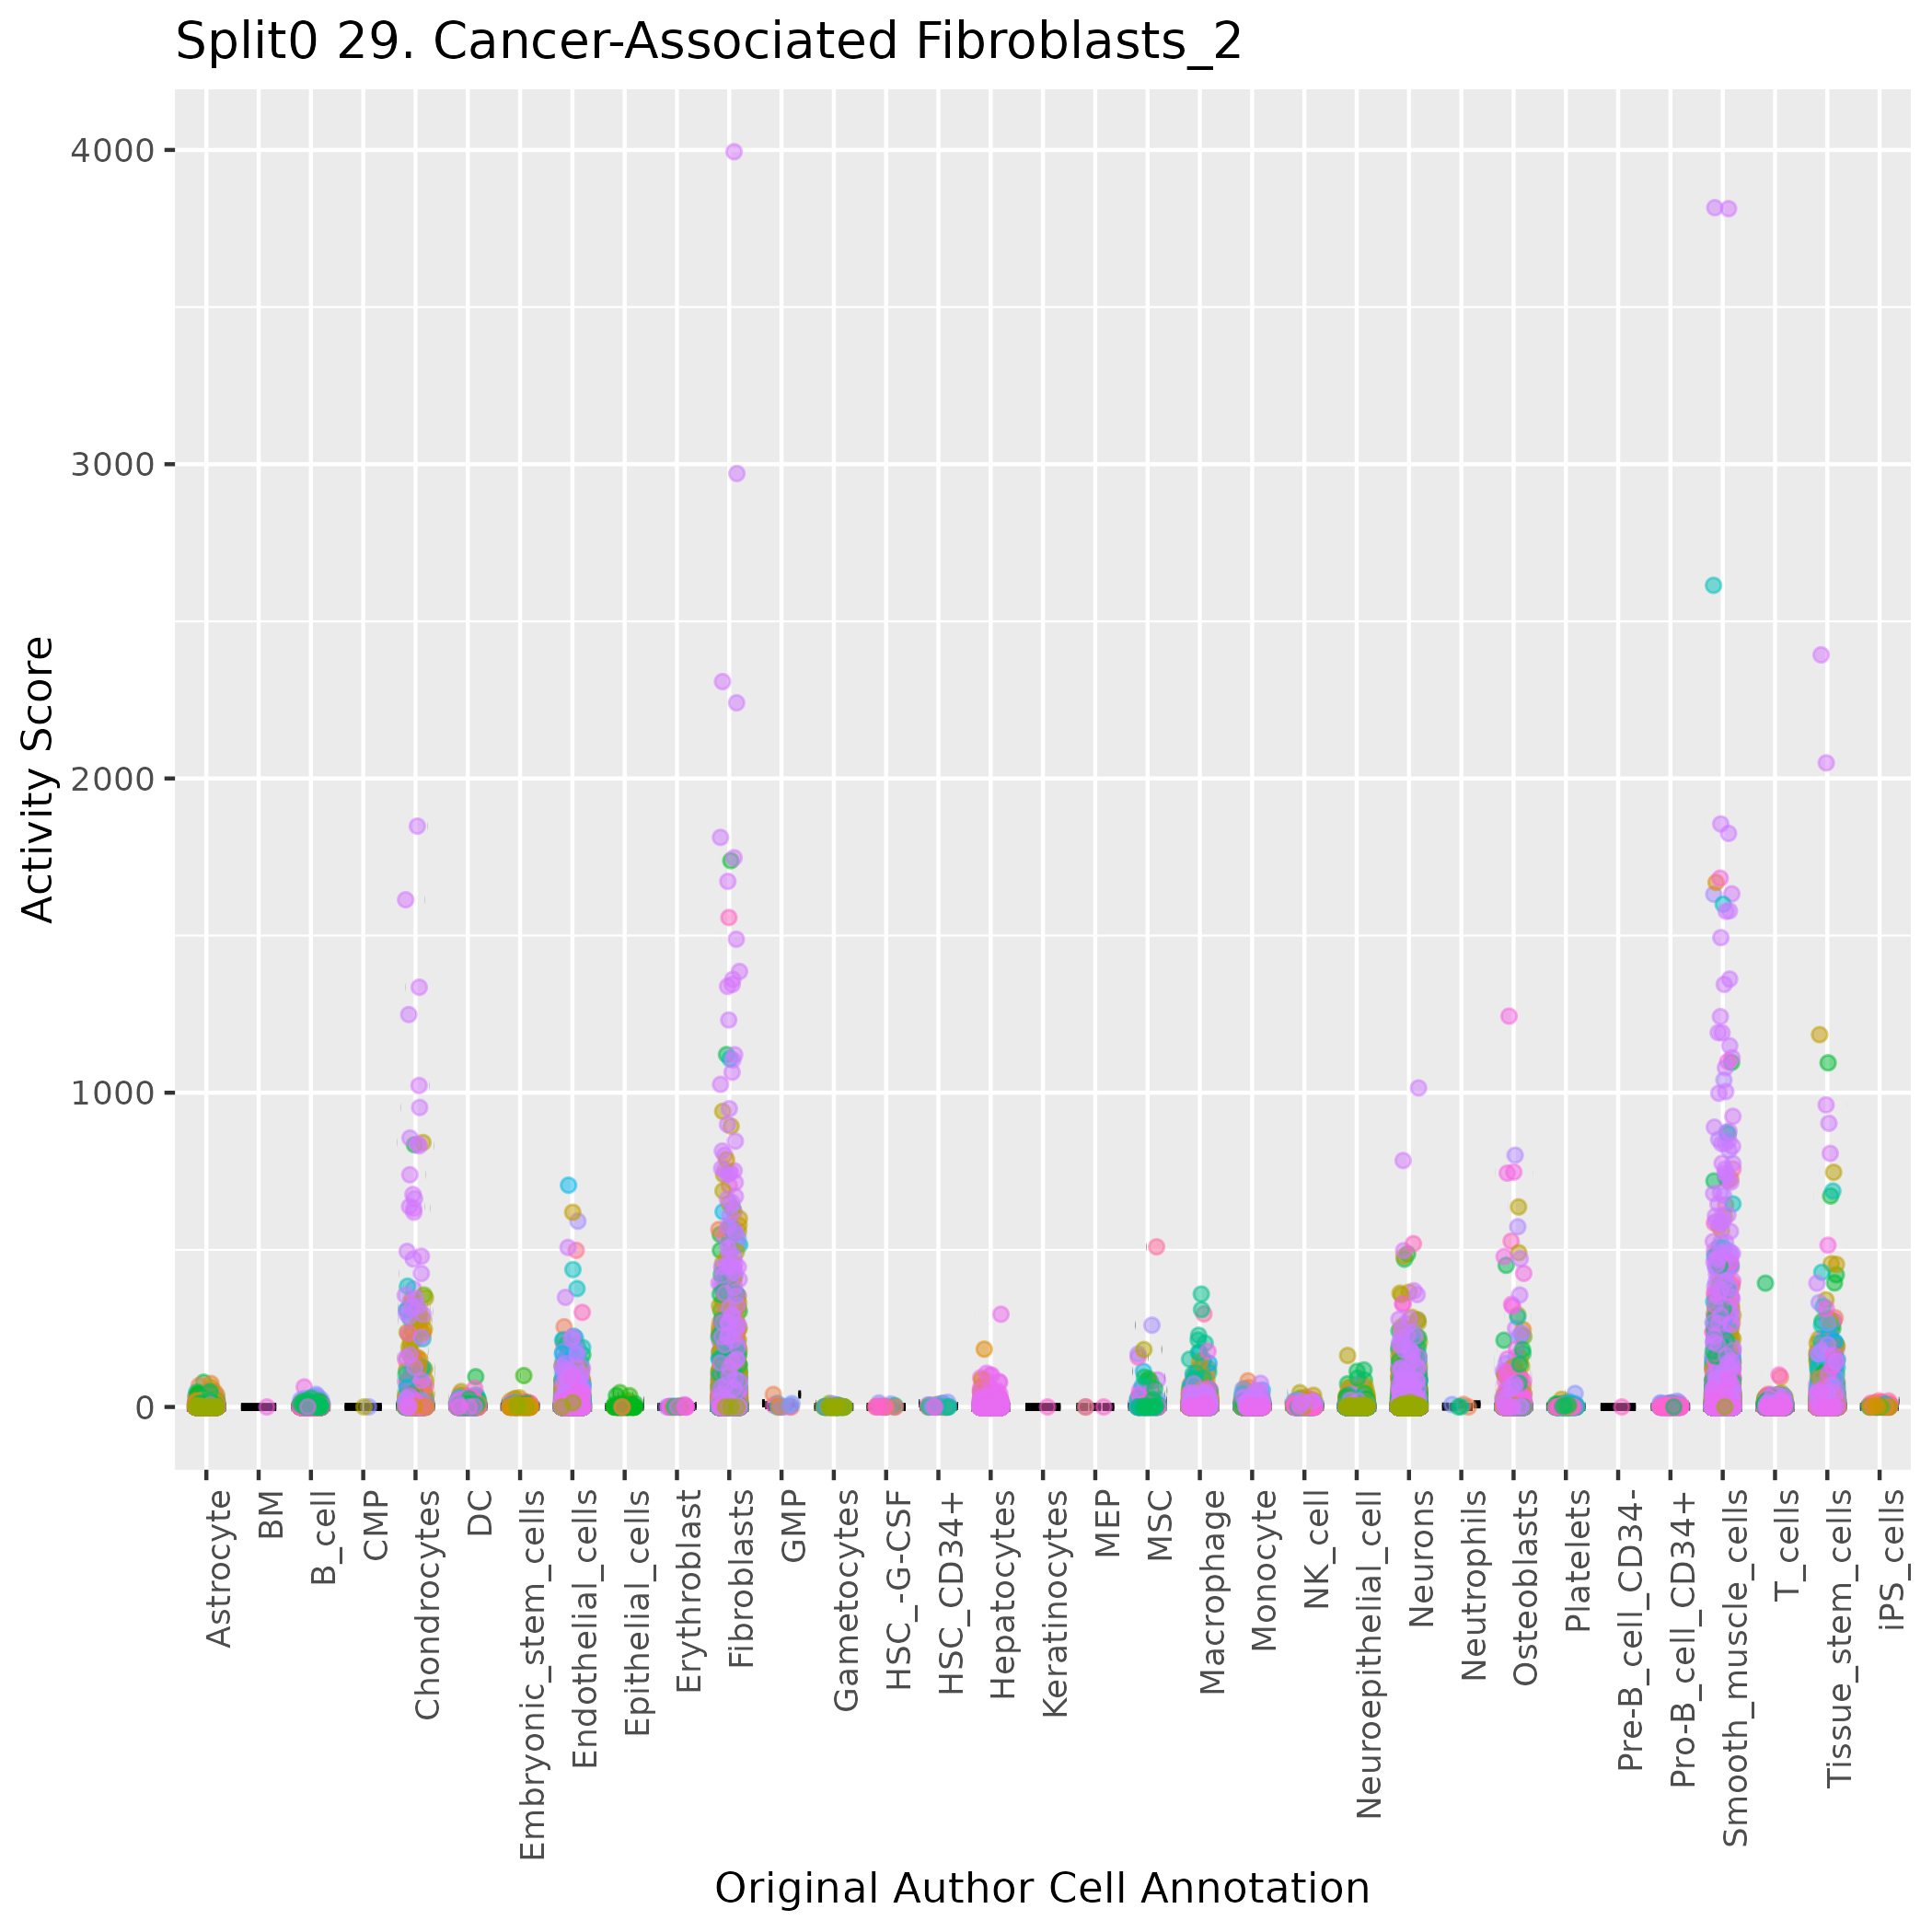
Boxlot showing activity of gene expression program identified in GEP 29. Cancer-Associated Fibroblasts:
Gene set Enrichments for this program, caculated from top 50 genes
mSigDB Cell Types Gene Set:
| P-value | OR | Lower 95% CI | FDR | FWER | Genes Found | Gene Set Size | |
|---|---|---|---|---|---|---|---|
| DESCARTES_FETAL_EYE_STROMAL_CELLS | 8.33e-45 | 284.52 | 148.94 | 2.80e-42 | 5.59e-42 | 24COL3A1, COL1A2, COL1A1, LUM, MGP, SPARC, THBS2, SFRP2, DCN, POSTN, CTHRC1, LOX, COL5A1, ITGBL1, ISLR, COL6A3, FNDC1, C1R, FBN1, INHBA, COL6A2, COL6A1, FN1, COL14A1 |
90 |
| DURANTE_ADULT_OLFACTORY_NEUROEPITHELIUM_FIBROBLASTS_STROMAL_CELLS | 6.86e-34 | 198.90 | 100.83 | 5.12e-32 | 4.61e-31 | 19COL3A1, COL1A2, COL1A1, LUM, MGP, SPARC, SFRP2, DCN, IGFBP5, POSTN, TIMP1, BGN, AEBP1, IGFBP7, ITGBL1, C1R, COL6A2, IGFBP4, CDH11 |
82 |
| DESCARTES_FETAL_THYMUS_STROMAL_CELLS | 3.51e-42 | 182.13 | 97.22 | 5.88e-40 | 2.35e-39 | 25COL3A1, COL1A2, COL1A1, LUM, MGP, SPARC, THBS2, SFRP2, DCN, IGFBP5, POSTN, TIMP1, BGN, CCDC80, VCAN, LOX, FBLN2, COL5A1, ISLR, FNDC1, C1R, FBN1, FSTL1, COL6A1, COL14A1 |
137 |
| CUI_DEVELOPING_HEART_C3_FIBROBLAST_LIKE_CELL | 3.40e-37 | 169.50 | 88.79 | 4.56e-35 | 2.28e-34 | 22COL1A2, COL1A1, LUM, MGP, SPARC, THBS2, DCN, TIMP1, IGFBP7, LOX, FBLN2, COL5A1, ISLR, COL6A3, FNDC1, C1R, FBN1, FSTL1, COL6A2, COL6A1, COL14A1, CCN2 |
117 |
| AIZARANI_LIVER_C21_STELLATE_CELLS_1 | 2.15e-42 | 144.03 | 77.74 | 4.82e-40 | 1.44e-39 | 27COL3A1, COL1A2, COL1A1, LUM, MGP, SPARC, THBS2, DCN, IGFBP5, TIMP1, BGN, CCDC80, AEBP1, IGFBP7, FBLN2, COL5A1, PRSS23, COL6A3, C1R, PRELP, FBN1, FSTL1, COL6A2, COL6A1, IGFBP4, COL14A1, CCN2 |
194 |
| CUI_DEVELOPING_HEART_COMPACT_VENTRICULAR_CARDIOMYOCYTE | 1.80e-24 | 155.30 | 73.20 | 7.09e-23 | 1.21e-21 | 14COL3A1, COL1A2, COL1A1, LUM, MGP, SPARC, DCN, POSTN, COL5A1, COL6A3, FBN1, COL6A2, COL6A1, FN1 |
65 |
| GAO_LARGE_INTESTINE_24W_C1_DCLK1POS_PROGENITOR | 5.41e-30 | 142.62 | 72.10 | 2.79e-28 | 3.63e-27 | 18COL3A1, COL1A2, COL1A1, LUM, MGP, SPARC, THBS2, SFRP2, DCN, CCDC80, VCAN, CTHRC1, LOX, COL5A1, ISLR, FNDC1, C1R, COL14A1 |
99 |
| CUI_DEVELOPING_HEART_SMOOTH_MUSCLE_CELL | 1.10e-19 | 155.67 | 66.81 | 3.88e-18 | 7.36e-17 | 11COL3A1, COL1A2, COL1A1, SPARC, SFRP2, BGN, CCDC80, LOX, C1R, IGFBP4, COL14A1 |
48 |
| MURARO_PANCREAS_MESENCHYMAL_STROMAL_CELL | 4.47e-49 | 113.54 | 56.86 | 3.00e-46 | 3.00e-46 | 39COL3A1, COL1A2, COL1A1, LUM, MGP, SPARC, THBS2, SFRP2, DCN, IGFBP5, POSTN, TIMP1, BGN, CCDC80, AEBP1, IGFBP7, VCAN, CTHRC1, LOX, COL5A1, LAMP5, ISLR, LTBP2, COL6A3, C1R, FBN1, SULF1, INHBA, FSTL1, COL6A2, F2R, COL6A1, IGFBP4, FAP, FN1, LRRC32, CCN2, S100A11, CDH11 |
680 |
| DESCARTES_FETAL_KIDNEY_STROMAL_CELLS | 9.20e-31 | 108.44 | 56.73 | 5.61e-29 | 6.17e-28 | 20COL3A1, COL1A2, COL1A1, LUM, MGP, SPARC, THBS2, SFRP2, DCN, POSTN, LOX, FBLN2, ISLR, LTBP2, FNDC1, C1R, PRELP, FBN1, SULF1, COL14A1 |
146 |
| DESCARTES_FETAL_ADRENAL_STROMAL_CELLS | 2.46e-30 | 102.73 | 53.77 | 1.38e-28 | 1.65e-27 | 20COL3A1, COL1A1, LUM, MGP, THBS2, SFRP2, DCN, POSTN, CCDC80, LOX, ITGBL1, ISLR, COL6A3, FNDC1, C1R, PRELP, SULF1, TMEM119, FAP, CDH11 |
153 |
| RUBENSTEIN_SKELETAL_MUSCLE_FAP_CELLS | 7.19e-31 | 94.10 | 49.77 | 4.82e-29 | 4.82e-28 | 21COL3A1, COL1A2, COL1A1, SFRP4, LUM, MGP, DCN, TIMP1, CCDC80, IGFBP7, VCAN, FBLN2, ISLR, COL6A3, C1R, FSTL1, COL6A2, COL6A1, FN1, FMO2, S100A11 |
179 |
| DESCARTES_MAIN_FETAL_STROMAL_CELLS | 1.03e-09 | 152.05 | 41.27 | 2.04e-08 | 6.93e-07 | 5COL1A2, COL1A1, THBS2, COL5A1, ITGBL1 |
20 |
| HU_FETAL_RETINA_FIBROBLAST | 5.60e-36 | 73.16 | 39.95 | 5.37e-34 | 3.76e-33 | 28COL3A1, COL1A2, COL1A1, LUM, SPARC, DCN, IGFBP5, TIMP1, BGN, CCDC80, AEBP1, IGFBP7, VCAN, COL5A1, PRSS23, COL6A3, C1R, FBN1, SULF1, FSTL1, COL6A2, TMEM119, F2R, IGFBP4, FN1, CCN2, S100A11, CDH11 |
385 |
| MENON_FETAL_KIDNEY_3_STROMAL_CELLS | 5.46e-17 | 82.56 | 36.62 | 1.83e-15 | 3.67e-14 | 11COL3A1, COL1A2, COL1A1, SPARC, IGFBP5, POSTN, VCAN, COL6A3, FSTL1, FN1, CDH11 |
81 |
| TRAVAGLINI_LUNG_MYOFIBROBLAST_CELL | 3.86e-14 | 80.27 | 32.75 | 1.08e-12 | 2.59e-11 | 9COL3A1, COL1A1, POSTN, VCAN, CTHRC1, COMP, LTBP2, PRELP, CCN2 |
65 |
| GAO_LARGE_INTESTINE_ADULT_CJ_IMMUNE_CELLS | 1.89e-34 | 59.50 | 32.57 | 1.58e-32 | 1.27e-31 | 29COL3A1, COL1A2, COL1A1, LUM, MGP, SPARC, DCN, IGFBP5, POSTN, BGN, CCDC80, AEBP1, IGFBP7, VCAN, LOX, COL5A1, ISLR, LTBP2, COL6A3, C1R, FBN1, SULF1, FSTL1, COL6A2, TMEM119, COL6A1, COL14A1, LRRC32, CDH11 |
505 |
| DESCARTES_FETAL_HEART_STROMAL_CELLS | 1.90e-10 | 99.95 | 32.15 | 3.87e-09 | 1.28e-07 | 6COL1A2, COL1A1, LUM, DCN, ISLR, PRELP |
34 |
| FAN_OVARY_CL6_PUTATIVE_EARLY_ATRETIC_FOLLICLE_THECAL_CELL_2 | 8.21e-28 | 58.01 | 31.23 | 3.93e-26 | 5.51e-25 | 22COL3A1, COL1A2, COL1A1, SFRP4, LUM, MGP, SPARC, DCN, IGFBP5, TIMP1, BGN, CCDC80, AEBP1, COL6A3, C1R, PRELP, FSTL1, COL6A2, COL6A1, IGFBP4, FN1, CDH11 |
300 |
| DESCARTES_FETAL_MUSCLE_STROMAL_CELLS | 4.86e-16 | 66.47 | 29.69 | 1.55e-14 | 3.26e-13 | 11COL3A1, COL1A2, COL1A1, LUM, MGP, DCN, POSTN, ISLR, FNDC1, C1R, TMEM119 |
98 |
Dowload full table
mSigDB Hallmark Gene Sets:
| P-value | OR | Lower 95% CI | FDR | FWER | Genes Found | Gene Set Size | |
|---|---|---|---|---|---|---|---|
| HALLMARK_EPITHELIAL_MESENCHYMAL_TRANSITION | 3.54e-44 | 151.48 | 81.77 | 1.77e-42 | 1.77e-42 | 28COL3A1, COL1A2, COL1A1, SFRP4, LUM, MGP, SPARC, THBS2, DCN, POSTN, TIMP1, BGN, VCAN, CTHRC1, LOX, FBLN2, COL5A1, COMP, COL6A3, FBN1, INHBA, FSTL1, COL6A2, IGFBP4, FAP, FN1, CCN2, CDH11 |
200 |
| HALLMARK_ANGIOGENESIS | 2.74e-10 | 93.13 | 30.16 | 6.86e-09 | 1.37e-08 | 6COL3A1, LUM, POSTN, TIMP1, VCAN, FSTL1 |
36 |
| HALLMARK_COAGULATION | 3.92e-08 | 25.49 | 9.50 | 6.53e-07 | 1.96e-06 | 7SPARC, TIMP1, COMP, PRSS23, C1R, FBN1, FN1 |
138 |
| HALLMARK_MYOGENESIS | 4.84e-07 | 17.32 | 6.49 | 6.05e-06 | 2.42e-05 | 7COL3A1, COL1A1, SPARC, AEBP1, IGFBP7, COL6A3, COL6A2 |
200 |
| HALLMARK_APOPTOSIS | 4.23e-05 | 14.62 | 4.47 | 4.23e-04 | 2.11e-03 | 5LUM, DCN, TIMP1, BGN, F2R |
161 |
| HALLMARK_HYPOXIA | 1.17e-04 | 11.70 | 3.59 | 9.74e-04 | 5.85e-03 | 5DCN, BGN, LOX, COL5A1, CCN2 |
200 |
| HALLMARK_UV_RESPONSE_DN | 4.01e-04 | 12.75 | 3.29 | 2.87e-03 | 2.01e-02 | 4COL3A1, COL1A2, COL1A1, IGFBP5 |
144 |
| HALLMARK_APICAL_JUNCTION | 1.23e-02 | 6.65 | 1.31 | 5.61e-02 | 6.17e-01 | 3VCAN, FBN1, CDH11 |
200 |
| HALLMARK_COMPLEMENT | 1.23e-02 | 6.65 | 1.31 | 5.61e-02 | 6.17e-01 | 3TIMP1, C1R, FN1 |
200 |
| HALLMARK_GLYCOLYSIS | 1.23e-02 | 6.65 | 1.31 | 5.61e-02 | 6.17e-01 | 3DCN, VCAN, COL5A1 |
200 |
| HALLMARK_ALLOGRAFT_REJECTION | 1.23e-02 | 6.65 | 1.31 | 5.61e-02 | 6.17e-01 | 3TIMP1, INHBA, F2R |
200 |
| HALLMARK_ESTROGEN_RESPONSE_EARLY | 8.36e-02 | 4.32 | 0.51 | 2.79e-01 | 1.00e+00 | 2PRSS23, IGFBP4 |
200 |
| HALLMARK_ESTROGEN_RESPONSE_LATE | 8.36e-02 | 4.32 | 0.51 | 2.79e-01 | 1.00e+00 | 2PRSS23, IGFBP4 |
200 |
| HALLMARK_INFLAMMATORY_RESPONSE | 8.36e-02 | 4.32 | 0.51 | 2.79e-01 | 1.00e+00 | 2TIMP1, INHBA |
200 |
| HALLMARK_KRAS_SIGNALING_UP | 8.36e-02 | 4.32 | 0.51 | 2.79e-01 | 1.00e+00 | 2ITGBL1, INHBA |
200 |
| HALLMARK_TGF_BETA_SIGNALING | 1.23e-01 | 7.91 | 0.19 | 3.84e-01 | 1.00e+00 | 1LTBP2 |
54 |
| HALLMARK_CHOLESTEROL_HOMEOSTASIS | 1.64e-01 | 5.74 | 0.14 | 4.84e-01 | 1.00e+00 | 1S100A11 |
74 |
| HALLMARK_IL2_STAT5_SIGNALING | 3.82e-01 | 2.12 | 0.05 | 8.34e-01 | 1.00e+00 | 1COL6A1 |
199 |
| HALLMARK_TNFA_SIGNALING_VIA_NFKB | 3.84e-01 | 2.11 | 0.05 | 8.34e-01 | 1.00e+00 | 1INHBA |
200 |
| HALLMARK_INTERFERON_GAMMA_RESPONSE | 3.84e-01 | 2.11 | 0.05 | 8.34e-01 | 1.00e+00 | 1C1R |
200 |
Dowload full table
KEGG Pathways:
| P-value | OR | Lower 95% CI | FDR | FWER | Genes Found | Gene Set Size | |
|---|---|---|---|---|---|---|---|
| KEGG_ECM_RECEPTOR_INTERACTION | 6.36e-15 | 69.25 | 29.74 | 1.18e-12 | 1.18e-12 | 10COL3A1, COL1A2, COL1A1, THBS2, COL5A1, COMP, COL6A3, COL6A2, COL6A1, FN1 |
84 |
| KEGG_FOCAL_ADHESION | 3.80e-11 | 27.14 | 11.93 | 3.53e-09 | 7.07e-09 | 10COL3A1, COL1A2, COL1A1, THBS2, COL5A1, COMP, COL6A3, COL6A2, COL6A1, FN1 |
199 |
| KEGG_TGF_BETA_SIGNALING_PATHWAY | 5.56e-05 | 21.76 | 5.56 | 3.44e-03 | 1.03e-02 | 4THBS2, DCN, COMP, INHBA |
86 |
| KEGG_COMPLEMENT_AND_COAGULATION_CASCADES | 1.22e-02 | 12.76 | 1.47 | 5.65e-01 | 1.00e+00 | 2C1R, F2R |
69 |
| KEGG_WNT_SIGNALING_PATHWAY | 5.14e-02 | 5.74 | 0.67 | 1.00e+00 | 1.00e+00 | 2SFRP4, SFRP2 |
151 |
| KEGG_REGULATION_OF_ACTIN_CYTOSKELETON | 9.29e-02 | 4.06 | 0.47 | 1.00e+00 | 1.00e+00 | 2F2R, FN1 |
213 |
| KEGG_DRUG_METABOLISM_CYTOCHROME_P450 | 1.60e-01 | 5.90 | 0.14 | 1.00e+00 | 1.00e+00 | 1FMO2 |
72 |
| KEGG_SMALL_CELL_LUNG_CANCER | 1.84e-01 | 5.05 | 0.12 | 1.00e+00 | 1.00e+00 | 1FN1 |
84 |
| KEGG_CELL_ADHESION_MOLECULES_CAMS | 2.76e-01 | 3.17 | 0.08 | 1.00e+00 | 1.00e+00 | 1VCAN |
133 |
| KEGG_SYSTEMIC_LUPUS_ERYTHEMATOSUS | 2.86e-01 | 3.04 | 0.07 | 1.00e+00 | 1.00e+00 | 1C1R |
139 |
| KEGG_CALCIUM_SIGNALING_PATHWAY | 3.50e-01 | 2.37 | 0.06 | 1.00e+00 | 1.00e+00 | 1F2R |
178 |
| KEGG_ENDOCYTOSIS | 3.55e-01 | 2.33 | 0.06 | 1.00e+00 | 1.00e+00 | 1F2R |
181 |
| KEGG_CYTOKINE_CYTOKINE_RECEPTOR_INTERACTION | 4.73e-01 | 1.59 | 0.04 | 1.00e+00 | 1.00e+00 | 1INHBA |
265 |
| KEGG_NEUROACTIVE_LIGAND_RECEPTOR_INTERACTION | 4.82e-01 | 1.55 | 0.04 | 1.00e+00 | 1.00e+00 | 1F2R |
272 |
| KEGG_PATHWAYS_IN_CANCER | 5.43e-01 | 1.29 | 0.03 | 1.00e+00 | 1.00e+00 | 1FN1 |
325 |
| KEGG_N_GLYCAN_BIOSYNTHESIS | 1.00e+00 | 0.00 | 0.00 | 1.00e+00 | 1.00e+00 | 0 |
46 |
| KEGG_OTHER_GLYCAN_DEGRADATION | 1.00e+00 | 0.00 | 0.00 | 1.00e+00 | 1.00e+00 | 0 |
16 |
| KEGG_O_GLYCAN_BIOSYNTHESIS | 1.00e+00 | 0.00 | 0.00 | 1.00e+00 | 1.00e+00 | 0 |
30 |
| KEGG_GLYCOSAMINOGLYCAN_DEGRADATION | 1.00e+00 | 0.00 | 0.00 | 1.00e+00 | 1.00e+00 | 0 |
21 |
| KEGG_GLYCOSAMINOGLYCAN_BIOSYNTHESIS_KERATAN_SULFATE | 1.00e+00 | 0.00 | 0.00 | 1.00e+00 | 1.00e+00 | 0 |
15 |
Dowload full table
CHR Positional Gene Sets:
| P-value | OR | Lower 95% CI | FDR | FWER | Genes Found | Gene Set Size | |
|---|---|---|---|---|---|---|---|
| chr2q35 | 3.72e-02 | 6.90 | 0.80 | 1.00e+00 | 1.00e+00 | 2IGFBP5, FN1 |
126 |
| chr12q21 | 3.83e-02 | 6.79 | 0.79 | 1.00e+00 | 1.00e+00 | 2LUM, DCN |
128 |
| chr7p14 | 5.88e-02 | 5.31 | 0.62 | 1.00e+00 | 1.00e+00 | 2SFRP4, INHBA |
163 |
| chr3q13 | 7.46e-02 | 4.62 | 0.54 | 1.00e+00 | 1.00e+00 | 2CCDC80, FSTL1 |
187 |
| chr21q22 | 2.06e-01 | 2.44 | 0.29 | 1.00e+00 | 1.00e+00 | 2COL6A2, COL6A1 |
353 |
| chr17q21 | 2.96e-01 | 1.88 | 0.22 | 1.00e+00 | 1.00e+00 | 2COL1A1, IGFBP4 |
457 |
| chr7p13 | 1.14e-01 | 8.55 | 0.21 | 1.00e+00 | 1.00e+00 | 1AEBP1 |
50 |
| chr13q33 | 1.25e-01 | 7.76 | 0.19 | 1.00e+00 | 1.00e+00 | 1ITGBL1 |
55 |
| chr8q13 | 1.58e-01 | 5.99 | 0.15 | 1.00e+00 | 1.00e+00 | 1SULF1 |
71 |
| chr16q21 | 1.64e-01 | 5.74 | 0.14 | 1.00e+00 | 1.00e+00 | 1CDH11 |
74 |
| chr6q27 | 1.66e-01 | 5.66 | 0.14 | 1.00e+00 | 1.00e+00 | 1THBS2 |
75 |
| chr13q13 | 1.72e-01 | 5.44 | 0.13 | 1.00e+00 | 1.00e+00 | 1POSTN |
78 |
| chr4q12 | 1.74e-01 | 5.37 | 0.13 | 1.00e+00 | 1.00e+00 | 1IGFBP7 |
79 |
| chr20p12 | 2.23e-01 | 4.07 | 0.10 | 1.00e+00 | 1.00e+00 | 1LAMP5 |
104 |
| chr6q23 | 2.27e-01 | 3.99 | 0.10 | 1.00e+00 | 1.00e+00 | 1CCN2 |
106 |
| chr12p12 | 2.29e-01 | 3.95 | 0.10 | 1.00e+00 | 1.00e+00 | 1MGP |
107 |
| chr2q32 | 2.30e-01 | 3.92 | 0.10 | 1.00e+00 | 1.00e+00 | 1COL3A1 |
108 |
| chr5q33 | 2.32e-01 | 3.88 | 0.10 | 1.00e+00 | 1.00e+00 | 1SPARC |
109 |
| chr5q23 | 2.36e-01 | 3.81 | 0.09 | 1.00e+00 | 1.00e+00 | 1LOX |
111 |
| chr15q24 | 2.45e-01 | 3.64 | 0.09 | 1.00e+00 | 1.00e+00 | 1ISLR |
116 |
Dowload full table
Transcription Factor Targets:
| P-value | OR | Lower 95% CI | FDR | FWER | Genes Found | Gene Set Size | |
|---|---|---|---|---|---|---|---|
| MZF1_01 | 2.29e-05 | 11.97 | 4.13 | 8.64e-03 | 2.59e-02 | 6DCN, IGFBP5, PRELP, SULF1, TMEM119, CCN2 |
240 |
| AAANWWTGC_UNKNOWN | 1.04e-04 | 12.01 | 3.68 | 2.94e-02 | 1.18e-01 | 5THBS2, SFRP2, LOX, INHBA, FN1 |
195 |
| TGGAAA_NFAT_Q4_01 | 7.42e-08 | 6.03 | 3.18 | 8.41e-05 | 8.41e-05 | 18COL1A2, SFRP4, MGP, DCN, IGFBP5, CCDC80, IGFBP7, VCAN, CTHRC1, LOX, LTBP2, PRELP, SULF1, INHBA, FSTL1, FAP, FN1, CCN2 |
1934 |
| TATAAA_TATA_01 | 5.55e-06 | 5.53 | 2.69 | 3.14e-03 | 6.29e-03 | 13COL1A2, COL1A1, MGP, THBS2, POSTN, COL10A1, CTHRC1, LAMP5, SULF1, INHBA, IGFBP4, FN1, CCN2 |
1317 |
| TGGNNNNNNKCCAR_UNKNOWN | 5.65e-04 | 6.51 | 2.26 | 1.07e-01 | 6.40e-01 | 6SFRP2, IGFBP5, CTHRC1, LOX, COL6A3, FAP |
436 |
| AGCYRWTTC_UNKNOWN | 3.12e-03 | 11.11 | 2.18 | 4.32e-01 | 1.00e+00 | 3LAMP5, FSTL1, FAP |
121 |
| AP3_Q6 | 3.07e-03 | 7.23 | 1.88 | 4.32e-01 | 1.00e+00 | 4SPARC, SULF1, FSTL1, FN1 |
251 |
| AACTTT_UNKNOWN | 2.22e-04 | 3.77 | 1.84 | 5.04e-02 | 2.52e-01 | 13COL3A1, COL1A2, LUM, SPARC, DCN, POSTN, CCDC80, VCAN, LOX, ITGBL1, LAMP5, INHBA, CDH11 |
1928 |
| POU3F2_02 | 3.71e-03 | 6.84 | 1.78 | 4.32e-01 | 1.00e+00 | 4SFRP2, DCN, CCDC80, LOX |
265 |
| CEBPB_01 | 3.81e-03 | 6.79 | 1.76 | 4.32e-01 | 1.00e+00 | 4DCN, IGFBP5, SULF1, FAP |
267 |
| MSX1_01 | 8.63e-03 | 7.62 | 1.50 | 5.86e-01 | 1.00e+00 | 3POSTN, COL6A3, INHBA |
175 |
| PIAS4_TARGET_GENES | 1.53e-02 | 11.25 | 1.30 | 5.86e-01 | 1.00e+00 | 2VCAN, COL6A1 |
78 |
| CTTTGA_LEF1_Q2 | 6.99e-03 | 3.16 | 1.28 | 5.86e-01 | 1.00e+00 | 8SFRP2, DCN, BGN, CTHRC1, COL5A1, LAMP5, SULF1, INHBA |
1247 |
| CEBP_C | 1.35e-02 | 6.42 | 1.27 | 5.86e-01 | 1.00e+00 | 3DCN, FSTL1, CCN2 |
207 |
| FOX_Q2 | 1.46e-02 | 6.24 | 1.23 | 5.86e-01 | 1.00e+00 | 3CTHRC1, ITGBL1, FSTL1 |
213 |
| GGGTGGRR_PAX4_03 | 9.14e-03 | 3.01 | 1.22 | 5.86e-01 | 1.00e+00 | 8COL1A1, SPARC, DCN, IGFBP5, VCAN, COL6A3, PRELP, TMEM119 |
1310 |
| WGGAATGY_TEF1_Q6 | 1.35e-02 | 4.66 | 1.21 | 5.86e-01 | 1.00e+00 | 4SPARC, INHBA, FSTL1, CCN2 |
387 |
| TAATTA_CHX10_01 | 1.19e-02 | 3.43 | 1.19 | 5.86e-01 | 1.00e+00 | 6COL1A1, DCN, COL10A1, ITGBL1, SULF1, FAP |
823 |
| TGTYNNNNNRGCARM_UNKNOWN | 1.92e-02 | 9.95 | 1.15 | 5.86e-01 | 1.00e+00 | 2MGP, SPARC |
88 |
| RYTTCCTG_ETS2_B | 1.33e-02 | 3.03 | 1.15 | 5.86e-01 | 1.00e+00 | 7SPARC, THBS2, TIMP1, CCDC80, COL6A3, FSTL1, IGFBP4 |
1112 |
Dowload full table
GO Biological Processes:
| P-value | OR | Lower 95% CI | FDR | FWER | Genes Found | Gene Set Size | |
|---|---|---|---|---|---|---|---|
| GOBP_COLLAGEN_FIBRIL_ORGANIZATION | 5.90e-17 | 116.32 | 48.81 | 1.47e-13 | 4.41e-13 | 10COL3A1, COL1A2, COL1A1, LUM, SFRP2, AEBP1, LOX, COL5A1, COMP, COL14A1 |
54 |
| GOBP_EXTERNAL_ENCAPSULATING_STRUCTURE_ORGANIZATION | 8.39e-34 | 65.32 | 35.72 | 6.28e-30 | 6.28e-30 | 27COL3A1, COL1A2, COL1A1, LUM, SPARC, SFRP2, DCN, POSTN, TIMP1, BGN, CCDC80, AEBP1, COL10A1, VCAN, LOX, FBLN2, COL5A1, COMP, COL6A3, FBN1, SULF1, COL6A2, COL6A1, FAP, FN1, COL14A1, CCN2 |
396 |
| GOBP_DERMATAN_SULFATE_METABOLIC_PROCESS | 3.78e-06 | 130.51 | 22.38 | 6.56e-04 | 2.83e-02 | 3DCN, BGN, VCAN |
13 |
| GOBP_CHONDROITIN_SULFATE_CATABOLIC_PROCESS | 4.81e-06 | 118.70 | 20.61 | 7.87e-04 | 3.60e-02 | 3DCN, BGN, VCAN |
14 |
| GOBP_PEPTIDE_CROSS_LINKING_VIA_CHONDROITIN_4_SULFATE_GLYCOSAMINOGLYCAN | 8.61e-05 | 211.61 | 18.81 | 8.59e-03 | 6.44e-01 | 2DCN, BGN |
6 |
| GOBP_NEGATIVE_REGULATION_OF_NON_CANONICAL_WNT_SIGNALING_PATHWAY | 8.61e-05 | 211.61 | 18.81 | 8.59e-03 | 6.44e-01 | 2SFRP4, SFRP2 |
6 |
| GOBP_DERMATAN_SULFATE_PROTEOGLYCAN_METABOLIC_PROCESS | 7.37e-06 | 100.75 | 17.79 | 1.03e-03 | 5.51e-02 | 3DCN, BGN, VCAN |
16 |
| GOBP_TENDON_DEVELOPMENT | 1.20e-04 | 169.99 | 15.84 | 1.11e-02 | 9.01e-01 | 2COL5A1, COMP |
7 |
| GOBP_REGULATION_OF_BONE_DEVELOPMENT | 1.20e-04 | 169.99 | 15.84 | 1.11e-02 | 9.01e-01 | 2LOX, TMEM119 |
7 |
| GOBP_SKELETAL_SYSTEM_DEVELOPMENT | 8.40e-19 | 27.02 | 14.31 | 3.14e-15 | 6.29e-15 | 19COL3A1, COL1A2, COL1A1, SFRP4, LUM, MGP, SFRP2, TIMP1, BGN, COL10A1, VCAN, LOX, COMP, PRELP, FBN1, SULF1, TMEM119, CCN2, CDH11 |
485 |
| GOBP_PEPTIDE_CROSS_LINKING | 1.51e-06 | 57.50 | 14.18 | 3.54e-04 | 1.13e-02 | 4COL3A1, DCN, BGN, FN1 |
35 |
| GOBP_WOUND_HEALING_INVOLVED_IN_INFLAMMATORY_RESPONSE | 1.60e-04 | 141.92 | 13.68 | 1.38e-02 | 1.00e+00 | 2TIMP1, F2R |
8 |
| GOBP_SULFUR_COMPOUND_CATABOLIC_PROCESS | 2.36e-07 | 44.66 | 13.30 | 6.78e-05 | 1.77e-03 | 5LUM, DCN, BGN, VCAN, PRELP |
56 |
| GOBP_CONNECTIVE_TISSUE_DEVELOPMENT | 1.04e-11 | 25.05 | 11.43 | 1.11e-08 | 7.78e-08 | 11COL1A1, LUM, MGP, SFRP2, TIMP1, BGN, LOX, COL5A1, COMP, SULF1, CCN2 |
242 |
| GOBP_ENDODERMAL_CELL_DIFFERENTIATION | 3.86e-06 | 44.56 | 11.13 | 6.56e-04 | 2.89e-02 | 4COL5A1, INHBA, COL6A1, FN1 |
44 |
| GOBP_CHONDROITIN_SULFATE_BIOSYNTHETIC_PROCESS | 2.98e-05 | 59.46 | 11.02 | 3.53e-03 | 2.23e-01 | 3DCN, BGN, VCAN |
25 |
| GOBP_AMINOGLYCAN_CATABOLIC_PROCESS | 6.29e-07 | 36.16 | 10.85 | 1.68e-04 | 4.71e-03 | 5LUM, DCN, BGN, VCAN, PRELP |
68 |
| GOBP_CARTILAGE_DEVELOPMENT | 5.06e-10 | 25.74 | 10.83 | 2.70e-07 | 3.79e-06 | 9COL1A1, LUM, MGP, SFRP2, TIMP1, BGN, COMP, SULF1, CCN2 |
184 |
| GOBP_BONE_DEVELOPMENT | 7.36e-10 | 24.62 | 10.37 | 3.67e-07 | 5.50e-06 | 9COL1A1, SFRP4, SFRP2, BGN, LOX, COMP, FBN1, SULF1, TMEM119 |
192 |
| GOBP_OSSIFICATION | 3.24e-13 | 20.75 | 10.25 | 4.85e-10 | 2.42e-09 | 14COL1A2, COL1A1, MGP, SPARC, SFRP2, IGFBP5, VCAN, CTHRC1, LOX, COMP, TMEM119, COL6A1, CCN2, CDH11 |
399 |
Dowload full table
Immunological Gene Sets:
| P-value | OR | Lower 95% CI | FDR | FWER | Genes Found | Gene Set Size | |
|---|---|---|---|---|---|---|---|
| GSE37605_FOXP3_FUSION_GFP_VS_IRES_GFP_TREG_C57BL6_DN | 9.01e-09 | 23.27 | 9.29 | 2.36e-05 | 4.39e-05 | 8MGP, SPARC, CCDC80, LOX, TMEM119, F2R, LRRC32, FMO2 |
176 |
| GSE2405_0H_VS_1.5H_A_PHAGOCYTOPHILUM_STIM_NEUTROPHIL_UP | 2.42e-08 | 20.36 | 8.15 | 2.36e-05 | 1.18e-04 | 8COL3A1, COL1A2, SFRP4, MGP, CCDC80, C1R, PRELP, S100A11 |
200 |
| GSE4748_CTRL_VS_LPS_STIM_DC_3H_UP | 2.42e-08 | 20.36 | 8.15 | 2.36e-05 | 1.18e-04 | 8COL3A1, POSTN, PRSS23, FBN1, INHBA, FSTL1, CCN2, CDH11 |
200 |
| GSE28737_BCL6_HET_VS_BCL6_KO_FOLLICULAR_BCELL_DN | 2.42e-08 | 20.36 | 8.15 | 2.36e-05 | 1.18e-04 | 8COL1A2, COL1A1, SPARC, BGN, LOX, FBLN2, COL6A3, FSTL1 |
200 |
| GSE43955_1H_VS_10H_ACT_CD4_TCELL_WITH_TGFB_IL6_DN | 2.42e-08 | 20.36 | 8.15 | 2.36e-05 | 1.18e-04 | 8COL1A2, DCN, BGN, FBLN2, LTBP2, FN1, CCN2, S100A11 |
200 |
| GSE26488_WT_VS_HDAC7_DELTAP_TG_OT2_THYMOCYTE_WITH_PEPTIDE_INJECTION_DN | 4.68e-07 | 17.41 | 6.52 | 2.36e-04 | 2.28e-03 | 7POSTN, BGN, FBLN2, PRSS23, FSTL1, COL6A2, CCN2 |
199 |
| GSE2405_0H_VS_3H_A_PHAGOCYTOPHILUM_STIM_NEUTROPHIL_UP | 4.84e-07 | 17.32 | 6.49 | 2.36e-04 | 2.36e-03 | 7COL1A2, TIMP1, BGN, IGFBP7, LTBP2, COL6A3, S100A11 |
200 |
| GSE8835_HEALTHY_VS_CLL_CD8_TCELL_DN | 4.84e-07 | 17.32 | 6.49 | 2.36e-04 | 2.36e-03 | 7COL3A1, COL1A2, COL1A1, LUM, DCN, COL5A1, TMEM119 |
200 |
| GSE2585_CTEC_VS_THYMIC_MACROPHAGE_UP | 4.84e-07 | 17.32 | 6.49 | 2.36e-04 | 2.36e-03 | 7COL1A1, DCN, IGFBP7, PRSS23, FSTL1, TMEM119, COL14A1 |
200 |
| GSE43955_10H_VS_60H_ACT_CD4_TCELL_WITH_TGFB_IL6_DN | 4.84e-07 | 17.32 | 6.49 | 2.36e-04 | 2.36e-03 | 7COL1A2, COL1A1, MGP, THBS2, AEBP1, INHBA, S100A11 |
200 |
| GSE22025_TGFB1_VS_TGFB1_AND_PROGESTERONE_TREATED_CD4_TCELL_UP | 7.77e-06 | 14.58 | 5.02 | 2.50e-03 | 3.78e-02 | 6THBS2, VCAN, COL6A3, COL6A1, IGFBP4, FN1 |
198 |
| GSE8921_UNSTIM_0H_VS_TLR1_2_STIM_MONOCYTE_24H_UP | 7.99e-06 | 14.51 | 4.99 | 2.50e-03 | 3.89e-02 | 6COL1A1, SPARC, THBS2, CTHRC1, FSTL1, COL14A1 |
199 |
| GSE3039_CD4_TCELL_VS_B2_BCELL_UP | 8.22e-06 | 14.43 | 4.97 | 2.50e-03 | 4.01e-02 | 6BGN, FSTL1, IGFBP4, FN1, S100A11, CDH11 |
200 |
| GSE19888_ADENOSINE_A3R_ACT_VS_TCELL_MEMBRANES_ACT_IN_MAST_CELL_UP | 8.22e-06 | 14.43 | 4.97 | 2.50e-03 | 4.01e-02 | 6COL3A1, LUM, DCN, TIMP1, C1R, COL6A1 |
200 |
| GSE37301_RAG2_KO_VS_RAG2_AND_ETS1_KO_NK_CELL_UP | 8.22e-06 | 14.43 | 4.97 | 2.50e-03 | 4.01e-02 | 6COL1A1, CCDC80, FBN1, COL6A2, COL6A1, COL14A1 |
200 |
| GSE43955_1H_VS_20H_ACT_CD4_TCELL_WITH_TGFB_IL6_DN | 8.22e-06 | 14.43 | 4.97 | 2.50e-03 | 4.01e-02 | 6COL1A2, MGP, DCN, AEBP1, COL10A1, FBN1 |
200 |
| GSE24671_CTRL_VS_BAKIMULC_INFECTED_MOUSE_SPLENOCYTES_DN | 5.46e-05 | 13.83 | 4.23 | 1.57e-02 | 2.66e-01 | 5COL1A1, DCN, IGFBP5, FBLN2, FSTL1 |
170 |
| GSE22025_TGFB1_VS_TGFB1_AND_PROGESTERONE_TREATED_CD4_TCELL_DN | 1.14e-04 | 11.76 | 3.60 | 2.48e-02 | 5.57e-01 | 5SPARC, THBS2, COL6A3, COL6A1, IGFBP4 |
199 |
| GSE17721_0.5H_VS_24H_CPG_BMDC_DN | 1.17e-04 | 11.70 | 3.59 | 2.48e-02 | 5.70e-01 | 5LOX, COL5A1, FSTL1, TMEM119, IGFBP4 |
200 |
| GSE2405_0H_VS_24H_A_PHAGOCYTOPHILUM_STIM_NEUTROPHIL_DN | 1.17e-04 | 11.70 | 3.59 | 2.48e-02 | 5.70e-01 | 5SPARC, AEBP1, LTBP2, SULF1, COL6A1 |
200 |
Top Ranked Transcription Factors for this Gene Expression Program:
| Gene Symbol | Gene Loading Rank | DNA Binding Domain | Motif Status | IUPAC PWM | GTEx | DepMap | Decartes |
|---|---|---|---|---|---|---|---|
| SFRP4 | 4 | No | Unlikely to be sequence specific TF | Not a DNA binding protein | No motif | None | None |
| AEBP1 | 16 | Yes | Likely to be sequence specific TF | Monomer or homomultimer | No motif | None | This is a protease, but its ability to bind DNA is supported by both gel-shift (PMID: 15654748) and ChIP (PMID: 22723309). |
| FBN1 | 34 | No | Unlikely to be sequence specific TF | Not a DNA binding protein | No motif | None | None |
| GAS6 | 52 | No | Unlikely to be sequence specific TF | Not a DNA binding protein | No motif | None | None |
| ID3 | 62 | No | Unlikely to be sequence specific TF | Not a DNA binding protein | No motif | None | ID bHLH proteins lack the basic region and should not be able to bind DNA. The HT-SELEX motif for ID4 is likely by a co-precipitated protein or it is a contamination |
| NR2F2 | 64 | Yes | Known motif | Monomer or homomultimer | 100 perc ID - in vitro | None | None |
| PTGIS | 76 | No | Unlikely to be sequence specific TF | Not a DNA binding protein | No motif | None | It is a cytochrome p450 enzyme |
| PRRX1 | 92 | Yes | Known motif | Monomer or homomultimer | High-throughput in vitro | None | None |
| CYP1B1 | 108 | No | Unlikely to be sequence specific TF | Not a DNA binding protein | No motif | None | None |
| FZD4 | 111 | No | Unlikely to be sequence specific TF | Not a DNA binding protein | No motif | None | None |
| SIX1 | 118 | Yes | Known motif | Monomer or homomultimer | High-throughput in vitro | None | None |
| TNFSF18 | 123 | No | Unlikely to be sequence specific TF | Not a DNA binding protein | No motif | None | Protein is a cytokine |
| MN1 | 124 | No | Unlikely to be sequence specific TF | Not a DNA binding protein | No motif | None | Evidence for DNA binding not strong in (PMID: 12569362) |
| FHL2 | 147 | No | Unlikely to be sequence specific TF | Not a DNA binding protein | No motif | None | LIM ZF proteins are unlikely to bind DNA. Experimental evidence does not support a role for FHL2 as a sequence-specific DNA-binding protein (PMID:10654935) |
| ID4 | 155 | No | Unlikely to be sequence specific TF | Not a DNA binding protein | No motif | None | ID bHLH proteins lack the basic region and should not be able to bind DNA. The HT-SELEX motif for ID4 is likely by a co-precipitated protein or it is a contamination |
| NR2F1 | 160 | Yes | Known motif | Monomer or homomultimer | High-throughput in vitro | None | None |
| CREB3L1 | 162 | Yes | Known motif | Monomer or homomultimer | High-throughput in vitro | None | None |
| FLNA | 169 | No | Unlikely to be sequence specific TF | Not a DNA binding protein | No motif | None | Go annotation is based on (PMID: 15684392), which shows that it binds FOXC1 and PBX1 but doesnt show evidence for binding to DNA |
| HIC1 | 172 | Yes | Known motif | Monomer or homomultimer | High-throughput in vitro | None | None |
| FZD1 | 175 | No | Unlikely to be sequence specific TF | Not a DNA binding protein | No motif | None | None |
Druggable Genes for this Gene Expression Program:
| Gene Symbol | Gene Loading Rank | Drug Names | Drug Category | GTEx | DepMap |
|---|---|---|---|---|---|
| F2R | 40 | 1VORAPAXAR |
Small molecule | GTEx | DepMap |
| ITGB1 | 66 | 1VOLOCIXIMAB |
Antibody | GTEx | DepMap |
| PDGFRA | 69 | 4REGORAFENIB, PAZOPANIB, NINTEDANIB, SUNITINIB |
Small molecule | GTEx | DepMap |
| ANO1 | 97 | 1CROFELEMER |
Small molecule | GTEx | DepMap |
| EDNRA | 131 | 3MACITENTAN, BOSENTAN, AMBRISENTAN |
Small molecule | GTEx | DepMap |
| FZD7 | 145 | 1VANTICTUMAB |
Antibody | GTEx | DepMap |
| PDE1A | 146 | 2PENTOXIFYLLINE, DIPYRIDAMOLE |
Small molecule | GTEx | DepMap |
| FZD1 | 175 | 1VANTICTUMAB |
Antibody | GTEx | DepMap |
| FZD8 | 177 | 1VANTICTUMAB |
Antibody | GTEx | DepMap |
| EPHA3 | 210 | 1VANDETANIB |
Small molecule | GTEx | DepMap |
| PDGFRB | 294 | 7SORAFENIB, IMATINIB, REGORAFENIB, PAZOPANIB, NINTEDANIB, SUNITINIB, DASATINIB |
Small molecule | GTEx | DepMap |
| HTR2B | 303 | 2METHYLERGONOVINE, METHYSERGIDE |
Small molecule | GTEx | DepMap |
| RARG | 340 | 7TAZAROTENE, ALITRETINOIN, TRETINOIN, ISOTRETINOIN, ETRETINATE, ADAPALENE, ACITRETIN |
Small molecule | GTEx | DepMap |
| DHFR | 373 | 3PEMETREXED DISODIUM, PRALATREXATE, METHOTREXATE |
Small molecule | GTEx | DepMap |
| ACVRL1 | 439 | 1Panulisib |
Small molecule | GTEx | DepMap |
| ACVRL1 | 439 | 1PF-03446962 |
Antibody | GTEx | DepMap |
| PGR | 440 | 19ETHYNODIOL DIACETATE, MIFEPRISTONE, NORGESTREL, HYDROXYPROGESTERONE CAPROATE, DYDROGESTERONE, NORGESTIMATE, NORELGESTROMIN, MEGESTROL ACETATE, NORETHINDRONE ACETATE, MEDROXYPROGESTERONE ACETATE, PROGESTERONE, NORETHYNODREL, LEVONORGESTREL, NORETHINDRONE, DROSPIRENONE, ETONOGESTREL, DESOGESTREL, ULIPRISTAL ACETATE, DANAZOL |
Small molecule | GTEx | DepMap |
| SLC29A1 | 484 | 1DIPYRIDAMOLE |
Small molecule | GTEx | DepMap |
| S1PR5 | 535 | 1FINGOLIMOD |
Small molecule | GTEx | DepMap |
| ADH1B | 544 | 1FOMEPIZOLE |
Small molecule | GTEx | DepMap |
| FZD2 | 594 | 1VANTICTUMAB |
Antibody | GTEx | DepMap |
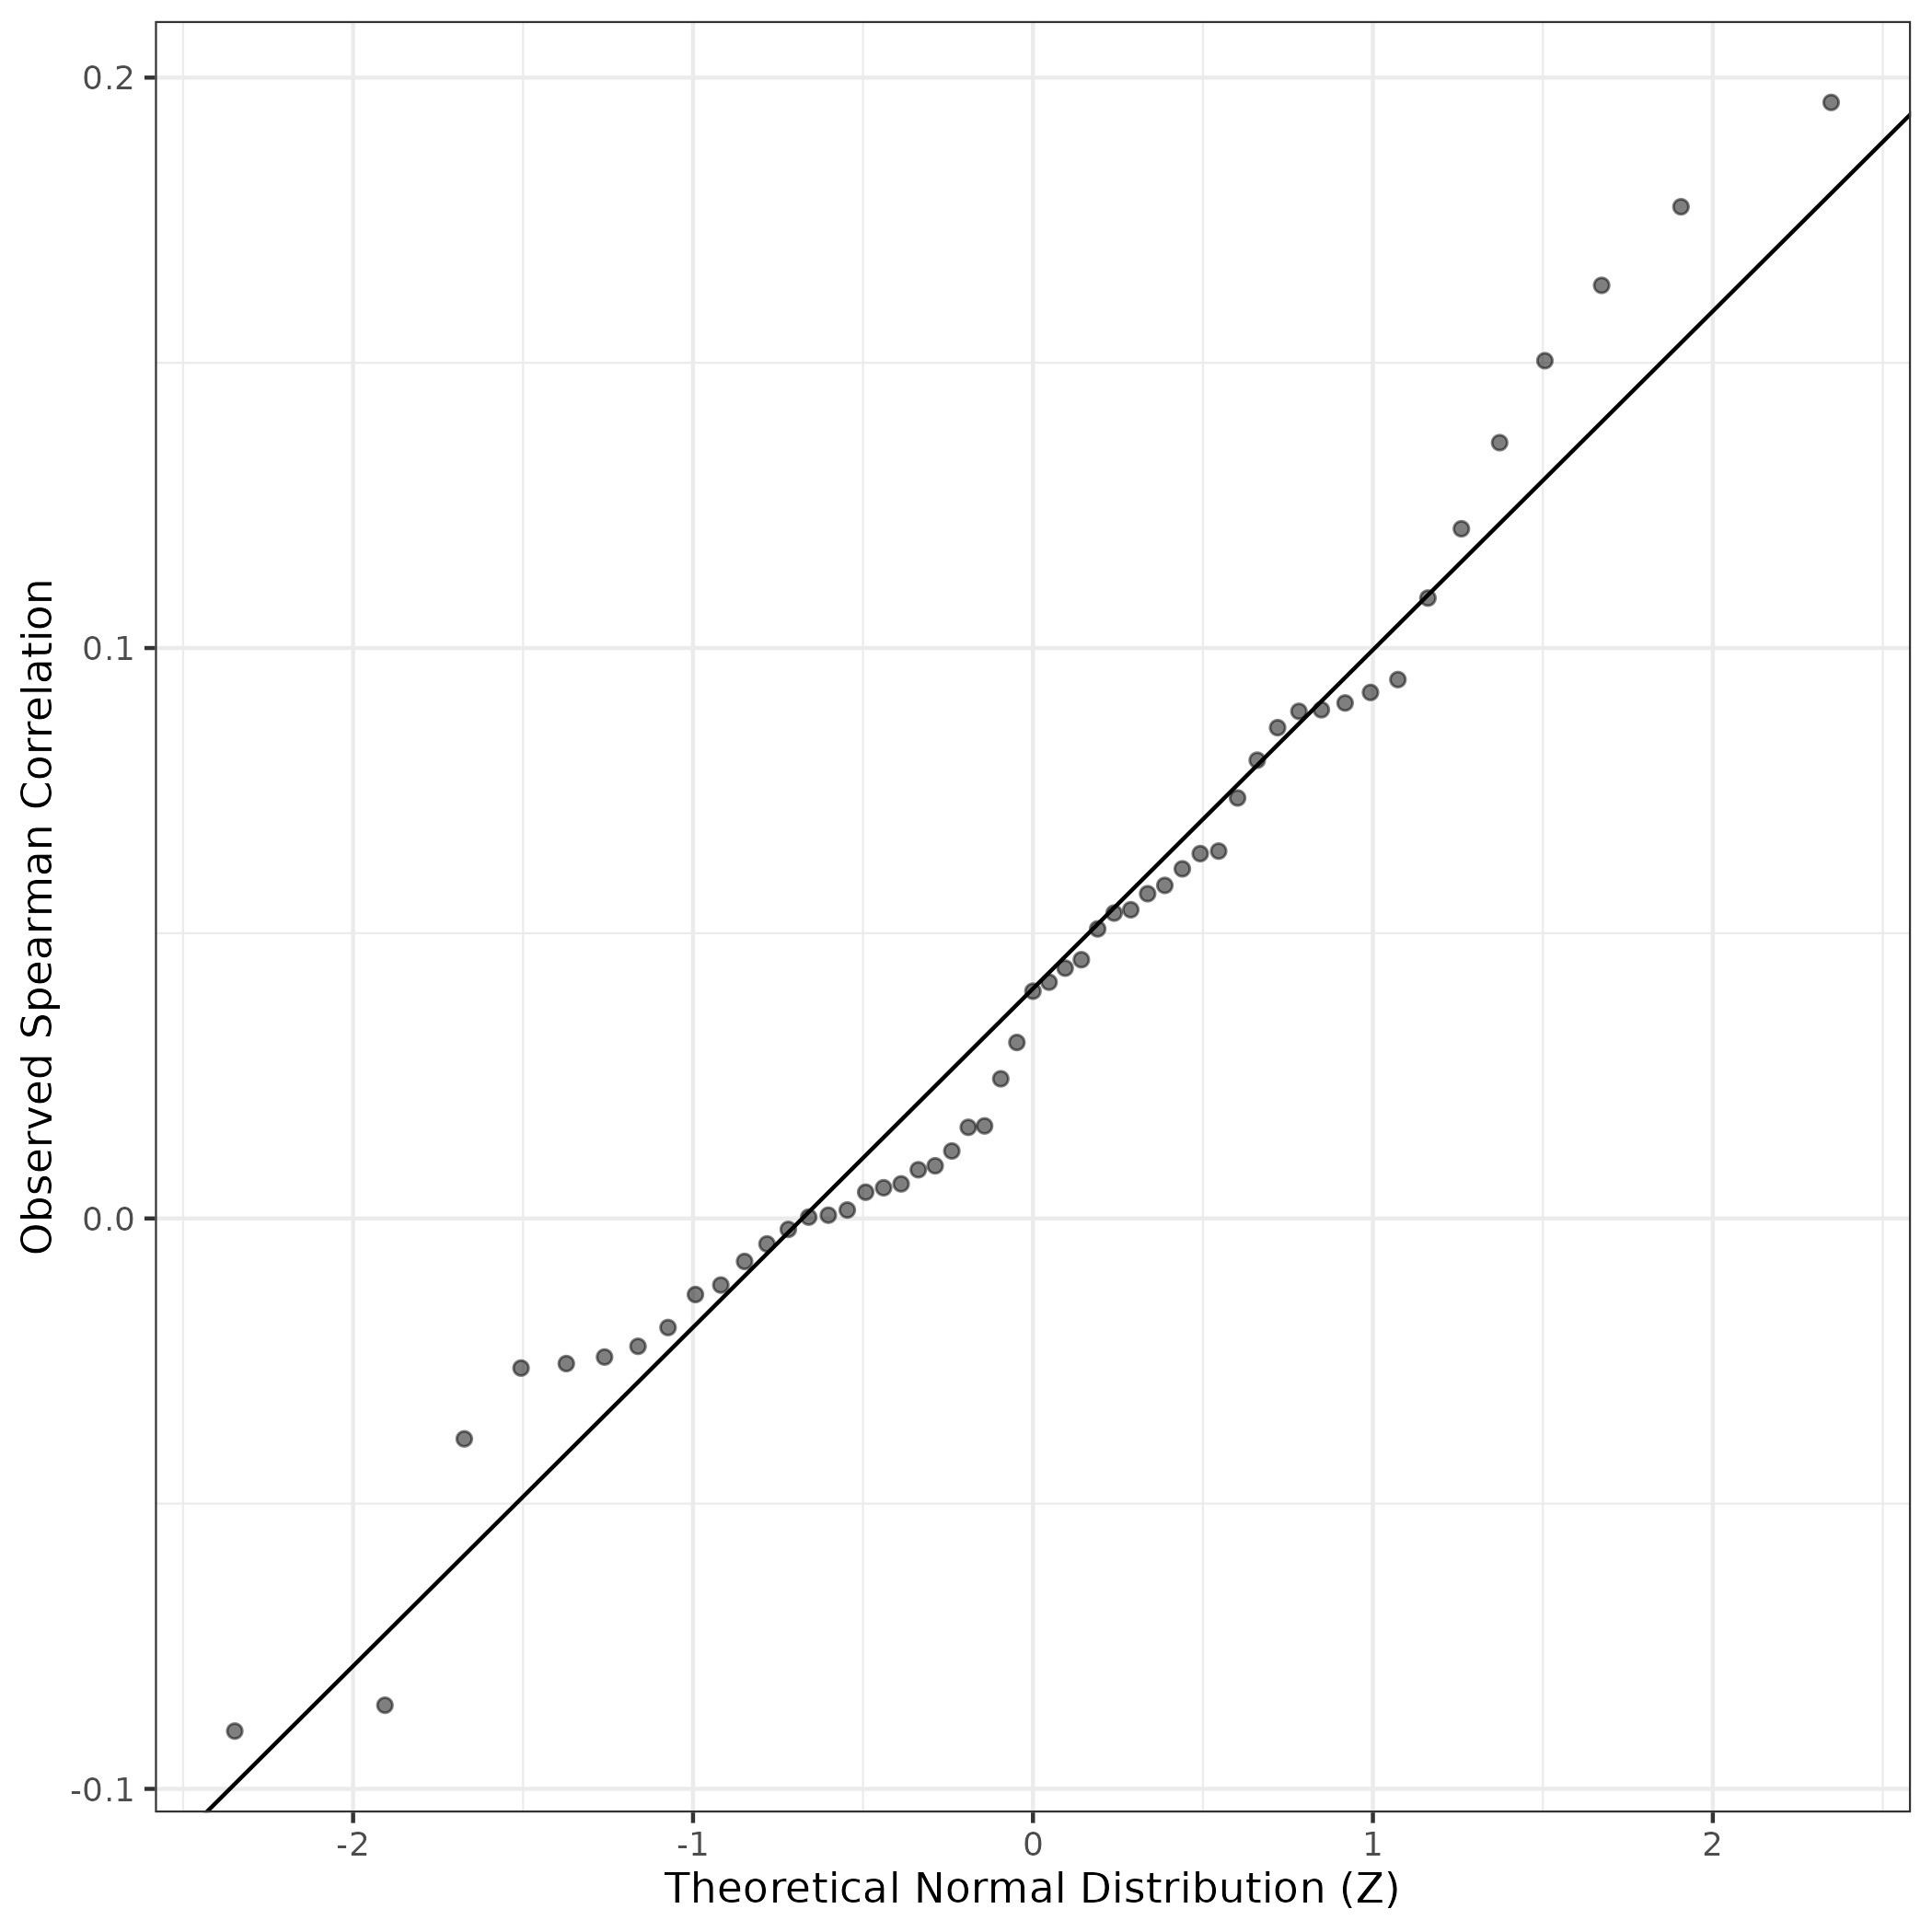
QQ Plot showing correlations with other GEPs in this dataset, calculated by Spearman correlation:
Interactive QQ-plot of gene loadings:
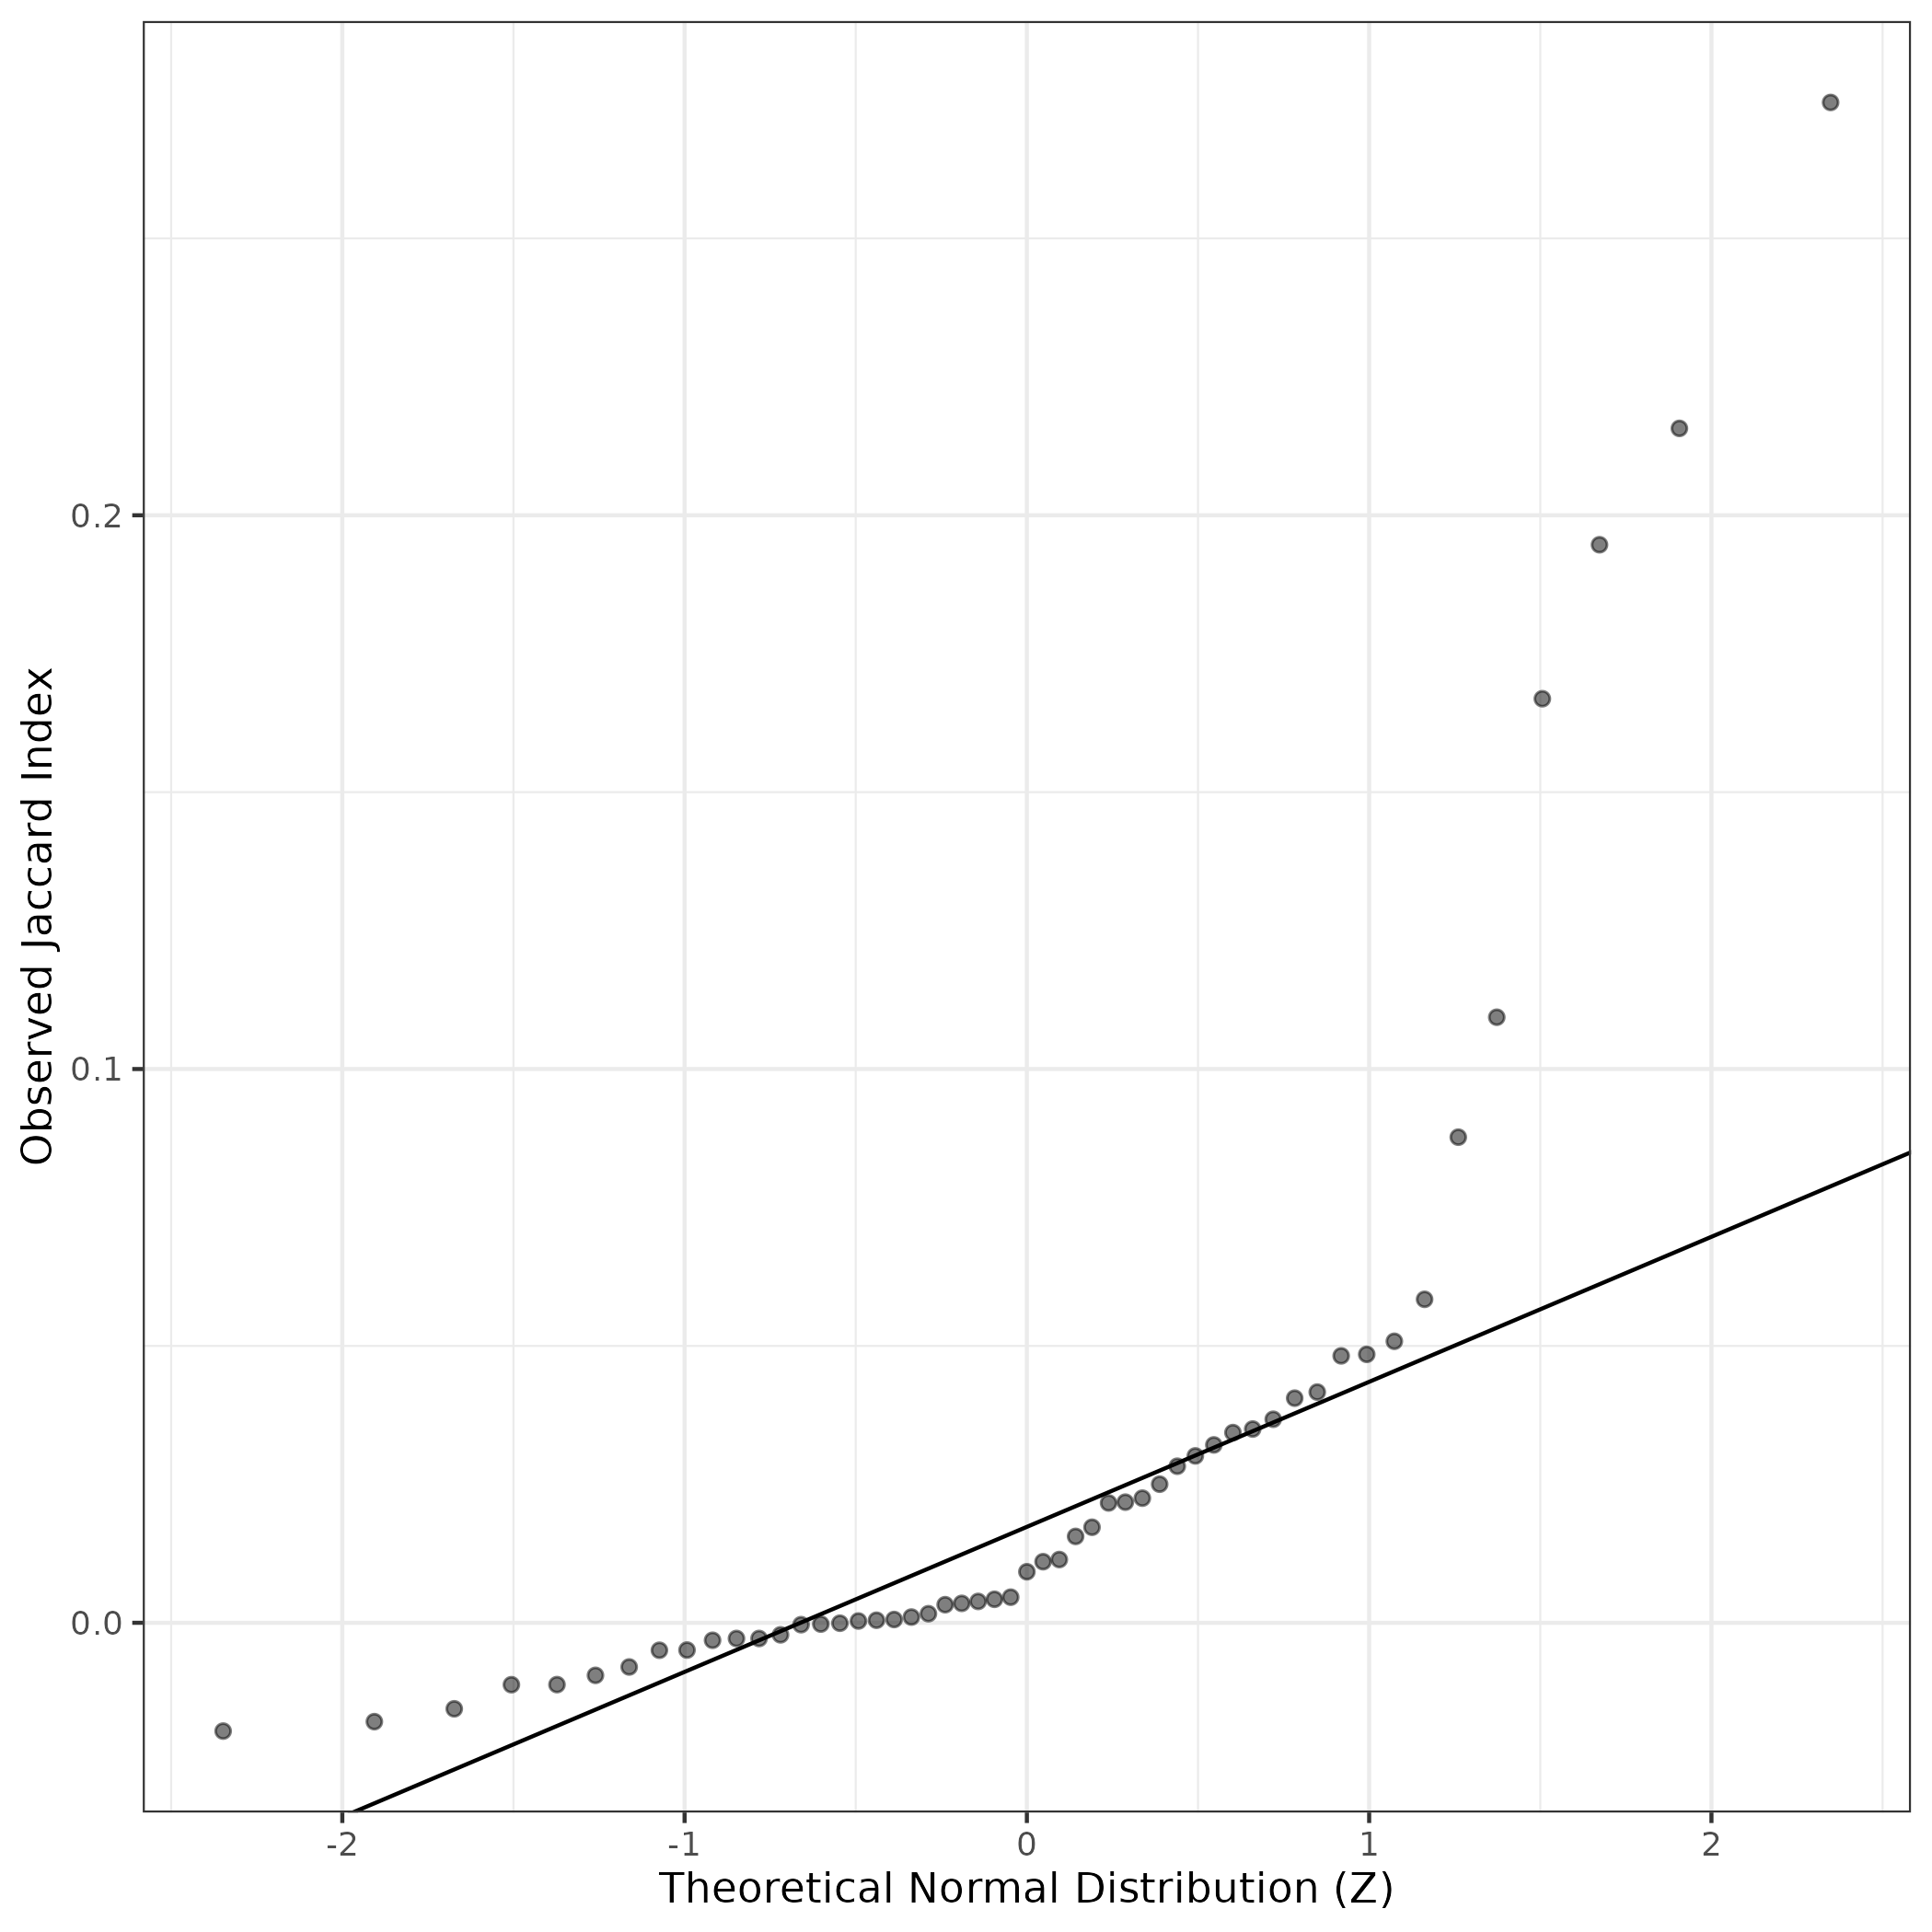
A similar QQ-plot as above, but only for instances where the H value is e.g. > 25, i.e. we are confident that the expression program is active above noise. Agreemenet between these binary vectors is tested using the Jaccard Index, with the P-values calculated by an exact test:
Interactive QQ-plot:
Singler cell type annotations for the top 50 cells on this program.
| Cell ID | Singler label | Singler Delta | Activity Score | Top Singler Raw Scores |
|---|---|---|---|---|
| CTGGACGTCCGCGATG-1_HTA4_1018_4071 | Fibroblasts | 0.34 | 3994.31 | Raw ScoresFibroblasts: 0.43, Osteoblasts: 0.42, Chondrocytes: 0.42, Tissue_stem_cells: 0.41, Smooth_muscle_cells: 0.4, MSC: 0.38, iPS_cells: 0.38, Neurons: 0.32, Endothelial_cells: 0.27, Neuroepithelial_cell: 0.26 |
| GACGTTAGTCAAGCCC-1_HTA4_1018_4070 | Smooth_muscle_cells | 0.34 | 3816.26 | Raw ScoresFibroblasts: 0.51, Osteoblasts: 0.5, Chondrocytes: 0.49, Smooth_muscle_cells: 0.48, Tissue_stem_cells: 0.47, iPS_cells: 0.45, MSC: 0.44, Neurons: 0.37, Endothelial_cells: 0.34, Astrocyte: 0.32 |
| TGAGGGACAAAGCACG-1_HTA4_1018_4071 | Smooth_muscle_cells | 0.35 | 3813.16 | Raw ScoresFibroblasts: 0.53, Chondrocytes: 0.51, Smooth_muscle_cells: 0.51, Osteoblasts: 0.5, Tissue_stem_cells: 0.48, iPS_cells: 0.47, MSC: 0.46, Neurons: 0.4, Endothelial_cells: 0.36, Astrocyte: 0.34 |
| GAATAGAAGAACAGGA-1_HTA4_1018_4070 | Fibroblasts | 0.36 | 2970.42 | Raw ScoresFibroblasts: 0.53, Smooth_muscle_cells: 0.51, Osteoblasts: 0.51, Chondrocytes: 0.51, Tissue_stem_cells: 0.49, iPS_cells: 0.47, MSC: 0.46, Neurons: 0.41, Endothelial_cells: 0.37, Astrocyte: 0.33 |
| GTCTCACTCAAAGGAT-1_HTA4_1012_4045 | Smooth_muscle_cells | 0.32 | 2614.50 | Raw ScoresFibroblasts: 0.55, Osteoblasts: 0.55, Smooth_muscle_cells: 0.54, MSC: 0.52, iPS_cells: 0.51, Tissue_stem_cells: 0.51, Chondrocytes: 0.51, Neurons: 0.44, Endothelial_cells: 0.43, Astrocyte: 0.37 |
| ATTACTCGTACTTCCC-1_HTA4_1018_4071 | Tissue_stem_cells | 0.31 | 2393.31 | Raw ScoresFibroblasts: 0.43, Chondrocytes: 0.42, Smooth_muscle_cells: 0.42, Osteoblasts: 0.41, Tissue_stem_cells: 0.41, iPS_cells: 0.38, MSC: 0.36, Neurons: 0.32, Endothelial_cells: 0.27, Astrocyte: 0.24 |
| GCTCAAATCCTTTGAT-1_HTA4_1018_4071 | Fibroblasts | 0.38 | 2308.16 | Raw ScoresFibroblasts: 0.5, Osteoblasts: 0.47, Smooth_muscle_cells: 0.46, Chondrocytes: 0.46, Tissue_stem_cells: 0.44, iPS_cells: 0.43, MSC: 0.42, Neurons: 0.34, Endothelial_cells: 0.32, Astrocyte: 0.29 |
| TGTTGGATCCCAGGCA-1_HTA4_1018_4070 | Fibroblasts | 0.34 | 2240.68 | Raw ScoresFibroblasts: 0.44, Chondrocytes: 0.42, Smooth_muscle_cells: 0.41, Osteoblasts: 0.41, Tissue_stem_cells: 0.4, iPS_cells: 0.38, MSC: 0.36, Neurons: 0.32, Endothelial_cells: 0.28, Astrocyte: 0.24 |
| TCATCCGGTGGTACAG-1_HTA4_1018_4071 | Tissue_stem_cells | 0.30 | 2049.54 | Raw ScoresFibroblasts: 0.42, Chondrocytes: 0.42, Osteoblasts: 0.41, Tissue_stem_cells: 0.4, Smooth_muscle_cells: 0.39, iPS_cells: 0.37, MSC: 0.37, Neurons: 0.32, Endothelial_cells: 0.28, Neuroepithelial_cell: 0.25 |
| AAGACAACAGGATGAC-1_HTA4_1018_4070 | Smooth_muscle_cells | 0.34 | 1855.21 | Raw ScoresFibroblasts: 0.51, Osteoblasts: 0.49, Chondrocytes: 0.49, Smooth_muscle_cells: 0.49, Tissue_stem_cells: 0.46, iPS_cells: 0.44, MSC: 0.43, Neurons: 0.39, Endothelial_cells: 0.34, Astrocyte: 0.33 |
| TCCTAATCATGGCCAC-1_HTA4_1018_4070 | Chondrocytes | 0.32 | 1848.28 | Raw ScoresFibroblasts: 0.39, Chondrocytes: 0.38, Osteoblasts: 0.38, Smooth_muscle_cells: 0.36, Tissue_stem_cells: 0.36, iPS_cells: 0.34, MSC: 0.33, Neurons: 0.28, Endothelial_cells: 0.24, Neuroepithelial_cell: 0.22 |
| GAGTCATTCCCATGGG-1_HTA4_1018_4070 | Smooth_muscle_cells | 0.34 | 1825.16 | Raw ScoresFibroblasts: 0.52, Osteoblasts: 0.49, Smooth_muscle_cells: 0.49, Chondrocytes: 0.49, Tissue_stem_cells: 0.47, iPS_cells: 0.46, MSC: 0.46, Neurons: 0.38, Endothelial_cells: 0.36, Astrocyte: 0.33 |
| CTTCGGTGTAGCGCTC-1_HTA4_1018_4070 | Fibroblasts | 0.30 | 1812.39 | Raw ScoresFibroblasts: 0.42, Osteoblasts: 0.42, Chondrocytes: 0.41, Tissue_stem_cells: 0.4, Smooth_muscle_cells: 0.4, MSC: 0.38, iPS_cells: 0.38, Neurons: 0.33, Endothelial_cells: 0.29, Astrocyte: 0.25 |
| CACAACAGTTACCCAA-1_HTA4_1018_4071 | Fibroblasts | 0.36 | 1747.78 | Raw ScoresFibroblasts: 0.47, Osteoblasts: 0.45, Smooth_muscle_cells: 0.45, Chondrocytes: 0.44, Tissue_stem_cells: 0.43, MSC: 0.41, iPS_cells: 0.41, Neurons: 0.34, Endothelial_cells: 0.31, Astrocyte: 0.28 |
| TGATCAGAGTCCGCGT-1_HTA4_1009_4031 | Fibroblasts | 0.34 | 1738.37 | Raw ScoresFibroblasts: 0.48, Osteoblasts: 0.47, Chondrocytes: 0.45, Smooth_muscle_cells: 0.45, Tissue_stem_cells: 0.44, iPS_cells: 0.42, MSC: 0.42, Neurons: 0.36, Astrocyte: 0.33, Endothelial_cells: 0.32 |
| GAAGGGTAGCTCGCAC-1_HTA4_1020_4077 | Smooth_muscle_cells | 0.30 | 1682.81 | Raw ScoresOsteoblasts: 0.53, Fibroblasts: 0.53, Smooth_muscle_cells: 0.51, Tissue_stem_cells: 0.5, Chondrocytes: 0.5, MSC: 0.48, iPS_cells: 0.47, Neurons: 0.4, Endothelial_cells: 0.4, Astrocyte: 0.36 |
| TCTTCCTGTCCTTGTC-1_HTA4_1018_4071 | Fibroblasts | 0.33 | 1672.51 | Raw ScoresFibroblasts: 0.43, Osteoblasts: 0.42, Chondrocytes: 0.42, Smooth_muscle_cells: 0.41, Tissue_stem_cells: 0.4, iPS_cells: 0.38, MSC: 0.38, Neurons: 0.33, Endothelial_cells: 0.29, Astrocyte: 0.26 |
| ATTTACCCATGGGAAC-1_HTA4_1002_4008 | Smooth_muscle_cells | 0.17 | 1669.13 | Raw ScoresFibroblasts: 0.32, Osteoblasts: 0.31, Chondrocytes: 0.31, Smooth_muscle_cells: 0.31, Tissue_stem_cells: 0.29, iPS_cells: 0.28, MSC: 0.28, Neurons: 0.24, Astrocyte: 0.23, Endothelial_cells: 0.22 |
| GTAGATCCAGCGTATT-1_HTA4_1018_4071 | Smooth_muscle_cells | 0.30 | 1632.83 | Raw ScoresFibroblasts: 0.37, Chondrocytes: 0.36, Smooth_muscle_cells: 0.36, Osteoblasts: 0.35, Tissue_stem_cells: 0.34, iPS_cells: 0.32, MSC: 0.31, Neurons: 0.26, Endothelial_cells: 0.22, Astrocyte: 0.21 |
| CCTCCAAAGGTCACTT-1_HTA4_1018_4066 | Smooth_muscle_cells | 0.28 | 1631.64 | Raw ScoresFibroblasts: 0.47, Osteoblasts: 0.47, Smooth_muscle_cells: 0.44, Chondrocytes: 0.43, Tissue_stem_cells: 0.43, iPS_cells: 0.41, MSC: 0.41, Neurons: 0.35, Endothelial_cells: 0.34, Astrocyte: 0.32 |
| TACGGGCTCAAATAGG-1_HTA4_1018_4071 | Chondrocytes | 0.32 | 1614.00 | Raw ScoresFibroblasts: 0.46, Osteoblasts: 0.45, Smooth_muscle_cells: 0.45, Chondrocytes: 0.45, Tissue_stem_cells: 0.44, iPS_cells: 0.42, MSC: 0.41, Neurons: 0.35, Endothelial_cells: 0.3, Astrocyte: 0.27 |
| TCCTTCTTCCGCATAA-1_HTA4_1012_4046 | Smooth_muscle_cells | 0.29 | 1599.77 | Raw ScoresFibroblasts: 0.5, Smooth_muscle_cells: 0.48, Chondrocytes: 0.48, Osteoblasts: 0.47, Tissue_stem_cells: 0.46, iPS_cells: 0.44, MSC: 0.44, Neurons: 0.37, Endothelial_cells: 0.36, Embryonic_stem_cells: 0.34 |
| GAAATGACATAGGCGA-1_HTA4_1018_4070 | Smooth_muscle_cells | 0.29 | 1578.69 | Raw ScoresFibroblasts: 0.41, Chondrocytes: 0.4, Smooth_muscle_cells: 0.4, Osteoblasts: 0.39, Tissue_stem_cells: 0.38, iPS_cells: 0.36, MSC: 0.36, Neurons: 0.31, Endothelial_cells: 0.27, Neuroepithelial_cell: 0.23 |
| CTGCCTATCATTTGGG-1_HTA4_1018_4070 | Smooth_muscle_cells | 0.32 | 1577.23 | Raw ScoresFibroblasts: 0.49, Osteoblasts: 0.47, Smooth_muscle_cells: 0.47, Chondrocytes: 0.46, Tissue_stem_cells: 0.45, iPS_cells: 0.43, MSC: 0.41, Neurons: 0.36, Endothelial_cells: 0.33, Astrocyte: 0.3 |
| CTCAATTAGGATACGC-1_HTA4_1021_4082 | Fibroblasts | 0.29 | 1557.47 | Raw ScoresFibroblasts: 0.46, Smooth_muscle_cells: 0.44, Chondrocytes: 0.44, Osteoblasts: 0.43, Tissue_stem_cells: 0.42, iPS_cells: 0.4, MSC: 0.4, Astrocyte: 0.36, Neurons: 0.35, Neuroepithelial_cell: 0.35 |
| AGTTCGACATTGACCA-1_HTA4_1018_4070 | Smooth_muscle_cells | 0.31 | 1493.49 | Raw ScoresFibroblasts: 0.45, Smooth_muscle_cells: 0.44, Osteoblasts: 0.43, Chondrocytes: 0.42, Tissue_stem_cells: 0.41, iPS_cells: 0.4, MSC: 0.39, Neurons: 0.34, Endothelial_cells: 0.32, Neuroepithelial_cell: 0.28 |
| CATAAGCAGAGAGTTT-1_HTA4_1018_4071 | Fibroblasts | 0.37 | 1488.36 | Raw ScoresFibroblasts: 0.51, Chondrocytes: 0.48, Osteoblasts: 0.48, Smooth_muscle_cells: 0.47, Tissue_stem_cells: 0.45, iPS_cells: 0.44, MSC: 0.43, Neurons: 0.38, Endothelial_cells: 0.34, Astrocyte: 0.33 |
| TTGGATGTCGAAACAA-1_HTA4_1018_4071 | Fibroblasts | 0.26 | 1385.87 | Raw ScoresChondrocytes: 0.36, Fibroblasts: 0.36, Osteoblasts: 0.35, Tissue_stem_cells: 0.35, Smooth_muscle_cells: 0.34, iPS_cells: 0.32, MSC: 0.31, Neurons: 0.27, Endothelial_cells: 0.24, Embryonic_stem_cells: 0.2 |
| GACTGATCATGGCTGC-1_HTA4_1018_4070 | Smooth_muscle_cells | 0.24 | 1361.70 | Raw ScoresFibroblasts: 0.39, Smooth_muscle_cells: 0.39, Chondrocytes: 0.37, Tissue_stem_cells: 0.37, Osteoblasts: 0.37, iPS_cells: 0.36, MSC: 0.36, Neurons: 0.32, Endothelial_cells: 0.29, Neuroepithelial_cell: 0.25 |
| CATTTCAGTTAGGGAC-1_HTA4_1018_4071 | Fibroblasts | 0.32 | 1360.67 | Raw ScoresFibroblasts: 0.42, Osteoblasts: 0.4, Chondrocytes: 0.4, Smooth_muscle_cells: 0.4, Tissue_stem_cells: 0.39, iPS_cells: 0.37, MSC: 0.36, Neurons: 0.31, Endothelial_cells: 0.27, Neuroepithelial_cell: 0.23 |
| CATACAGAGTGATAGT-1_HTA4_1018_4071 | Fibroblasts | 0.30 | 1344.62 | Raw ScoresFibroblasts: 0.41, Osteoblasts: 0.4, Chondrocytes: 0.39, Smooth_muscle_cells: 0.38, Tissue_stem_cells: 0.38, iPS_cells: 0.36, MSC: 0.36, Neurons: 0.31, Endothelial_cells: 0.26, Neuroepithelial_cell: 0.24 |
| ATTTCTGTCGTAATGC-1_HTA4_1018_4070 | Smooth_muscle_cells | 0.30 | 1344.60 | Raw ScoresFibroblasts: 0.45, Smooth_muscle_cells: 0.43, Osteoblasts: 0.43, Chondrocytes: 0.42, Tissue_stem_cells: 0.42, iPS_cells: 0.4, MSC: 0.39, Neurons: 0.34, Endothelial_cells: 0.32, Neuroepithelial_cell: 0.27 |
| GGAGCAAAGTGAATAC-1_HTA4_1018_4071 | Fibroblasts | 0.32 | 1338.35 | Raw ScoresFibroblasts: 0.42, Chondrocytes: 0.41, Smooth_muscle_cells: 0.4, Osteoblasts: 0.4, Tissue_stem_cells: 0.39, iPS_cells: 0.36, MSC: 0.36, Neurons: 0.3, Endothelial_cells: 0.27, Neuroepithelial_cell: 0.25 |
| ATTCTACTCAAACGAA-1_HTA4_1018_4071 | Chondrocytes | 0.29 | 1335.56 | Raw ScoresChondrocytes: 0.35, Fibroblasts: 0.34, Osteoblasts: 0.34, Tissue_stem_cells: 0.33, Smooth_muscle_cells: 0.33, iPS_cells: 0.3, MSC: 0.3, Neurons: 0.25, Endothelial_cells: 0.2, Astrocyte: 0.2 |
| CTTCTCTCACACAGAG-1_HTA4_1018_4070 | Chondrocytes | 0.30 | 1248.65 | Raw ScoresFibroblasts: 0.4, Chondrocytes: 0.39, Osteoblasts: 0.38, Tissue_stem_cells: 0.38, Smooth_muscle_cells: 0.37, iPS_cells: 0.35, MSC: 0.33, Neurons: 0.29, Endothelial_cells: 0.24, Astrocyte: 0.22 |
| ATGAGTCCAGGTGTGA-1_HTA4_1020_4077 | Osteoblasts | 0.28 | 1243.63 | Raw ScoresOsteoblasts: 0.39, Smooth_muscle_cells: 0.38, Fibroblasts: 0.38, Chondrocytes: 0.38, Tissue_stem_cells: 0.38, MSC: 0.37, iPS_cells: 0.36, Neurons: 0.31, Endothelial_cells: 0.29, Neuroepithelial_cell: 0.25 |
| ATCGATGTCTAGGCAT-1_HTA4_1018_4070 | Smooth_muscle_cells | 0.28 | 1242.07 | Raw ScoresFibroblasts: 0.35, Smooth_muscle_cells: 0.34, Chondrocytes: 0.34, Osteoblasts: 0.34, Tissue_stem_cells: 0.33, iPS_cells: 0.31, MSC: 0.3, Neurons: 0.25, Neuroepithelial_cell: 0.22, Endothelial_cells: 0.21 |
| ATCAGGTCACAAGCCC-1_HTA4_1018_4070 | Fibroblasts | 0.29 | 1231.38 | Raw ScoresFibroblasts: 0.41, Chondrocytes: 0.4, Osteoblasts: 0.39, Tissue_stem_cells: 0.39, Smooth_muscle_cells: 0.38, iPS_cells: 0.37, MSC: 0.36, Neurons: 0.31, Endothelial_cells: 0.26, Neuroepithelial_cell: 0.23 |
| AAACGAACAAGGTCGA-1_HTA4_1018_4070 | Smooth_muscle_cells | 0.27 | 1191.27 | Raw ScoresChondrocytes: 0.35, Fibroblasts: 0.35, Osteoblasts: 0.34, Smooth_muscle_cells: 0.33, Tissue_stem_cells: 0.33, iPS_cells: 0.31, MSC: 0.3, Neurons: 0.25, Endothelial_cells: 0.21, Astrocyte: 0.19 |
| ATATCCTCAGGACATG-1_HTA4_1018_4071 | Smooth_muscle_cells | 0.28 | 1190.83 | Raw ScoresFibroblasts: 0.4, Chondrocytes: 0.38, Osteoblasts: 0.38, Smooth_muscle_cells: 0.37, Tissue_stem_cells: 0.37, iPS_cells: 0.36, MSC: 0.34, Neurons: 0.31, Endothelial_cells: 0.25, Neuroepithelial_cell: 0.23 |
| ACGATCATCCCAAGTA-1_HTA4_1004_4014 | Tissue_stem_cells | 0.25 | 1184.76 | Raw ScoresFibroblasts: 0.46, Osteoblasts: 0.45, Tissue_stem_cells: 0.45, Smooth_muscle_cells: 0.44, Chondrocytes: 0.44, iPS_cells: 0.41, MSC: 0.41, Neurons: 0.38, Endothelial_cells: 0.35, Astrocyte: 0.32 |
| GGGTCACGTCTATGAC-1_HTA4_1018_4070 | Smooth_muscle_cells | 0.30 | 1149.26 | Raw ScoresFibroblasts: 0.4, Osteoblasts: 0.39, Chondrocytes: 0.38, Smooth_muscle_cells: 0.38, Tissue_stem_cells: 0.37, iPS_cells: 0.36, MSC: 0.35, Neurons: 0.31, Endothelial_cells: 0.26, Embryonic_stem_cells: 0.22 |
| ATAGACCCATCGTGCG-1_HTA4_1009_4033 | Fibroblasts | 0.31 | 1121.33 | Raw ScoresFibroblasts: 0.47, Osteoblasts: 0.44, Chondrocytes: 0.43, Smooth_muscle_cells: 0.42, Tissue_stem_cells: 0.41, iPS_cells: 0.41, MSC: 0.4, Neurons: 0.35, Astrocyte: 0.32, Endothelial_cells: 0.31 |
| ATTTACCAGAAATTCG-1_HTA4_1018_4070 | Fibroblasts | 0.39 | 1120.95 | Raw ScoresFibroblasts: 0.55, Osteoblasts: 0.52, Smooth_muscle_cells: 0.52, Chondrocytes: 0.51, Tissue_stem_cells: 0.49, iPS_cells: 0.48, MSC: 0.48, Neurons: 0.4, Endothelial_cells: 0.38, Astrocyte: 0.37 |
| TGCATCCCAATAACCC-1_HTA4_1018_4071 | Smooth_muscle_cells | 0.28 | 1111.43 | Raw ScoresFibroblasts: 0.38, Chondrocytes: 0.37, Osteoblasts: 0.37, Smooth_muscle_cells: 0.37, Tissue_stem_cells: 0.36, iPS_cells: 0.34, MSC: 0.33, Neurons: 0.27, Endothelial_cells: 0.23, Astrocyte: 0.21 |
| AGAAGCGAGCACGGAT-1_HTA4_1012_4046 | Fibroblasts | 0.28 | 1107.80 | Raw ScoresFibroblasts: 0.43, Smooth_muscle_cells: 0.4, Osteoblasts: 0.4, Chondrocytes: 0.4, Tissue_stem_cells: 0.39, iPS_cells: 0.38, MSC: 0.37, Neurons: 0.32, Endothelial_cells: 0.29, Astrocyte: 0.27 |
| AGCGTATGTATGCGTT-1_HTA4_1018_4070 | Fibroblasts | 0.31 | 1104.20 | Raw ScoresFibroblasts: 0.43, Smooth_muscle_cells: 0.42, Osteoblasts: 0.41, Chondrocytes: 0.41, Tissue_stem_cells: 0.39, iPS_cells: 0.37, MSC: 0.37, Neurons: 0.32, Endothelial_cells: 0.29, Astrocyte: 0.28 |
| GGGACAAGTGTACGCC-1_HTA4_1020_4077 | Smooth_muscle_cells | 0.28 | 1099.41 | Raw ScoresOsteoblasts: 0.43, Fibroblasts: 0.43, Smooth_muscle_cells: 0.41, Chondrocytes: 0.41, Tissue_stem_cells: 0.4, MSC: 0.38, iPS_cells: 0.38, Endothelial_cells: 0.31, Neurons: 0.31, Astrocyte: 0.28 |
| AAAGGGCCAACACGAG-1_HTA4_1009_4031 | Smooth_muscle_cells | 0.28 | 1096.44 | Raw ScoresFibroblasts: 0.43, Smooth_muscle_cells: 0.43, Osteoblasts: 0.42, Chondrocytes: 0.41, Tissue_stem_cells: 0.4, MSC: 0.39, iPS_cells: 0.39, Neurons: 0.36, Astrocyte: 0.33, Endothelial_cells: 0.31 |
| CCAAGCGCAGGTGACA-1_HTA4_1009_4031 | Tissue_stem_cells | 0.29 | 1095.12 | Raw ScoresFibroblasts: 0.48, Chondrocytes: 0.47, Tissue_stem_cells: 0.47, Osteoblasts: 0.47, Smooth_muscle_cells: 0.46, iPS_cells: 0.44, MSC: 0.43, Neurons: 0.38, Endothelial_cells: 0.33, Astrocyte: 0.32 |
Below shows the significant enrichments of this GEP for literature curated gene lists
This data was procured from existing single cell RNA-seq maps of neuroblastoma or related relevant data.
High ranks indicate this gene is a driver of this GEP.
These curated gene list are ranked by the P-value (on this GEP) of their constituent genes.
The Mean Count column shows the mean read count in cells scoring highly (H > 50) on this gene expression program.
Myofibroblastic CAF
These marker genes were curated across cancer subtypes in multiple organ systems as reviewed in Lavie et. al. (PMID 35883004) and contain myofibroblastic specific CAF genes:
Wilcoxon ranksum test P-value for gene set overrepresentation: 3.78e-16
Mean rank of genes in gene set: 3458.06
Rank on gene expression program of genes in gene set:
| Genes | Weight | Rank | GTEx | DepMap | Decartes | Mean.Counts | Mean.TPM |
|---|---|---|---|---|---|---|---|
| COL3A1 | 0.0091022 | 1 | GTEx | DepMap | Descartes | 22.70 | 2636.24 |
| COL1A2 | 0.0090765 | 2 | GTEx | DepMap | Descartes | 25.13 | 2704.87 |
| COL1A1 | 0.0089022 | 3 | GTEx | DepMap | Descartes | 26.11 | 2919.87 |
| LUM | 0.0079013 | 5 | GTEx | DepMap | Descartes | 3.34 | 760.33 |
| THBS2 | 0.0063489 | 8 | GTEx | DepMap | Descartes | 4.80 | 493.88 |
| DCN | 0.0057837 | 10 | GTEx | DepMap | Descartes | 3.84 | 333.99 |
| POSTN | 0.0053938 | 12 | GTEx | DepMap | Descartes | 5.02 | 937.88 |
| BGN | 0.0051920 | 14 | GTEx | DepMap | Descartes | 2.39 | 648.30 |
| COL10A1 | 0.0048890 | 17 | GTEx | DepMap | Descartes | 0.60 | 97.47 |
| IGFBP7 | 0.0047647 | 18 | GTEx | DepMap | Descartes | 19.11 | 7926.95 |
| VCAN | 0.0047246 | 19 | GTEx | DepMap | Descartes | 7.91 | 358.23 |
| COL5A1 | 0.0044354 | 23 | GTEx | DepMap | Descartes | 4.10 | 307.10 |
| TMEM119 | 0.0032448 | 39 | GTEx | DepMap | Descartes | 0.28 | 61.50 |
| FN1 | 0.0029355 | 44 | GTEx | DepMap | Descartes | 11.91 | 778.73 |
| COL14A1 | 0.0029033 | 45 | GTEx | DepMap | Descartes | 3.23 | 243.58 |
| COL5A2 | 0.0026329 | 57 | GTEx | DepMap | Descartes | 5.51 | 475.88 |
| COL8A1 | 0.0025133 | 63 | GTEx | DepMap | Descartes | 3.67 | 347.57 |
| TAGLN | 0.0024799 | 65 | GTEx | DepMap | Descartes | 2.21 | 346.56 |
| IGFBP3 | 0.0021357 | 74 | GTEx | DepMap | Descartes | 0.61 | 120.08 |
| THY1 | 0.0019204 | 82 | GTEx | DepMap | Descartes | 1.98 | 236.48 |
| COL4A1 | 0.0014065 | 125 | GTEx | DepMap | Descartes | 9.74 | 879.09 |
| TPM2 | 0.0013033 | 142 | GTEx | DepMap | Descartes | 0.89 | 325.20 |
| MYL9 | 0.0012771 | 152 | GTEx | DepMap | Descartes | 0.98 | 201.36 |
| COL12A1 | 0.0011773 | 170 | GTEx | DepMap | Descartes | 3.33 | 163.95 |
| COL11A1 | 0.0010560 | 206 | GTEx | DepMap | Descartes | 1.01 | 71.52 |
| MMP2 | 0.0010396 | 208 | GTEx | DepMap | Descartes | 0.53 | 91.05 |
| HOPX | 0.0009420 | 229 | GTEx | DepMap | Descartes | 0.30 | 44.65 |
| MMP11 | 0.0009313 | 234 | GTEx | DepMap | Descartes | 0.36 | 58.32 |
| THBS1 | 0.0008961 | 248 | GTEx | DepMap | Descartes | 4.47 | 326.27 |
| ACTA2 | 0.0007501 | 296 | GTEx | DepMap | Descartes | 1.95 | 823.55 |
| CNN2 | 0.0005511 | 438 | GTEx | DepMap | Descartes | 0.28 | 71.99 |
| CNN3 | 0.0004164 | 582 | GTEx | DepMap | Descartes | 1.41 | 371.95 |
| MYLK | 0.0003943 | 617 | GTEx | DepMap | Descartes | 1.14 | 64.38 |
| TPM1 | 0.0003800 | 648 | GTEx | DepMap | Descartes | 3.97 | 576.88 |
| COL15A1 | 0.0003518 | 713 | GTEx | DepMap | Descartes | 1.49 | 129.08 |
| TGFB1 | 0.0002654 | 942 | GTEx | DepMap | Descartes | 0.65 | 128.24 |
| WNT5A | 0.0002463 | 1018 | GTEx | DepMap | Descartes | 0.08 | 7.04 |
| TGFBR2 | 0.0001725 | 1458 | GTEx | DepMap | Descartes | 2.02 | 172.10 |
| TGFBR1 | 0.0001315 | 1843 | GTEx | DepMap | Descartes | 1.09 | 89.46 |
| PGF | 0.0000782 | 2845 | GTEx | DepMap | Descartes | 0.13 | 19.67 |
| TGFB2 | 0.0000569 | 3517 | GTEx | DepMap | Descartes | 0.33 | 28.03 |
| COL13A1 | -0.0000490 | 15118 | GTEx | DepMap | Descartes | 0.05 | 7.48 |
| ACTG2 | -0.0000949 | 17410 | GTEx | DepMap | Descartes | 0.05 | 13.38 |
| VEGFA | -0.0000992 | 17582 | GTEx | DepMap | Descartes | 0.69 | 26.11 |
| TNC | -0.0003171 | 20261 | GTEx | DepMap | Descartes | 2.96 | 201.34 |
| MEF2C | -0.0003462 | 20343 | GTEx | DepMap | Descartes | 1.86 | 110.18 |
| ITGA7 | -0.0003911 | 20435 | GTEx | DepMap | Descartes | 0.19 | 22.55 |
| RGS5 | -0.0004533 | 20500 | GTEx | DepMap | Descartes | 1.47 | 122.86 |
| MYH11 | -0.0005925 | 20564 | GTEx | DepMap | Descartes | 0.41 | 34.79 |
Inflammatory CAF
These marker genes were curated across cancer subtypes in multiple organ systems as reviewed in Lavie et. al. (PMID 35883004) and contain inflammatory specific CAF genes:
Wilcoxon ranksum test P-value for gene set overrepresentation: 2.72e-10
Mean rank of genes in gene set: 4467.85
Rank on gene expression program of genes in gene set:
| Genes | Weight | Rank | GTEx | DepMap | Decartes | Mean.Counts | Mean.TPM |
|---|---|---|---|---|---|---|---|
| C1R | 0.0036704 | 32 | GTEx | DepMap | Descartes | 1.10 | 194.74 |
| C1S | 0.0024464 | 67 | GTEx | DepMap | Descartes | 1.60 | 311.81 |
| PDGFRA | 0.0022798 | 69 | GTEx | DepMap | Descartes | 0.42 | 37.37 |
| IGFBP6 | 0.0016459 | 100 | GTEx | DepMap | Descartes | 0.35 | 167.39 |
| C7 | 0.0014879 | 117 | GTEx | DepMap | Descartes | 6.19 | 686.04 |
| IGF1 | 0.0013623 | 132 | GTEx | DepMap | Descartes | 1.01 | 77.96 |
| CXCL12 | 0.0013291 | 140 | GTEx | DepMap | Descartes | 0.75 | 123.25 |
| SERPING1 | 0.0012778 | 151 | GTEx | DepMap | Descartes | 0.64 | 165.25 |
| CCL2 | 0.0009713 | 218 | GTEx | DepMap | Descartes | 0.95 | 557.22 |
| PDGFRB | 0.0007614 | 294 | GTEx | DepMap | Descartes | 1.99 | 214.50 |
| CFD | 0.0007242 | 311 | GTEx | DepMap | Descartes | 0.22 | 123.05 |
| PDGFD | 0.0006118 | 387 | GTEx | DepMap | Descartes | 1.95 | 241.63 |
| ADH1B | 0.0004416 | 544 | GTEx | DepMap | Descartes | 0.46 | 49.08 |
| CXCL14 | 0.0003648 | 678 | GTEx | DepMap | Descartes | 0.17 | 50.32 |
| C3 | 0.0003016 | 820 | GTEx | DepMap | Descartes | 0.98 | 119.39 |
| SCARA5 | 0.0002925 | 844 | GTEx | DepMap | Descartes | 0.04 | 5.99 |
| HGF | 0.0002778 | 900 | GTEx | DepMap | Descartes | 0.45 | 40.13 |
| IL33 | 0.0001844 | 1361 | GTEx | DepMap | Descartes | 0.40 | 85.67 |
| CXCL10 | 0.0001821 | 1381 | GTEx | DepMap | Descartes | 0.05 | 19.70 |
| SAA1 | 0.0001798 | 1405 | GTEx | DepMap | Descartes | 0.04 | 17.59 |
| C1QA | 0.0000969 | 2401 | GTEx | DepMap | Descartes | 0.20 | 107.30 |
| C1QC | 0.0000889 | 2568 | GTEx | DepMap | Descartes | 0.13 | 58.50 |
| SCARA3 | 0.0000807 | 2776 | GTEx | DepMap | Descartes | 0.11 | 13.65 |
| LIF | 0.0000804 | 2785 | GTEx | DepMap | Descartes | 0.05 | 5.83 |
| CXCL9 | 0.0000770 | 2870 | GTEx | DepMap | Descartes | 0.04 | 8.29 |
| CFB | 0.0000432 | 4091 | GTEx | DepMap | Descartes | 0.01 | 1.60 |
| C4B | 0.0000401 | 4243 | GTEx | DepMap | Descartes | 0.00 | 0.15 |
| CXCL1 | 0.0000389 | 4301 | GTEx | DepMap | Descartes | 0.03 | 12.42 |
| CCL21 | 0.0000230 | 5183 | GTEx | DepMap | Descartes | 0.60 | 363.13 |
| CCL7 | 0.0000059 | 6730 | GTEx | DepMap | Descartes | 0.00 | 1.96 |
| RGMA | -0.0000009 | 8623 | GTEx | DepMap | Descartes | 0.13 | 5.94 |
| GPX3 | -0.0000016 | 8865 | GTEx | DepMap | Descartes | 0.27 | 78.40 |
| IL10 | -0.0000057 | 10040 | GTEx | DepMap | Descartes | 0.00 | 0.75 |
| IL1R1 | -0.0000073 | 10421 | GTEx | DepMap | Descartes | 1.34 | 148.51 |
| SOD2 | -0.0000254 | 13147 | GTEx | DepMap | Descartes | 0.02 | 0.76 |
| CCL8 | -0.0000285 | 13434 | GTEx | DepMap | Descartes | 0.01 | 6.52 |
| CXCL13 | -0.0000552 | 15546 | GTEx | DepMap | Descartes | 0.03 | 13.09 |
| IL6 | -0.0000750 | 16607 | GTEx | DepMap | Descartes | 0.09 | 29.96 |
| PDPN | -0.0000825 | 16936 | GTEx | DepMap | Descartes | 0.10 | 14.34 |
| CXCL2 | -0.0000889 | 17196 | GTEx | DepMap | Descartes | 0.11 | 49.74 |
Mesenchymal Fig 1D (Olsen)
Selected mesenchymal marker genes shown in Fig. 1D of Olsen et al. https://www.biorxiv.org/content/10.1101/2020.05.04.077057v1 - these are highly expressed in their mesenchymal cluster on their UMAP.:
Wilcoxon ranksum test P-value for gene set overrepresentation: 1.20e-08
Mean rank of genes in gene set: 1099.46
Rank on gene expression program of genes in gene set:
| Genes | Weight | Rank | GTEx | DepMap | Decartes | Mean.Counts | Mean.TPM |
|---|---|---|---|---|---|---|---|
| COL3A1 | 0.0091022 | 1 | GTEx | DepMap | Descartes | 22.70 | 2636.24 |
| COL1A2 | 0.0090765 | 2 | GTEx | DepMap | Descartes | 25.13 | 2704.87 |
| COL1A1 | 0.0089022 | 3 | GTEx | DepMap | Descartes | 26.11 | 2919.87 |
| LUM | 0.0079013 | 5 | GTEx | DepMap | Descartes | 3.34 | 760.33 |
| MGP | 0.0076330 | 6 | GTEx | DepMap | Descartes | 9.18 | 3183.28 |
| SPARC | 0.0073831 | 7 | GTEx | DepMap | Descartes | 9.06 | 1554.29 |
| DCN | 0.0057837 | 10 | GTEx | DepMap | Descartes | 3.84 | 333.99 |
| BGN | 0.0051920 | 14 | GTEx | DepMap | Descartes | 2.39 | 648.30 |
| COL6A2 | 0.0032523 | 38 | GTEx | DepMap | Descartes | 3.53 | 647.18 |
| PDGFRA | 0.0022798 | 69 | GTEx | DepMap | Descartes | 0.42 | 37.37 |
| PRRX1 | 0.0017384 | 92 | GTEx | DepMap | Descartes | 2.56 | 370.34 |
| CALD1 | 0.0006346 | 369 | GTEx | DepMap | Descartes | 12.44 | 1425.69 |
| LEPR | -0.0000312 | 13677 | GTEx | DepMap | Descartes | 0.62 | 37.68 |
Below shows ranks on this GEP for literature curated gene lists for large gene sets
These include those reported as mesenchymal/adrenergic by Van Groningen et al.
High ranks indicate this gene is a driver of this GEP (note these results are not ordered).
The Mean Count column shows the mean read count in cells scoring highly (H > 50) on this gene expression program.
VanGroningen Adrenergic Genes
Adrenergic marker genes from Supplementary Table 2 of Van Groningen et al. Nature Genetics 2017. These genes were identified by differential expression analysis of mesenchymal-like and adrenergic-like neuroblastoma cell lines.
Wilcoxon ranksum test P-value for gene set overrepresentation: 1.00e+00
Mean rank of genes in gene set: 15875.65
Median rank of genes in gene set: 18024
Rank on gene expression program of top 30 genes in gene set:
| Genes | Weight | Rank | GTEx | DepMap | Descartes | Mean.Counts | Mean.TPM |
|---|---|---|---|---|---|---|---|
| STRA6 | 0.0007362 | 304 | GTEx | DepMap | Descartes | 0.13 | 23.25 |
| CYGB | 0.0005301 | 451 | GTEx | DepMap | Descartes | 0.42 | 124.46 |
| HEY1 | 0.0002147 | 1179 | GTEx | DepMap | Descartes | 0.09 | 11.01 |
| CD200 | 0.0002146 | 1181 | GTEx | DepMap | Descartes | 0.67 | 159.05 |
| DNAJB1 | 0.0001839 | 1367 | GTEx | DepMap | Descartes | 0.26 | 60.39 |
| NPTX2 | 0.0001796 | 1407 | GTEx | DepMap | Descartes | 0.07 | 14.35 |
| TENM4 | 0.0001587 | 1589 | GTEx | DepMap | Descartes | 3.43 | NA |
| NAP1L5 | 0.0001586 | 1590 | GTEx | DepMap | Descartes | 0.31 | 85.58 |
| GLRX | 0.0001503 | 1671 | GTEx | DepMap | Descartes | 0.35 | 51.17 |
| SETD7 | 0.0001299 | 1865 | GTEx | DepMap | Descartes | 0.48 | 32.31 |
| EIF1B | 0.0001283 | 1887 | GTEx | DepMap | Descartes | 0.41 | 227.73 |
| ZNF22 | 0.0001256 | 1925 | GTEx | DepMap | Descartes | 0.17 | 43.04 |
| LSM3 | 0.0001081 | 2197 | GTEx | DepMap | Descartes | 0.23 | 37.31 |
| TUBB4B | 0.0000921 | 2504 | GTEx | DepMap | Descartes | 0.42 | 103.98 |
| GGCT | 0.0000915 | 2513 | GTEx | DepMap | Descartes | 0.13 | 61.39 |
| MMD | 0.0000887 | 2572 | GTEx | DepMap | Descartes | 0.57 | 96.30 |
| FABP6 | 0.0000880 | 2589 | GTEx | DepMap | Descartes | 0.18 | 147.02 |
| DKK1 | 0.0000864 | 2628 | GTEx | DepMap | Descartes | 0.01 | 2.77 |
| SCG2 | 0.0000848 | 2672 | GTEx | DepMap | Descartes | 4.50 | 990.71 |
| PHPT1 | 0.0000794 | 2810 | GTEx | DepMap | Descartes | 0.42 | 176.18 |
| SCG3 | 0.0000726 | 3005 | GTEx | DepMap | Descartes | 0.67 | 112.23 |
| PTS | 0.0000724 | 3013 | GTEx | DepMap | Descartes | 0.69 | 307.93 |
| RBP1 | 0.0000629 | 3317 | GTEx | DepMap | Descartes | 0.51 | 143.14 |
| C4orf48 | 0.0000580 | 3470 | GTEx | DepMap | Descartes | 0.61 | 744.58 |
| CDC42EP3 | 0.0000575 | 3487 | GTEx | DepMap | Descartes | 0.39 | 36.08 |
| TCEAL7 | 0.0000500 | 3797 | GTEx | DepMap | Descartes | 0.35 | 169.86 |
| TUBB2A | 0.0000420 | 4156 | GTEx | DepMap | Descartes | 1.54 | 523.09 |
| OLFM1 | 0.0000407 | 4215 | GTEx | DepMap | Descartes | 0.44 | 70.37 |
| ARL6IP1 | 0.0000347 | 4528 | GTEx | DepMap | Descartes | 0.03 | 6.53 |
| AHSA1 | 0.0000332 | 4609 | GTEx | DepMap | Descartes | 0.26 | 96.78 |
VanGroningen Mesenchymal Genes
Mesenchymal marker genes from Supplementary Table 2 of Van Groningen et al. Nature Genetics 2017. These genes were identified by differential expression analysis of mesenchymal-like and adrenergic-like neuroblastoma cell lines.
Wilcoxon ranksum test P-value for gene set overrepresentation: 3.68e-78
Mean rank of genes in gene set: 5232.09
Median rank of genes in gene set: 1205.5
Rank on gene expression program of top 30 genes in gene set:
| Genes | Weight | Rank | GTEx | DepMap | Descartes | Mean.Counts | Mean.TPM |
|---|---|---|---|---|---|---|---|
| COL3A1 | 0.0091022 | 1 | GTEx | DepMap | Descartes | 22.70 | 2636.24 |
| COL1A1 | 0.0089022 | 3 | GTEx | DepMap | Descartes | 26.11 | 2919.87 |
| MGP | 0.0076330 | 6 | GTEx | DepMap | Descartes | 9.18 | 3183.28 |
| SPARC | 0.0073831 | 7 | GTEx | DepMap | Descartes | 9.06 | 1554.29 |
| IGFBP5 | 0.0055329 | 11 | GTEx | DepMap | Descartes | 5.40 | 464.83 |
| POSTN | 0.0053938 | 12 | GTEx | DepMap | Descartes | 5.02 | 937.88 |
| TIMP1 | 0.0052738 | 13 | GTEx | DepMap | Descartes | 4.82 | 2591.36 |
| BGN | 0.0051920 | 14 | GTEx | DepMap | Descartes | 2.39 | 648.30 |
| CCDC80 | 0.0051759 | 15 | GTEx | DepMap | Descartes | 2.32 | 114.52 |
| AEBP1 | 0.0049027 | 16 | GTEx | DepMap | Descartes | 2.41 | 382.98 |
| COL5A1 | 0.0044354 | 23 | GTEx | DepMap | Descartes | 4.10 | 307.10 |
| COL6A3 | 0.0038533 | 30 | GTEx | DepMap | Descartes | 6.38 | 385.35 |
| FBN1 | 0.0034442 | 34 | GTEx | DepMap | Descartes | 3.67 | 183.67 |
| FSTL1 | 0.0033109 | 37 | GTEx | DepMap | Descartes | 2.43 | 245.20 |
| COL6A2 | 0.0032523 | 38 | GTEx | DepMap | Descartes | 3.53 | 647.18 |
| F2R | 0.0031486 | 40 | GTEx | DepMap | Descartes | 1.07 | 164.79 |
| COL6A1 | 0.0030892 | 41 | GTEx | DepMap | Descartes | 2.51 | 378.26 |
| FN1 | 0.0029355 | 44 | GTEx | DepMap | Descartes | 11.91 | 778.73 |
| CDH11 | 0.0027664 | 50 | GTEx | DepMap | Descartes | 4.77 | 393.24 |
| FMOD | 0.0027489 | 51 | GTEx | DepMap | Descartes | 0.22 | 44.49 |
| GPX8 | 0.0027340 | 53 | GTEx | DepMap | Descartes | 0.30 | 44.59 |
| SERPINH1 | 0.0027234 | 54 | GTEx | DepMap | Descartes | 0.95 | 162.72 |
| COL5A2 | 0.0026329 | 57 | GTEx | DepMap | Descartes | 5.51 | 475.88 |
| PPIC | 0.0026274 | 58 | GTEx | DepMap | Descartes | 0.30 | 126.37 |
| ID3 | 0.0025160 | 62 | GTEx | DepMap | Descartes | 1.08 | 622.50 |
| ITGB1 | 0.0024489 | 66 | GTEx | DepMap | Descartes | 3.87 | 557.66 |
| TM4SF1 | 0.0022070 | 70 | GTEx | DepMap | Descartes | 0.56 | 80.27 |
| CYBRD1 | 0.0021736 | 73 | GTEx | DepMap | Descartes | 0.86 | 118.83 |
| MXRA5 | 0.0021195 | 77 | GTEx | DepMap | Descartes | 0.42 | 26.05 |
| EMILIN1 | 0.0020923 | 78 | GTEx | DepMap | Descartes | 0.84 | 136.63 |
Descartes adrenocortical markers
Top 50 marker genes of adrenocortical cells in the Decartes fetal adrenal single cell map (https://atlas.brotmanbaty.org/bbi/human-gene-expression-during-development/cell/adrenocortical/in/adrenal)
Wilcoxon ranksum test P-value for gene set overrepresentation: 1.00e+00
Mean rank of genes in gene set: 14451.22
Median rank of genes in gene set: 14862
Rank on gene expression program of top 30 genes in gene set:
| Genes | Weight | Rank | GTEx | DepMap | Descartes | Mean.Counts | Mean.TPM |
|---|---|---|---|---|---|---|---|
| SH3PXD2B | 0.0001259 | 1919 | GTEx | DepMap | Descartes | 1.33 | 90.12 |
| PAPSS2 | 0.0000449 | 4004 | GTEx | DepMap | Descartes | 1.28 | 147.16 |
| CYP17A1 | 0.0000335 | 4588 | GTEx | DepMap | Descartes | 0.27 | 34.52 |
| PEG3 | 0.0000291 | 4823 | GTEx | DepMap | Descartes | 0.01 | NA |
| INHA | 0.0000168 | 5660 | GTEx | DepMap | Descartes | 0.03 | 8.36 |
| APOC1 | -0.0000005 | 8477 | GTEx | DepMap | Descartes | 0.31 | 218.40 |
| GSTA4 | -0.0000084 | 10651 | GTEx | DepMap | Descartes | 0.50 | 127.09 |
| HSPE1 | -0.0000109 | 11164 | GTEx | DepMap | Descartes | 0.48 | 328.23 |
| DNER | -0.0000145 | 11754 | GTEx | DepMap | Descartes | 0.50 | 62.85 |
| SCAP | -0.0000147 | 11794 | GTEx | DepMap | Descartes | 0.44 | 44.70 |
| SLC2A14 | -0.0000211 | 12686 | GTEx | DepMap | Descartes | 0.06 | 5.84 |
| SH3BP5 | -0.0000213 | 12702 | GTEx | DepMap | Descartes | 1.68 | 194.83 |
| FDXR | -0.0000251 | 13107 | GTEx | DepMap | Descartes | 0.12 | 17.13 |
| CYP11A1 | -0.0000276 | 13351 | GTEx | DepMap | Descartes | 0.38 | 44.65 |
| MC2R | -0.0000285 | 13432 | GTEx | DepMap | Descartes | 0.10 | 6.61 |
| CYP21A2 | -0.0000302 | 13581 | GTEx | DepMap | Descartes | 0.38 | 41.28 |
| CYP11B1 | -0.0000304 | 13607 | GTEx | DepMap | Descartes | 0.66 | 39.71 |
| STAR | -0.0000311 | 13659 | GTEx | DepMap | Descartes | 0.45 | 34.09 |
| DHCR7 | -0.0000348 | 14009 | GTEx | DepMap | Descartes | 0.07 | 11.55 |
| SCARB1 | -0.0000396 | 14386 | GTEx | DepMap | Descartes | 2.17 | 95.98 |
| FREM2 | -0.0000417 | 14533 | GTEx | DepMap | Descartes | 0.05 | 1.08 |
| FDX1 | -0.0000433 | 14680 | GTEx | DepMap | Descartes | 1.52 | 133.13 |
| CYB5B | -0.0000460 | 14862 | GTEx | DepMap | Descartes | 0.60 | 55.92 |
| NPC1 | -0.0000494 | 15150 | GTEx | DepMap | Descartes | 0.60 | 58.88 |
| TM7SF2 | -0.0000567 | 15651 | GTEx | DepMap | Descartes | 0.13 | 28.53 |
| GRAMD1B | -0.0000597 | 15818 | GTEx | DepMap | Descartes | 1.73 | 58.03 |
| ERN1 | -0.0000602 | 15851 | GTEx | DepMap | Descartes | 0.85 | 39.43 |
| POR | -0.0000687 | 16287 | GTEx | DepMap | Descartes | 0.70 | 109.85 |
| DHCR24 | -0.0000867 | 17120 | GTEx | DepMap | Descartes | 0.35 | 22.35 |
| CLU | -0.0000889 | 17197 | GTEx | DepMap | Descartes | 3.25 | 428.14 |
Descartes chromaffin markers
Top 50 marker genes of chromaffin cells in the Decartes fetal adrenal single cell map (https://atlas.brotmanbaty.org/bbi/human-gene-expression-during-development/cell/chromaffin/in/adrenal)
Wilcoxon ranksum test P-value for gene set overrepresentation: 1.00e+00
Mean rank of genes in gene set: 18457.98
Median rank of genes in gene set: 18976
Rank on gene expression program of top 30 genes in gene set:
| Genes | Weight | Rank | GTEx | DepMap | Descartes | Mean.Counts | Mean.TPM |
|---|---|---|---|---|---|---|---|
| TUBB2A | 0.0000420 | 4156 | GTEx | DepMap | Descartes | 1.54 | 523.09 |
| RPH3A | -0.0000367 | 14164 | GTEx | DepMap | Descartes | 0.10 | 6.24 |
| NPY | -0.0000580 | 15713 | GTEx | DepMap | Descartes | 2.29 | 2423.55 |
| SLC6A2 | -0.0000812 | 16881 | GTEx | DepMap | Descartes | 0.12 | 14.07 |
| MAB21L1 | -0.0000900 | 17242 | GTEx | DepMap | Descartes | 0.17 | 32.68 |
| TMEFF2 | -0.0000907 | 17279 | GTEx | DepMap | Descartes | 0.43 | 54.06 |
| REEP1 | -0.0000961 | 17466 | GTEx | DepMap | Descartes | 0.64 | 62.23 |
| EYA4 | -0.0000967 | 17485 | GTEx | DepMap | Descartes | 0.24 | 15.86 |
| PLXNA4 | -0.0000995 | 17593 | GTEx | DepMap | Descartes | 0.89 | 25.46 |
| ANKFN1 | -0.0001018 | 17688 | GTEx | DepMap | Descartes | 0.43 | 40.11 |
| CNTFR | -0.0001045 | 17789 | GTEx | DepMap | Descartes | 0.19 | 37.98 |
| PTCHD1 | -0.0001080 | 17901 | GTEx | DepMap | Descartes | 0.27 | 6.89 |
| RGMB | -0.0001135 | 18049 | GTEx | DepMap | Descartes | 0.31 | 31.13 |
| IL7 | -0.0001158 | 18132 | GTEx | DepMap | Descartes | 1.84 | 431.75 |
| NTRK1 | -0.0001224 | 18311 | GTEx | DepMap | Descartes | 0.31 | 33.31 |
| CNKSR2 | -0.0001280 | 18432 | GTEx | DepMap | Descartes | 1.08 | 44.84 |
| EPHA6 | -0.0001332 | 18545 | GTEx | DepMap | Descartes | 1.15 | 101.99 |
| GREM1 | -0.0001363 | 18605 | GTEx | DepMap | Descartes | 0.44 | 15.53 |
| RBFOX1 | -0.0001399 | 18696 | GTEx | DepMap | Descartes | 9.52 | 698.45 |
| HS3ST5 | -0.0001470 | 18814 | GTEx | DepMap | Descartes | 0.78 | 86.45 |
| STMN4 | -0.0001479 | 18829 | GTEx | DepMap | Descartes | 0.50 | 119.42 |
| GAL | -0.0001558 | 18976 | GTEx | DepMap | Descartes | 0.70 | 552.64 |
| TUBA1A | -0.0001597 | 19043 | GTEx | DepMap | Descartes | 5.30 | 1578.77 |
| GAP43 | -0.0001702 | 19206 | GTEx | DepMap | Descartes | 2.06 | 477.82 |
| HMX1 | -0.0001836 | 19380 | GTEx | DepMap | Descartes | 0.27 | 50.19 |
| SLC44A5 | -0.0001839 | 19384 | GTEx | DepMap | Descartes | 0.73 | 54.38 |
| STMN2 | -0.0002090 | 19651 | GTEx | DepMap | Descartes | 4.62 | 1319.86 |
| MAP1B | -0.0002129 | 19689 | GTEx | DepMap | Descartes | 7.31 | 298.95 |
| EYA1 | -0.0002136 | 19698 | GTEx | DepMap | Descartes | 0.58 | 50.60 |
| BASP1 | -0.0002169 | 19724 | GTEx | DepMap | Descartes | 1.50 | 445.62 |
Descartes Vascular_endothelial markers
Top 50 marker genes of Vascular_endothelial cells in the Decartes fetal adrenal single cell map (https://atlas.brotmanbaty.org/bbi/human-gene-expression-during-development/cell/vascular_endothelial/in/adrenal)
Wilcoxon ranksum test P-value for gene set overrepresentation: 1.95e-01
Mean rank of genes in gene set: 9524.84
Median rank of genes in gene set: 9424.5
Rank on gene expression program of top 30 genes in gene set:
| Genes | Weight | Rank | GTEx | DepMap | Descartes | Mean.Counts | Mean.TPM |
|---|---|---|---|---|---|---|---|
| ID1 | 0.0002325 | 1074 | GTEx | DepMap | Descartes | 0.35 | 122.09 |
| APLNR | 0.0002173 | 1166 | GTEx | DepMap | Descartes | 0.10 | 15.21 |
| HYAL2 | 0.0002045 | 1236 | GTEx | DepMap | Descartes | 0.22 | 23.98 |
| CALCRL | 0.0001850 | 1355 | GTEx | DepMap | Descartes | 1.09 | 84.97 |
| NPR1 | 0.0001682 | 1497 | GTEx | DepMap | Descartes | 0.05 | 6.06 |
| ESM1 | 0.0001569 | 1607 | GTEx | DepMap | Descartes | 0.12 | 24.63 |
| SOX18 | 0.0001340 | 1813 | GTEx | DepMap | Descartes | 0.14 | 32.98 |
| TEK | 0.0000992 | 2363 | GTEx | DepMap | Descartes | 0.23 | 19.07 |
| RAMP2 | 0.0000958 | 2423 | GTEx | DepMap | Descartes | 0.21 | 109.74 |
| PODXL | 0.0000920 | 2507 | GTEx | DepMap | Descartes | 0.37 | 24.36 |
| KDR | 0.0000712 | 3045 | GTEx | DepMap | Descartes | 0.14 | 10.72 |
| MMRN2 | 0.0000698 | 3091 | GTEx | DepMap | Descartes | 0.14 | 15.45 |
| PLVAP | 0.0000663 | 3209 | GTEx | DepMap | Descartes | 0.26 | 46.07 |
| RASIP1 | 0.0000543 | 3603 | GTEx | DepMap | Descartes | 0.09 | 12.70 |
| TM4SF18 | 0.0000517 | 3720 | GTEx | DepMap | Descartes | 0.06 | 6.28 |
| SHE | 0.0000487 | 3846 | GTEx | DepMap | Descartes | 0.10 | 6.27 |
| EHD3 | 0.0000478 | 3877 | GTEx | DepMap | Descartes | 0.35 | 27.90 |
| CLDN5 | 0.0000257 | 5015 | GTEx | DepMap | Descartes | 0.16 | 24.46 |
| CDH5 | 0.0000173 | 5621 | GTEx | DepMap | Descartes | 0.14 | 13.07 |
| CRHBP | 0.0000162 | 5720 | GTEx | DepMap | Descartes | 0.03 | 7.90 |
| ROBO4 | 0.0000090 | 6392 | GTEx | DepMap | Descartes | 0.08 | 7.91 |
| ECSCR | -0.0000005 | 8475 | GTEx | DepMap | Descartes | 0.00 | 0.18 |
| FCGR2B | -0.0000071 | 10374 | GTEx | DepMap | Descartes | 0.02 | 2.39 |
| F8 | -0.0000072 | 10384 | GTEx | DepMap | Descartes | 0.15 | 7.41 |
| TIE1 | -0.0000124 | 11413 | GTEx | DepMap | Descartes | 0.10 | 10.05 |
| FLT4 | -0.0000230 | 12890 | GTEx | DepMap | Descartes | 0.05 | 3.47 |
| DNASE1L3 | -0.0000330 | 13851 | GTEx | DepMap | Descartes | 0.07 | 13.52 |
| CYP26B1 | -0.0000398 | 14402 | GTEx | DepMap | Descartes | 0.04 | 3.95 |
| BTNL9 | -0.0000481 | 15048 | GTEx | DepMap | Descartes | 0.08 | 8.46 |
| IRX3 | -0.0000490 | 15115 | GTEx | DepMap | Descartes | 0.01 | 1.69 |
Descartes stromal markers
Top 50 marker genes of stromal cells in the Decartes fetal adrenal single cell map (https://atlas.brotmanbaty.org/bbi/human-gene-expression-during-development/cell/stromal/in/adrenal)
Wilcoxon ranksum test P-value for gene set overrepresentation: 1.24e-19
Mean rank of genes in gene set: 2670.84
Median rank of genes in gene set: 150
Rank on gene expression program of top 30 genes in gene set:
| Genes | Weight | Rank | GTEx | DepMap | Descartes | Mean.Counts | Mean.TPM |
|---|---|---|---|---|---|---|---|
| COL3A1 | 0.0091022 | 1 | GTEx | DepMap | Descartes | 22.70 | 2636.24 |
| COL1A2 | 0.0090765 | 2 | GTEx | DepMap | Descartes | 25.13 | 2704.87 |
| COL1A1 | 0.0089022 | 3 | GTEx | DepMap | Descartes | 26.11 | 2919.87 |
| LUM | 0.0079013 | 5 | GTEx | DepMap | Descartes | 3.34 | 760.33 |
| MGP | 0.0076330 | 6 | GTEx | DepMap | Descartes | 9.18 | 3183.28 |
| SFRP2 | 0.0059625 | 9 | GTEx | DepMap | Descartes | 1.48 | 455.13 |
| DCN | 0.0057837 | 10 | GTEx | DepMap | Descartes | 3.84 | 333.99 |
| POSTN | 0.0053938 | 12 | GTEx | DepMap | Descartes | 5.02 | 937.88 |
| CCDC80 | 0.0051759 | 15 | GTEx | DepMap | Descartes | 2.32 | 114.52 |
| LOX | 0.0045611 | 21 | GTEx | DepMap | Descartes | 0.39 | 45.05 |
| ISLR | 0.0042190 | 26 | GTEx | DepMap | Descartes | 0.48 | 125.10 |
| COL6A3 | 0.0038533 | 30 | GTEx | DepMap | Descartes | 6.38 | 385.35 |
| FNDC1 | 0.0037311 | 31 | GTEx | DepMap | Descartes | 0.84 | 81.35 |
| CDH11 | 0.0027664 | 50 | GTEx | DepMap | Descartes | 4.77 | 393.24 |
| PDGFRA | 0.0022798 | 69 | GTEx | DepMap | Descartes | 0.42 | 37.37 |
| PRICKLE1 | 0.0021912 | 72 | GTEx | DepMap | Descartes | 4.81 | 471.50 |
| IGFBP3 | 0.0021357 | 74 | GTEx | DepMap | Descartes | 0.61 | 120.08 |
| MXRA5 | 0.0021195 | 77 | GTEx | DepMap | Descartes | 0.42 | 26.05 |
| PRRX1 | 0.0017384 | 92 | GTEx | DepMap | Descartes | 2.56 | 370.34 |
| CD248 | 0.0015997 | 105 | GTEx | DepMap | Descartes | 0.18 | 39.76 |
| C7 | 0.0014879 | 117 | GTEx | DepMap | Descartes | 6.19 | 686.04 |
| PCOLCE | 0.0014044 | 126 | GTEx | DepMap | Descartes | 0.73 | 282.32 |
| ITGA11 | 0.0013903 | 128 | GTEx | DepMap | Descartes | 1.65 | 103.67 |
| EDNRA | 0.0013743 | 131 | GTEx | DepMap | Descartes | 1.35 | 192.89 |
| OGN | 0.0012791 | 150 | GTEx | DepMap | Descartes | 0.39 | 64.58 |
| COL12A1 | 0.0011773 | 170 | GTEx | DepMap | Descartes | 3.33 | 163.95 |
| DKK2 | 0.0010957 | 188 | GTEx | DepMap | Descartes | 0.49 | 67.30 |
| ADAMTS2 | 0.0010937 | 190 | GTEx | DepMap | Descartes | 1.91 | 178.69 |
| PCDH18 | 0.0009684 | 219 | GTEx | DepMap | Descartes | 0.21 | 21.68 |
| GLI2 | 0.0009255 | 239 | GTEx | DepMap | Descartes | 1.34 | 122.23 |
Descartes sympathoblasts markers
Top 50 marker genes of sympathoblasts cells in the Decartes fetal adrenal single cell map (https://atlas.brotmanbaty.org/bbi/human-gene-expression-during-development/cell/sympathoblasts/in/adrenal)
Wilcoxon ranksum test P-value for gene set overrepresentation: 1.00e+00
Mean rank of genes in gene set: 17640.37
Median rank of genes in gene set: 18612
Rank on gene expression program of top 30 genes in gene set:
| Genes | Weight | Rank | GTEx | DepMap | Descartes | Mean.Counts | Mean.TPM |
|---|---|---|---|---|---|---|---|
| SCG2 | 0.0000848 | 2672 | GTEx | DepMap | Descartes | 4.50 | 990.71 |
| TMEM130 | 0.0000005 | 7615 | GTEx | DepMap | Descartes | 0.36 | 41.04 |
| PNMT | -0.0000178 | 12257 | GTEx | DepMap | Descartes | 0.01 | 6.92 |
| HTATSF1 | -0.0000390 | 14342 | GTEx | DepMap | Descartes | 0.24 | 43.68 |
| ST18 | -0.0000426 | 14628 | GTEx | DepMap | Descartes | 0.09 | 5.25 |
| SORCS3 | -0.0000463 | 14892 | GTEx | DepMap | Descartes | 0.25 | 15.63 |
| SLC24A2 | -0.0000495 | 15159 | GTEx | DepMap | Descartes | 0.15 | 4.54 |
| GRID2 | -0.0000619 | 15938 | GTEx | DepMap | Descartes | 0.55 | 31.70 |
| SLC35F3 | -0.0000654 | 16113 | GTEx | DepMap | Descartes | 0.43 | 33.68 |
| DGKK | -0.0000792 | 16805 | GTEx | DepMap | Descartes | 0.05 | 2.45 |
| PCSK1N | -0.0000806 | 16858 | GTEx | DepMap | Descartes | 1.73 | 853.06 |
| C1QL1 | -0.0000874 | 17149 | GTEx | DepMap | Descartes | 0.07 | 22.20 |
| CDH12 | -0.0000940 | 17385 | GTEx | DepMap | Descartes | 0.89 | 71.55 |
| SLC18A1 | -0.0000994 | 17588 | GTEx | DepMap | Descartes | 0.05 | 6.50 |
| PENK | -0.0001113 | 17992 | GTEx | DepMap | Descartes | 0.03 | 15.83 |
| ARC | -0.0001149 | 18101 | GTEx | DepMap | Descartes | 0.04 | 6.64 |
| PCSK2 | -0.0001229 | 18322 | GTEx | DepMap | Descartes | 0.27 | 19.52 |
| INSM1 | -0.0001233 | 18328 | GTEx | DepMap | Descartes | 0.04 | 7.45 |
| CNTN3 | -0.0001245 | 18360 | GTEx | DepMap | Descartes | 0.17 | 12.19 |
| CDH18 | -0.0001254 | 18376 | GTEx | DepMap | Descartes | 0.43 | 27.21 |
| CNTNAP5 | -0.0001261 | 18383 | GTEx | DepMap | Descartes | 0.39 | 18.50 |
| EML6 | -0.0001366 | 18612 | GTEx | DepMap | Descartes | 0.71 | 20.65 |
| GRM7 | -0.0001416 | 18722 | GTEx | DepMap | Descartes | 0.66 | 67.33 |
| KSR2 | -0.0001417 | 18728 | GTEx | DepMap | Descartes | 0.31 | 5.58 |
| NTNG1 | -0.0001488 | 18845 | GTEx | DepMap | Descartes | 0.79 | 59.64 |
| FGF14 | -0.0001500 | 18867 | GTEx | DepMap | Descartes | 4.20 | 133.45 |
| CHGA | -0.0001568 | 18997 | GTEx | DepMap | Descartes | 0.43 | 117.58 |
| PACRG | -0.0001577 | 19013 | GTEx | DepMap | Descartes | 0.49 | 111.62 |
| SPOCK3 | -0.0001612 | 19067 | GTEx | DepMap | Descartes | 0.21 | 27.90 |
| MGAT4C | -0.0001696 | 19199 | GTEx | DepMap | Descartes | 1.33 | 31.08 |
Descartes erythroblasts markers
Top 50 marker genes of erythroblasts cells in the Decartes fetal adrenal single cell map (https://atlas.brotmanbaty.org/bbi/human-gene-expression-during-development/cell/erythroblasts/in/adrenal)
Wilcoxon ranksum test P-value for gene set overrepresentation: 1.00e+00
Mean rank of genes in gene set: 13446.35
Median rank of genes in gene set: 13591
Rank on gene expression program of top 30 genes in gene set:
| Genes | Weight | Rank | GTEx | DepMap | Descartes | Mean.Counts | Mean.TPM |
|---|---|---|---|---|---|---|---|
| MICAL2 | 0.0007909 | 280 | GTEx | DepMap | Descartes | 2.39 | 212.30 |
| GYPC | 0.0002221 | 1137 | GTEx | DepMap | Descartes | 0.23 | 70.09 |
| SELENBP1 | 0.0000502 | 3784 | GTEx | DepMap | Descartes | 0.04 | 9.04 |
| HBB | 0.0000252 | 5050 | GTEx | DepMap | Descartes | 0.21 | 188.35 |
| CPOX | 0.0000154 | 5765 | GTEx | DepMap | Descartes | 0.04 | 7.39 |
| GYPE | 0.0000071 | 6583 | GTEx | DepMap | Descartes | 0.05 | 13.04 |
| CAT | 0.0000030 | 7120 | GTEx | DepMap | Descartes | 0.29 | 59.81 |
| HBG1 | 0.0000022 | 7262 | GTEx | DepMap | Descartes | 0.00 | 0.07 |
| HBG2 | 0.0000000 | 8122 | GTEx | DepMap | Descartes | 0.00 | 0.00 |
| GYPB | -0.0000025 | 9147 | GTEx | DepMap | Descartes | 0.01 | 6.45 |
| GYPA | -0.0000051 | 9869 | GTEx | DepMap | Descartes | 0.00 | 0.61 |
| RHCE | -0.0000079 | 10558 | GTEx | DepMap | Descartes | 0.04 | 10.01 |
| HBZ | -0.0000091 | 10813 | GTEx | DepMap | Descartes | 0.00 | 3.33 |
| HEMGN | -0.0000113 | 11234 | GTEx | DepMap | Descartes | 0.00 | 0.68 |
| SPTA1 | -0.0000143 | 11729 | GTEx | DepMap | Descartes | 0.00 | 0.27 |
| HBA2 | -0.0000151 | 11843 | GTEx | DepMap | Descartes | 0.06 | 58.20 |
| HBA1 | -0.0000180 | 12280 | GTEx | DepMap | Descartes | 0.02 | 20.20 |
| AHSP | -0.0000183 | 12321 | GTEx | DepMap | Descartes | 0.00 | 0.26 |
| EPB42 | -0.0000204 | 12581 | GTEx | DepMap | Descartes | 0.00 | 0.21 |
| ALAS2 | -0.0000248 | 13077 | GTEx | DepMap | Descartes | 0.00 | 0.67 |
| HBM | -0.0000264 | 13229 | GTEx | DepMap | Descartes | 0.00 | 1.04 |
| SLC25A37 | -0.0000267 | 13257 | GTEx | DepMap | Descartes | 0.61 | 58.05 |
| ABCB10 | -0.0000288 | 13459 | GTEx | DepMap | Descartes | 0.29 | 37.36 |
| FECH | -0.0000317 | 13723 | GTEx | DepMap | Descartes | 0.14 | 8.42 |
| SLC4A1 | -0.0000328 | 13836 | GTEx | DepMap | Descartes | 0.00 | 0.40 |
| SLC25A21 | -0.0000360 | 14104 | GTEx | DepMap | Descartes | 0.11 | 13.75 |
| RHAG | -0.0000366 | 14156 | GTEx | DepMap | Descartes | 0.00 | 0.71 |
| CR1L | -0.0000423 | 14600 | GTEx | DepMap | Descartes | 0.03 | 7.39 |
| BLVRB | -0.0000468 | 14927 | GTEx | DepMap | Descartes | 0.22 | 81.64 |
| TMCC2 | -0.0000592 | 15789 | GTEx | DepMap | Descartes | 0.07 | 7.88 |
Descartes myeloid markers
Top 50 marker genes of myeloid cells in the Decartes fetal adrenal single cell map (https://atlas.brotmanbaty.org/bbi/human-gene-expression-during-development/cell/myeloid/in/adrenal)
Wilcoxon ranksum test P-value for gene set overrepresentation: 1.56e-01
Mean rank of genes in gene set: 9437.8
Median rank of genes in gene set: 6201
Rank on gene expression program of top 30 genes in gene set:
| Genes | Weight | Rank | GTEx | DepMap | Descartes | Mean.Counts | Mean.TPM |
|---|---|---|---|---|---|---|---|
| CST3 | 0.0014681 | 121 | GTEx | DepMap | Descartes | 1.78 | 298.75 |
| CTSC | 0.0006952 | 333 | GTEx | DepMap | Descartes | 0.81 | 71.29 |
| TGFBI | 0.0005205 | 457 | GTEx | DepMap | Descartes | 0.77 | 90.61 |
| CTSB | 0.0003577 | 698 | GTEx | DepMap | Descartes | 1.17 | 153.26 |
| ABCA1 | 0.0002173 | 1167 | GTEx | DepMap | Descartes | 1.64 | 82.91 |
| SPP1 | 0.0001911 | 1322 | GTEx | DepMap | Descartes | 1.55 | 467.28 |
| FGL2 | 0.0001833 | 1373 | GTEx | DepMap | Descartes | 0.15 | 19.74 |
| HLA-DPA1 | 0.0001796 | 1408 | GTEx | DepMap | Descartes | 0.36 | 38.59 |
| ITPR2 | 0.0001410 | 1757 | GTEx | DepMap | Descartes | 2.93 | 115.88 |
| HLA-DRA | 0.0001335 | 1818 | GTEx | DepMap | Descartes | 0.59 | 238.05 |
| LGMN | 0.0001239 | 1948 | GTEx | DepMap | Descartes | 0.58 | 131.31 |
| CD14 | 0.0001238 | 1951 | GTEx | DepMap | Descartes | 0.16 | 53.57 |
| C1QB | 0.0001131 | 2113 | GTEx | DepMap | Descartes | 0.19 | 101.72 |
| RNASE1 | 0.0001076 | 2209 | GTEx | DepMap | Descartes | 0.14 | 69.16 |
| IFNGR1 | 0.0000995 | 2353 | GTEx | DepMap | Descartes | 0.49 | 99.09 |
| C1QA | 0.0000969 | 2401 | GTEx | DepMap | Descartes | 0.20 | 107.30 |
| C1QC | 0.0000889 | 2568 | GTEx | DepMap | Descartes | 0.13 | 58.50 |
| CTSS | 0.0000775 | 2862 | GTEx | DepMap | Descartes | 0.35 | 42.04 |
| HLA-DRB1 | 0.0000668 | 3180 | GTEx | DepMap | Descartes | 0.16 | 61.99 |
| CD74 | 0.0000590 | 3445 | GTEx | DepMap | Descartes | 1.09 | 173.68 |
| MS4A7 | 0.0000309 | 4722 | GTEx | DepMap | Descartes | 0.02 | 3.84 |
| MPEG1 | 0.0000264 | 4978 | GTEx | DepMap | Descartes | 0.06 | 7.38 |
| CYBB | 0.0000185 | 5522 | GTEx | DepMap | Descartes | 0.01 | 1.32 |
| CTSD | 0.0000150 | 5790 | GTEx | DepMap | Descartes | 0.00 | 0.02 |
| VSIG4 | 0.0000107 | 6201 | GTEx | DepMap | Descartes | 0.03 | 5.38 |
| MS4A6A | -0.0000071 | 10367 | GTEx | DepMap | Descartes | 0.19 | 37.37 |
| CPVL | -0.0000129 | 11516 | GTEx | DepMap | Descartes | 0.30 | 61.46 |
| MS4A4A | -0.0000276 | 13352 | GTEx | DepMap | Descartes | 0.14 | 35.70 |
| CSF1R | -0.0000425 | 14619 | GTEx | DepMap | Descartes | 0.17 | 20.69 |
| AXL | -0.0000510 | 15256 | GTEx | DepMap | Descartes | 0.90 | 103.70 |
Descartes Schwann markers
Top 50 marker genes of Schwann cells in the Decartes fetal adrenal single cell map (https://atlas.brotmanbaty.org/bbi/human-gene-expression-during-development/cell/schwann/in/adrenal)
Wilcoxon ranksum test P-value for gene set overrepresentation: 9.99e-01
Mean rank of genes in gene set: 12936.33
Median rank of genes in gene set: 19002
Rank on gene expression program of top 30 genes in gene set:
| Genes | Weight | Rank | GTEx | DepMap | Descartes | Mean.Counts | Mean.TPM |
|---|---|---|---|---|---|---|---|
| VCAN | 0.0047246 | 19 | GTEx | DepMap | Descartes | 7.91 | 358.23 |
| COL5A2 | 0.0026329 | 57 | GTEx | DepMap | Descartes | 5.51 | 475.88 |
| VIM | 0.0017469 | 91 | GTEx | DepMap | Descartes | 4.66 | 950.51 |
| SFRP1 | 0.0015817 | 107 | GTEx | DepMap | Descartes | 0.83 | 100.21 |
| KCTD12 | 0.0010582 | 205 | GTEx | DepMap | Descartes | 0.55 | 44.21 |
| MARCKS | 0.0008674 | 251 | GTEx | DepMap | Descartes | 1.98 | 253.14 |
| COL18A1 | 0.0006522 | 356 | GTEx | DepMap | Descartes | 3.12 | 277.87 |
| PMP22 | 0.0006177 | 380 | GTEx | DepMap | Descartes | 1.33 | 364.10 |
| LAMA4 | 0.0005382 | 446 | GTEx | DepMap | Descartes | 2.88 | 215.20 |
| LAMB1 | 0.0004795 | 494 | GTEx | DepMap | Descartes | 2.70 | 263.55 |
| ERBB4 | 0.0002056 | 1231 | GTEx | DepMap | Descartes | 2.37 | 67.46 |
| LAMC1 | 0.0001981 | 1280 | GTEx | DepMap | Descartes | 1.88 | 127.15 |
| ADAMTS5 | 0.0001469 | 1699 | GTEx | DepMap | Descartes | 0.21 | 10.62 |
| PLP1 | 0.0001191 | 2024 | GTEx | DepMap | Descartes | 0.19 | 25.92 |
| PTN | 0.0000533 | 3644 | GTEx | DepMap | Descartes | 0.38 | 121.95 |
| MDGA2 | 0.0000338 | 4573 | GTEx | DepMap | Descartes | 0.93 | 57.55 |
| FIGN | -0.0000116 | 11276 | GTEx | DepMap | Descartes | 1.98 | 113.02 |
| MPZ | -0.0000263 | 13216 | GTEx | DepMap | Descartes | 0.12 | 25.66 |
| NRXN3 | -0.0000311 | 13662 | GTEx | DepMap | Descartes | 5.23 | 274.17 |
| TRPM3 | -0.0000476 | 14988 | GTEx | DepMap | Descartes | 0.72 | 19.20 |
| SOX10 | -0.0000508 | 15250 | GTEx | DepMap | Descartes | 0.09 | 13.02 |
| GAS7 | -0.0000572 | 15677 | GTEx | DepMap | Descartes | 2.09 | 142.46 |
| ERBB3 | -0.0000886 | 17182 | GTEx | DepMap | Descartes | 0.05 | 3.82 |
| PTPRZ1 | -0.0001230 | 18324 | GTEx | DepMap | Descartes | 0.41 | 21.52 |
| GFRA3 | -0.0001570 | 19002 | GTEx | DepMap | Descartes | 0.10 | 24.14 |
| HMGA2 | -0.0001637 | 19106 | GTEx | DepMap | Descartes | 0.17 | 11.86 |
| PPP2R2B | -0.0001692 | 19195 | GTEx | DepMap | Descartes | 2.72 | 79.33 |
| LRRTM4 | -0.0001767 | 19282 | GTEx | DepMap | Descartes | 1.99 | 194.02 |
| XKR4 | -0.0001879 | 19423 | GTEx | DepMap | Descartes | 1.52 | 28.88 |
| ZNF536 | -0.0002038 | 19597 | GTEx | DepMap | Descartes | 0.91 | 63.49 |
Descartes Megakaryocytes markers
Top 50 marker genes of Megakaryocytes cells in the Decartes fetal adrenal single cell map (https://atlas.brotmanbaty.org/bbi/human-gene-expression-during-development/cell/megakaryocytes/in/adrenal)
Wilcoxon ranksum test P-value for gene set overrepresentation: 6.83e-01
Mean rank of genes in gene set: 10696.24
Median rank of genes in gene set: 10841
Rank on gene expression program of top 30 genes in gene set:
| Genes | Weight | Rank | GTEx | DepMap | Descartes | Mean.Counts | Mean.TPM |
|---|---|---|---|---|---|---|---|
| GSN | 0.0016426 | 101 | GTEx | DepMap | Descartes | 2.33 | 203.34 |
| FLNA | 0.0011797 | 169 | GTEx | DepMap | Descartes | 1.21 | 78.73 |
| THBS1 | 0.0008961 | 248 | GTEx | DepMap | Descartes | 4.47 | 326.27 |
| TMSB4X | 0.0008092 | 269 | GTEx | DepMap | Descartes | 5.47 | 1804.71 |
| ACTB | 0.0007354 | 305 | GTEx | DepMap | Descartes | 5.18 | 1307.56 |
| MYLK | 0.0003943 | 617 | GTEx | DepMap | Descartes | 1.14 | 64.38 |
| TLN1 | 0.0003858 | 638 | GTEx | DepMap | Descartes | 0.69 | 41.83 |
| TGFB1 | 0.0002654 | 942 | GTEx | DepMap | Descartes | 0.65 | 128.24 |
| MYH9 | 0.0002572 | 973 | GTEx | DepMap | Descartes | 2.73 | 196.75 |
| CD9 | 0.0002501 | 1005 | GTEx | DepMap | Descartes | 1.04 | 270.21 |
| TPM4 | 0.0001942 | 1309 | GTEx | DepMap | Descartes | 2.45 | 270.35 |
| SLC24A3 | 0.0001855 | 1354 | GTEx | DepMap | Descartes | 1.90 | 282.50 |
| DOK6 | 0.0001270 | 1901 | GTEx | DepMap | Descartes | 1.57 | 93.67 |
| STOM | 0.0001252 | 1931 | GTEx | DepMap | Descartes | 0.68 | 104.05 |
| PPBP | 0.0000256 | 5026 | GTEx | DepMap | Descartes | 0.00 | 0.26 |
| ZYX | 0.0000229 | 5190 | GTEx | DepMap | Descartes | 0.27 | 62.23 |
| PF4 | 0.0000185 | 5521 | GTEx | DepMap | Descartes | 0.00 | 0.46 |
| FERMT3 | 0.0000165 | 5681 | GTEx | DepMap | Descartes | 0.08 | 15.49 |
| GP1BA | 0.0000112 | 6144 | GTEx | DepMap | Descartes | 0.02 | 4.39 |
| TUBB1 | 0.0000075 | 6541 | GTEx | DepMap | Descartes | 0.01 | 1.58 |
| SPN | 0.0000020 | 7306 | GTEx | DepMap | Descartes | 0.00 | 0.00 |
| GP9 | -0.0000038 | 9516 | GTEx | DepMap | Descartes | 0.00 | 0.00 |
| ITGB3 | -0.0000041 | 9622 | GTEx | DepMap | Descartes | 0.00 | 0.08 |
| CD84 | -0.0000067 | 10266 | GTEx | DepMap | Descartes | 0.09 | 4.98 |
| PSTPIP2 | -0.0000092 | 10841 | GTEx | DepMap | Descartes | 0.14 | 24.60 |
| PLEK | -0.0000144 | 11745 | GTEx | DepMap | Descartes | 0.08 | 12.02 |
| P2RX1 | -0.0000441 | 14729 | GTEx | DepMap | Descartes | 0.02 | 3.40 |
| LTBP1 | -0.0000506 | 15237 | GTEx | DepMap | Descartes | 1.52 | 125.03 |
| BIN2 | -0.0000597 | 15820 | GTEx | DepMap | Descartes | 0.05 | 9.45 |
| ITGA2B | -0.0000601 | 15838 | GTEx | DepMap | Descartes | 0.05 | 5.99 |
Descartes Lyphoid markers
Top 50 marker genes of Lyphoid cells in the Decartes fetal adrenal single cell map (https://atlas.brotmanbaty.org/bbi/human-gene-expression-during-development/cell/lymphoid/in/adrenal)
Wilcoxon ranksum test P-value for gene set overrepresentation: 1.00e+00
Mean rank of genes in gene set: 13584.34
Median rank of genes in gene set: 18536
Rank on gene expression program of top 30 genes in gene set:
| Genes | Weight | Rank | GTEx | DepMap | Descartes | Mean.Counts | Mean.TPM |
|---|---|---|---|---|---|---|---|
| B2M | 0.0006123 | 383 | GTEx | DepMap | Descartes | 6.32 | 1422.81 |
| HLA-C | 0.0004832 | 490 | GTEx | DepMap | Descartes | 0.57 | 156.96 |
| HLA-A | 0.0004661 | 508 | GTEx | DepMap | Descartes | 1.11 | 106.21 |
| HLA-B | 0.0004113 | 592 | GTEx | DepMap | Descartes | 0.77 | 246.04 |
| TMSB10 | 0.0003942 | 618 | GTEx | DepMap | Descartes | 5.35 | 6704.91 |
| FOXP1 | 0.0003344 | 742 | GTEx | DepMap | Descartes | 0.45 | 26.38 |
| IFI16 | 0.0003039 | 808 | GTEx | DepMap | Descartes | 1.14 | 148.57 |
| SAMD3 | 0.0001823 | 1380 | GTEx | DepMap | Descartes | 0.55 | 81.10 |
| LEF1 | 0.0001819 | 1384 | GTEx | DepMap | Descartes | 0.98 | 136.00 |
| SP100 | 0.0000975 | 2392 | GTEx | DepMap | Descartes | 1.41 | 144.10 |
| MCTP2 | 0.0000914 | 2514 | GTEx | DepMap | Descartes | 0.38 | 23.15 |
| CCL5 | 0.0000274 | 4914 | GTEx | DepMap | Descartes | 0.05 | 20.68 |
| MSN | 0.0000221 | 5254 | GTEx | DepMap | Descartes | 0.94 | 116.32 |
| ARHGDIB | 0.0000096 | 6331 | GTEx | DepMap | Descartes | 0.17 | 80.30 |
| NKG7 | 0.0000070 | 6599 | GTEx | DepMap | Descartes | 0.01 | 9.71 |
| PLEKHA2 | -0.0000128 | 11506 | GTEx | DepMap | Descartes | 0.96 | 93.78 |
| WIPF1 | -0.0000279 | 13382 | GTEx | DepMap | Descartes | 1.26 | 136.61 |
| LCP1 | -0.0000637 | 16033 | GTEx | DepMap | Descartes | 0.14 | 16.60 |
| GNG2 | -0.0000822 | 16922 | GTEx | DepMap | Descartes | 1.09 | 137.81 |
| PTPRC | -0.0000970 | 17491 | GTEx | DepMap | Descartes | 0.47 | 43.07 |
| IKZF1 | -0.0001037 | 17755 | GTEx | DepMap | Descartes | 0.20 | 15.81 |
| ITPKB | -0.0001097 | 17944 | GTEx | DepMap | Descartes | 0.49 | 38.50 |
| SKAP1 | -0.0001111 | 17987 | GTEx | DepMap | Descartes | 0.24 | 64.87 |
| PRKCH | -0.0001326 | 18536 | GTEx | DepMap | Descartes | 0.93 | 121.22 |
| SORL1 | -0.0001344 | 18564 | GTEx | DepMap | Descartes | 0.36 | 15.33 |
| CCND3 | -0.0001634 | 19099 | GTEx | DepMap | Descartes | 0.98 | 227.93 |
| SCML4 | -0.0001648 | 19120 | GTEx | DepMap | Descartes | 0.18 | 14.82 |
| FYN | -0.0001944 | 19505 | GTEx | DepMap | Descartes | 2.20 | 286.60 |
| STK39 | -0.0001980 | 19538 | GTEx | DepMap | Descartes | 1.38 | 196.67 |
| DOCK10 | -0.0001989 | 19549 | GTEx | DepMap | Descartes | 2.10 | 151.13 |
Embryonic Pausing Signatures Up
Embryonic pausing signature upregulated genes from Supplementary Table 6 of Rehman et al. Cell 2021. These genes are upregulated in paused ESCs and diapaused embryos.
Wilcoxon ranksum test P-value for gene set overrepresentation: 6.88e-04
Mean rank of genes in gene set: 5225.43
Median rank of genes in gene set: 3924.5
Rank on gene expression program of top 30 genes in gene set:
| Genes | Weight | Rank | GTEx | DepMap | Descartes | Mean.Counts | Mean.TPM |
|---|---|---|---|---|---|---|---|
| APOE | 0.0011160 | 185 | GTEx | DepMap | Descartes | 2.96 | 1405.34 |
| HEXB | 0.0005071 | 466 | GTEx | DepMap | Descartes | 0.43 | 110.08 |
| SPRY1 | 0.0004274 | 563 | GTEx | DepMap | Descartes | 0.71 | 142.98 |
| HEXA | 0.0003277 | 756 | GTEx | DepMap | Descartes | 0.07 | 5.09 |
| CTSL | 0.0002877 | 859 | GTEx | DepMap | Descartes | 0.60 | NA |
| DPP7 | 0.0002496 | 1008 | GTEx | DepMap | Descartes | 0.35 | 119.03 |
| PDCD4 | 0.0000571 | 3508 | GTEx | DepMap | Descartes | 0.77 | 105.31 |
| CCNG2 | 0.0000381 | 4341 | GTEx | DepMap | Descartes | 0.27 | 26.38 |
| YPEL2 | 0.0000375 | 4371 | GTEx | DepMap | Descartes | 0.97 | 92.75 |
| ALDH6A1 | 0.0000307 | 4737 | GTEx | DepMap | Descartes | 0.11 | 10.46 |
| LY6G6E | 0.0000000 | 8215 | GTEx | DepMap | Descartes | 0.00 | 0.00 |
| RENBP | -0.0000044 | 9702 | GTEx | DepMap | Descartes | 0.07 | 27.44 |
| ACSS1 | -0.0000593 | 15796 | GTEx | DepMap | Descartes | 0.15 | 16.95 |
| AUH | -0.0001380 | 18649 | GTEx | DepMap | Descartes | 1.19 | 347.81 |
Embryonic Pausing Signatures Down
Embryonic pausing signature downregulated genes from Supplementary Table 6 of Rehman et al. Cell 2021. These genes are downregulated in paused ESCs and diapaused embryos.
Wilcoxon ranksum test P-value for gene set overrepresentation: 1.47e-06
Mean rank of genes in gene set: 7589.32
Median rank of genes in gene set: 5494
Rank on gene expression program of top 30 genes in gene set:
| Genes | Weight | Rank | GTEx | DepMap | Descartes | Mean.Counts | Mean.TPM |
|---|---|---|---|---|---|---|---|
| ID3 | 0.0025160 | 62 | GTEx | DepMap | Descartes | 1.08 | 622.50 |
| ARPC1B | 0.0007914 | 279 | GTEx | DepMap | Descartes | 0.25 | 68.91 |
| P4HB | 0.0006255 | 372 | GTEx | DepMap | Descartes | 0.96 | 207.05 |
| TMEM109 | 0.0003879 | 633 | GTEx | DepMap | Descartes | 0.14 | 33.04 |
| DAD1 | 0.0003162 | 777 | GTEx | DepMap | Descartes | 0.48 | 382.71 |
| RPS27L | 0.0002949 | 835 | GTEx | DepMap | Descartes | 0.70 | 61.76 |
| HDLBP | 0.0002928 | 842 | GTEx | DepMap | Descartes | 1.33 | 110.49 |
| POLR2L | 0.0002681 | 932 | GTEx | DepMap | Descartes | 0.38 | 223.08 |
| SLC25A5 | 0.0002581 | 968 | GTEx | DepMap | Descartes | 0.31 | 128.23 |
| S100A6 | 0.0002257 | 1118 | GTEx | DepMap | Descartes | 2.94 | 1934.59 |
| NDUFC1 | 0.0002251 | 1121 | GTEx | DepMap | Descartes | 0.40 | 163.77 |
| ANKRD37 | 0.0002240 | 1132 | GTEx | DepMap | Descartes | 0.09 | 31.06 |
| PRADC1 | 0.0002212 | 1145 | GTEx | DepMap | Descartes | 0.08 | 35.65 |
| RPL41 | 0.0002082 | 1221 | GTEx | DepMap | Descartes | 2.52 | 1984.71 |
| SEC13 | 0.0001869 | 1343 | GTEx | DepMap | Descartes | 0.47 | 106.80 |
| PGAM1 | 0.0001716 | 1464 | GTEx | DepMap | Descartes | 0.35 | 103.17 |
| TMEM258 | 0.0001675 | 1508 | GTEx | DepMap | Descartes | 0.54 | NA |
| RPS19BP1 | 0.0001619 | 1550 | GTEx | DepMap | Descartes | 0.28 | 53.23 |
| UQCR10 | 0.0001328 | 1826 | GTEx | DepMap | Descartes | 0.62 | 372.21 |
| ATOX1 | 0.0001259 | 1918 | GTEx | DepMap | Descartes | 0.50 | 61.89 |
| HILPDA | 0.0001231 | 1958 | GTEx | DepMap | Descartes | 0.09 | 37.54 |
| MRPL18 | 0.0001215 | 1983 | GTEx | DepMap | Descartes | 0.22 | 106.93 |
| PDCD5 | 0.0001166 | 2056 | GTEx | DepMap | Descartes | 0.43 | 131.11 |
| CAPG | 0.0001017 | 2319 | GTEx | DepMap | Descartes | 0.06 | 26.30 |
| NAA10 | 0.0001003 | 2344 | GTEx | DepMap | Descartes | 0.06 | 19.43 |
| GNG10 | 0.0000949 | 2447 | GTEx | DepMap | Descartes | 0.01 | 3.11 |
| PSMB10 | 0.0000922 | 2499 | GTEx | DepMap | Descartes | 0.03 | 18.37 |
| UQCRQ | 0.0000863 | 2631 | GTEx | DepMap | Descartes | 0.50 | 176.56 |
| UBE2V1 | 0.0000842 | 2685 | GTEx | DepMap | Descartes | 0.02 | 4.54 |
| PRDX2 | 0.0000827 | 2727 | GTEx | DepMap | Descartes | 0.19 | 63.65 |
Below shows the ranks on this GEP for immune marker gene lists curated by CellTypist (https://www.celltypist.org/encyclopedia).
High ranks indicate this gene is a driver of this GEP.
These curated gene list are ranked by P-value (on this GEP) of their constituent genes.
The Mean Count column shows the mean read count in cells scoring highly (H > 50) on this gene expression program.
Fibroblasts: Fibroblasts (model markers)
the most common cells of connective tissues which synthesize the extracellular matrix and collagen to maintain tissue homeostasis:
Wilcoxon ranksum test P-value for gene set overrepresentation: 1.98e-05
Mean rank of genes in gene set: 2572.2
Rank on gene expression program of genes in gene set:
| Genes | Weight | Rank | GTEx | DepMap | Decartes | Mean.Counts | Mean.TPM |
|---|---|---|---|---|---|---|---|
| PDGFRA | 0.0022798 | 69 | GTEx | DepMap | Descartes | 0.42 | 37.37 |
| MXRA5 | 0.0021195 | 77 | GTEx | DepMap | Descartes | 0.42 | 26.05 |
| PRRX1 | 0.0017384 | 92 | GTEx | DepMap | Descartes | 2.56 | 370.34 |
| SFRP1 | 0.0015817 | 107 | GTEx | DepMap | Descartes | 0.83 | 100.21 |
| OLFML1 | 0.0007686 | 289 | GTEx | DepMap | Descartes | 0.10 | 21.14 |
| SMOC2 | 0.0004403 | 546 | GTEx | DepMap | Descartes | 1.35 | 253.06 |
| NTRK2 | 0.0003362 | 741 | GTEx | DepMap | Descartes | 1.03 | 62.90 |
| ANGPTL1 | 0.0002124 | 1196 | GTEx | DepMap | Descartes | 0.22 | 32.30 |
| F10 | 0.0001124 | 2119 | GTEx | DepMap | Descartes | 0.05 | 18.48 |
| EBF2 | -0.0004346 | 20486 | GTEx | DepMap | Descartes | 1.59 | 173.65 |
Fibroblasts: Fibroblasts (curated markers)
the most common cells of connective tissues which synthesize the extracellular matrix and collagen to maintain tissue homeostasis:
Wilcoxon ranksum test P-value for gene set overrepresentation: 1.36e-03
Mean rank of genes in gene set: 5
Rank on gene expression program of genes in gene set:
| Genes | Weight | Rank | GTEx | DepMap | Decartes | Mean.Counts | Mean.TPM |
|---|---|---|---|---|---|---|---|
| COL1A2 | 0.0090765 | 2 | GTEx | DepMap | Descartes | 25.13 | 2704.87 |
| COL1A1 | 0.0089022 | 3 | GTEx | DepMap | Descartes | 26.11 | 2919.87 |
| DCN | 0.0057837 | 10 | GTEx | DepMap | Descartes | 3.84 | 333.99 |
Monocytes: Monocytes (model markers)
myeloid mononuclear recirculating leukocytes that are capable of differentiating into macrophages and myeloid lineage dendritic cells:
Wilcoxon ranksum test P-value for gene set overrepresentation: 3.87e-03
Mean rank of genes in gene set: 5019
Rank on gene expression program of genes in gene set:
| Genes | Weight | Rank | GTEx | DepMap | Decartes | Mean.Counts | Mean.TPM |
|---|---|---|---|---|---|---|---|
| FTL | 0.0005620 | 429 | GTEx | DepMap | Descartes | 5.19 | 3123.53 |
| HLA-DPB1 | 0.0001573 | 1602 | GTEx | DepMap | Descartes | 0.35 | 46.67 |
| TYROBP | 0.0000745 | 2954 | GTEx | DepMap | Descartes | 0.12 | 94.69 |
| RPS17 | 0.0000450 | 3998 | GTEx | DepMap | Descartes | 0.15 | 41.12 |
| LYZ | 0.0000346 | 4531 | GTEx | DepMap | Descartes | 0.19 | 64.15 |
| SAT1 | 0.0000282 | 4873 | GTEx | DepMap | Descartes | 1.87 | 748.22 |
| TRAC | 0.0000033 | 7069 | GTEx | DepMap | Descartes | 0.02 | 12.51 |
| IGLC2 | 0.0000030 | 7109 | GTEx | DepMap | Descartes | 0.24 | 351.34 |
| IGKC | -0.0000205 | 12606 | GTEx | DepMap | Descartes | 0.83 | 1040.95 |