Program: 24. Plasma Cells.
Program description and justification of annotation generated by GPT5: Plasma cells/Plasmablasts - immunoglobulin secretion with ER stress-UPR.
Submit a comment on this gene expression program's interpretation: CLICK
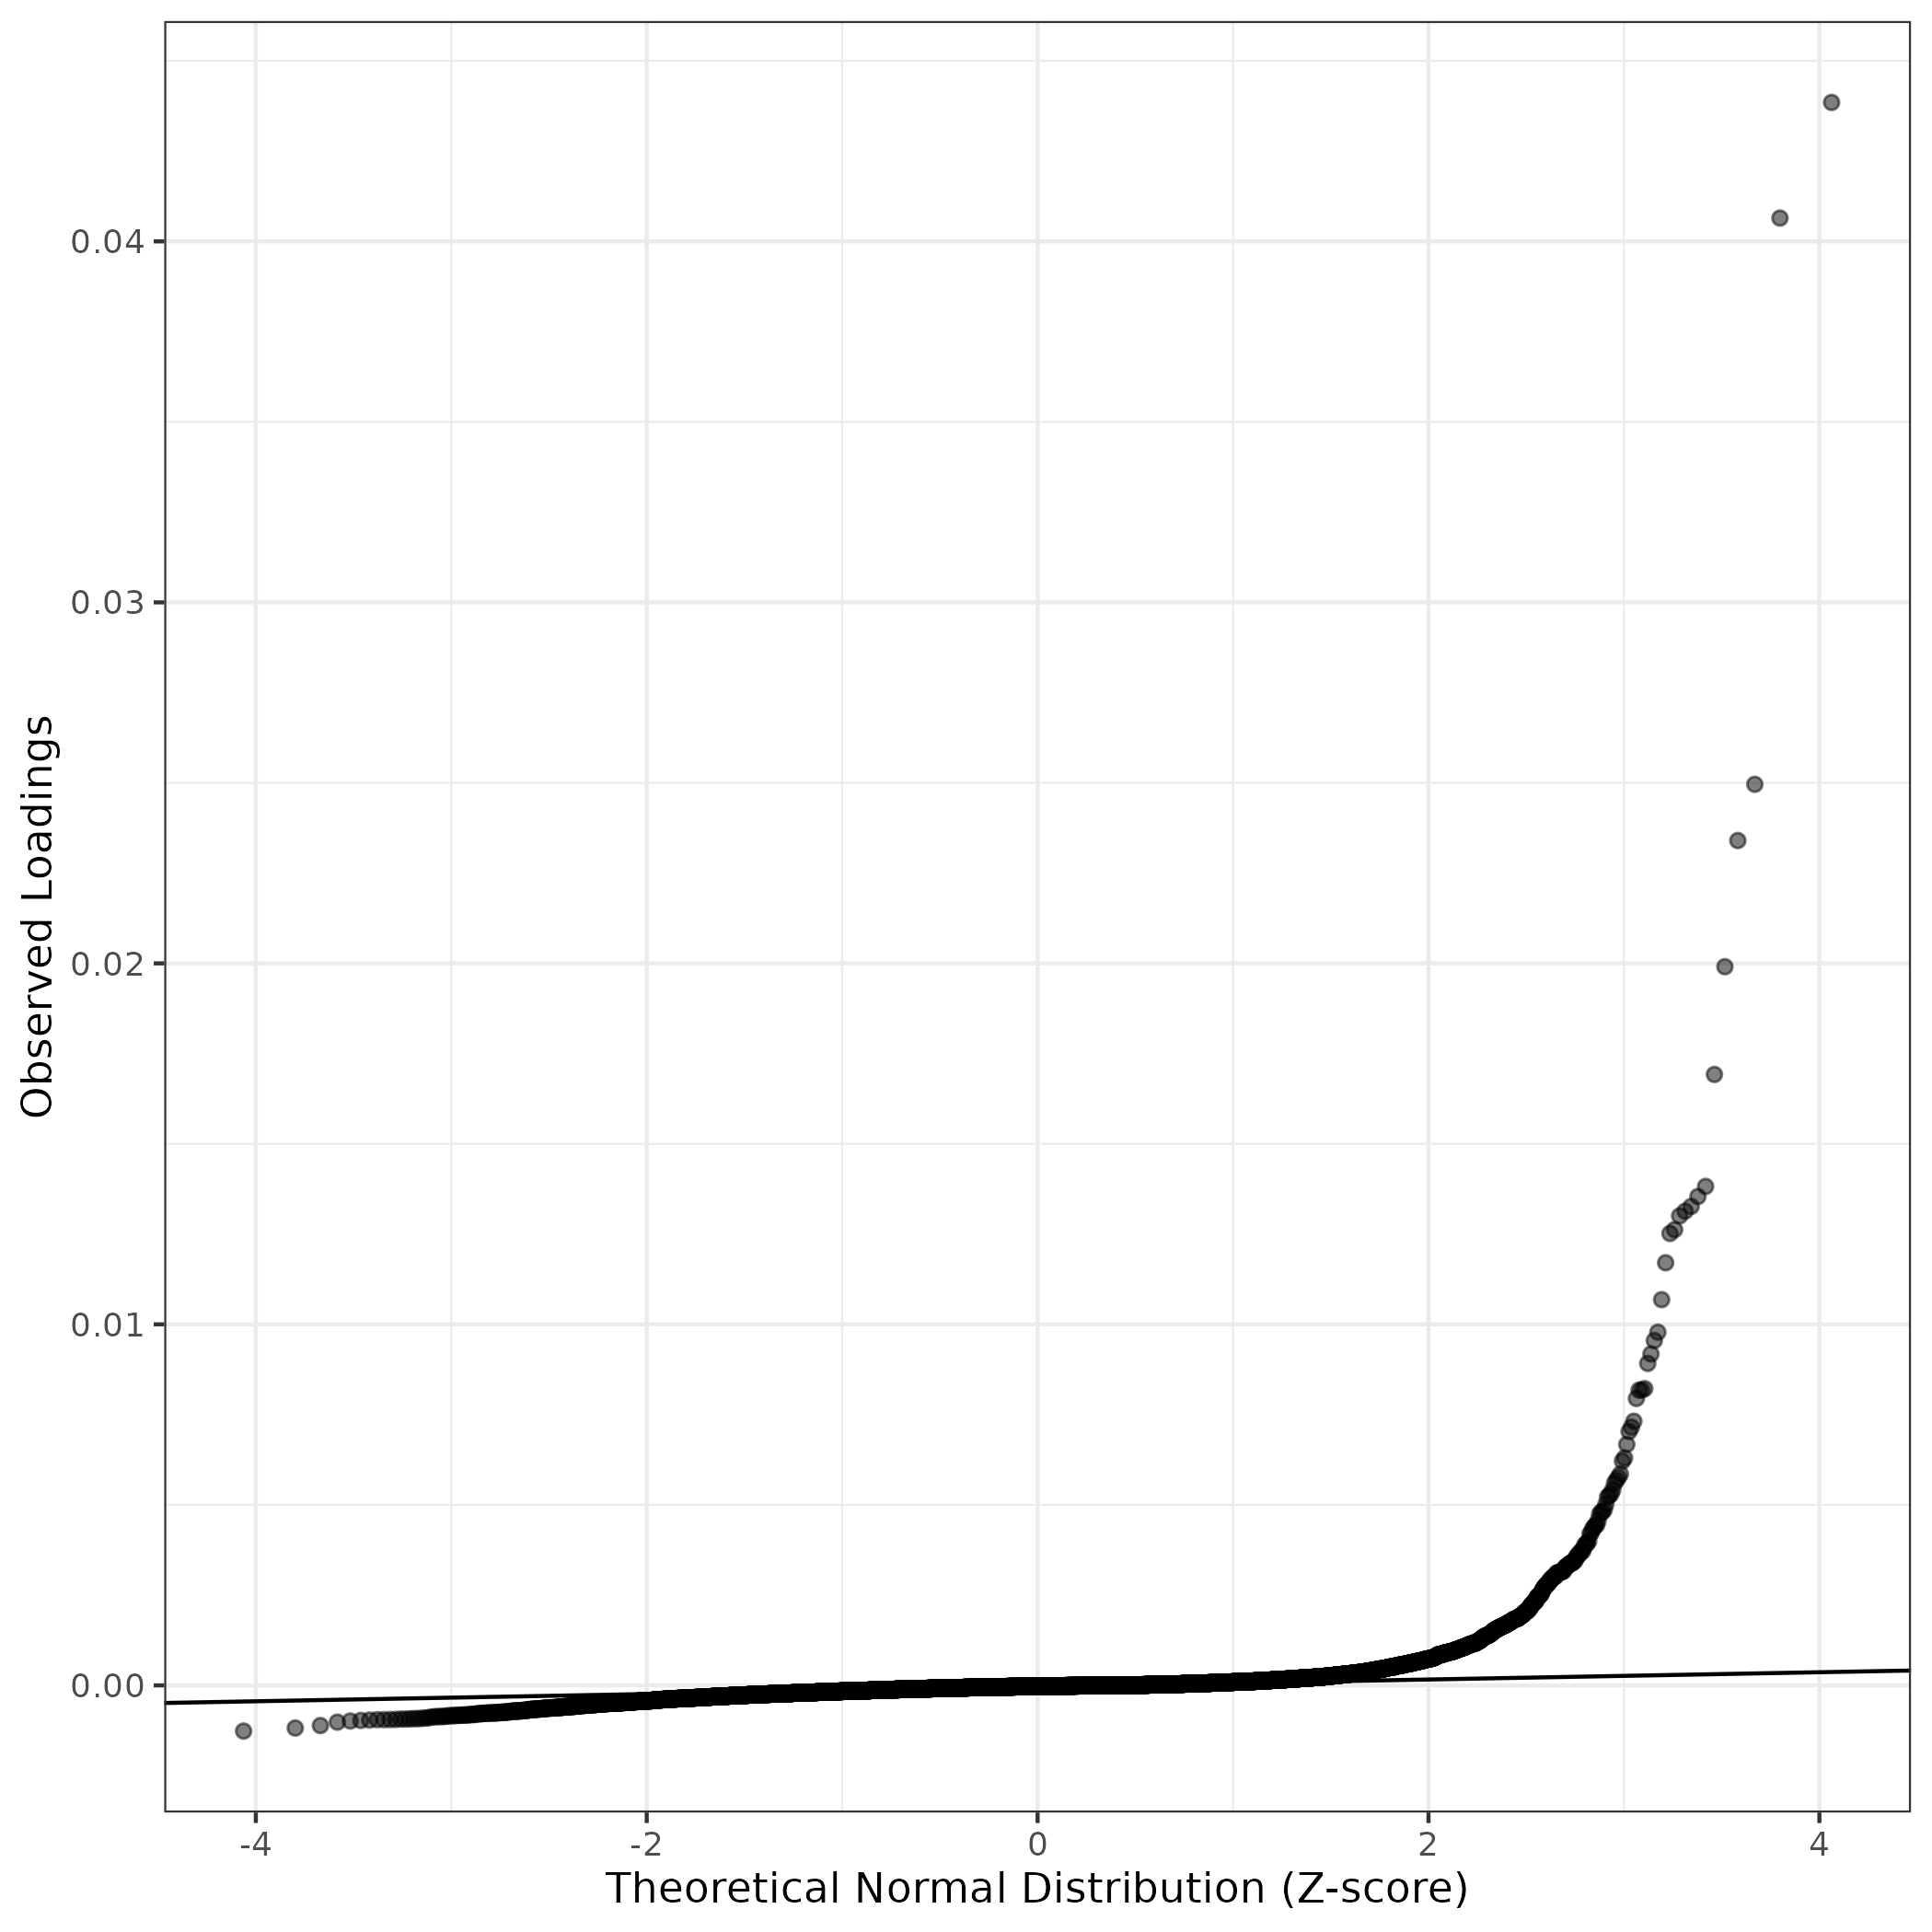
QQ-plot of gene loadings, averaged over both independent splits of the data
This plot highlights the relative contribution of each gene to the GEP
Top genes driving this program.
Note: Decartes website is buggy, try refreshing. Also, Decartes fetal adrenal data have been collected at specific time points (89-122 days), all possible cell types of interest may not be represented, do not overinterpret.
The Mean Count column shows the mean read count in cells scoring highly (H > 50) on this gene expression program.
| Gene | Loading | Gene.Name | GTEx | DepMap | Descartes | Mean.Counts | Mean.Tpm | |
|---|---|---|---|---|---|---|---|---|
| 1 | IGKC | 0.0438481 | immunoglobulin kappa constant | GTEx | DepMap | Descartes | 108.65 | 94481.56 |
| 2 | IGHG1 | 0.0406453 | immunoglobulin heavy constant gamma 1 (G1m marker) | GTEx | DepMap | Descartes | 22.49 | 6652.54 |
| 3 | IGHG4 | 0.0249599 | immunoglobulin heavy constant gamma 4 (G4m marker) | GTEx | DepMap | Descartes | 11.32 | 4477.27 |
| 4 | IGHGP | 0.0234022 | immunoglobulin heavy constant gamma P (non-functional) | GTEx | DepMap | Descartes | 5.66 | 2801.93 |
| 5 | JCHAIN | 0.0199077 | joining chain of multimeric IgA and IgM | GTEx | DepMap | Descartes | 2.23 | NA |
| 6 | IGLC2 | 0.0169230 | immunoglobulin lambda constant 2 | GTEx | DepMap | Descartes | 14.57 | 25617.59 |
| 7 | IGLV3-1 | 0.0138209 | immunoglobulin lambda variable 3-1 | GTEx | DepMap | Descartes | 0.12 | 202.46 |
| 8 | IGHA1 | 0.0135419 | immunoglobulin heavy constant alpha 1 | GTEx | DepMap | Descartes | 4.47 | 3125.55 |
| 9 | IGHG3 | 0.0132682 | immunoglobulin heavy constant gamma 3 (G3m marker) | GTEx | DepMap | Descartes | 15.35 | 6072.82 |
| 10 | IGLC3 | 0.0131358 | immunoglobulin lambda constant 3 (Kern-Oz+ marker) | GTEx | DepMap | Descartes | 8.22 | 16356.00 |
| 11 | TENT5C | 0.0130049 | terminal nucleotidyltransferase 5C | GTEx | DepMap | Descartes | 2.14 | NA |
| 12 | IGHG2 | 0.0126238 | immunoglobulin heavy constant gamma 2 (G2m marker) | GTEx | DepMap | Descartes | 2.46 | 695.09 |
| 13 | IGHV1-14 | 0.0125177 | immunoglobulin heavy variable 1-14 (pseudogene) | GTEx | DepMap | Descartes | 0.00 | 0.62 |
| 14 | MZB1 | 0.0117065 | marginal zone B and B1 cell specific protein | GTEx | DepMap | Descartes | 1.42 | NA |
| 15 | IGKV3-20 | 0.0106847 | immunoglobulin kappa variable 3-20 | GTEx | DepMap | Descartes | 0.10 | 138.58 |
| 16 | POU2AF1 | 0.0097827 | POU class 2 homeobox associating factor 1 | GTEx | DepMap | Descartes | 1.47 | 436.21 |
| 17 | IGLL5 | 0.0095521 | immunoglobulin lambda like polypeptide 5 | GTEx | DepMap | Descartes | 1.16 | 834.49 |
| 18 | XBP1 | 0.0091796 | X-box binding protein 1 | GTEx | DepMap | Descartes | 2.61 | 965.03 |
| 19 | IGHM | 0.0089182 | immunoglobulin heavy constant mu | GTEx | DepMap | Descartes | 6.61 | 3077.02 |
| 20 | IGKV1-39 | 0.0082200 | immunoglobulin kappa variable 1-39 | GTEx | DepMap | Descartes | 0.09 | 227.27 |
| 21 | IGHA2 | 0.0081830 | immunoglobulin heavy constant alpha 2 (A2m marker) | GTEx | DepMap | Descartes | 2.04 | 948.12 |
| 22 | DERL3 | 0.0081778 | derlin 3 | GTEx | DepMap | Descartes | 0.46 | 103.37 |
| 23 | IGHV3-7 | 0.0079480 | immunoglobulin heavy variable 3-7 | GTEx | DepMap | Descartes | 0.13 | 271.88 |
| 24 | IGKV1D-33 | 0.0073166 | immunoglobulin kappa variable 1D-33 | GTEx | DepMap | Descartes | 0.01 | 1.95 |
| 25 | PIM2 | 0.0071512 | Pim-2 proto-oncogene, serine/threonine kinase | GTEx | DepMap | Descartes | 0.73 | 265.63 |
| 26 | IGHV3-23 | 0.0070322 | immunoglobulin heavy variable 3-23 | GTEx | DepMap | Descartes | 0.07 | 164.87 |
| 27 | IRF4 | 0.0066748 | interferon regulatory factor 4 | GTEx | DepMap | Descartes | 0.90 | 152.97 |
| 28 | IGHV3-15 | 0.0063004 | immunoglobulin heavy variable 3-15 | GTEx | DepMap | Descartes | 0.12 | 258.16 |
| 29 | HERPUD1 | 0.0062119 | homocysteine inducible ER protein with ubiquitin like domain 1 | GTEx | DepMap | Descartes | 2.78 | 763.36 |
| 30 | HSH2D | 0.0058569 | hematopoietic SH2 domain containing | GTEx | DepMap | Descartes | 1.02 | 378.89 |
| 31 | SLAMF7 | 0.0057639 | SLAM family member 7 | GTEx | DepMap | Descartes | 0.64 | 159.55 |
| 32 | TP53INP1 | 0.0056849 | tumor protein p53 inducible nuclear protein 1 | GTEx | DepMap | Descartes | 1.65 | 234.89 |
| 33 | IGKV4-1 | 0.0056004 | immunoglobulin kappa variable 4-1 | GTEx | DepMap | Descartes | 0.07 | 106.80 |
| 34 | ZNF215 | 0.0054170 | zinc finger protein 215 | GTEx | DepMap | Descartes | 0.45 | 90.61 |
| 35 | IGLV2-23 | 0.0053041 | immunoglobulin lambda variable 2-23 | GTEx | DepMap | Descartes | 0.04 | 61.44 |
| 36 | PRDM1 | 0.0052563 | PR/SET domain 1 | GTEx | DepMap | Descartes | 1.27 | 201.53 |
| 37 | LAX1 | 0.0052157 | lymphocyte transmembrane adaptor 1 | GTEx | DepMap | Descartes | 0.43 | 119.82 |
| 38 | STAP1 | 0.0050182 | signal transducing adaptor family member 1 | GTEx | DepMap | Descartes | 0.36 | 151.23 |
| 39 | IGKV1-9 | 0.0048718 | immunoglobulin kappa variable 1-9 | GTEx | DepMap | Descartes | 0.02 | 23.31 |
| 40 | IGHV1-18 | 0.0048090 | immunoglobulin heavy variable 1-18 | GTEx | DepMap | Descartes | 0.04 | 131.31 |
| 41 | GNG7 | 0.0048006 | G protein subunit gamma 7 | GTEx | DepMap | Descartes | 2.41 | 549.11 |
| 42 | SEL1L3 | 0.0047400 | SEL1L family member 3 | GTEx | DepMap | Descartes | 2.72 | 530.93 |
| 43 | IGHV3-73 | 0.0045673 | immunoglobulin heavy variable 3-73 | GTEx | DepMap | Descartes | 0.08 | 172.65 |
| 44 | IGHV3-11 | 0.0044477 | immunoglobulin heavy variable 3-11 | GTEx | DepMap | Descartes | 0.02 | 50.15 |
| 45 | IGLV2-14 | 0.0044303 | immunoglobulin lambda variable 2-14 | GTEx | DepMap | Descartes | 0.03 | 40.04 |
| 46 | TXNDC11 | 0.0043814 | thioredoxin domain containing 11 | GTEx | DepMap | Descartes | 1.82 | 481.32 |
| 47 | FCRL5 | 0.0043296 | Fc receptor like 5 | GTEx | DepMap | Descartes | 0.79 | 116.57 |
| 48 | IGKV1-27 | 0.0042295 | immunoglobulin kappa variable 1-27 | GTEx | DepMap | Descartes | 0.02 | 17.52 |
| 49 | PIK3CG | 0.0041919 | phosphatidylinositol-4,5-bisphosphate 3-kinase catalytic subunit gamma | GTEx | DepMap | Descartes | 0.65 | 75.21 |
| 50 | FBXW7 | 0.0039972 | F-box and WD repeat domain containing 7 | GTEx | DepMap | Descartes | 6.04 | 881.72 |
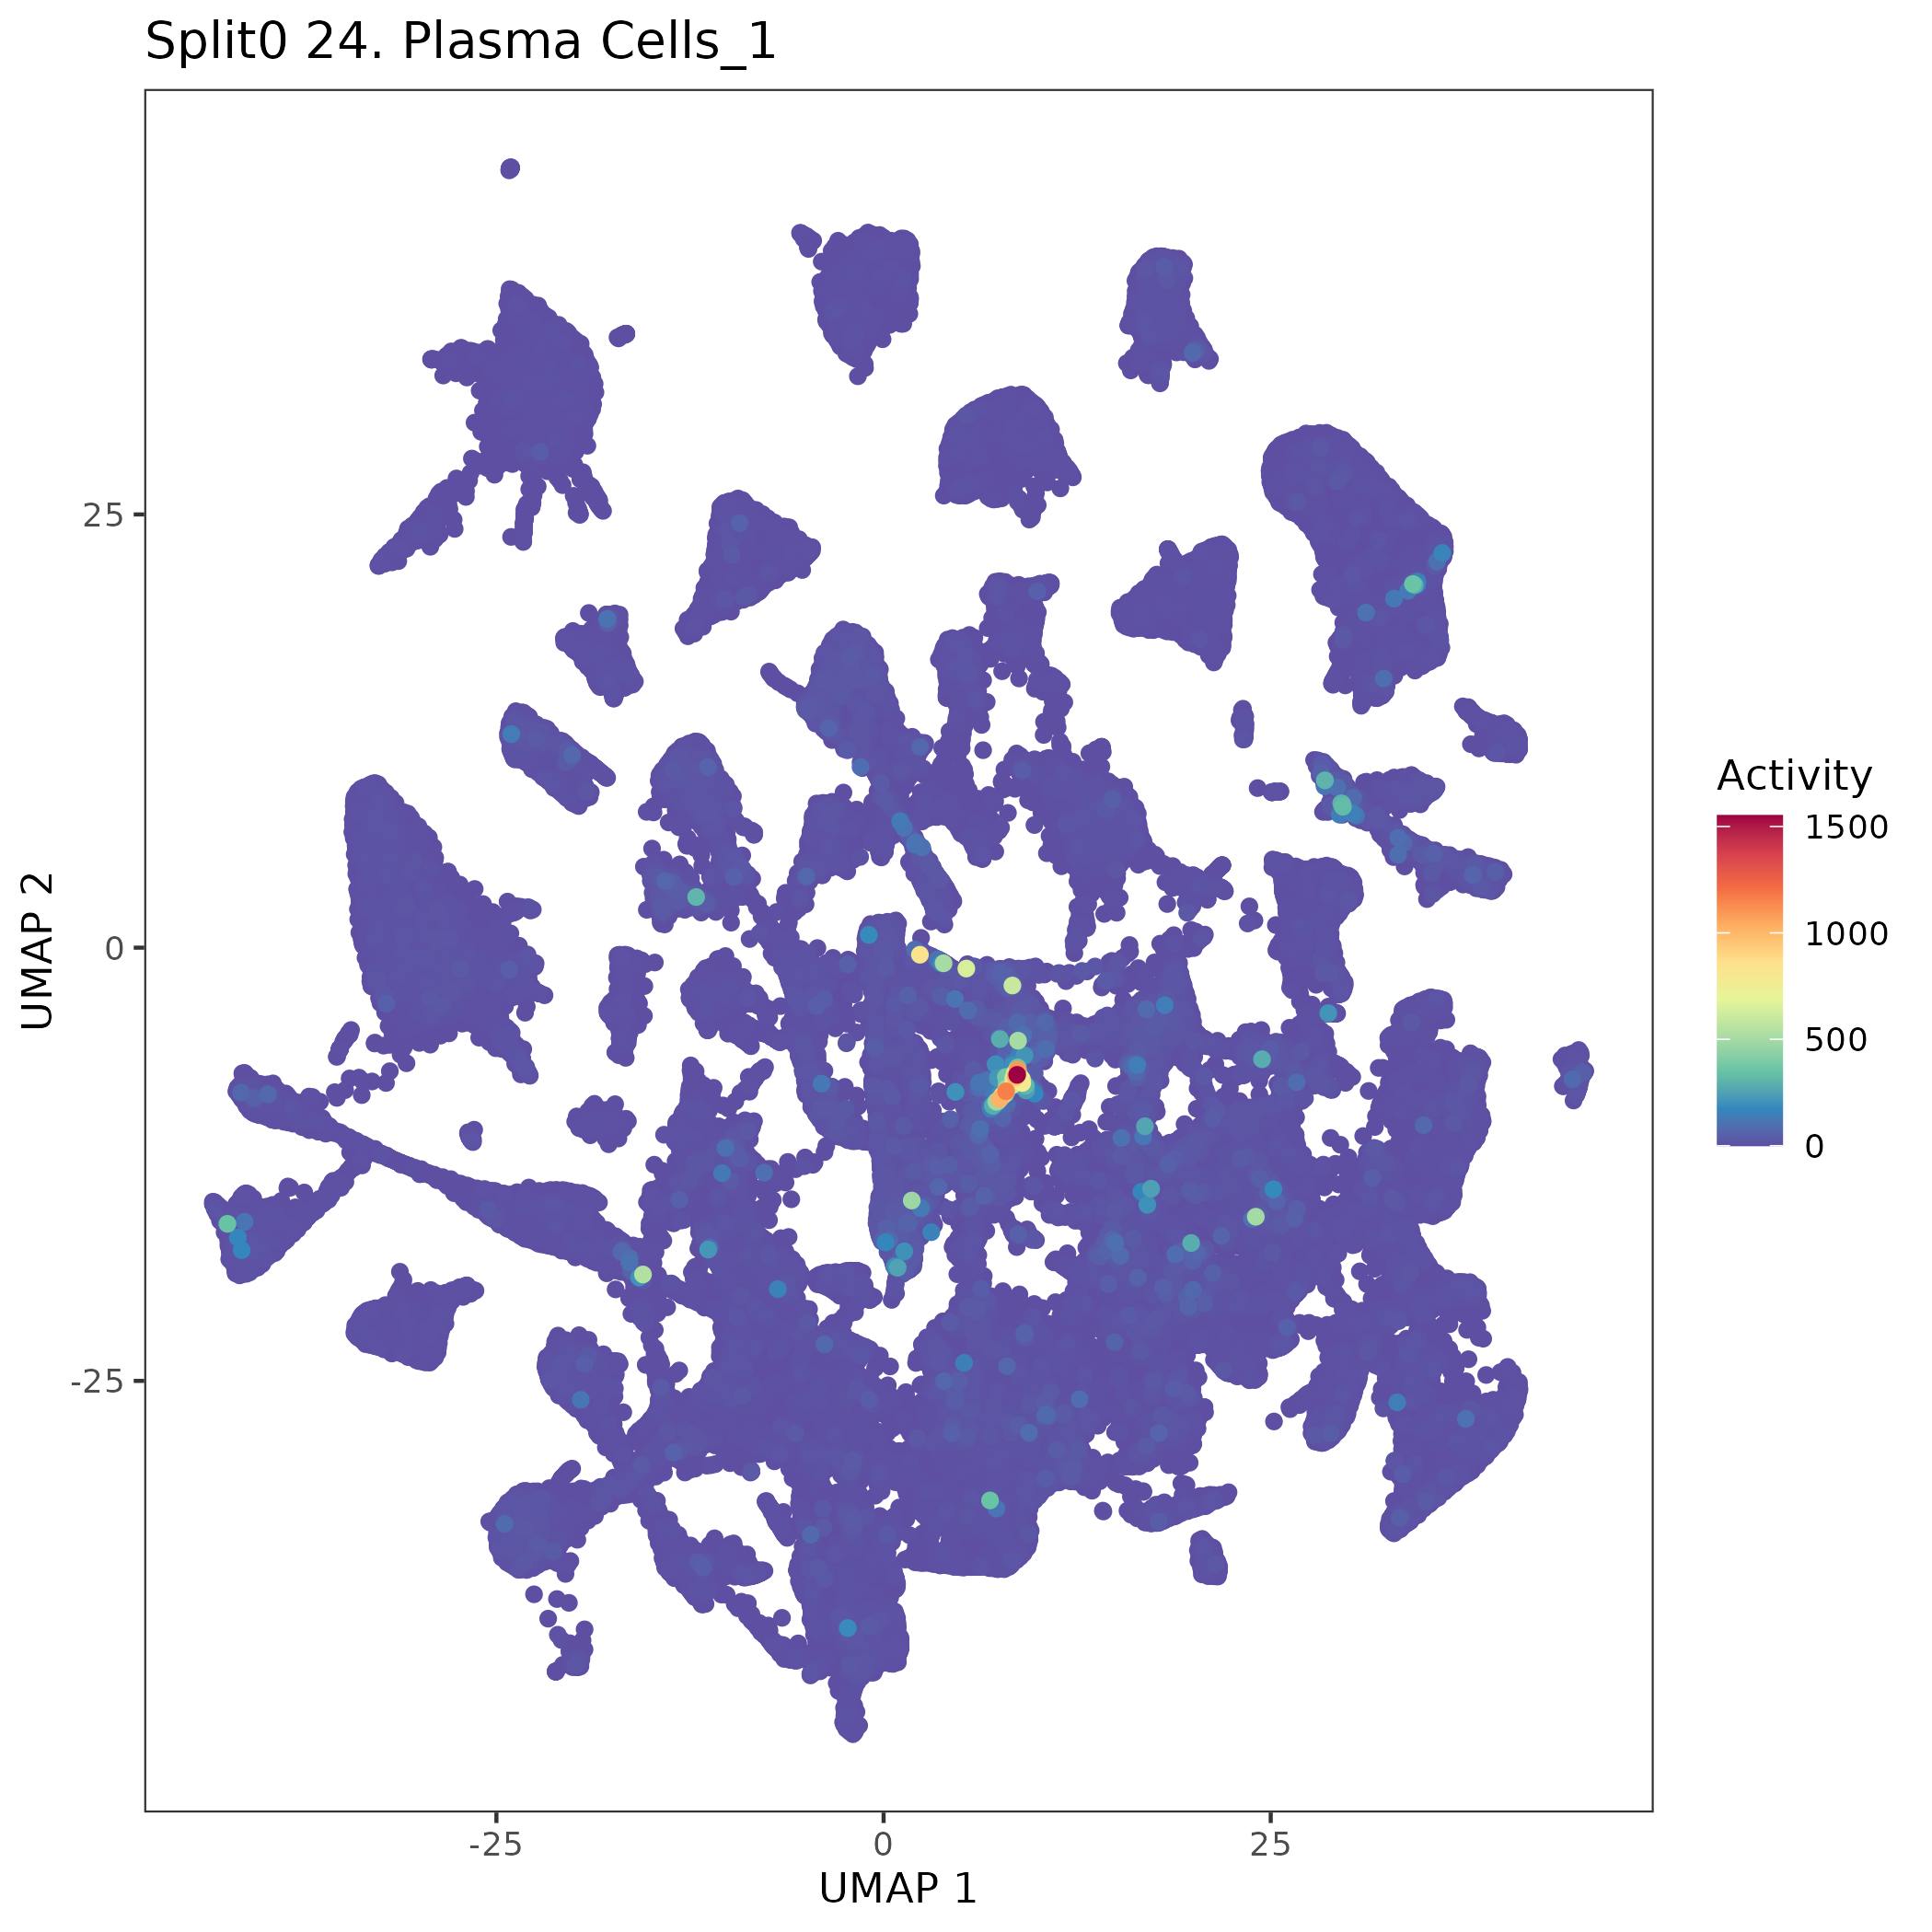
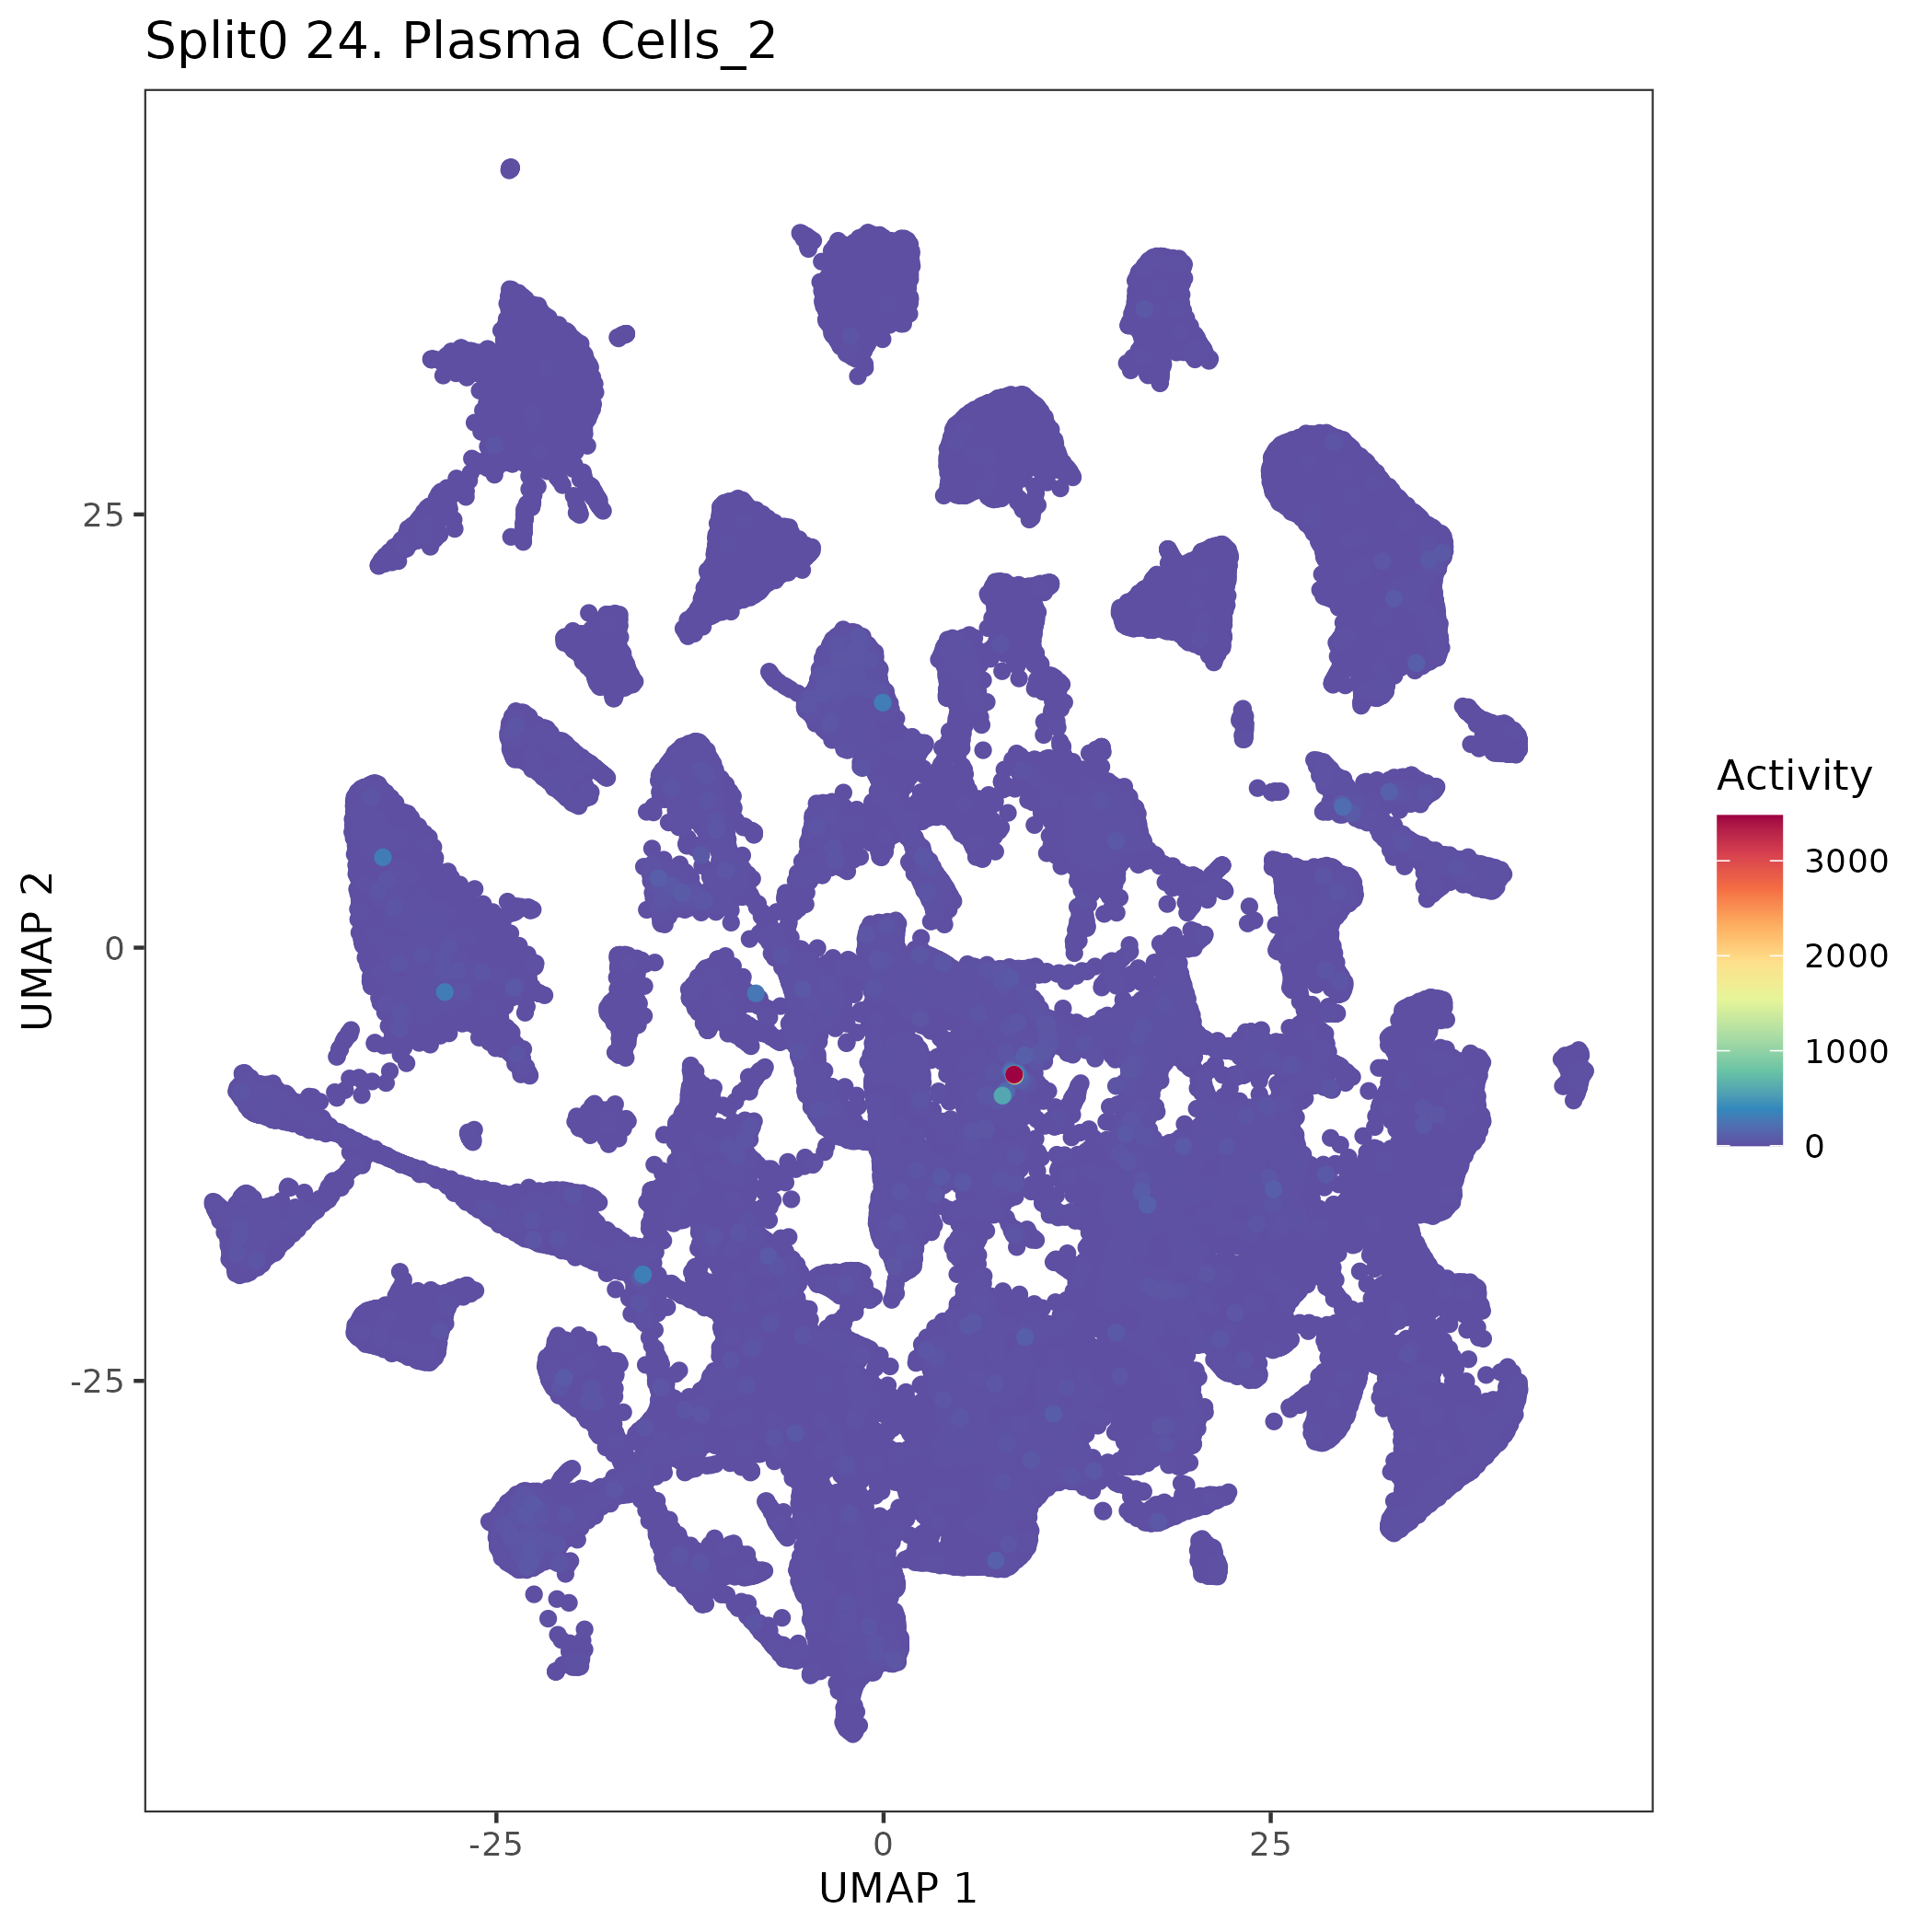
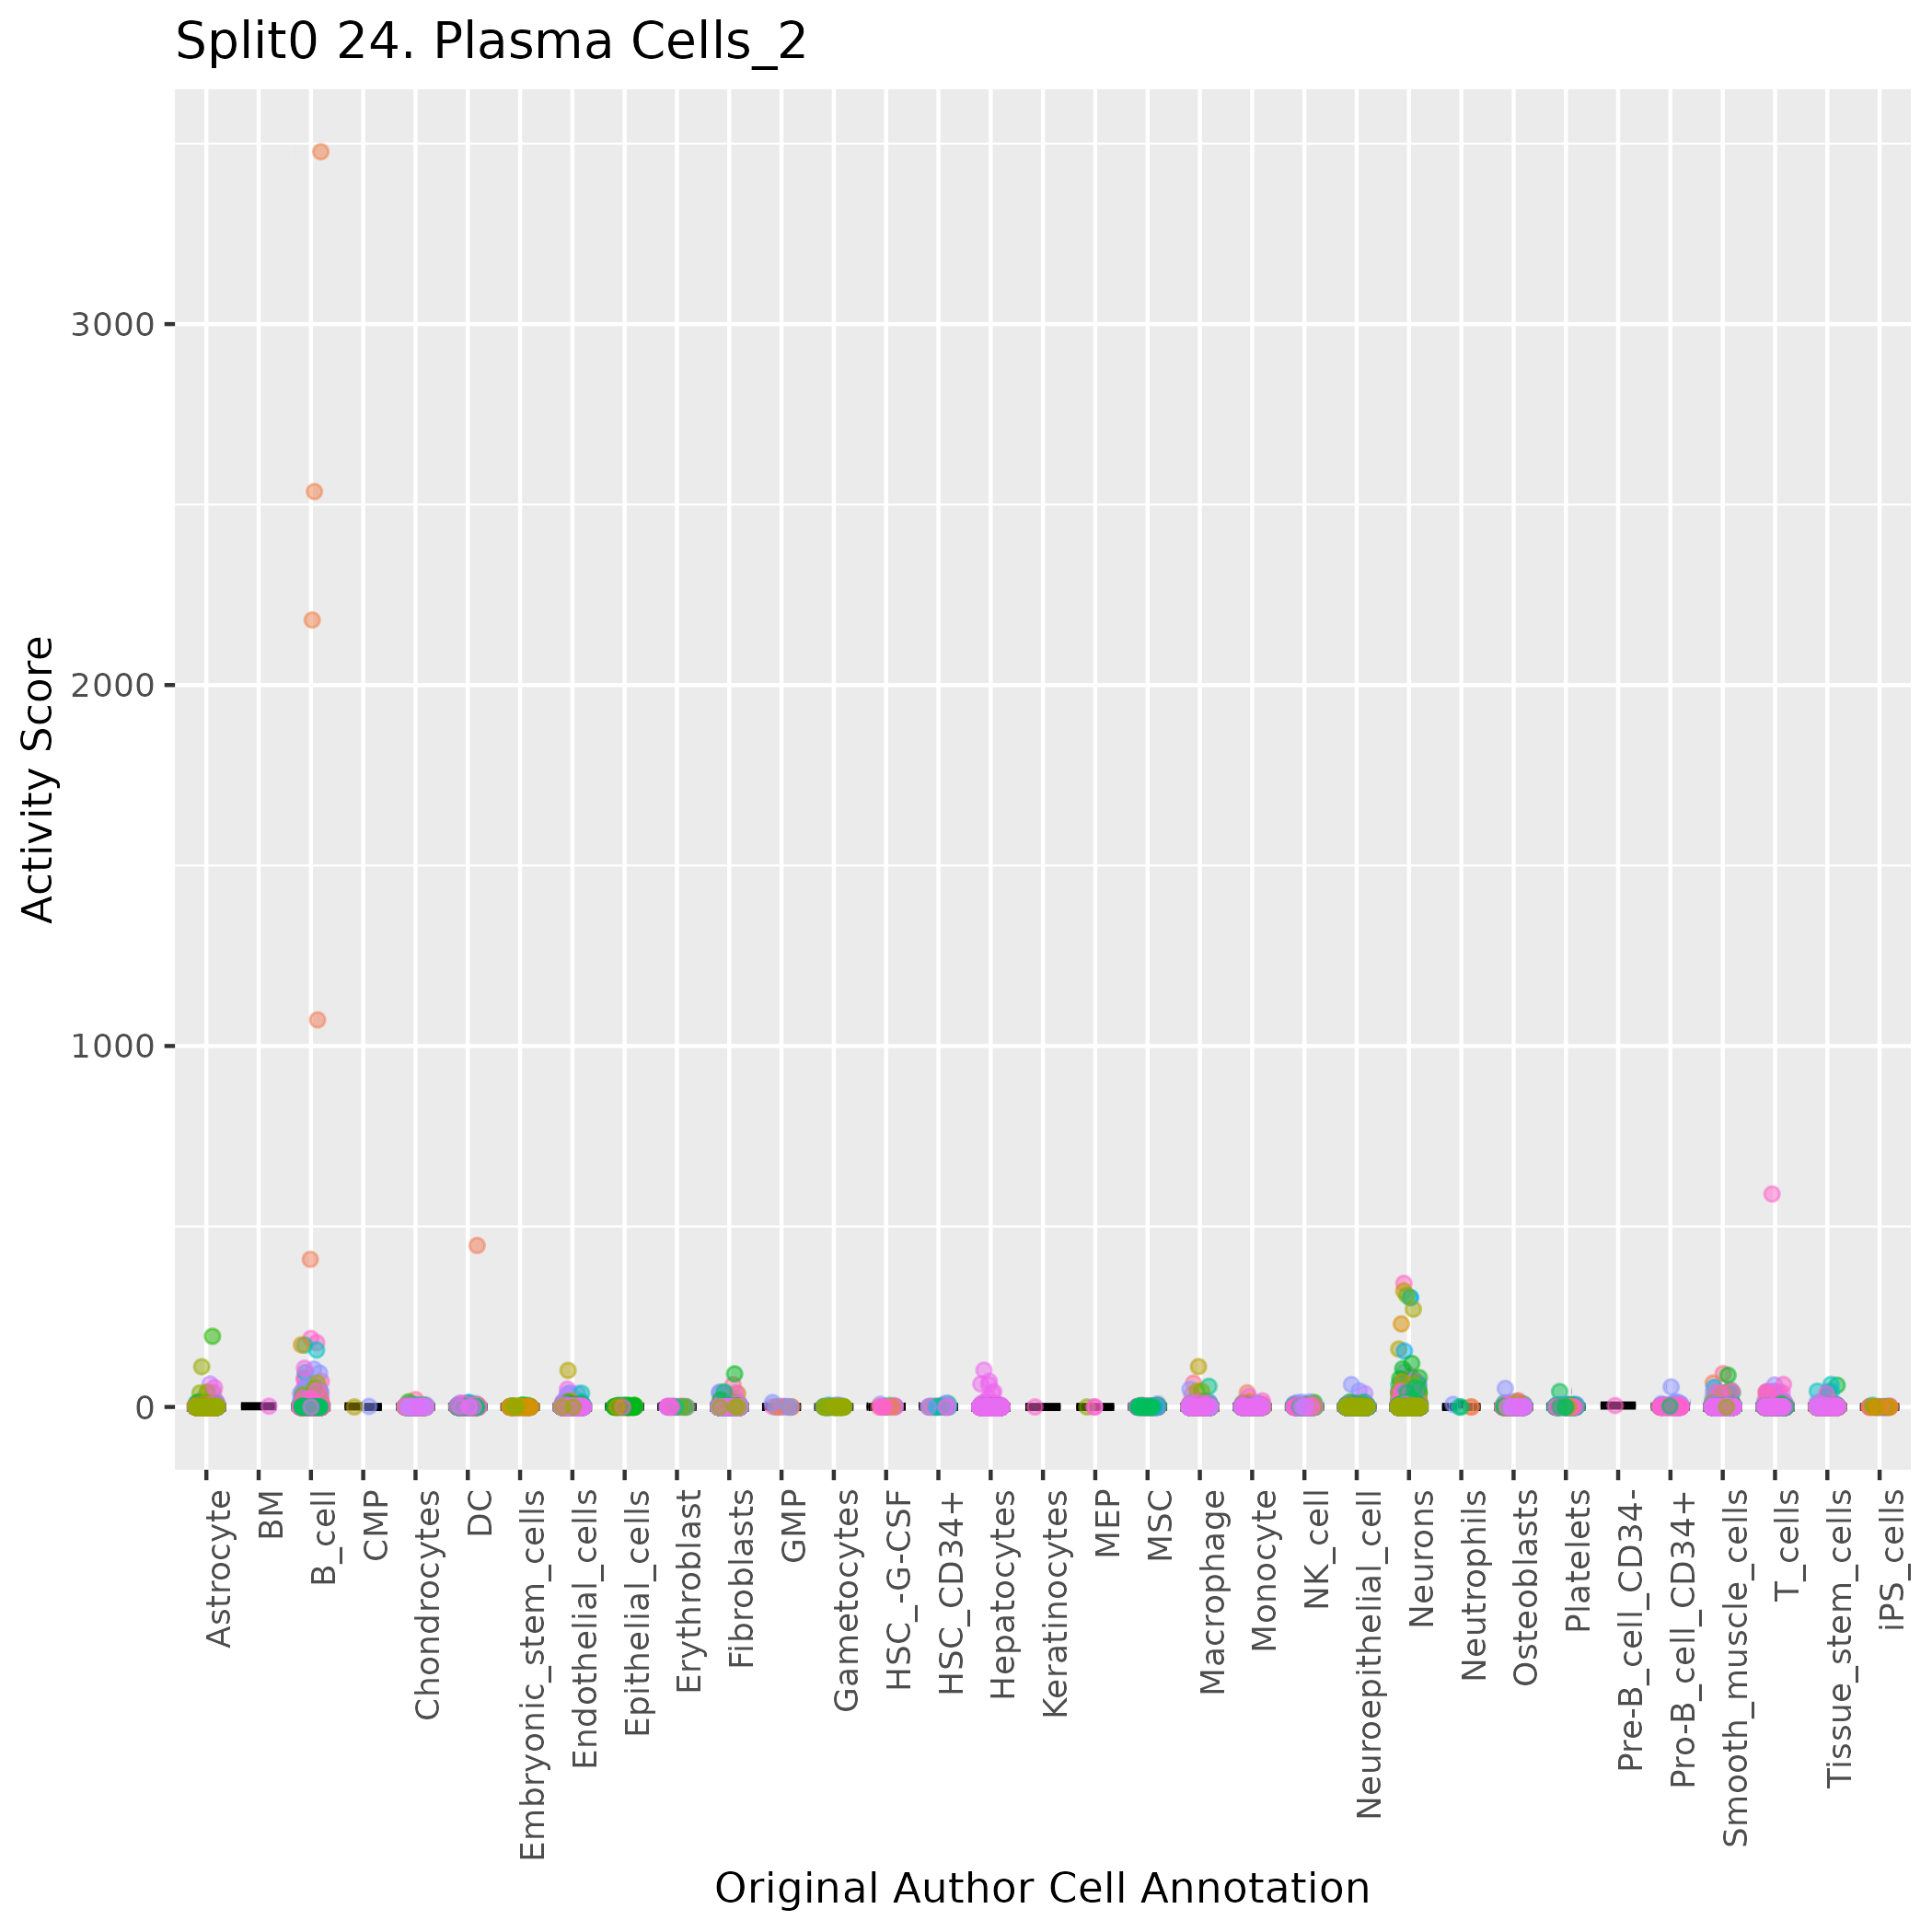
UMAP plots showing activity of gene expression program identified in GEP 24. Plasma Cells:
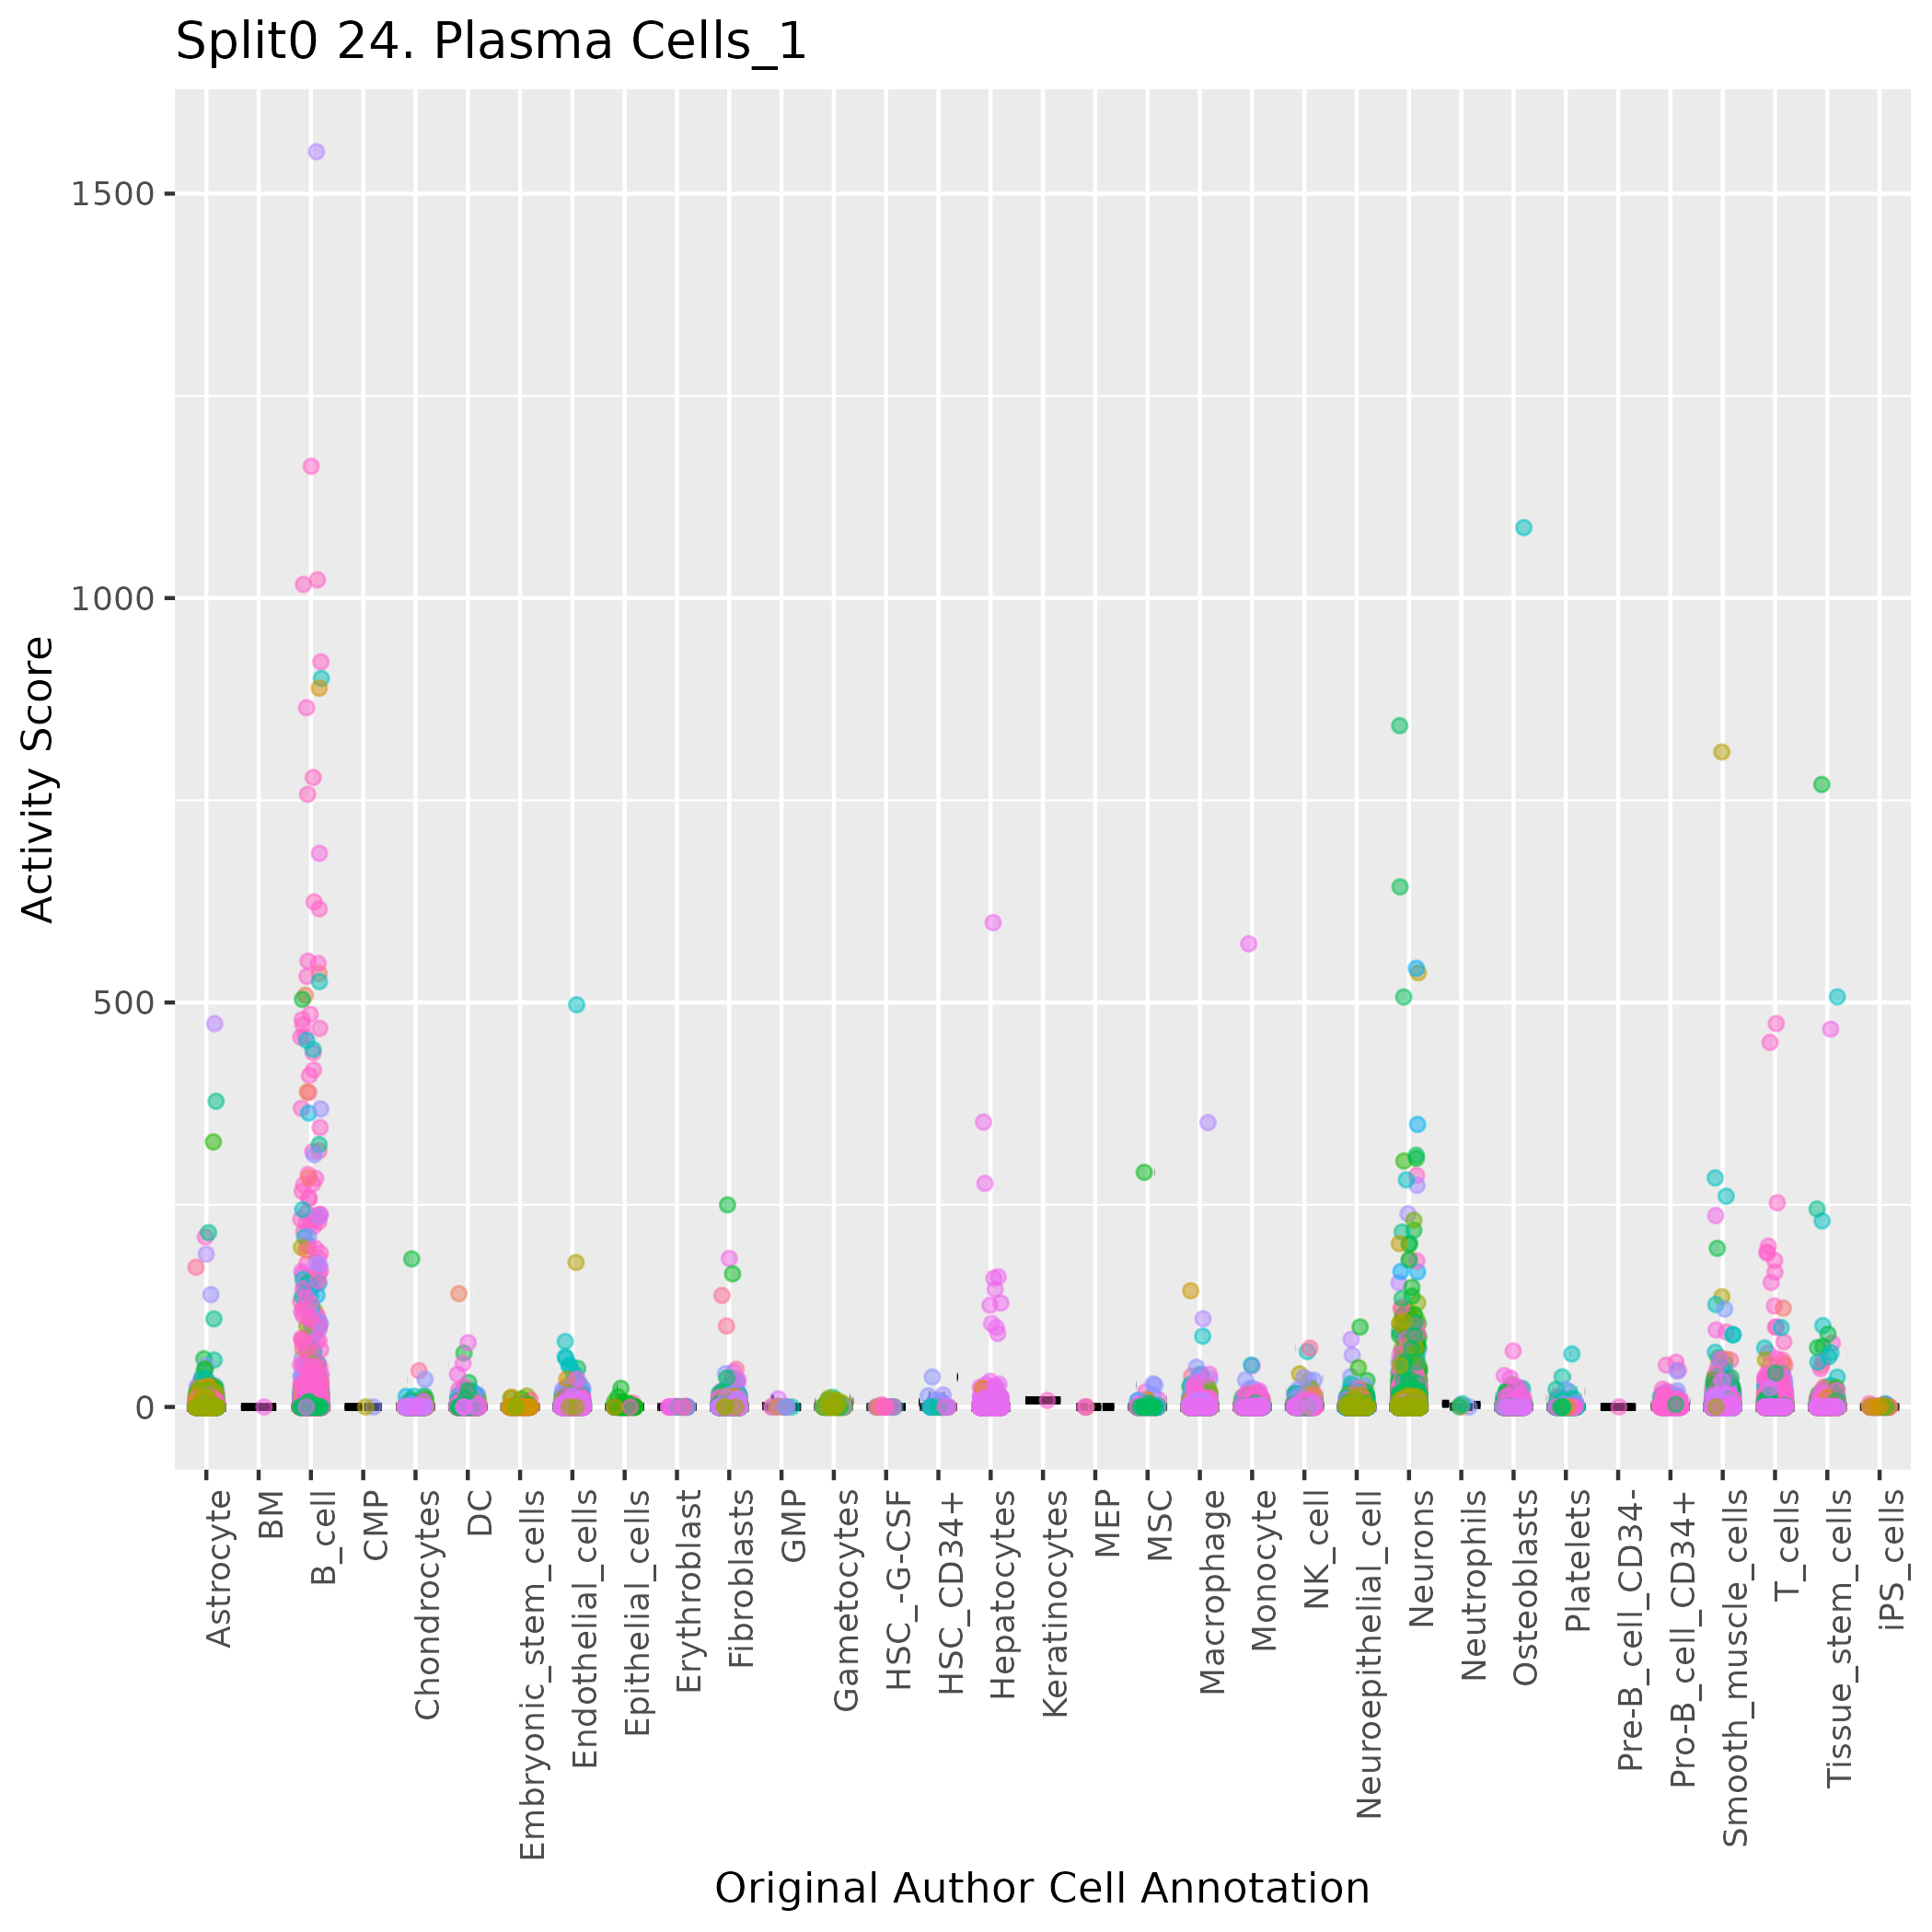
Boxlot showing activity of gene expression program identified in GEP 24. Plasma Cells:
Gene set Enrichments for this program, caculated from top 50 genes
mSigDB Cell Types Gene Set:
| P-value | OR | Lower 95% CI | FDR | FWER | Genes Found | Gene Set Size | |
|---|---|---|---|---|---|---|---|
| DURANTE_ADULT_OLFACTORY_NEUROEPITHELIUM_PLASMA_CELLS | 2.88e-27 | 708.89 | 257.76 | 9.66e-25 | 1.93e-24 | 12IGKC, IGHG1, IGHG4, JCHAIN, IGLC2, IGHA1, IGHG3, IGLC3, MZB1, IGHA2, DERL3, HERPUD1 |
21 |
| AIZARANI_LIVER_C38_RESIDENT_B_CELLS_3 | 1.08e-18 | 322.50 | 115.58 | 1.45e-16 | 7.26e-16 | 9JCHAIN, TENT5C, MZB1, POU2AF1, XBP1, DERL3, HERPUD1, SLAMF7, FCRL5 |
23 |
| HAY_BONE_MARROW_PLASMA_CELL | 4.12e-45 | 211.92 | 113.89 | 2.76e-42 | 2.76e-42 | 26IGKC, IGHG1, IGHG4, IGHGP, JCHAIN, IGLC2, IGHA1, IGHG3, IGLC3, IGHG2, MZB1, IGKV3-20, IGLL5, XBP1, IGHM, IGKV1-39, IGHA2, DERL3, IGHV3-7, IGHV3-23, HERPUD1, SLAMF7, IGKV4-1, IGLV2-14, TXNDC11, FCRL5 |
130 |
| AIZARANI_LIVER_C8_RESIDENT_B_CELLS_1 | 4.72e-19 | 205.25 | 81.94 | 7.92e-17 | 3.17e-16 | 10JCHAIN, TENT5C, MZB1, POU2AF1, XBP1, DERL3, HERPUD1, SLAMF7, SEL1L3, FCRL5 |
35 |
| AIZARANI_LIVER_C22_RESIDENT_B_CELLS_2 | 8.80e-15 | 155.38 | 57.37 | 9.85e-13 | 5.91e-12 | 8TENT5C, MZB1, POU2AF1, XBP1, DERL3, HERPUD1, SLAMF7, FCRL5 |
33 |
| DESCARTES_FETAL_PLACENTA_LYMPHOID_CELLS | 7.07e-25 | 82.52 | 42.02 | 1.58e-22 | 4.74e-22 | 17IGKC, IGHG1, IGHG4, IGHGP, JCHAIN, IGHA1, IGHG3, MZB1, POU2AF1, IGLL5, IGHM, PIM2, IRF4, ZNF215, LAX1, STAP1, FCRL5 |
145 |
| DESCARTES_MAIN_FETAL_LYMPHOID_CELLS | 3.66e-12 | 34.90 | 15.27 | 3.07e-10 | 2.46e-09 | 10IGKC, IGHG1, IGHG4, IGHGP, JCHAIN, IGHG3, IGLC3, IGLL5, IGHM, STAP1 |
157 |
| DESCARTES_FETAL_LIVER_LYMPHOID_CELLS | 6.10e-10 | 33.40 | 13.25 | 4.09e-08 | 4.09e-07 | 8IGKC, JCHAIN, POU2AF1, IGLL5, IGHM, IRF4, LAX1, FCRL5 |
125 |
| DESCARTES_FETAL_ADRENAL_LYMPHOID_CELLS | 1.74e-10 | 29.26 | 12.28 | 1.29e-08 | 1.16e-07 | 9IGKC, JCHAIN, MZB1, IGHM, IRF4, HSH2D, SLAMF7, LAX1, FCRL5 |
163 |
| DESCARTES_FETAL_SPLEEN_LYMPHOID_CELLS | 1.88e-08 | 28.56 | 10.62 | 1.05e-06 | 1.26e-05 | 7IGKC, MZB1, POU2AF1, IGLL5, IGHM, STAP1, FCRL5 |
124 |
| DESCARTES_FETAL_LUNG_LYMPHOID_CELLS | 3.69e-09 | 26.22 | 10.46 | 2.25e-07 | 2.48e-06 | 8IGKC, JCHAIN, MZB1, IGLL5, IGHM, LAX1, STAP1, FCRL5 |
157 |
| GAO_LARGE_INTESTINE_ADULT_CI_MESENCHYMAL_CELLS | 1.91e-12 | 20.73 | 10.02 | 1.83e-10 | 1.28e-09 | 13MZB1, POU2AF1, IGLL5, DERL3, IRF4, SLAMF7, TP53INP1, PRDM1, LAX1, STAP1, GNG7, FCRL5, PIK3CG |
361 |
| DESCARTES_FETAL_PANCREAS_LYMPHOID_CELLS | 2.65e-06 | 17.71 | 6.08 | 1.37e-04 | 1.78e-03 | 6IGLC2, IGLC3, POU2AF1, IGHM, ZNF215, LAX1 |
164 |
| TRAVAGLINI_LUNG_B_CELL | 3.53e-05 | 15.21 | 4.65 | 1.69e-03 | 2.37e-02 | 5POU2AF1, HSH2D, STAP1, GNG7, SEL1L3 |
155 |
| DESCARTES_FETAL_HEART_LYMPHOID_CELLS | 1.44e-04 | 16.85 | 4.33 | 6.45e-03 | 9.67e-02 | 4IGKC, JCHAIN, POU2AF1, FCRL5 |
110 |
| DESCARTES_FETAL_THYMUS_ANTIGEN_PRESENTING_CELLS | 7.79e-04 | 10.63 | 2.75 | 3.07e-02 | 5.23e-01 | 4IGKC, IGHM, SLAMF7, FCRL5 |
172 |
| ZHENG_CORD_BLOOD_C8_PUTATIVE_LYMPHOID_PRIMED_MULTIPOTENT_PROGENITOR_2 | 1.67e-03 | 13.94 | 2.73 | 5.56e-02 | 1.00e+00 | 3MZB1, IGHM, HSH2D |
97 |
| ZHENG_CORD_BLOOD_C10_MULTILYMPHOID_PROGENITOR | 1.67e-03 | 13.94 | 2.73 | 5.56e-02 | 1.00e+00 | 3JCHAIN, MZB1, IGHM |
97 |
| AIZARANI_LIVER_C28_NK_NKT_CELLS_6 | 1.77e-03 | 13.65 | 2.67 | 5.56e-02 | 1.00e+00 | 3TENT5C, PIM2, PRDM1 |
99 |
| FAN_EMBRYONIC_CTX_BRAIN_B_CELL | 1.82e-03 | 13.51 | 2.64 | 5.56e-02 | 1.00e+00 | 3MZB1, IGLL5, PIM2 |
100 |
Dowload full table
mSigDB Hallmark Gene Sets:
| P-value | OR | Lower 95% CI | FDR | FWER | Genes Found | Gene Set Size | |
|---|---|---|---|---|---|---|---|
| HALLMARK_UNFOLDED_PROTEIN_RESPONSE | 3.05e-02 | 7.71 | 0.90 | 1.00e+00 | 1.00e+00 | 2XBP1, HERPUD1 |
113 |
| HALLMARK_IL2_STAT5_SIGNALING | 8.29e-02 | 4.34 | 0.51 | 1.00e+00 | 1.00e+00 | 2XBP1, IRF4 |
199 |
| HALLMARK_INTERFERON_GAMMA_RESPONSE | 8.36e-02 | 4.32 | 0.51 | 1.00e+00 | 1.00e+00 | 2IRF4, SLAMF7 |
200 |
| HALLMARK_CHOLESTEROL_HOMEOSTASIS | 1.64e-01 | 5.74 | 0.14 | 1.00e+00 | 1.00e+00 | 1TP53INP1 |
74 |
| HALLMARK_ESTROGEN_RESPONSE_EARLY | 3.84e-01 | 2.11 | 0.05 | 1.00e+00 | 1.00e+00 | 1XBP1 |
200 |
| HALLMARK_ESTROGEN_RESPONSE_LATE | 3.84e-01 | 2.11 | 0.05 | 1.00e+00 | 1.00e+00 | 1XBP1 |
200 |
| HALLMARK_COMPLEMENT | 3.84e-01 | 2.11 | 0.05 | 1.00e+00 | 1.00e+00 | 1PIK3CG |
200 |
| HALLMARK_MTORC1_SIGNALING | 3.84e-01 | 2.11 | 0.05 | 1.00e+00 | 1.00e+00 | 1XBP1 |
200 |
| HALLMARK_P53_PATHWAY | 3.84e-01 | 2.11 | 0.05 | 1.00e+00 | 1.00e+00 | 1FBXW7 |
200 |
| HALLMARK_HEME_METABOLISM | 3.84e-01 | 2.11 | 0.05 | 1.00e+00 | 1.00e+00 | 1TENT5C |
200 |
| HALLMARK_ALLOGRAFT_REJECTION | 3.84e-01 | 2.11 | 0.05 | 1.00e+00 | 1.00e+00 | 1IRF4 |
200 |
| HALLMARK_KRAS_SIGNALING_UP | 3.84e-01 | 2.11 | 0.05 | 1.00e+00 | 1.00e+00 | 1PRDM1 |
200 |
| HALLMARK_KRAS_SIGNALING_DN | 3.84e-01 | 2.11 | 0.05 | 1.00e+00 | 1.00e+00 | 1TENT5C |
200 |
| HALLMARK_TNFA_SIGNALING_VIA_NFKB | 1.00e+00 | 0.00 | 0.00 | 1.00e+00 | 1.00e+00 | 0 |
200 |
| HALLMARK_HYPOXIA | 1.00e+00 | 0.00 | 0.00 | 1.00e+00 | 1.00e+00 | 0 |
200 |
| HALLMARK_MITOTIC_SPINDLE | 1.00e+00 | 0.00 | 0.00 | 1.00e+00 | 1.00e+00 | 0 |
199 |
| HALLMARK_WNT_BETA_CATENIN_SIGNALING | 1.00e+00 | 0.00 | 0.00 | 1.00e+00 | 1.00e+00 | 0 |
42 |
| HALLMARK_TGF_BETA_SIGNALING | 1.00e+00 | 0.00 | 0.00 | 1.00e+00 | 1.00e+00 | 0 |
54 |
| HALLMARK_IL6_JAK_STAT3_SIGNALING | 1.00e+00 | 0.00 | 0.00 | 1.00e+00 | 1.00e+00 | 0 |
87 |
| HALLMARK_DNA_REPAIR | 1.00e+00 | 0.00 | 0.00 | 1.00e+00 | 1.00e+00 | 0 |
150 |
Dowload full table
KEGG Pathways:
| P-value | OR | Lower 95% CI | FDR | FWER | Genes Found | Gene Set Size | |
|---|---|---|---|---|---|---|---|
| KEGG_ACUTE_MYELOID_LEUKEMIA | 8.43e-03 | 15.55 | 1.79 | 1.00e+00 | 1.00e+00 | 2PIM2, PIK3CG |
57 |
| KEGG_CHEMOKINE_SIGNALING_PATHWAY | 7.59e-02 | 4.57 | 0.53 | 1.00e+00 | 1.00e+00 | 2GNG7, PIK3CG |
189 |
| KEGG_ALDOSTERONE_REGULATED_SODIUM_REABSORPTION | 9.70e-02 | 10.22 | 0.25 | 1.00e+00 | 1.00e+00 | 1PIK3CG |
42 |
| KEGG_TYPE_II_DIABETES_MELLITUS | 1.08e-01 | 9.11 | 0.22 | 1.00e+00 | 1.00e+00 | 1PIK3CG |
47 |
| KEGG_MTOR_SIGNALING_PATHWAY | 1.19e-01 | 8.21 | 0.20 | 1.00e+00 | 1.00e+00 | 1PIK3CG |
52 |
| KEGG_ENDOMETRIAL_CANCER | 1.19e-01 | 8.21 | 0.20 | 1.00e+00 | 1.00e+00 | 1PIK3CG |
52 |
| KEGG_INOSITOL_PHOSPHATE_METABOLISM | 1.23e-01 | 7.91 | 0.19 | 1.00e+00 | 1.00e+00 | 1PIK3CG |
54 |
| KEGG_NON_SMALL_CELL_LUNG_CANCER | 1.23e-01 | 7.91 | 0.19 | 1.00e+00 | 1.00e+00 | 1PIK3CG |
54 |
| KEGG_COLORECTAL_CANCER | 1.40e-01 | 6.87 | 0.17 | 1.00e+00 | 1.00e+00 | 1PIK3CG |
62 |
| KEGG_GLIOMA | 1.46e-01 | 6.55 | 0.16 | 1.00e+00 | 1.00e+00 | 1PIK3CG |
65 |
| KEGG_RENAL_CELL_CARCINOMA | 1.56e-01 | 6.07 | 0.15 | 1.00e+00 | 1.00e+00 | 1PIK3CG |
70 |
| KEGG_PANCREATIC_CANCER | 1.56e-01 | 6.07 | 0.15 | 1.00e+00 | 1.00e+00 | 1PIK3CG |
70 |
| KEGG_MELANOMA | 1.58e-01 | 5.99 | 0.15 | 1.00e+00 | 1.00e+00 | 1PIK3CG |
71 |
| KEGG_CHRONIC_MYELOID_LEUKEMIA | 1.62e-01 | 5.82 | 0.14 | 1.00e+00 | 1.00e+00 | 1PIK3CG |
73 |
| KEGG_B_CELL_RECEPTOR_SIGNALING_PATHWAY | 1.66e-01 | 5.66 | 0.14 | 1.00e+00 | 1.00e+00 | 1PIK3CG |
75 |
| KEGG_PHOSPHATIDYLINOSITOL_SIGNALING_SYSTEM | 1.68e-01 | 5.59 | 0.14 | 1.00e+00 | 1.00e+00 | 1PIK3CG |
76 |
| KEGG_VEGF_SIGNALING_PATHWAY | 1.68e-01 | 5.59 | 0.14 | 1.00e+00 | 1.00e+00 | 1PIK3CG |
76 |
| KEGG_FC_EPSILON_RI_SIGNALING_PATHWAY | 1.74e-01 | 5.37 | 0.13 | 1.00e+00 | 1.00e+00 | 1PIK3CG |
79 |
| KEGG_SMALL_CELL_LUNG_CANCER | 1.84e-01 | 5.05 | 0.12 | 1.00e+00 | 1.00e+00 | 1PIK3CG |
84 |
| KEGG_PROGESTERONE_MEDIATED_OOCYTE_MATURATION | 1.86e-01 | 4.99 | 0.12 | 1.00e+00 | 1.00e+00 | 1PIK3CG |
85 |
Dowload full table
CHR Positional Gene Sets:
| P-value | OR | Lower 95% CI | FDR | FWER | Genes Found | Gene Set Size | |
|---|---|---|---|---|---|---|---|
| chr14q32 | 1.24e-12 | 16.58 | 8.36 | 3.43e-10 | 3.43e-10 | 15IGHG1, IGHG4, IGHGP, IGHA1, IGHG3, IGHG2, IGHV1-14, IGHM, IGHA2, IGHV3-7, IGHV3-23, IGHV3-15, IGHV1-18, IGHV3-73, IGHV3-11 |
546 |
| chr2p11 | 5.70e-07 | 16.88 | 6.33 | 7.93e-05 | 1.59e-04 | 7IGKC, IGKV3-20, IGKV1-39, IGKV1D-33, IGKV4-1, IGKV1-9, IGKV1-27 |
205 |
| chr22q11 | 3.31e-05 | 8.87 | 3.34 | 3.07e-03 | 9.21e-03 | 7IGLC2, IGLV3-1, IGLC3, IGLL5, DERL3, IGLV2-23, IGLV2-14 |
384 |
| chr1q23 | 9.58e-02 | 3.98 | 0.47 | 1.00e+00 | 1.00e+00 | 2SLAMF7, FCRL5 |
217 |
| chr16q13 | 9.26e-02 | 10.74 | 0.26 | 1.00e+00 | 1.00e+00 | 1HERPUD1 |
40 |
| chr1p12 | 1.12e-01 | 8.73 | 0.21 | 1.00e+00 | 1.00e+00 | 1TENT5C |
49 |
| chr19p13 | 7.03e-01 | 1.11 | 0.13 | 1.00e+00 | 1.00e+00 | 2HSH2D, GNG7 |
773 |
| chr6p25 | 1.80e-01 | 5.17 | 0.13 | 1.00e+00 | 1.00e+00 | 1IRF4 |
82 |
| chr6q21 | 2.47e-01 | 3.61 | 0.09 | 1.00e+00 | 1.00e+00 | 1PRDM1 |
117 |
| chr4p15 | 2.56e-01 | 3.46 | 0.09 | 1.00e+00 | 1.00e+00 | 1SEL1L3 |
122 |
| chr8q22 | 3.10e-01 | 2.76 | 0.07 | 1.00e+00 | 1.00e+00 | 1TP53INP1 |
153 |
| chr4q31 | 3.16e-01 | 2.69 | 0.07 | 1.00e+00 | 1.00e+00 | 1FBXW7 |
157 |
| chr11q23 | 3.91e-01 | 2.05 | 0.05 | 1.00e+00 | 1.00e+00 | 1POU2AF1 |
205 |
| chr22q12 | 4.03e-01 | 1.98 | 0.05 | 1.00e+00 | 1.00e+00 | 1XBP1 |
213 |
| chr7q22 | 4.03e-01 | 1.98 | 0.05 | 1.00e+00 | 1.00e+00 | 1PIK3CG |
213 |
| chr1q32 | 4.74e-01 | 1.58 | 0.04 | 1.00e+00 | 1.00e+00 | 1LAX1 |
266 |
| chr5q31 | 5.00e-01 | 1.47 | 0.04 | 1.00e+00 | 1.00e+00 | 1MZB1 |
287 |
| chrXp11 | 5.90e-01 | 1.14 | 0.03 | 1.00e+00 | 1.00e+00 | 1PIM2 |
370 |
| chr16p13 | 6.25e-01 | 1.03 | 0.03 | 1.00e+00 | 1.00e+00 | 1TXNDC11 |
407 |
| chr1p13 | 1.00e+00 | 0.00 | 0.00 | 1.00e+00 | 1.00e+00 | 0 |
205 |
Dowload full table
Transcription Factor Targets:
| P-value | OR | Lower 95% CI | FDR | FWER | Genes Found | Gene Set Size | |
|---|---|---|---|---|---|---|---|
| MAML1_TARGET_GENES | 6.54e-03 | 5.80 | 1.51 | 1.00e+00 | 1.00e+00 | 4IGKC, MZB1, POU2AF1, TXNDC11 |
312 |
| RTAAACA_FREAC2_01 | 5.68e-03 | 3.59 | 1.36 | 1.00e+00 | 1.00e+00 | 7POU2AF1, IRF4, HSH2D, PRDM1, STAP1, PIK3CG, FBXW7 |
938 |
| E4BP4_01 | 1.64e-02 | 5.96 | 1.18 | 1.00e+00 | 1.00e+00 | 3HERPUD1, SEL1L3, FBXW7 |
223 |
| PU1_Q6 | 1.91e-02 | 5.63 | 1.11 | 1.00e+00 | 1.00e+00 | 3DERL3, STAP1, PIK3CG |
236 |
| POU2AF1_TARGET_GENES | 1.95e-02 | 3.06 | 1.06 | 1.00e+00 | 1.00e+00 | 6MZB1, IGKV3-20, POU2AF1, IGLL5, IGKV1-39, PIM2 |
922 |
| MEIS1_01 | 2.19e-02 | 5.33 | 1.05 | 1.00e+00 | 1.00e+00 | 3POU2AF1, PIM2, FBXW7 |
249 |
| FREAC3_01 | 2.37e-02 | 5.16 | 1.02 | 1.00e+00 | 1.00e+00 | 3HERPUD1, PRDM1, SEL1L3 |
257 |
| AAAYWAACM_HFH4_01 | 2.49e-02 | 5.06 | 1.00 | 1.00e+00 | 1.00e+00 | 3IRF4, PRDM1, STAP1 |
262 |
| STAT_Q6 | 2.54e-02 | 5.02 | 0.99 | 1.00e+00 | 1.00e+00 | 3IRF4, PRDM1, FBXW7 |
264 |
| OCT_C | 2.69e-02 | 4.91 | 0.97 | 1.00e+00 | 1.00e+00 | 3JCHAIN, PIM2, PRDM1 |
270 |
| OCT1_Q6 | 2.74e-02 | 4.87 | 0.96 | 1.00e+00 | 1.00e+00 | 3JCHAIN, PIM2, PRDM1 |
272 |
| TERF1_TARGET_GENES | 3.36e-02 | 4.49 | 0.89 | 1.00e+00 | 1.00e+00 | 3PRDM1, LAX1, STAP1 |
295 |
| RACTNNRTTTNC_UNKNOWN | 3.94e-02 | 6.68 | 0.78 | 1.00e+00 | 1.00e+00 | 2POU2AF1, FBXW7 |
130 |
| HDAC4_TARGET_GENES | 7.56e-02 | 2.64 | 0.69 | 1.00e+00 | 1.00e+00 | 4JCHAIN, XBP1, HSH2D, TXNDC11 |
681 |
| AR_01 | 5.63e-02 | 5.45 | 0.64 | 1.00e+00 | 1.00e+00 | 2PIM2, PRDM1 |
159 |
| CTTTGA_LEF1_Q2 | 2.08e-01 | 1.84 | 0.57 | 1.00e+00 | 1.00e+00 | 5POU2AF1, PIM2, PRDM1, PIK3CG, FBXW7 |
1247 |
| CREBP1_01 | 7.18e-02 | 4.73 | 0.55 | 1.00e+00 | 1.00e+00 | 2HERPUD1, FBXW7 |
183 |
| TGACAGNY_MEIS1_01 | 1.36e-01 | 2.11 | 0.55 | 1.00e+00 | 1.00e+00 | 4POU2AF1, PIM2, PRDM1, SEL1L3 |
850 |
| RGAGGAARY_PU1_Q6 | 1.23e-01 | 2.56 | 0.51 | 1.00e+00 | 1.00e+00 | 3POU2AF1, STAP1, PIK3CG |
515 |
| TGGAAA_NFAT_Q4_01 | 4.42e-01 | 1.45 | 0.51 | 1.00e+00 | 1.00e+00 | 6POU2AF1, XBP1, PIM2, IRF4, PRDM1, FBXW7 |
1934 |
Dowload full table
GO Biological Processes:
| P-value | OR | Lower 95% CI | FDR | FWER | Genes Found | Gene Set Size | |
|---|---|---|---|---|---|---|---|
| GOBP_HUMORAL_IMMUNE_RESPONSE_MEDIATED_BY_CIRCULATING_IMMUNOGLOBULIN | 5.37e-39 | 151.23 | 80.89 | 4.02e-35 | 4.02e-35 | 24IGKC, IGHG1, IGHG4, IGLC2, IGLV3-1, IGHA1, IGHG3, IGLC3, IGHG2, IGKV3-20, IGLL5, IGHM, IGKV1-39, IGHA2, IGHV3-7, IGKV1D-33, IGHV3-23, IGHV3-15, IGKV4-1, IGLV2-23, IGHV1-18, IGHV3-73, IGHV3-11, IGLV2-14 |
149 |
| GOBP_PHAGOCYTOSIS_RECOGNITION | 1.57e-28 | 142.53 | 71.21 | 1.17e-25 | 1.17e-24 | 17IGKC, IGHG1, IGHG4, IGLC2, IGHA1, IGHG3, IGLC3, IGHG2, IGLL5, IGHM, IGHA2, IGHV3-7, IGHV3-23, IGHV3-15, IGHV1-18, IGHV3-73, IGHV3-11 |
91 |
| GOBP_COMPLEMENT_ACTIVATION | 1.81e-37 | 128.66 | 69.02 | 6.77e-34 | 1.35e-33 | 24IGKC, IGHG1, IGHG4, IGLC2, IGLV3-1, IGHA1, IGHG3, IGLC3, IGHG2, IGKV3-20, IGLL5, IGHM, IGKV1-39, IGHA2, IGHV3-7, IGKV1D-33, IGHV3-23, IGHV3-15, IGKV4-1, IGLV2-23, IGHV1-18, IGHV3-73, IGHV3-11, IGLV2-14 |
171 |
| GOBP_REGULATION_OF_COMPLEMENT_ACTIVATION | 9.62e-27 | 108.97 | 54.87 | 4.50e-24 | 7.20e-23 | 17IGKC, IGHG1, IGHG4, IGLC2, IGLV3-1, IGHG3, IGLC3, IGHG2, IGKV3-20, IGKV1-39, IGHV3-7, IGKV1D-33, IGHV3-23, IGKV4-1, IGLV2-23, IGHV3-11, IGLV2-14 |
114 |
| GOBP_B_CELL_RECEPTOR_SIGNALING_PATHWAY | 6.57e-28 | 105.64 | 54.09 | 4.09e-25 | 4.91e-24 | 18IGKC, IGHG1, IGHG4, IGLC2, IGHA1, IGHG3, IGLC3, IGHG2, IGLL5, IGHM, IGHA2, IGHV3-7, IGHV3-23, IGHV3-15, STAP1, IGHV1-18, IGHV3-73, IGHV3-11 |
127 |
| GOBP_B_CELL_MEDIATED_IMMUNITY | 9.01e-35 | 97.10 | 52.37 | 1.69e-31 | 6.74e-31 | 24IGKC, IGHG1, IGHG4, IGLC2, IGLV3-1, IGHA1, IGHG3, IGLC3, IGHG2, IGKV3-20, IGLL5, IGHM, IGKV1-39, IGHA2, IGHV3-7, IGKV1D-33, IGHV3-23, IGHV3-15, IGKV4-1, IGLV2-23, IGHV1-18, IGHV3-73, IGHV3-11, IGLV2-14 |
219 |
| GOBP_MEMBRANE_INVAGINATION | 2.41e-27 | 97.70 | 50.11 | 1.29e-24 | 1.80e-23 | 18IGKC, IGHG1, IGHG4, IGLC2, IGHA1, IGHG3, IGLC3, IGHG2, IGLL5, IGHM, IGHA2, IGHV3-7, IGHV3-23, IGHV3-15, STAP1, IGHV1-18, IGHV3-73, IGHV3-11 |
136 |
| GOBP_POSITIVE_REGULATION_OF_B_CELL_ACTIVATION | 6.21e-27 | 92.10 | 47.44 | 3.10e-24 | 4.64e-23 | 18IGKC, IGHG1, IGHG4, IGLC2, IGHA1, IGHG3, IGLC3, IGHG2, IGLL5, XBP1, IGHM, IGHA2, IGHV3-7, IGHV3-23, IGHV3-15, IGHV1-18, IGHV3-73, IGHV3-11 |
143 |
| GOBP_REGULATION_OF_HUMORAL_IMMUNE_RESPONSE | 2.59e-25 | 87.79 | 44.65 | 8.79e-23 | 1.93e-21 | 17IGKC, IGHG1, IGHG4, IGLC2, IGLV3-1, IGHG3, IGLC3, IGHG2, IGKV3-20, IGKV1-39, IGHV3-7, IGKV1D-33, IGHV3-23, IGKV4-1, IGLV2-23, IGHV3-11, IGLV2-14 |
137 |
| GOBP_FC_RECEPTOR_MEDIATED_STIMULATORY_SIGNALING_PATHWAY | 6.25e-25 | 83.17 | 42.33 | 2.03e-22 | 4.68e-21 | 17IGKC, IGHG1, IGHG4, IGLC2, IGLV3-1, IGHG3, IGLC3, IGHG2, IGKV3-20, IGKV1-39, IGHV3-7, IGKV1D-33, IGHV3-23, IGKV4-1, IGLV2-23, IGHV3-11, IGLV2-14 |
144 |
| GOBP_REGULATION_OF_B_CELL_ACTIVATION | 1.14e-26 | 75.29 | 39.32 | 5.04e-24 | 8.56e-23 | 19IGKC, IGHG1, IGHG4, IGLC2, IGHA1, IGHG3, IGLC3, IGHG2, MZB1, IGLL5, XBP1, IGHM, IGHA2, IGHV3-7, IGHV3-23, IGHV3-15, IGHV1-18, IGHV3-73, IGHV3-11 |
186 |
| GOBP_HUMORAL_IMMUNE_RESPONSE | 1.11e-32 | 64.17 | 35.01 | 1.66e-29 | 8.30e-29 | 26IGKC, IGHG1, IGHG4, JCHAIN, IGLC2, IGLV3-1, IGHA1, IGHG3, IGLC3, IGHG2, IGKV3-20, POU2AF1, IGLL5, IGHM, IGKV1-39, IGHA2, IGHV3-7, IGKV1D-33, IGHV3-23, IGHV3-15, IGKV4-1, IGLV2-23, IGHV1-18, IGHV3-73, IGHV3-11, IGLV2-14 |
373 |
| GOBP_LYMPHOCYTE_MEDIATED_IMMUNITY | 1.49e-31 | 62.93 | 34.31 | 1.86e-28 | 1.12e-27 | 25IGKC, IGHG1, IGHG4, IGLC2, IGLV3-1, IGHA1, IGHG3, IGLC3, IGHG2, IGKV3-20, IGLL5, IGHM, IGKV1-39, IGHA2, IGHV3-7, IGKV1D-33, IGHV3-23, IGHV3-15, SLAMF7, IGKV4-1, IGLV2-23, IGHV1-18, IGHV3-73, IGHV3-11, IGLV2-14 |
351 |
| GOBP_POSITIVE_REGULATION_OF_RESPIRATORY_BURST | 1.12e-06 | 215.66 | 34.13 | 1.61e-04 | 8.37e-03 | 3JCHAIN, IGHA1, IGHA2 |
9 |
| GOBP_ADAPTIVE_IMMUNE_RESPONSE_BASED_ON_SOMATIC_RECOMBINATION_OF_IMMUNE_RECEPTORS_BUILT_FROM_IMMUNOGLOBULIN_SUPERFAMILY_DOMAINS | 2.45e-31 | 61.65 | 33.59 | 2.61e-28 | 1.83e-27 | 25IGKC, IGHG1, IGHG4, IGLC2, IGLV3-1, IGHA1, IGHG3, IGLC3, IGHG2, IGKV3-20, IGLL5, IGHM, IGKV1-39, IGHA2, IGHV3-7, IGKV1D-33, IGHV3-23, IRF4, IGHV3-15, IGKV4-1, IGLV2-23, IGHV1-18, IGHV3-73, IGHV3-11, IGLV2-14 |
358 |
| GOBP_PHAGOCYTOSIS | 7.30e-31 | 58.78 | 32.09 | 6.83e-28 | 5.46e-27 | 25IGKC, IGHG1, IGHG4, IGLC2, IGLV3-1, IGHA1, IGHG3, IGLC3, IGHG2, IGKV3-20, IGLL5, IGHM, IGKV1-39, IGHA2, IGHV3-7, IGKV1D-33, IGHV3-23, IGHV3-15, IGKV4-1, IGLV2-23, STAP1, IGHV1-18, IGHV3-73, IGHV3-11, IGLV2-14 |
374 |
| GOBP_ADAPTIVE_IMMUNE_RESPONSE | 1.32e-35 | 55.26 | 29.95 | 3.29e-32 | 9.87e-32 | 32IGKC, IGHG1, IGHG4, JCHAIN, IGLC2, IGLV3-1, IGHA1, IGHG3, IGLC3, IGHG2, IGKV3-20, IGLL5, IGHM, IGKV1-39, IGHA2, IGHV3-7, IGKV1D-33, IGHV3-23, IRF4, IGHV3-15, SLAMF7, IGKV4-1, IGLV2-23, PRDM1, LAX1, IGKV1-9, IGHV1-18, IGHV3-73, IGHV3-11, IGLV2-14, IGKV1-27, PIK3CG |
693 |
| GOBP_B_CELL_ACTIVATION | 1.67e-25 | 49.95 | 26.71 | 5.94e-23 | 1.25e-21 | 21IGKC, IGHG1, IGHG4, IGLC2, IGHA1, IGHG3, IGLC3, IGHG2, MZB1, POU2AF1, IGLL5, XBP1, IGHM, IGHA2, IGHV3-7, IGHV3-23, IGHV3-15, LAX1, IGHV1-18, IGHV3-73, IGHV3-11 |
319 |
| GOBP_CELL_RECOGNITION | 1.47e-21 | 50.77 | 26.12 | 3.33e-19 | 1.10e-17 | 17IGKC, IGHG1, IGHG4, IGLC2, IGHA1, IGHG3, IGLC3, IGHG2, IGLL5, IGHM, IGHA2, IGHV3-7, IGHV3-23, IGHV3-15, IGHV1-18, IGHV3-73, IGHV3-11 |
225 |
| GOBP_IMMUNE_RESPONSE_REGULATING_SIGNALING_PATHWAY | 3.50e-29 | 45.98 | 25.16 | 2.91e-26 | 2.62e-25 | 26IGKC, IGHG1, IGHG4, IGLC2, IGLV3-1, IGHA1, IGHG3, IGLC3, IGHG2, IGKV3-20, IGLL5, IGHM, IGKV1-39, IGHA2, IGHV3-7, IGKV1D-33, IGHV3-23, IGHV3-15, IGKV4-1, IGLV2-23, LAX1, STAP1, IGHV1-18, IGHV3-73, IGHV3-11, IGLV2-14 |
510 |
Dowload full table
Immunological Gene Sets:
| P-value | OR | Lower 95% CI | FDR | FWER | Genes Found | Gene Set Size | |
|---|---|---|---|---|---|---|---|
| GSE29614_DAY3_VS_DAY7_TIV_FLU_VACCINE_PBMC_DN | 2.54e-19 | 50.24 | 25.02 | 1.24e-15 | 1.24e-15 | 15IGKC, JCHAIN, MZB1, IGKV3-20, POU2AF1, XBP1, IGHM, DERL3, SLAMF7, IGKV4-1, LAX1, GNG7, SEL1L3, TXNDC11, FCRL5 |
190 |
| GSE29618_BCELL_VS_MONOCYTE_UP | 2.77e-14 | 35.61 | 16.66 | 6.75e-11 | 1.35e-10 | 12IGKC, IGHG1, JCHAIN, TENT5C, IGKV3-20, POU2AF1, IGHM, PIM2, IGKV4-1, STAP1, GNG7, SEL1L3 |
194 |
| GSE29618_BCELL_VS_MDC_DAY7_FLU_VACCINE_UP | 8.11e-13 | 32.16 | 14.62 | 7.90e-10 | 3.95e-09 | 11IGKC, IGHG1, JCHAIN, MZB1, IGKV3-20, POU2AF1, IGHM, PIM2, IGKV4-1, STAP1, SEL1L3 |
191 |
| GSE10325_CD4_TCELL_VS_BCELL_DN | 9.60e-13 | 31.64 | 14.38 | 7.90e-10 | 4.68e-09 | 11IGKC, JCHAIN, IGHA1, MZB1, POU2AF1, IGHM, IRF4, IGKV4-1, STAP1, GNG7, SEL1L3 |
194 |
| GSE10325_LUPUS_BCELL_VS_LUPUS_MYELOID_UP | 9.60e-13 | 31.64 | 14.38 | 7.90e-10 | 4.68e-09 | 11IGKC, JCHAIN, IGHA1, POU2AF1, IGHM, PIM2, IRF4, IGKV4-1, STAP1, GNG7, SEL1L3 |
194 |
| GSE10325_LUPUS_CD4_TCELL_VS_LUPUS_BCELL_DN | 1.02e-12 | 31.47 | 14.30 | 7.90e-10 | 4.95e-09 | 11IGKC, JCHAIN, IGHA1, MZB1, IGKV3-20, POU2AF1, IGHM, IGKV4-1, STAP1, GNG7, SEL1L3 |
195 |
| GSE3982_MEMORY_CD4_TCELL_VS_BCELL_DN | 1.13e-12 | 31.13 | 14.15 | 7.90e-10 | 5.53e-09 | 11IGKC, JCHAIN, IGHA1, MZB1, POU2AF1, IGHM, IRF4, IGKV4-1, STAP1, GNG7, SEL1L3 |
197 |
| GSE29614_CTRL_VS_DAY7_TIV_FLU_VACCINE_PBMC_DN | 2.96e-11 | 27.87 | 12.25 | 1.45e-08 | 1.44e-07 | 10IGKC, JCHAIN, MZB1, IGKV3-20, POU2AF1, XBP1, IGHM, SLAMF7, GNG7, SEL1L3 |
194 |
| GSE4748_CYANOBACTERIUM_LPSLIKE_VS_LPS_AND_CYANOBACTERIUM_LPSLIKE_STIM_DC_3H_UP | 2.96e-11 | 27.87 | 12.25 | 1.45e-08 | 1.44e-07 | 10IGKC, JCHAIN, MZB1, IGKV3-20, XBP1, IGHM, IGKV4-1, LAX1, STAP1, FCRL5 |
194 |
| GSE29618_BCELL_VS_MONOCYTE_DAY7_FLU_VACCINE_UP | 3.11e-11 | 27.72 | 12.18 | 1.45e-08 | 1.52e-07 | 10IGKC, TENT5C, IGKV3-20, POU2AF1, IGHM, PIM2, IGKV4-1, STAP1, GNG7, SEL1L3 |
195 |
| GSE10325_BCELL_VS_MYELOID_UP | 3.27e-11 | 27.58 | 12.12 | 1.45e-08 | 1.59e-07 | 10IGKC, JCHAIN, MZB1, POU2AF1, IGHM, PIM2, IGKV4-1, STAP1, GNG7, SEL1L3 |
196 |
| GSE29617_DAY3_VS_DAY7_TIV_FLU_VACCINE_PBMC_2008_DN | 6.71e-10 | 24.89 | 10.48 | 2.63e-07 | 3.27e-06 | 9IGHG1, JCHAIN, MZB1, IGKV3-20, POU2AF1, XBP1, TP53INP1, IGLV2-23, SEL1L3 |
190 |
| GSE4984_UNTREATED_VS_GALECTIN1_TREATED_DC_DN | 7.03e-10 | 24.75 | 10.42 | 2.63e-07 | 3.42e-06 | 9IGKC, JCHAIN, MZB1, POU2AF1, IGHM, IGKV4-1, STAP1, SEL1L3, FCRL5 |
191 |
| GSE29618_BCELL_VS_MDC_UP | 7.70e-10 | 24.49 | 10.31 | 2.68e-07 | 3.75e-06 | 9IGKC, IGHG1, TENT5C, IGKV3-20, POU2AF1, IGHM, PIM2, IGKV4-1, STAP1 |
193 |
| GSE29618_BCELL_VS_PDC_DAY7_FLU_VACCINE_UP | 3.81e-07 | 17.96 | 6.73 | 1.14e-04 | 1.86e-03 | 7IGKC, TENT5C, IGKV3-20, POU2AF1, IGHM, IGKV4-1, STAP1 |
193 |
| GSE29618_BCELL_VS_PDC_UP | 4.08e-07 | 17.78 | 6.66 | 1.14e-04 | 1.99e-03 | 7IGKC, IGHG1, TENT5C, IGKV3-20, POU2AF1, IGHM, STAP1 |
195 |
| GSE13411_PLASMA_CELL_VS_MEMORY_BCELL_UP | 4.23e-07 | 17.68 | 6.63 | 1.14e-04 | 2.06e-03 | 7IGKC, MZB1, XBP1, PIM2, SLAMF7, ZNF215, PRDM1 |
196 |
| GSE29618_MONOCYTE_VS_PDC_DN | 4.37e-07 | 17.59 | 6.59 | 1.14e-04 | 2.13e-03 | 7IGKC, MZB1, IGHM, IRF4, HERPUD1, GNG7, SEL1L3 |
197 |
| GSE29618_MONOCYTE_VS_PDC_DAY7_FLU_VACCINE_DN | 4.68e-07 | 17.41 | 6.52 | 1.14e-04 | 2.28e-03 | 7IGKC, MZB1, IGHM, IRF4, GNG7, SEL1L3, PIK3CG |
199 |
| GSE20727_CTRL_VS_ROS_INHIBITOR_TREATED_DC_DN | 4.68e-07 | 17.41 | 6.52 | 1.14e-04 | 2.28e-03 | 7IGKC, JCHAIN, XBP1, IRF4, SLAMF7, PRDM1, TXNDC11 |
199 |
Top Ranked Transcription Factors for this Gene Expression Program:
| Gene Symbol | Gene Loading Rank | DNA Binding Domain | Motif Status | IUPAC PWM | GTEx | DepMap | Decartes |
|---|---|---|---|---|---|---|---|
| POU2AF1 | 16 | Yes | Known motif | Obligate heteromer | In vivo/Misc source | Only known motifs are from Transfac or HocoMoco - origin is uncertain | Requires POU2F1 to bind DNA. In the crystal structure (PDB:1CQT), POU2AF1 contacts both the POU2F1 and DNA major groove |
| XBP1 | 18 | Yes | Known motif | Monomer or homomultimer | High-throughput in vitro | None | None |
| IGHM | 19 | No | Unlikely to be sequence specific TF | Not a DNA binding protein | No motif | None | None |
| IRF4 | 27 | Yes | Known motif | Monomer or homomultimer | High-throughput in vitro | None | None |
| ZNF215 | 34 | Yes | Likely to be sequence specific TF | Monomer or homomultimer | No motif | None | None |
| PRDM1 | 36 | Yes | Known motif | Monomer or homomultimer | High-throughput in vitro | None | None |
| ZBP1 | 71 | No | Unlikely to be sequence specific TF | Low specificity DNA-binding protein | No motif | None | ZBP1 is structurally-specific for Z-DNA, but does not have any sequence specificity (PDB: 1J75; PMID: 11524677) |
| BTG2 | 73 | No | Unlikely to be sequence specific TF | Not a DNA binding protein | No motif | None | Transcriptional co-factor (PMID: 10617598) |
| ESR1 | 76 | Yes | Known motif | Monomer or homomultimer | High-throughput in vitro | None | None |
| NCOA3 | 83 | Yes | Likely to be sequence specific TF | Obligate heteromer | No motif | None | NCOA½/3 all have been tested on PBMs and HT-SELEX without yielding a motif. All are co-activators, collectively suggesting they might be obligate heteromers. |
| CREB3L2 | 87 | Yes | Known motif | Monomer or homomultimer | 100 perc ID - in vitro | None | None |
| TSC22D3 | 115 | No | Unlikely to be sequence specific TF | Not a DNA binding protein | No motif | None | There is some evidence that a related protein (TSC22D1) binds DNA specifically - thus, it is possible this is also a TF. |
| PELI1 | 126 | No | Unlikely to be sequence specific TF | Not a DNA binding protein | No motif | None | Ubiquitin ligase |
| HIPK2 | 140 | No | Unlikely to be sequence specific TF | Not a DNA binding protein | No motif | None | Transcriptional cofactor that can act as a coactivator or corepressor. Phosphorylates many transcription factors. (UniProt Q9H2X6) |
| EAF2 | 161 | No | Unlikely to be sequence specific TF | Not a DNA binding protein | No motif | None | No convincing evidence that this protein binds DNA with any sequence specificity, or that this activity is required for its function. Thus at best the current evidence is that it is a cofactor of some sort cofactor (PMID: 12446457) |
| MED13L | 171 | No | Unlikely to be sequence specific TF | Not a DNA binding protein | No motif | None | None |
| EIF2AK4 | 175 | No | Unlikely to be sequence specific TF | Not a DNA binding protein | No motif | None | None |
| DNAJC1 | 183 | No | Unlikely to be sequence specific TF | Not a DNA binding protein | No motif | None | Contains 2 SANT domains, and no other putative DNA-binding domains |
| KLF2 | 186 | Yes | Known motif | Monomer or homomultimer | High-throughput in vitro | None | None |
| CFLAR | 190 | No | Unlikely to be sequence specific TF | Not a DNA binding protein | No motif | None | None |
Druggable Genes for this Gene Expression Program:
| Gene Symbol | Gene Loading Rank | Drug Names | Drug Category | GTEx | DepMap |
|---|---|---|---|---|---|
| PIM2 | 25 | 3AZD-1208, SGI-1776, LGH-447 |
Small molecule | GTEx | DepMap |
| SLAMF7 | 31 | 1ELOTUZUMAB |
Antibody | GTEx | DepMap |
| PIK3CG | 49 | 6SONOLISIB, LY-3023414, BGT-226, ZSTK-474, PF-04691502, TG100-115 |
Small molecule | GTEx | DepMap |
| CD38 | 52 | 1DARATUMUMAB |
Antibody | GTEx | DepMap |
| ESR1 | 76 | 23DIETHYLSTILBESTROL DIPHOSPHATE, TAMOXIFEN, TOREMIFENE, ESTRADIOL ACETATE, ESTROGENS, ESTERIFIED, SYNTHETIC CONJUGATED ESTROGENS, B, ESTROGENS, CONJUGATED, ESTROGENS, CONJUGATED SYNTHETIC A, BAZEDOXIFENE, CLOMIPHENE CITRATE, OSPEMIFENE, ESTRONE SULFURIC ACID, ESTRADIOL CYPIONATE, POLYESTRADIOL PHOSPHATE, MESTRANOL, QUINESTROL, ETHINYL ESTRADIOL, ESTRADIOL, DIETHYLSTILBESTROL, FULVESTRANT, ESTRADIOL VALERATE, ESTRONE, DIENESTROL |
Small molecule | GTEx | DepMap |
| DHFR | 210 | 3PEMETREXED DISODIUM, PRALATREXATE, METHOTREXATE |
Small molecule | GTEx | DepMap |
| CCR2 | 229 | 3CCX140, PF-04634817, AZD2423 |
Small molecule | GTEx | DepMap |
| SCNN1B | 239 | 2AMILORIDE, TRIAMTERENE |
Small molecule | GTEx | DepMap |
| CXCR4 | 265 | 1PLERIXAFOR |
Small molecule | GTEx | DepMap |
| TRPV3 | 276 | 1GRC-15300 |
Small molecule | GTEx | DepMap |
| TYMP | 306 | 1TIPIRACIL |
Small molecule | GTEx | DepMap |
| BTK | 323 | 1IBRUTINIB |
Small molecule | GTEx | DepMap |
| SYK | 335 | 4R-333, Cerdulatinib, R-112, TAMATINIB |
Small molecule | GTEx | DepMap |
| ITGB7 | 392 | 1VEDOLIZUMAB |
Antibody | GTEx | DepMap |
| MAPKAPK2 | 411 | 1AT-13148 |
Small molecule | GTEx | DepMap |
| CYSLTR1 | 412 | 2MONTELUKAST, ZAFIRLUKAST |
Small molecule | GTEx | DepMap |
| CDK14 | 444 | 2Roniciclib, AT-7519 |
Small molecule | GTEx | DepMap |
| S1PR4 | 445 | 1FINGOLIMOD |
Small molecule | GTEx | DepMap |
| KCNA2 | 486 | 2GUANIDINE, DALFAMPRIDINE |
Small molecule | GTEx | DepMap |
| DPEP1 | 505 | 1CILASTATIN |
Small molecule | GTEx | DepMap |
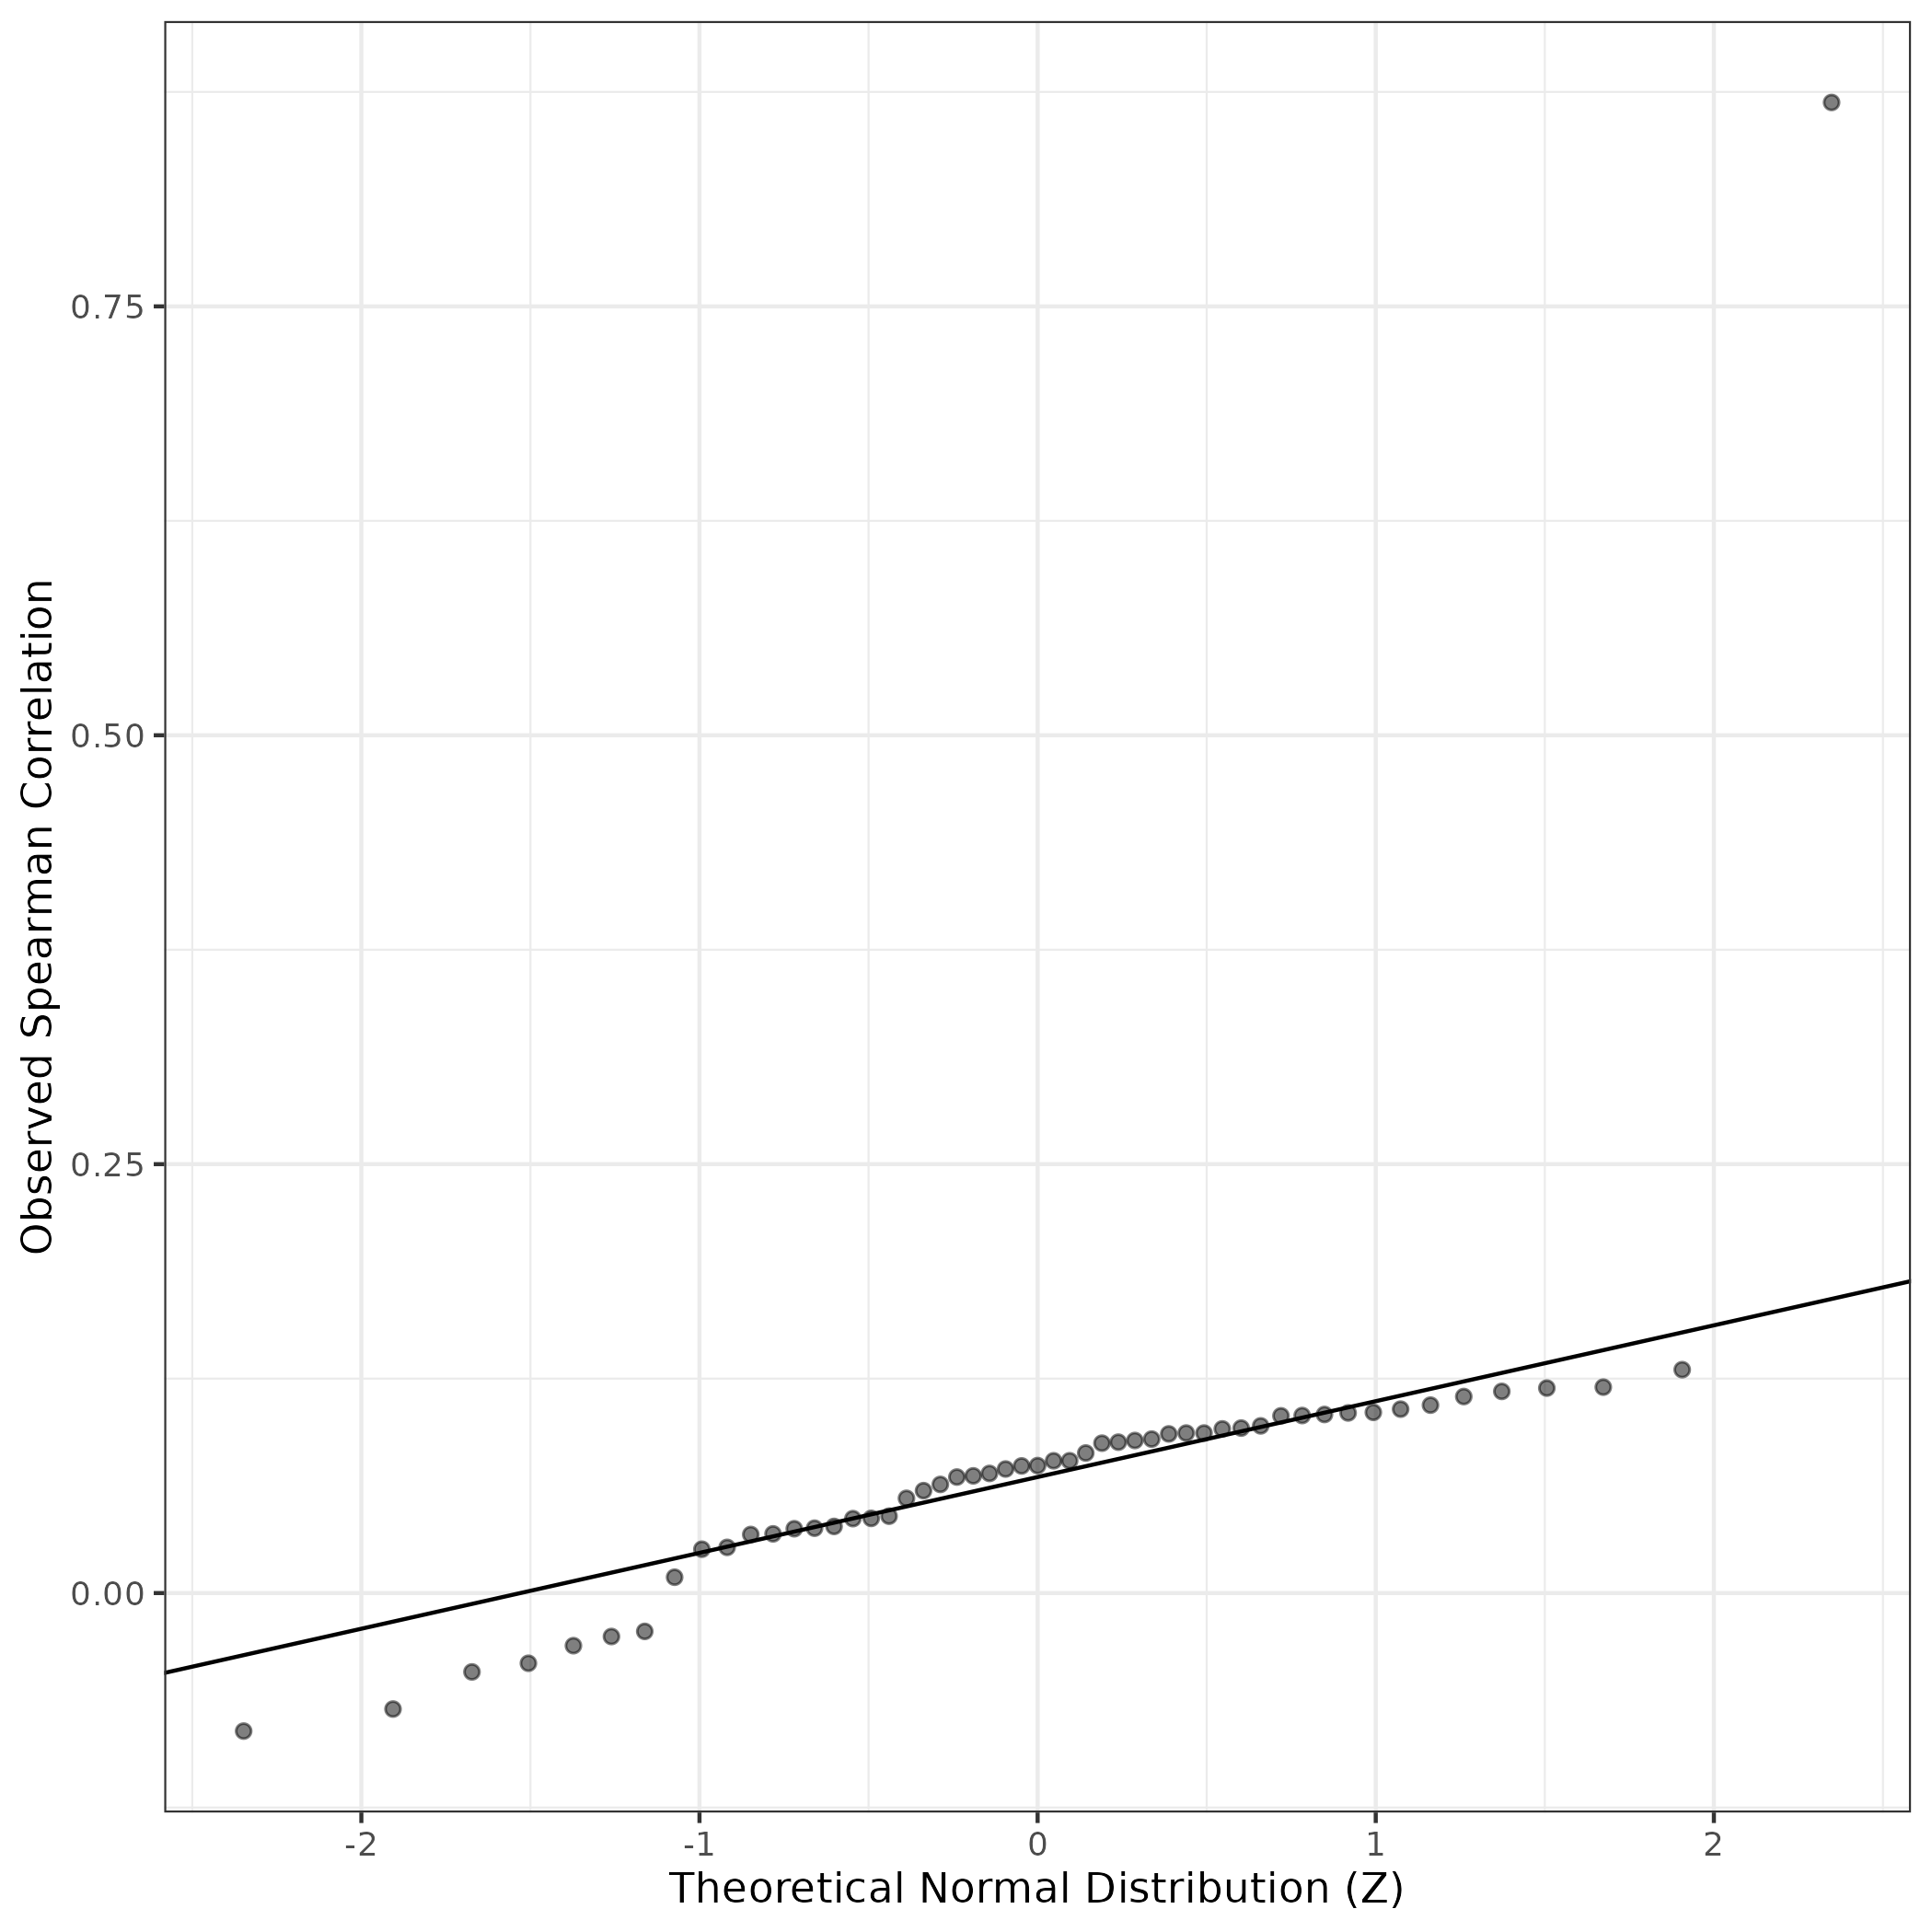
QQ Plot showing correlations with other GEPs in this dataset, calculated by Spearman correlation:
Interactive QQ-plot of gene loadings:
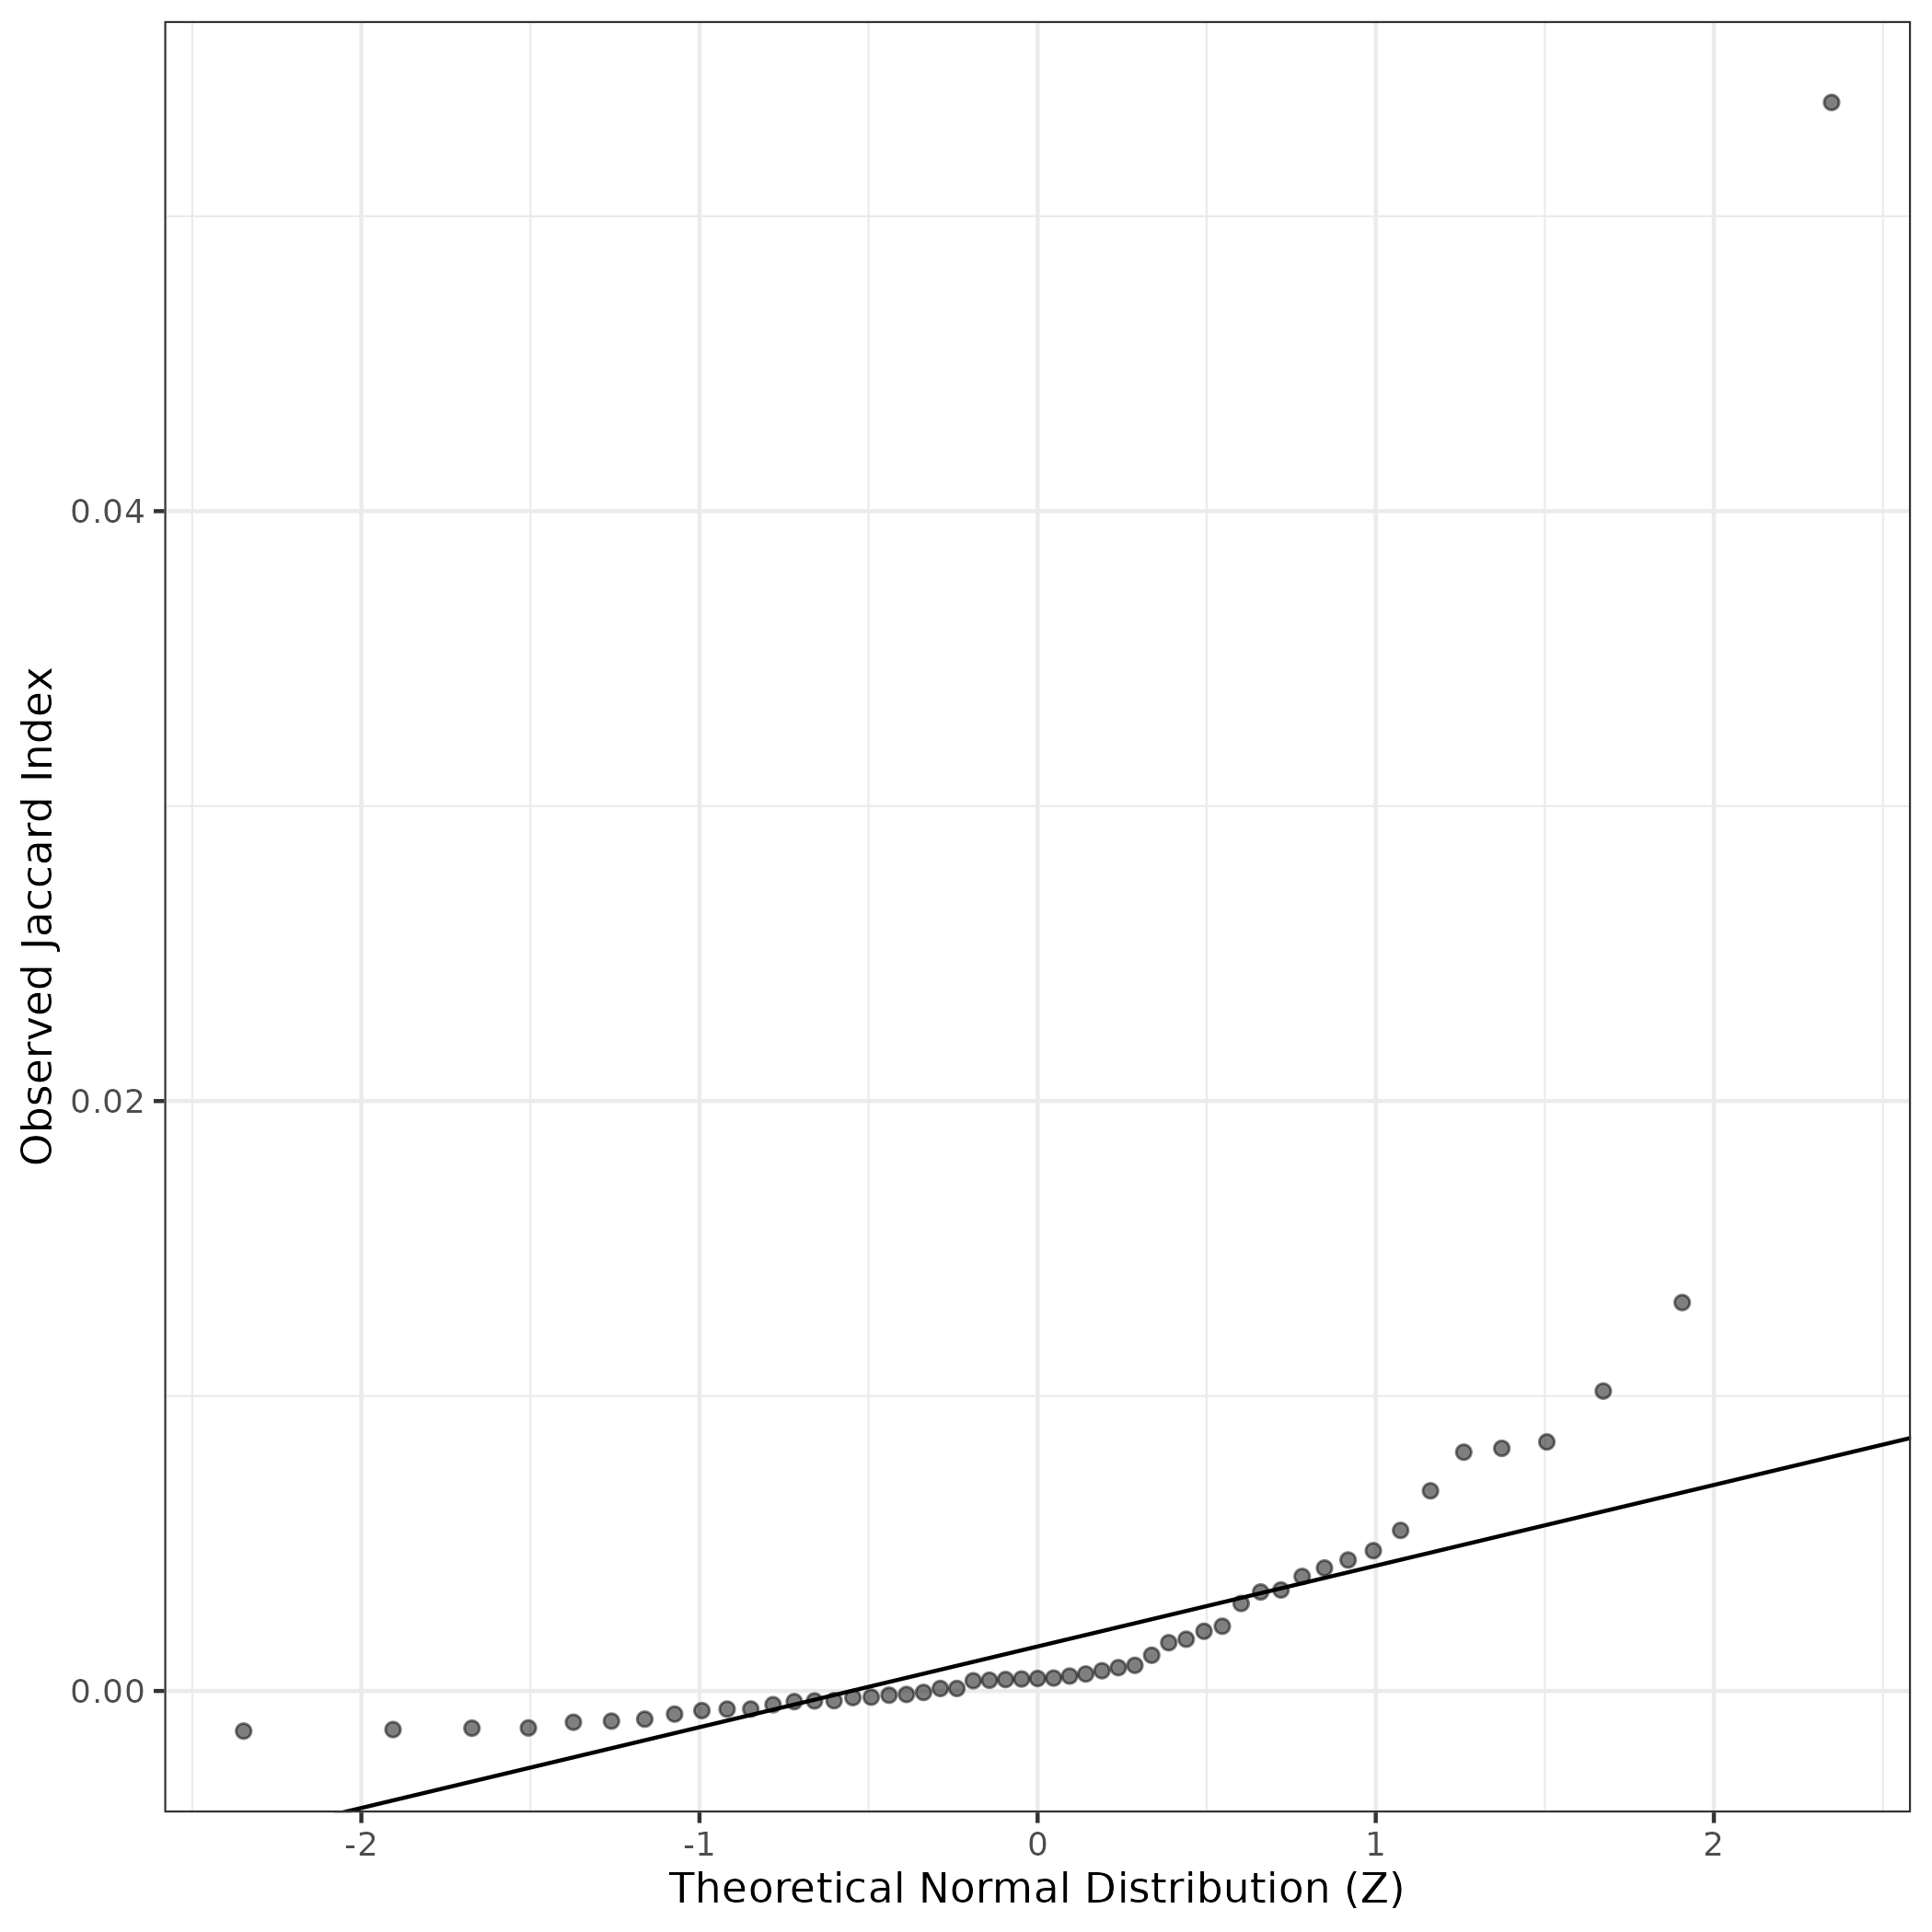
A similar QQ-plot as above, but only for instances where the H value is e.g. > 25, i.e. we are confident that the expression program is active above noise. Agreemenet between these binary vectors is tested using the Jaccard Index, with the P-values calculated by an exact test:
Interactive QQ-plot:
Singler cell type annotations for the top 50 cells on this program.
| Cell ID | Singler label | Singler Delta | Activity Score | Top Singler Raw Scores |
|---|---|---|---|---|
| AGACACTAGTTGCTGT-1_HTA4_1001_4004 | B_cell | 0.09 | 3477.50 | Raw ScoresB_cell: 0.28, Pro-B_cell_CD34+: 0.23, HSC_-G-CSF: 0.23, Pre-B_cell_CD34-: 0.22, NK_cell: 0.22, T_cells: 0.22, DC: 0.22, Monocyte: 0.22, Macrophage: 0.21, GMP: 0.21 |
| ATGAGTCGTTCGCGTG-1_HTA4_1001_4004 | B_cell | 0.07 | 2536.05 | Raw ScoresB_cell: 0.27, NK_cell: 0.23, T_cells: 0.22, HSC_-G-CSF: 0.22, Pro-B_cell_CD34+: 0.22, DC: 0.22, Monocyte: 0.22, Platelets: 0.21, Macrophage: 0.21, Pre-B_cell_CD34-: 0.21 |
| GACTATGTCGAAGCCC-1_HTA4_1001_4004 | B_cell | 0.09 | 2180.25 | Raw ScoresB_cell: 0.29, T_cells: 0.27, NK_cell: 0.27, HSC_-G-CSF: 0.25, Platelets: 0.25, Pro-B_cell_CD34+: 0.25, Pre-B_cell_CD34-: 0.25, Monocyte: 0.25, DC: 0.24, GMP: 0.24 |
| CGTTGGGCAGATTTCG-1_HTA4_1001_4003 | B_cell | 0.08 | 1072.37 | Raw ScoresB_cell: 0.21, NK_cell: 0.18, T_cells: 0.17, Monocyte: 0.17, HSC_-G-CSF: 0.17, DC: 0.16, Pre-B_cell_CD34-: 0.16, Macrophage: 0.16, Platelets: 0.16, BM: 0.15 |
| ATCGCCTAGTGATGGC-1_HTA4_1021_4081 | T_cells | 0.07 | 589.94 | Raw ScoresB_cell: 0.25, T_cells: 0.24, NK_cell: 0.24, Pro-B_cell_CD34+: 0.23, HSC_CD34+: 0.21, Pre-B_cell_CD34-: 0.21, CMP: 0.2, HSC_-G-CSF: 0.2, GMP: 0.2, MEP: 0.2 |
| TATCTTGTCCCGAGGT-1_HTA4_1001_4003 | DC | 0.03 | 447.36 | Raw ScoresDC: 0.1, Macrophage: 0.1, B_cell: 0.1, Monocyte: 0.09, Pre-B_cell_CD34-: 0.09, HSC_-G-CSF: 0.09, Osteoblasts: 0.09, Pro-B_cell_CD34+: 0.09, Tissue_stem_cells: 0.08, T_cells: 0.08 |
| AGAGAGCAGTCACACT-1_HTA4_1001_4003 | B_cell | 0.10 | 408.98 | Raw ScoresB_cell: 0.26, T_cells: 0.22, NK_cell: 0.21, HSC_-G-CSF: 0.2, Pro-B_cell_CD34+: 0.2, Pre-B_cell_CD34-: 0.19, HSC_CD34+: 0.19, Platelets: 0.19, Monocyte: 0.19, DC: 0.19 |
| AAACGCTTCCACGAAT-1_HTA4_1021_4082 | Neurons | 0.07 | 342.43 | Raw ScoresNeurons: 0.17, Astrocyte: 0.14, Neuroepithelial_cell: 0.14, Embryonic_stem_cells: 0.13, iPS_cells: 0.13, B_cell: 0.12, Fibroblasts: 0.11, Pro-B_cell_CD34+: 0.11, Endothelial_cells: 0.11, CMP: 0.11 |
| TCATCCGTCCGATCGG-1_HTA4_1004_4014 | Neurons | 0.03 | 321.38 | Raw ScoresAstrocyte: 0.19, Neurons: 0.18, B_cell: 0.18, DC: 0.18, Macrophage: 0.17, Fibroblasts: 0.16, Smooth_muscle_cells: 0.16, Monocyte: 0.16, NK_cell: 0.16, Neuroepithelial_cell: 0.16 |
| TGTAGACTCTATGCCC-1_HTA4_1007_4024 | Neurons | 0.15 | 309.65 | Raw ScoresNeurons: 0.25, Astrocyte: 0.22, Neuroepithelial_cell: 0.22, Embryonic_stem_cells: 0.18, iPS_cells: 0.17, Osteoblasts: 0.15, Smooth_muscle_cells: 0.15, Endothelial_cells: 0.14, MSC: 0.14, Chondrocytes: 0.14 |
| CATGCCTGTGGCACTC-1_HTA4_1015_4054 | Neurons | 0.11 | 303.04 | Raw ScoresNeurons: 0.15, Neuroepithelial_cell: 0.13, Astrocyte: 0.13, Embryonic_stem_cells: 0.11, MSC: 0.09, Endothelial_cells: 0.08, iPS_cells: 0.08, Smooth_muscle_cells: 0.08, Osteoblasts: 0.07, Tissue_stem_cells: 0.07 |
| GGGTTATTCGTCCTCA-1_HTA4_1015_4054 | Neurons | 0.15 | 302.73 | Raw ScoresNeurons: 0.21, Neuroepithelial_cell: 0.2, Astrocyte: 0.16, Embryonic_stem_cells: 0.16, iPS_cells: 0.15, MSC: 0.11, Endothelial_cells: 0.1, Smooth_muscle_cells: 0.1, Fibroblasts: 0.09, Tissue_stem_cells: 0.09 |
| TGTCCACTCATTGTGG-1_HTA4_1006_4019 | Neurons | 0.12 | 270.86 | Raw ScoresNeurons: 0.18, Neuroepithelial_cell: 0.16, Astrocyte: 0.15, Embryonic_stem_cells: 0.14, iPS_cells: 0.12, Fibroblasts: 0.11, Smooth_muscle_cells: 0.11, Osteoblasts: 0.11, MSC: 0.11, Chondrocytes: 0.11 |
| CCTCACACATATCGGT-1_HTA4_1003_4010 | Neurons | 0.08 | 230.07 | Raw ScoresNeuroepithelial_cell: 0.16, Neurons: 0.15, Astrocyte: 0.15, Embryonic_stem_cells: 0.14, iPS_cells: 0.13, Chondrocytes: 0.11, Fibroblasts: 0.11, MSC: 0.11, Osteoblasts: 0.1, Tissue_stem_cells: 0.1 |
| ATCCTATGTAAGATAC-1_HTA4_1008_4029 | Astrocyte | 0.05 | 195.77 | Raw ScoresNeuroepithelial_cell: 0.15, Astrocyte: 0.15, Neurons: 0.15, Embryonic_stem_cells: 0.14, Chondrocytes: 0.14, Tissue_stem_cells: 0.13, MSC: 0.13, Fibroblasts: 0.13, Osteoblasts: 0.13, iPS_cells: 0.13 |
| AAGACAAGTTCGGCTG-1_HTA4_1021_4081 | B_cell | 0.08 | 189.84 | Raw ScoresB_cell: 0.2, T_cells: 0.17, NK_cell: 0.17, HSC_-G-CSF: 0.17, Platelets: 0.16, Pre-B_cell_CD34-: 0.16, Pro-B_cell_CD34+: 0.15, Monocyte: 0.15, DC: 0.15, HSC_CD34+: 0.14 |
| TGTTCCGCAGCCCACA-1_HTA4_1021_4081 | B_cell | 0.10 | 178.06 | Raw ScoresB_cell: 0.24, HSC_-G-CSF: 0.22, T_cells: 0.21, NK_cell: 0.21, Pre-B_cell_CD34-: 0.2, Platelets: 0.2, Pro-B_cell_CD34+: 0.2, Monocyte: 0.19, Neutrophils: 0.19, DC: 0.18 |
| ATTTCACTCTACTTCA-1_HTA4_1003_4010 | B_cell | 0.06 | 171.97 | Raw ScoresB_cell: 0.2, T_cells: 0.16, Platelets: 0.16, NK_cell: 0.16, HSC_-G-CSF: 0.16, Pro-B_cell_CD34+: 0.16, Pre-B_cell_CD34-: 0.15, BM: 0.15, Monocyte: 0.15, Neurons: 0.14 |
| CGTCCATTCGGTGTTA-1_HTA4_1012_4045 | B_cell | 0.05 | 171.23 | Raw ScoresB_cell: 0.21, NK_cell: 0.18, Macrophage: 0.18, DC: 0.18, Pro-B_cell_CD34+: 0.17, HSC_CD34+: 0.17, Monocyte: 0.17, T_cells: 0.17, Platelets: 0.16, Endothelial_cells: 0.16 |
| CTGCTCAAGCTCGAAG-1_HTA4_1005_4017 | Neurons | 0.07 | 160.37 | Raw ScoresFibroblasts: 0.18, Smooth_muscle_cells: 0.18, Tissue_stem_cells: 0.17, Chondrocytes: 0.17, Neurons: 0.17, Osteoblasts: 0.16, MSC: 0.16, iPS_cells: 0.16, Neuroepithelial_cell: 0.16, Astrocyte: 0.16 |
| CTTCCTTAGAATCGTA-1_HTA4_1012_4046 | B_cell | 0.08 | 157.84 | Raw ScoresB_cell: 0.2, Platelets: 0.17, T_cells: 0.16, NK_cell: 0.16, HSC_-G-CSF: 0.16, Pre-B_cell_CD34-: 0.16, Pro-B_cell_CD34+: 0.15, HSC_CD34+: 0.15, Monocyte: 0.15, Macrophage: 0.15 |
| CATACTTCAGTTACCA-1_HTA4_1015_4057 | Neurons | 0.04 | 154.94 | Raw ScoresNeurons: 0.18, B_cell: 0.18, NK_cell: 0.17, Astrocyte: 0.17, HSC_CD34+: 0.16, Platelets: 0.16, Pro-B_cell_CD34+: 0.16, T_cells: 0.16, HSC_-G-CSF: 0.16, Monocyte: 0.16 |
| TAAGTCGAGCCAAGTG-1_HTA4_1008_4030 | Neurons | 0.18 | 120.68 | Raw ScoresNeurons: 0.3, Neuroepithelial_cell: 0.3, Fibroblasts: 0.3, Astrocyte: 0.3, MSC: 0.29, Smooth_muscle_cells: 0.29, Osteoblasts: 0.29, iPS_cells: 0.28, Chondrocytes: 0.27, Embryonic_stem_cells: 0.27 |
| CTTGATTCATGTTTGG-1_HTA4_1005_4016 | Macrophage | 0.08 | 111.80 | Raw ScoresMacrophage: 0.25, DC: 0.25, Monocyte: 0.25, HSC_-G-CSF: 0.21, Pre-B_cell_CD34-: 0.2, Neutrophils: 0.2, HSC_CD34+: 0.19, GMP: 0.19, Neurons: 0.19, NK_cell: 0.19 |
| CACGAATCACTAGTAC-1_HTA4_1006_4021 | Astrocyte | 0.10 | 111.46 | Raw ScoresNeuroepithelial_cell: 0.13, Neurons: 0.13, Astrocyte: 0.13, Embryonic_stem_cells: 0.12, iPS_cells: 0.11, Fibroblasts: 0.09, Osteoblasts: 0.09, Smooth_muscle_cells: 0.08, MSC: 0.08, Endothelial_cells: 0.08 |
| CTAAGTGGTGTTCATG-1_HTA4_1020_4077 | B_cell | 0.04 | 107.27 | Raw ScoresB_cell: 0.17, Astrocyte: 0.15, Endothelial_cells: 0.15, Platelets: 0.15, Neurons: 0.15, NK_cell: 0.14, Smooth_muscle_cells: 0.14, Osteoblasts: 0.14, Fibroblasts: 0.14, HSC_CD34+: 0.13 |
| CCCAACTCAGAACATA-1_HTA4_1008_4030 | Neurons | 0.08 | 105.70 | Raw ScoresAstrocyte: 0.28, Neurons: 0.28, Neuroepithelial_cell: 0.27, Endothelial_cells: 0.25, MSC: 0.25, Osteoblasts: 0.24, Fibroblasts: 0.24, Embryonic_stem_cells: 0.24, Smooth_muscle_cells: 0.24, Platelets: 0.24 |
| GATTCTTAGGTATTGA-1_HTA4_1017_4064 | B_cell | 0.11 | 104.89 | Raw ScoresB_cell: 0.25, Platelets: 0.2, Pro-B_cell_CD34+: 0.2, T_cells: 0.19, NK_cell: 0.19, HSC_-G-CSF: 0.19, HSC_CD34+: 0.18, Pre-B_cell_CD34-: 0.17, BM: 0.17, GMP: 0.17 |
| AGGTCATCATTGCTTT-1_HTA4_1019_4075 | Hepatocytes | 0.13 | 101.90 | Raw ScoresOsteoblasts: 0.29, Smooth_muscle_cells: 0.28, Chondrocytes: 0.28, Tissue_stem_cells: 0.28, Fibroblasts: 0.28, iPS_cells: 0.26, Hepatocytes: 0.25, MSC: 0.24, Endothelial_cells: 0.22, Astrocyte: 0.22 |
| AGCGCTGGTTCGTGCG-1_HTA4_1005_4017 | Endothelial_cells | 0.15 | 101.28 | Raw ScoresEndothelial_cells: 0.32, Smooth_muscle_cells: 0.28, Osteoblasts: 0.27, Fibroblasts: 0.27, Chondrocytes: 0.25, MSC: 0.25, Tissue_stem_cells: 0.25, iPS_cells: 0.24, Astrocyte: 0.23, Neurons: 0.22 |
| ACTCCCATCTCATGGA-1_HTA4_1017_4064 | Neurons | 0.22 | 97.48 | Raw ScoresNeurons: 0.45, Neuroepithelial_cell: 0.43, Astrocyte: 0.43, Embryonic_stem_cells: 0.37, iPS_cells: 0.35, MSC: 0.34, Tissue_stem_cells: 0.3, Fibroblasts: 0.3, Endothelial_cells: 0.3, Smooth_muscle_cells: 0.29 |
| TCTGGCTAGACAGCTG-1_HTA4_1012_4046 | B_cell | 0.07 | 95.18 | Raw ScoresB_cell: 0.19, NK_cell: 0.17, T_cells: 0.16, Monocyte: 0.14, Platelets: 0.14, Pro-B_cell_CD34+: 0.13, Pre-B_cell_CD34-: 0.13, HSC_CD34+: 0.13, HSC_-G-CSF: 0.13, DC: 0.13 |
| CCTCCTCAGCGATCGA-1_HTA4_1017_4064 | B_cell | 0.08 | 93.99 | Raw ScoresB_cell: 0.16, Pro-B_cell_CD34+: 0.13, HSC_CD34+: 0.12, Platelets: 0.12, BM: 0.12, GMP: 0.11, T_cells: 0.11, CMP: 0.11, NK_cell: 0.11, Pre-B_cell_CD34-: 0.11 |
| TCCATCGGTGTTTACG-1_HTA4_1023_4088 | Smooth_muscle_cells | 0.12 | 92.46 | Raw ScoresSmooth_muscle_cells: 0.32, Fibroblasts: 0.31, Osteoblasts: 0.31, Chondrocytes: 0.3, Tissue_stem_cells: 0.3, DC: 0.28, iPS_cells: 0.28, Macrophage: 0.27, MSC: 0.27, Monocyte: 0.27 |
| AATGGAAGTAGACGTG-1_HTA4_1008_4030 | Fibroblasts | 0.17 | 91.64 | Raw ScoresFibroblasts: 0.27, Astrocyte: 0.26, Neuroepithelial_cell: 0.26, Neurons: 0.26, Osteoblasts: 0.26, MSC: 0.25, Chondrocytes: 0.24, Smooth_muscle_cells: 0.24, iPS_cells: 0.24, Tissue_stem_cells: 0.23 |
| GACTTCCTCTGGTGCG-1_HTA4_1008_4030 | Smooth_muscle_cells | 0.10 | 88.06 | Raw ScoresFibroblasts: 0.18, Neuroepithelial_cell: 0.17, Smooth_muscle_cells: 0.17, Osteoblasts: 0.17, MSC: 0.16, Astrocyte: 0.16, Neurons: 0.16, Embryonic_stem_cells: 0.16, Chondrocytes: 0.16, Tissue_stem_cells: 0.16 |
| GTACAACCATCGATCA-1_HTA4_1020_4078 | Neurons | 0.04 | 85.50 | Raw ScoresB_cell: 0.2, Neurons: 0.19, Astrocyte: 0.18, Platelets: 0.18, Endothelial_cells: 0.17, NK_cell: 0.17, Neuroepithelial_cell: 0.17, Pro-B_cell_CD34+: 0.17, Osteoblasts: 0.17, T_cells: 0.17 |
| GCACGTGTCGATACAC-1_HTA4_1021_4081 | B_cell | 0.05 | 81.47 | Raw ScoresB_cell: 0.17, T_cells: 0.16, NK_cell: 0.16, Pro-B_cell_CD34+: 0.15, BM: 0.15, HSC_-G-CSF: 0.15, Pre-B_cell_CD34-: 0.15, BM & Prog.: 0.14, MEP: 0.14, HSC_CD34+: 0.14 |
| ATCCCTGAGGCTTCCG-1_HTA4_1008_4030 | Neurons | 0.14 | 81.37 | Raw ScoresNeurons: 0.28, Neuroepithelial_cell: 0.25, Astrocyte: 0.24, Embryonic_stem_cells: 0.22, iPS_cells: 0.2, MSC: 0.19, Endothelial_cells: 0.18, Smooth_muscle_cells: 0.18, Fibroblasts: 0.17, Osteoblasts: 0.16 |
| GGGTAGAGTGTCTTAG-1_HTA4_1008_4030 | Neurons | 0.09 | 78.69 | Raw ScoresNeurons: 0.24, Astrocyte: 0.23, Neuroepithelial_cell: 0.23, Embryonic_stem_cells: 0.21, iPS_cells: 0.2, Osteoblasts: 0.19, MSC: 0.18, Fibroblasts: 0.18, Endothelial_cells: 0.18, Smooth_muscle_cells: 0.18 |
| GTAGATCAGGCTAAAT-1_HTA4_1017_4064 | Neurons | 0.14 | 77.55 | Raw ScoresNeurons: 0.26, Astrocyte: 0.24, Neuroepithelial_cell: 0.24, Embryonic_stem_cells: 0.2, MSC: 0.19, Smooth_muscle_cells: 0.19, iPS_cells: 0.18, Fibroblasts: 0.18, Tissue_stem_cells: 0.18, Chondrocytes: 0.17 |
| GTTTACTAGACTTAAG-1_HTA4_1005_4016 | Neurons | 0.20 | 74.68 | Raw ScoresNeurons: 0.31, Neuroepithelial_cell: 0.31, Astrocyte: 0.31, Embryonic_stem_cells: 0.26, Smooth_muscle_cells: 0.25, Fibroblasts: 0.25, Osteoblasts: 0.25, MSC: 0.24, iPS_cells: 0.24, Chondrocytes: 0.23 |
| AGGAATAAGACGATAT-1_HTA4_1021_4081 | B_cell | 0.11 | 74.44 | Raw ScoresB_cell: 0.26, T_cells: 0.23, NK_cell: 0.22, HSC_-G-CSF: 0.21, Pro-B_cell_CD34+: 0.21, Platelets: 0.2, Pre-B_cell_CD34-: 0.19, Monocyte: 0.18, HSC_CD34+: 0.18, CMP: 0.18 |
| TGCAGATGTCATCGGC-1_HTA4_1017_4064 | Neurons | 0.11 | 73.97 | Raw ScoresAstrocyte: 0.21, Smooth_muscle_cells: 0.21, Fibroblasts: 0.2, Neuroepithelial_cell: 0.19, MSC: 0.19, Osteoblasts: 0.19, Neurons: 0.19, iPS_cells: 0.19, Tissue_stem_cells: 0.18, Chondrocytes: 0.18 |
| CGGCAGTCACTCCACT-1_HTA4_1021_4081 | B_cell | 0.10 | 71.30 | Raw ScoresB_cell: 0.26, NK_cell: 0.22, HSC_-G-CSF: 0.22, T_cells: 0.22, Pre-B_cell_CD34-: 0.21, Pro-B_cell_CD34+: 0.2, Monocyte: 0.2, DC: 0.19, BM: 0.19, HSC_CD34+: 0.19 |
| GAGGCCTAGGTCACCC-1_HTA4_1019_4075 | Hepatocytes | 0.16 | 71.01 | Raw ScoresHepatocytes: 0.22, Tissue_stem_cells: 0.1, Smooth_muscle_cells: 0.09, Fibroblasts: 0.09, Osteoblasts: 0.09, Chondrocytes: 0.08, Platelets: 0.07, Epithelial_cells: 0.07, Endothelial_cells: 0.07, iPS_cells: 0.07 |
| AGGAGGTGTCTTTCAT-1_HTA4_1004_4015 | Neurons | 0.04 | 69.90 | Raw ScoresNeurons: 0.14, Neuroepithelial_cell: 0.13, DC: 0.13, Fibroblasts: 0.13, Astrocyte: 0.13, Macrophage: 0.13, Osteoblasts: 0.13, Smooth_muscle_cells: 0.13, MSC: 0.13, iPS_cells: 0.12 |
| TCCTTTCCAAACCACT-1_HTA4_1018_4067 | Neurons | 0.16 | 68.34 | Raw ScoresNeurons: 0.27, Astrocyte: 0.26, Neuroepithelial_cell: 0.25, Fibroblasts: 0.22, Smooth_muscle_cells: 0.22, Embryonic_stem_cells: 0.21, Osteoblasts: 0.21, iPS_cells: 0.2, Tissue_stem_cells: 0.2, MSC: 0.2 |
| TGCAGATTCAAGAGTA-1_HTA4_1018_4069 | Neurons | 0.05 | 67.56 | Raw ScoresAstrocyte: 0.16, Neuroepithelial_cell: 0.15, Neurons: 0.15, Embryonic_stem_cells: 0.13, Fibroblasts: 0.13, iPS_cells: 0.13, Smooth_muscle_cells: 0.13, MSC: 0.13, Osteoblasts: 0.13, Platelets: 0.12 |
| AGCCACGTCTTGTTAC-1_HTA4_1001_4003 | Smooth_muscle_cells | 0.20 | 66.36 | Raw ScoresFibroblasts: 0.33, Neurons: 0.33, Smooth_muscle_cells: 0.32, Osteoblasts: 0.32, Chondrocytes: 0.31, Tissue_stem_cells: 0.3, MSC: 0.3, iPS_cells: 0.29, Astrocyte: 0.29, Endothelial_cells: 0.29 |
Below shows the significant enrichments of this GEP for literature curated gene lists
This data was procured from existing single cell RNA-seq maps of neuroblastoma or related relevant data.
High ranks indicate this gene is a driver of this GEP.
These curated gene list are ranked by the P-value (on this GEP) of their constituent genes.
The Mean Count column shows the mean read count in cells scoring highly (H > 50) on this gene expression program.
M1 Macrophage
These genes were collated from multiple sources:
Wilcoxon ranksum test P-value for gene set overrepresentation: 2.09e-04
Mean rank of genes in gene set: 5485.21
Rank on gene expression program of genes in gene set:
| Genes | Weight | Rank | GTEx | DepMap | Decartes | Mean.Counts | Mean.TPM |
|---|---|---|---|---|---|---|---|
| CXCL9 | 0.0002381 | 1489 | GTEx | DepMap | Descartes | 0.02 | 3.89 |
| IL18 | 0.0002235 | 1593 | GTEx | DepMap | Descartes | 0.13 | 44.95 |
| CCL4 | 0.0002181 | 1636 | GTEx | DepMap | Descartes | 0.03 | 14.38 |
| CXCL11 | 0.0001868 | 1904 | GTEx | DepMap | Descartes | 0.00 | 0.00 |
| CXCL10 | 0.0001487 | 2298 | GTEx | DepMap | Descartes | 0.00 | 1.78 |
| CCL2 | 0.0001223 | 2644 | GTEx | DepMap | Descartes | 0.16 | 76.86 |
| TNF | 0.0001147 | 2781 | GTEx | DepMap | Descartes | 0.02 | 13.26 |
| CD14 | 0.0001054 | 2954 | GTEx | DepMap | Descartes | 0.11 | 45.78 |
| IL1B | 0.0000986 | 3109 | GTEx | DepMap | Descartes | 0.03 | 8.39 |
| IL33 | 0.0000955 | 3168 | GTEx | DepMap | Descartes | 0.08 | 17.12 |
| CCL5 | 0.0000772 | 3601 | GTEx | DepMap | Descartes | 0.06 | 46.18 |
| CCL3 | 0.0000766 | 3621 | GTEx | DepMap | Descartes | 0.03 | 16.14 |
| CXCL16 | 0.0000695 | 3777 | GTEx | DepMap | Descartes | 0.04 | 8.55 |
| CD80 | 0.0000355 | 4895 | GTEx | DepMap | Descartes | 0.06 | 19.81 |
| IL6 | -0.0000155 | 9346 | GTEx | DepMap | Descartes | 0.01 | 4.14 |
| TLR4 | -0.0000267 | 10515 | GTEx | DepMap | Descartes | 0.00 | 0.05 |
| CXCL8 | -0.0000487 | 12319 | GTEx | DepMap | Descartes | 0.02 | NA |
| ITGAX | -0.0000829 | 14359 | GTEx | DepMap | Descartes | 0.30 | 33.57 |
| CD86 | -0.0002033 | 18210 | GTEx | DepMap | Descartes | 0.23 | 54.17 |
Stress response (Dong)
Markers obtained in computationally inferred meta program (by NMF applied to their neuroblastoma sc-RNA-seq data) from Fig. 5(a) of Dong et al. (PMID 32946775).:
Wilcoxon ranksum test P-value for gene set overrepresentation: 2.27e-03
Mean rank of genes in gene set: 558.33
Rank on gene expression program of genes in gene set:
| Genes | Weight | Rank | GTEx | DepMap | Decartes | Mean.Counts | Mean.TPM |
|---|---|---|---|---|---|---|---|
| FOS | 0.0008916 | 384 | GTEx | DepMap | Descartes | 2.18 | 569.35 |
| JUN | 0.0006252 | 572 | GTEx | DepMap | Descartes | 1.07 | 185.08 |
| JUNB | 0.0005086 | 719 | GTEx | DepMap | Descartes | 0.78 | 250.90 |
Antigen Presenting CAF
These marker genes were curated across cancer subtypes in multiple organ systems as reviewed in Lavie et. al. (PMID 35883004) and contain antigen presenting specific CAF genes:
Wilcoxon ranksum test P-value for gene set overrepresentation: 3.61e-03
Mean rank of genes in gene set: 6423.53
Rank on gene expression program of genes in gene set:
| Genes | Weight | Rank | GTEx | DepMap | Decartes | Mean.Counts | Mean.TPM |
|---|---|---|---|---|---|---|---|
| CD74 | 0.0010669 | 297 | GTEx | DepMap | Descartes | 1.46 | 327.41 |
| CCL19 | 0.0009020 | 375 | GTEx | DepMap | Descartes | 0.25 | 212.22 |
| HLA-DRA | 0.0007861 | 433 | GTEx | DepMap | Descartes | 0.65 | 372.64 |
| HLA-DPA1 | 0.0004710 | 779 | GTEx | DepMap | Descartes | 0.30 | 43.46 |
| S100A4 | 0.0003569 | 1019 | GTEx | DepMap | Descartes | 0.12 | 124.79 |
| S100A10 | 0.0001079 | 2912 | GTEx | DepMap | Descartes | 0.20 | 169.42 |
| S100A13 | 0.0000824 | 3483 | GTEx | DepMap | Descartes | 0.06 | 15.85 |
| CCL5 | 0.0000772 | 3601 | GTEx | DepMap | Descartes | 0.06 | 46.18 |
| SLPI | 0.0000301 | 5117 | GTEx | DepMap | Descartes | 0.01 | 16.77 |
| S100A3 | 0.0000123 | 6062 | GTEx | DepMap | Descartes | 0.00 | 0.00 |
| KRT18 | 0.0000045 | 6626 | GTEx | DepMap | Descartes | 0.05 | 12.92 |
| UPK3B | -0.0000155 | 9344 | GTEx | DepMap | Descartes | 0.01 | 0.93 |
| KRT19 | -0.0000361 | 11353 | GTEx | DepMap | Descartes | 0.63 | 284.69 |
| MSLN | -0.0000465 | 12136 | GTEx | DepMap | Descartes | 0.00 | 0.00 |
| KRT8 | -0.0000797 | 14198 | GTEx | DepMap | Descartes | 0.04 | 4.71 |
| HLA-DQA1 | -0.0000862 | 14541 | GTEx | DepMap | Descartes | 0.11 | 6.50 |
| CD83 | -0.0001499 | 16924 | GTEx | DepMap | Descartes | 0.28 | 68.55 |
Below shows ranks on this GEP for literature curated gene lists for large gene sets
These include those reported as mesenchymal/adrenergic by Van Groningen et al.
High ranks indicate this gene is a driver of this GEP (note these results are not ordered).
The Mean Count column shows the mean read count in cells scoring highly (H > 50) on this gene expression program.
VanGroningen Adrenergic Genes
Adrenergic marker genes from Supplementary Table 2 of Van Groningen et al. Nature Genetics 2017. These genes were identified by differential expression analysis of mesenchymal-like and adrenergic-like neuroblastoma cell lines.
Wilcoxon ranksum test P-value for gene set overrepresentation: 1.00e+00
Mean rank of genes in gene set: 16782.82
Median rank of genes in gene set: 18713
Rank on gene expression program of top 30 genes in gene set:
| Genes | Weight | Rank | GTEx | DepMap | Descartes | Mean.Counts | Mean.TPM |
|---|---|---|---|---|---|---|---|
| PDK1 | 0.0032695 | 72 | GTEx | DepMap | Descartes | 1.52 | 87.38 |
| CXCR4 | 0.0011670 | 265 | GTEx | DepMap | Descartes | 0.61 | 223.42 |
| SEC11C | 0.0011005 | 287 | GTEx | DepMap | Descartes | 0.66 | 231.72 |
| DAPK1 | 0.0006950 | 502 | GTEx | DepMap | Descartes | 1.90 | 180.51 |
| KLF13 | 0.0006677 | 526 | GTEx | DepMap | Descartes | 0.84 | 83.53 |
| FOXO3 | 0.0006332 | 563 | GTEx | DepMap | Descartes | 3.30 | 258.20 |
| FAM107B | 0.0004364 | 846 | GTEx | DepMap | Descartes | 1.53 | 253.94 |
| GLCCI1 | 0.0004225 | 869 | GTEx | DepMap | Descartes | 4.69 | 606.16 |
| MSI2 | 0.0003958 | 917 | GTEx | DepMap | Descartes | 8.48 | 627.90 |
| UCP2 | 0.0002720 | 1322 | GTEx | DepMap | Descartes | 0.10 | 42.65 |
| DNAJB1 | 0.0001336 | 2501 | GTEx | DepMap | Descartes | 0.19 | 42.85 |
| INO80C | 0.0001309 | 2527 | GTEx | DepMap | Descartes | 0.00 | 0.90 |
| GLRX | 0.0001249 | 2610 | GTEx | DepMap | Descartes | 0.17 | 37.68 |
| NPY | 0.0000900 | 3288 | GTEx | DepMap | Descartes | 1.92 | 2533.53 |
| TSPAN13 | 0.0000583 | 4109 | GTEx | DepMap | Descartes | 0.20 | 54.09 |
| MYBL2 | 0.0000566 | 4174 | GTEx | DepMap | Descartes | 0.17 | 47.73 |
| CDKN2C | 0.0000429 | 4582 | GTEx | DepMap | Descartes | 0.05 | 10.23 |
| DDX39A | 0.0000409 | 4673 | GTEx | DepMap | Descartes | 0.20 | 76.67 |
| HK2 | 0.0000321 | 5026 | GTEx | DepMap | Descartes | 0.07 | 6.33 |
| ANP32A | 0.0000269 | 5268 | GTEx | DepMap | Descartes | 0.46 | 78.41 |
| ZNF22 | 0.0000233 | 5468 | GTEx | DepMap | Descartes | 0.12 | 27.64 |
| NET1 | 0.0000132 | 5998 | GTEx | DepMap | Descartes | 0.27 | 41.21 |
| SCAMP5 | 0.0000126 | 6049 | GTEx | DepMap | Descartes | 0.52 | 77.42 |
| EML6 | 0.0000120 | 6086 | GTEx | DepMap | Descartes | 0.92 | 58.70 |
| DIABLO | 0.0000113 | 6137 | GTEx | DepMap | Descartes | 0.00 | 0.00 |
| ELAVL2 | 0.0000097 | 6242 | GTEx | DepMap | Descartes | 1.09 | 123.20 |
| CCSAP | 0.0000092 | 6278 | GTEx | DepMap | Descartes | 0.19 | NA |
| MYO5A | 0.0000034 | 6723 | GTEx | DepMap | Descartes | 1.26 | 56.74 |
| BEND4 | 0.0000005 | 6958 | GTEx | DepMap | Descartes | 0.03 | 3.04 |
| CERK | -0.0000022 | 7778 | GTEx | DepMap | Descartes | 0.64 | 73.78 |
VanGroningen Mesenchymal Genes
Mesenchymal marker genes from Supplementary Table 2 of Van Groningen et al. Nature Genetics 2017. These genes were identified by differential expression analysis of mesenchymal-like and adrenergic-like neuroblastoma cell lines.
Wilcoxon ranksum test P-value for gene set overrepresentation: 3.49e-01
Mean rank of genes in gene set: 10188.36
Median rank of genes in gene set: 11094
Rank on gene expression program of top 30 genes in gene set:
| Genes | Weight | Rank | GTEx | DepMap | Descartes | Mean.Counts | Mean.TPM |
|---|---|---|---|---|---|---|---|
| SEL1L3 | 0.0047400 | 42 | GTEx | DepMap | Descartes | 2.72 | 530.93 |
| CREB3L2 | 0.0029944 | 87 | GTEx | DepMap | Descartes | 2.79 | 315.57 |
| EDEM1 | 0.0028789 | 91 | GTEx | DepMap | Descartes | 1.03 | 135.68 |
| TRAM2 | 0.0027526 | 97 | GTEx | DepMap | Descartes | 0.95 | 111.44 |
| FNDC3B | 0.0026767 | 100 | GTEx | DepMap | Descartes | 8.62 | 892.63 |
| TSC22D3 | 0.0022839 | 115 | GTEx | DepMap | Descartes | 1.11 | 358.76 |
| HSP90B1 | 0.0022207 | 119 | GTEx | DepMap | Descartes | 2.37 | 599.34 |
| HLA-B | 0.0020548 | 127 | GTEx | DepMap | Descartes | 0.97 | 470.74 |
| DUSP5 | 0.0019754 | 133 | GTEx | DepMap | Descartes | 0.42 | 120.71 |
| B2M | 0.0019104 | 141 | GTEx | DepMap | Descartes | 5.12 | 1507.56 |
| RRBP1 | 0.0018502 | 147 | GTEx | DepMap | Descartes | 1.25 | 191.41 |
| HLA-C | 0.0017390 | 163 | GTEx | DepMap | Descartes | 0.56 | 192.69 |
| DNAJC1 | 0.0016248 | 183 | GTEx | DepMap | Descartes | 1.72 | 606.78 |
| PDIA4 | 0.0015093 | 202 | GTEx | DepMap | Descartes | 0.66 | 167.20 |
| CRELD2 | 0.0013939 | 217 | GTEx | DepMap | Descartes | 0.22 | 50.58 |
| SPCS3 | 0.0013502 | 228 | GTEx | DepMap | Descartes | 0.55 | 83.05 |
| SEC14L1 | 0.0013211 | 235 | GTEx | DepMap | Descartes | 1.93 | 252.16 |
| SSR3 | 0.0012506 | 243 | GTEx | DepMap | Descartes | 0.50 | 105.44 |
| ITM2C | 0.0011546 | 269 | GTEx | DepMap | Descartes | 0.45 | 140.44 |
| IQGAP2 | 0.0011513 | 270 | GTEx | DepMap | Descartes | 1.37 | 172.99 |
| DNAJC3 | 0.0011197 | 283 | GTEx | DepMap | Descartes | 0.80 | 108.75 |
| WIPI1 | 0.0010644 | 299 | GTEx | DepMap | Descartes | 0.29 | 100.96 |
| TRAM1 | 0.0010643 | 300 | GTEx | DepMap | Descartes | 0.68 | 149.32 |
| CLIC4 | 0.0009929 | 328 | GTEx | DepMap | Descartes | 1.65 | 258.11 |
| ELF1 | 0.0009340 | 354 | GTEx | DepMap | Descartes | 1.75 | 310.38 |
| MANF | 0.0009027 | 374 | GTEx | DepMap | Descartes | 0.26 | 127.27 |
| HLA-A | 0.0009002 | 377 | GTEx | DepMap | Descartes | 0.90 | 116.46 |
| HSPA5 | 0.0008525 | 402 | GTEx | DepMap | Descartes | 0.78 | 134.95 |
| ERBIN | 0.0008482 | 408 | GTEx | DepMap | Descartes | 2.03 | NA |
| ADAM19 | 0.0008429 | 416 | GTEx | DepMap | Descartes | 1.12 | 120.23 |
Descartes adrenocortical markers
Top 50 marker genes of adrenocortical cells in the Decartes fetal adrenal single cell map (https://atlas.brotmanbaty.org/bbi/human-gene-expression-during-development/cell/adrenocortical/in/adrenal)
Wilcoxon ranksum test P-value for gene set overrepresentation: 1.00e+00
Mean rank of genes in gene set: 17141.47
Median rank of genes in gene set: 18884
Rank on gene expression program of top 30 genes in gene set:
| Genes | Weight | Rank | GTEx | DepMap | Descartes | Mean.Counts | Mean.TPM |
|---|---|---|---|---|---|---|---|
| ERN1 | 0.0018369 | 150 | GTEx | DepMap | Descartes | 2.25 | 225.57 |
| FREM2 | 0.0002414 | 1470 | GTEx | DepMap | Descartes | 0.03 | 0.93 |
| APOC1 | 0.0000628 | 3972 | GTEx | DepMap | Descartes | 0.33 | 312.00 |
| SLC2A14 | -0.0000210 | 9947 | GTEx | DepMap | Descartes | 0.02 | 4.92 |
| PEG3 | -0.0000291 | 10752 | GTEx | DepMap | Descartes | 0.00 | NA |
| INHA | -0.0000809 | 14253 | GTEx | DepMap | Descartes | 0.00 | 0.65 |
| TM7SF2 | -0.0000911 | 14778 | GTEx | DepMap | Descartes | 0.10 | 28.21 |
| CLU | -0.0001003 | 15171 | GTEx | DepMap | Descartes | 1.11 | 284.65 |
| DHCR7 | -0.0001134 | 15748 | GTEx | DepMap | Descartes | 0.07 | 12.05 |
| SCAP | -0.0001175 | 15898 | GTEx | DepMap | Descartes | 0.36 | 51.27 |
| FDXR | -0.0001560 | 17114 | GTEx | DepMap | Descartes | 0.05 | 7.66 |
| CYP17A1 | -0.0001577 | 17163 | GTEx | DepMap | Descartes | 0.05 | 34.36 |
| FDPS | -0.0001607 | 17246 | GTEx | DepMap | Descartes | 0.44 | 114.12 |
| CYP11A1 | -0.0001757 | 17632 | GTEx | DepMap | Descartes | 0.05 | 18.45 |
| MC2R | -0.0001862 | 17858 | GTEx | DepMap | Descartes | 0.01 | 4.60 |
| SULT2A1 | -0.0001939 | 18003 | GTEx | DepMap | Descartes | 0.03 | 11.53 |
| CYB5B | -0.0002085 | 18326 | GTEx | DepMap | Descartes | 0.30 | 46.30 |
| NPC1 | -0.0002207 | 18528 | GTEx | DepMap | Descartes | 0.36 | 38.06 |
| BAIAP2L1 | -0.0002253 | 18611 | GTEx | DepMap | Descartes | 0.06 | 7.46 |
| LDLR | -0.0002320 | 18720 | GTEx | DepMap | Descartes | 0.37 | 46.69 |
| DHCR24 | -0.0002389 | 18812 | GTEx | DepMap | Descartes | 0.21 | 23.35 |
| SH3BP5 | -0.0002410 | 18851 | GTEx | DepMap | Descartes | 0.80 | 139.20 |
| CYP21A2 | -0.0002437 | 18884 | GTEx | DepMap | Descartes | 0.03 | 13.52 |
| MSMO1 | -0.0002497 | 18965 | GTEx | DepMap | Descartes | 0.20 | 58.73 |
| PAPSS2 | -0.0002586 | 19078 | GTEx | DepMap | Descartes | 0.37 | 52.95 |
| HMGCR | -0.0002603 | 19094 | GTEx | DepMap | Descartes | 0.25 | 38.32 |
| SCARB1 | -0.0002664 | 19169 | GTEx | DepMap | Descartes | 0.46 | 60.49 |
| CYP11B1 | -0.0002679 | 19184 | GTEx | DepMap | Descartes | 0.04 | 14.92 |
| STAR | -0.0002690 | 19195 | GTEx | DepMap | Descartes | 0.04 | 19.37 |
| HMGCS1 | -0.0002694 | 19199 | GTEx | DepMap | Descartes | 0.45 | 46.07 |
Descartes chromaffin markers
Top 50 marker genes of chromaffin cells in the Decartes fetal adrenal single cell map (https://atlas.brotmanbaty.org/bbi/human-gene-expression-during-development/cell/chromaffin/in/adrenal)
Wilcoxon ranksum test P-value for gene set overrepresentation: 1.00e+00
Mean rank of genes in gene set: 18205
Median rank of genes in gene set: 19478
Rank on gene expression program of top 30 genes in gene set:
| Genes | Weight | Rank | GTEx | DepMap | Descartes | Mean.Counts | Mean.TPM |
|---|---|---|---|---|---|---|---|
| NPY | 0.0000900 | 3288 | GTEx | DepMap | Descartes | 1.92 | 2533.53 |
| ELAVL2 | 0.0000097 | 6242 | GTEx | DepMap | Descartes | 1.09 | 123.20 |
| GREM1 | -0.0000509 | 12473 | GTEx | DepMap | Descartes | 0.05 | 1.98 |
| NTRK1 | -0.0000629 | 13274 | GTEx | DepMap | Descartes | 0.20 | 29.69 |
| MAB21L1 | -0.0000975 | 15060 | GTEx | DepMap | Descartes | 0.17 | 37.59 |
| IL7 | -0.0001166 | 15864 | GTEx | DepMap | Descartes | 3.09 | 509.97 |
| SLC6A2 | -0.0001250 | 16154 | GTEx | DepMap | Descartes | 0.19 | 23.80 |
| RPH3A | -0.0001460 | 16798 | GTEx | DepMap | Descartes | 0.10 | 10.44 |
| TUBB2A | -0.0001514 | 16969 | GTEx | DepMap | Descartes | 0.67 | 220.62 |
| PRPH | -0.0001697 | 17492 | GTEx | DepMap | Descartes | 0.82 | 249.33 |
| ANKFN1 | -0.0001906 | 17954 | GTEx | DepMap | Descartes | 0.60 | 60.91 |
| PLXNA4 | -0.0002008 | 18159 | GTEx | DepMap | Descartes | 1.00 | 22.24 |
| TMEM132C | -0.0002201 | 18510 | GTEx | DepMap | Descartes | 3.54 | 239.14 |
| REEP1 | -0.0002419 | 18865 | GTEx | DepMap | Descartes | 0.38 | 45.04 |
| GAP43 | -0.0002550 | 19033 | GTEx | DepMap | Descartes | 1.24 | 369.24 |
| RGMB | -0.0002553 | 19038 | GTEx | DepMap | Descartes | 0.27 | 25.24 |
| MLLT11 | -0.0002661 | 19164 | GTEx | DepMap | Descartes | 0.52 | 124.99 |
| PTCHD1 | -0.0002776 | 19283 | GTEx | DepMap | Descartes | 0.20 | 6.60 |
| KCNB2 | -0.0002831 | 19342 | GTEx | DepMap | Descartes | 2.54 | 241.58 |
| HMX1 | -0.0002910 | 19407 | GTEx | DepMap | Descartes | 0.34 | 63.00 |
| CNTFR | -0.0002974 | 19459 | GTEx | DepMap | Descartes | 0.12 | 22.20 |
| MAB21L2 | -0.0002990 | 19478 | GTEx | DepMap | Descartes | 0.09 | 28.88 |
| TMEFF2 | -0.0003022 | 19505 | GTEx | DepMap | Descartes | 0.56 | 57.43 |
| HS3ST5 | -0.0003300 | 19683 | GTEx | DepMap | Descartes | 0.91 | 81.21 |
| EPHA6 | -0.0003314 | 19689 | GTEx | DepMap | Descartes | 1.03 | 101.23 |
| RYR2 | -0.0003449 | 19780 | GTEx | DepMap | Descartes | 2.73 | 72.40 |
| CCND1 | -0.0003475 | 19797 | GTEx | DepMap | Descartes | 1.57 | 183.68 |
| EYA4 | -0.0003550 | 19836 | GTEx | DepMap | Descartes | 0.51 | 23.54 |
| FAT3 | -0.0003591 | 19858 | GTEx | DepMap | Descartes | 0.43 | 10.02 |
| TUBA1A | -0.0003893 | 20004 | GTEx | DepMap | Descartes | 3.84 | 1050.97 |
Descartes Vascular_endothelial markers
Top 50 marker genes of Vascular_endothelial cells in the Decartes fetal adrenal single cell map (https://atlas.brotmanbaty.org/bbi/human-gene-expression-during-development/cell/vascular_endothelial/in/adrenal)
Wilcoxon ranksum test P-value for gene set overrepresentation: 9.29e-01
Mean rank of genes in gene set: 11608.36
Median rank of genes in gene set: 12919
Rank on gene expression program of top 30 genes in gene set:
| Genes | Weight | Rank | GTEx | DepMap | Descartes | Mean.Counts | Mean.TPM |
|---|---|---|---|---|---|---|---|
| FCGR2B | 0.0005665 | 639 | GTEx | DepMap | Descartes | 0.07 | 12.63 |
| DNASE1L3 | 0.0003007 | 1206 | GTEx | DepMap | Descartes | 0.08 | 27.56 |
| CLDN5 | 0.0002879 | 1261 | GTEx | DepMap | Descartes | 0.12 | 24.20 |
| APLNR | 0.0002011 | 1782 | GTEx | DepMap | Descartes | 0.03 | 4.48 |
| PLVAP | 0.0001729 | 2033 | GTEx | DepMap | Descartes | 0.16 | 31.72 |
| SOX18 | 0.0001161 | 2746 | GTEx | DepMap | Descartes | 0.07 | 16.33 |
| IRX3 | 0.0000453 | 4506 | GTEx | DepMap | Descartes | 0.02 | 3.21 |
| RAMP2 | 0.0000386 | 4749 | GTEx | DepMap | Descartes | 0.09 | 44.55 |
| KANK3 | 0.0000361 | 4870 | GTEx | DepMap | Descartes | 0.07 | 12.39 |
| MMRN2 | 0.0000358 | 4882 | GTEx | DepMap | Descartes | 0.07 | 6.51 |
| TM4SF18 | 0.0000014 | 6885 | GTEx | DepMap | Descartes | 0.01 | 1.20 |
| F8 | -0.0000015 | 7720 | GTEx | DepMap | Descartes | 0.10 | 7.10 |
| NPR1 | -0.0000016 | 7725 | GTEx | DepMap | Descartes | 0.01 | 1.12 |
| ROBO4 | -0.0000081 | 8498 | GTEx | DepMap | Descartes | 0.04 | 5.00 |
| SHE | -0.0000279 | 10642 | GTEx | DepMap | Descartes | 0.03 | 2.00 |
| TIE1 | -0.0000424 | 11843 | GTEx | DepMap | Descartes | 0.07 | 6.96 |
| ECSCR | -0.0000437 | 11943 | GTEx | DepMap | Descartes | 0.00 | 0.00 |
| ID1 | -0.0000442 | 11979 | GTEx | DepMap | Descartes | 0.11 | 40.69 |
| PODXL | -0.0000462 | 12112 | GTEx | DepMap | Descartes | 0.23 | 11.87 |
| SLCO2A1 | -0.0000500 | 12418 | GTEx | DepMap | Descartes | 0.11 | 9.23 |
| ESM1 | -0.0000515 | 12520 | GTEx | DepMap | Descartes | 0.02 | 4.66 |
| RASIP1 | -0.0000563 | 12848 | GTEx | DepMap | Descartes | 0.04 | 4.09 |
| HYAL2 | -0.0000585 | 12990 | GTEx | DepMap | Descartes | 0.11 | 14.81 |
| KDR | -0.0000594 | 13051 | GTEx | DepMap | Descartes | 0.04 | 2.16 |
| CRHBP | -0.0000618 | 13206 | GTEx | DepMap | Descartes | 0.00 | 2.35 |
| NOTCH4 | -0.0000712 | 13750 | GTEx | DepMap | Descartes | 0.04 | 2.12 |
| TEK | -0.0000715 | 13763 | GTEx | DepMap | Descartes | 0.11 | 16.34 |
| CDH5 | -0.0000741 | 13908 | GTEx | DepMap | Descartes | 0.05 | 5.18 |
| FLT4 | -0.0000801 | 14218 | GTEx | DepMap | Descartes | 0.03 | 2.12 |
| BTNL9 | -0.0000808 | 14246 | GTEx | DepMap | Descartes | 0.08 | 7.25 |
Descartes stromal markers
Top 50 marker genes of stromal cells in the Decartes fetal adrenal single cell map (https://atlas.brotmanbaty.org/bbi/human-gene-expression-during-development/cell/stromal/in/adrenal)
Wilcoxon ranksum test P-value for gene set overrepresentation: 1.00e+00
Mean rank of genes in gene set: 14591
Median rank of genes in gene set: 15314
Rank on gene expression program of top 30 genes in gene set:
| Genes | Weight | Rank | GTEx | DepMap | Descartes | Mean.Counts | Mean.TPM |
|---|---|---|---|---|---|---|---|
| SCARA5 | 0.0000829 | 3468 | GTEx | DepMap | Descartes | 0.01 | 2.04 |
| IGFBP3 | 0.0000620 | 4000 | GTEx | DepMap | Descartes | 0.21 | 41.08 |
| ITGA11 | 0.0000156 | 5866 | GTEx | DepMap | Descartes | 0.11 | 5.34 |
| LUM | 0.0000049 | 6593 | GTEx | DepMap | Descartes | 0.34 | 72.48 |
| MGP | -0.0000041 | 8018 | GTEx | DepMap | Descartes | 1.15 | 321.06 |
| ACTA2 | -0.0000240 | 10259 | GTEx | DepMap | Descartes | 0.60 | 169.84 |
| CCDC80 | -0.0000245 | 10314 | GTEx | DepMap | Descartes | 0.17 | 8.18 |
| CLDN11 | -0.0000320 | 11016 | GTEx | DepMap | Descartes | 0.00 | 0.00 |
| C7 | -0.0000334 | 11139 | GTEx | DepMap | Descartes | 0.88 | 75.52 |
| ISLR | -0.0000345 | 11229 | GTEx | DepMap | Descartes | 0.03 | 4.94 |
| LRRC17 | -0.0000376 | 11465 | GTEx | DepMap | Descartes | 0.07 | 29.15 |
| LAMC3 | -0.0000385 | 11545 | GTEx | DepMap | Descartes | 0.04 | 1.96 |
| RSPO3 | -0.0000472 | 12193 | GTEx | DepMap | Descartes | 0.03 | NA |
| SULT1E1 | -0.0000508 | 12463 | GTEx | DepMap | Descartes | 0.00 | 0.00 |
| PRRX1 | -0.0000513 | 12495 | GTEx | DepMap | Descartes | 0.32 | 39.28 |
| FNDC1 | -0.0000633 | 13288 | GTEx | DepMap | Descartes | 0.06 | 2.93 |
| COL6A3 | -0.0000640 | 13328 | GTEx | DepMap | Descartes | 0.57 | 26.88 |
| DCN | -0.0000894 | 14687 | GTEx | DepMap | Descartes | 0.28 | 21.94 |
| CDH11 | -0.0000908 | 14755 | GTEx | DepMap | Descartes | 0.46 | 34.96 |
| PCDH18 | -0.0000920 | 14823 | GTEx | DepMap | Descartes | 0.02 | 2.10 |
| CD248 | -0.0000929 | 14864 | GTEx | DepMap | Descartes | 0.02 | 5.67 |
| ZNF385D | -0.0000975 | 15057 | GTEx | DepMap | Descartes | 0.35 | 12.92 |
| GLI2 | -0.0000990 | 15117 | GTEx | DepMap | Descartes | 0.15 | 9.51 |
| LOX | -0.0001032 | 15300 | GTEx | DepMap | Descartes | 0.02 | 2.16 |
| ELN | -0.0001034 | 15314 | GTEx | DepMap | Descartes | 0.18 | 20.44 |
| EDNRA | -0.0001052 | 15386 | GTEx | DepMap | Descartes | 0.10 | 11.72 |
| MXRA5 | -0.0001180 | 15916 | GTEx | DepMap | Descartes | 0.02 | 0.61 |
| COL12A1 | -0.0001321 | 16375 | GTEx | DepMap | Descartes | 0.28 | 11.79 |
| SFRP2 | -0.0001357 | 16488 | GTEx | DepMap | Descartes | 0.06 | 15.01 |
| COL27A1 | -0.0001375 | 16551 | GTEx | DepMap | Descartes | 0.12 | 8.61 |
Descartes sympathoblasts markers
Top 50 marker genes of sympathoblasts cells in the Decartes fetal adrenal single cell map (https://atlas.brotmanbaty.org/bbi/human-gene-expression-during-development/cell/sympathoblasts/in/adrenal)
Wilcoxon ranksum test P-value for gene set overrepresentation: 1.00e+00
Mean rank of genes in gene set: 17721.02
Median rank of genes in gene set: 18908
Rank on gene expression program of top 30 genes in gene set:
| Genes | Weight | Rank | GTEx | DepMap | Descartes | Mean.Counts | Mean.TPM |
|---|---|---|---|---|---|---|---|
| EML6 | 0.0000120 | 6086 | GTEx | DepMap | Descartes | 0.92 | 58.70 |
| PNMT | 0.0000048 | 6598 | GTEx | DepMap | Descartes | 0.02 | 11.31 |
| SLC24A2 | -0.0000319 | 11001 | GTEx | DepMap | Descartes | 0.26 | 7.32 |
| SLC35F3 | -0.0000713 | 13752 | GTEx | DepMap | Descartes | 0.68 | 58.94 |
| TIAM1 | -0.0000727 | 13828 | GTEx | DepMap | Descartes | 1.55 | 123.49 |
| ARC | -0.0000781 | 14116 | GTEx | DepMap | Descartes | 0.11 | 14.46 |
| CNTN3 | -0.0000863 | 14542 | GTEx | DepMap | Descartes | 0.10 | 10.11 |
| HTATSF1 | -0.0000947 | 14938 | GTEx | DepMap | Descartes | 0.18 | 26.69 |
| C1QL1 | -0.0001351 | 16475 | GTEx | DepMap | Descartes | 0.08 | 21.44 |
| TMEM130 | -0.0001364 | 16514 | GTEx | DepMap | Descartes | 0.26 | 36.07 |
| NTNG1 | -0.0001584 | 17178 | GTEx | DepMap | Descartes | 0.95 | 86.29 |
| DGKK | -0.0001621 | 17287 | GTEx | DepMap | Descartes | 0.07 | 3.13 |
| SLC18A1 | -0.0001731 | 17579 | GTEx | DepMap | Descartes | 0.08 | 11.77 |
| SCG2 | -0.0001758 | 17633 | GTEx | DepMap | Descartes | 1.73 | 473.33 |
| PENK | -0.0001761 | 17641 | GTEx | DepMap | Descartes | 0.01 | 9.78 |
| KSR2 | -0.0001775 | 17672 | GTEx | DepMap | Descartes | 0.46 | 9.17 |
| LAMA3 | -0.0001980 | 18096 | GTEx | DepMap | Descartes | 0.33 | 10.52 |
| GRM7 | -0.0001987 | 18115 | GTEx | DepMap | Descartes | 0.56 | 51.37 |
| CHGA | -0.0002138 | 18408 | GTEx | DepMap | Descartes | 0.40 | 130.16 |
| CNTNAP5 | -0.0002158 | 18445 | GTEx | DepMap | Descartes | 0.27 | 20.55 |
| ST18 | -0.0002364 | 18778 | GTEx | DepMap | Descartes | 0.19 | 15.97 |
| SPOCK3 | -0.0002457 | 18908 | GTEx | DepMap | Descartes | 0.25 | 46.46 |
| SORCS3 | -0.0002610 | 19103 | GTEx | DepMap | Descartes | 0.12 | 9.55 |
| GCH1 | -0.0002631 | 19132 | GTEx | DepMap | Descartes | 0.45 | 71.32 |
| GRID2 | -0.0002765 | 19270 | GTEx | DepMap | Descartes | 0.74 | 34.12 |
| INSM1 | -0.0002789 | 19292 | GTEx | DepMap | Descartes | 0.06 | 11.44 |
| CDH18 | -0.0002942 | 19422 | GTEx | DepMap | Descartes | 0.32 | 41.22 |
| PCSK2 | -0.0002959 | 19443 | GTEx | DepMap | Descartes | 0.37 | 19.17 |
| PACRG | -0.0003314 | 19688 | GTEx | DepMap | Descartes | 0.86 | 174.53 |
| CHGB | -0.0003463 | 19786 | GTEx | DepMap | Descartes | 1.46 | 426.20 |
Descartes erythroblasts markers
Top 50 marker genes of erythroblasts cells in the Decartes fetal adrenal single cell map (https://atlas.brotmanbaty.org/bbi/human-gene-expression-during-development/cell/erythroblasts/in/adrenal)
Wilcoxon ranksum test P-value for gene set overrepresentation: 7.04e-01
Mean rank of genes in gene set: 10763.8
Median rank of genes in gene set: 10455
Rank on gene expression program of top 30 genes in gene set:
| Genes | Weight | Rank | GTEx | DepMap | Descartes | Mean.Counts | Mean.TPM |
|---|---|---|---|---|---|---|---|
| GYPC | 0.0008434 | 414 | GTEx | DepMap | Descartes | 0.24 | 82.50 |
| EPB41 | 0.0004169 | 876 | GTEx | DepMap | Descartes | 1.77 | 173.29 |
| RAPGEF2 | 0.0002652 | 1359 | GTEx | DepMap | Descartes | 2.27 | 167.77 |
| CPOX | 0.0001760 | 1997 | GTEx | DepMap | Descartes | 0.04 | 10.69 |
| TMCC2 | 0.0001727 | 2036 | GTEx | DepMap | Descartes | 0.10 | 23.46 |
| BLVRB | 0.0001158 | 2758 | GTEx | DepMap | Descartes | 0.18 | 84.85 |
| SLC4A1 | 0.0000535 | 4252 | GTEx | DepMap | Descartes | 0.01 | 1.61 |
| HBB | 0.0000484 | 4413 | GTEx | DepMap | Descartes | 0.21 | 140.88 |
| HBZ | 0.0000384 | 4756 | GTEx | DepMap | Descartes | 0.01 | 11.48 |
| HEMGN | 0.0000354 | 4898 | GTEx | DepMap | Descartes | 0.00 | 0.31 |
| HBA1 | 0.0000269 | 5262 | GTEx | DepMap | Descartes | 0.03 | 24.79 |
| ABCB10 | 0.0000264 | 5296 | GTEx | DepMap | Descartes | 0.24 | 32.97 |
| HBG1 | 0.0000066 | 6479 | GTEx | DepMap | Descartes | 0.00 | 0.00 |
| AHSP | 0.0000048 | 6604 | GTEx | DepMap | Descartes | 0.00 | 0.00 |
| SPTA1 | 0.0000004 | 6969 | GTEx | DepMap | Descartes | 0.00 | 0.77 |
| HBG2 | 0.0000000 | 7371 | GTEx | DepMap | Descartes | 0.00 | 0.00 |
| SELENBP1 | -0.0000013 | 7706 | GTEx | DepMap | Descartes | 0.01 | 1.55 |
| CR1L | -0.0000023 | 7792 | GTEx | DepMap | Descartes | 0.02 | 7.13 |
| RHCE | -0.0000114 | 8874 | GTEx | DepMap | Descartes | 0.05 | 15.34 |
| GYPE | -0.0000172 | 9539 | GTEx | DepMap | Descartes | 0.02 | 7.77 |
| HBA2 | -0.0000179 | 9630 | GTEx | DepMap | Descartes | 0.07 | 53.17 |
| FECH | -0.0000207 | 9921 | GTEx | DepMap | Descartes | 0.15 | 9.19 |
| HBM | -0.0000229 | 10152 | GTEx | DepMap | Descartes | 0.00 | 3.86 |
| RHD | -0.0000292 | 10758 | GTEx | DepMap | Descartes | 0.08 | 16.12 |
| DENND4A | -0.0000398 | 11655 | GTEx | DepMap | Descartes | 1.85 | 124.49 |
| ALAS2 | -0.0000432 | 11905 | GTEx | DepMap | Descartes | 0.00 | 0.41 |
| RHAG | -0.0000563 | 12846 | GTEx | DepMap | Descartes | 0.01 | 1.19 |
| EPB42 | -0.0000629 | 13278 | GTEx | DepMap | Descartes | 0.00 | 0.00 |
| CAT | -0.0000711 | 13739 | GTEx | DepMap | Descartes | 0.20 | 58.47 |
| GYPA | -0.0000786 | 14142 | GTEx | DepMap | Descartes | 0.00 | 0.00 |
Descartes myeloid markers
Top 50 marker genes of myeloid cells in the Decartes fetal adrenal single cell map (https://atlas.brotmanbaty.org/bbi/human-gene-expression-during-development/cell/myeloid/in/adrenal)
Wilcoxon ranksum test P-value for gene set overrepresentation: 1.13e-01
Mean rank of genes in gene set: 9268.63
Median rank of genes in gene set: 7942
Rank on gene expression program of top 30 genes in gene set:
| Genes | Weight | Rank | GTEx | DepMap | Descartes | Mean.Counts | Mean.TPM |
|---|---|---|---|---|---|---|---|
| SFMBT2 | 0.0011292 | 277 | GTEx | DepMap | Descartes | 2.33 | 219.12 |
| CD74 | 0.0010669 | 297 | GTEx | DepMap | Descartes | 1.46 | 327.41 |
| CTSS | 0.0008749 | 390 | GTEx | DepMap | Descartes | 0.58 | 94.71 |
| ITPR2 | 0.0008685 | 397 | GTEx | DepMap | Descartes | 3.26 | 170.95 |
| HLA-DRA | 0.0007861 | 433 | GTEx | DepMap | Descartes | 0.65 | 372.64 |
| HLA-DPA1 | 0.0004710 | 779 | GTEx | DepMap | Descartes | 0.30 | 43.46 |
| HLA-DRB1 | 0.0004194 | 872 | GTEx | DepMap | Descartes | 0.15 | 79.89 |
| C1QA | 0.0003776 | 957 | GTEx | DepMap | Descartes | 0.19 | 146.66 |
| MPEG1 | 0.0002264 | 1574 | GTEx | DepMap | Descartes | 0.09 | 14.52 |
| MERTK | 0.0002012 | 1780 | GTEx | DepMap | Descartes | 0.70 | 131.93 |
| SPP1 | 0.0001965 | 1820 | GTEx | DepMap | Descartes | 0.71 | 260.95 |
| C1QB | 0.0001678 | 2087 | GTEx | DepMap | Descartes | 0.15 | 87.38 |
| CTSC | 0.0001591 | 2174 | GTEx | DepMap | Descartes | 0.30 | 28.93 |
| FGL2 | 0.0001573 | 2199 | GTEx | DepMap | Descartes | 0.11 | 17.06 |
| CST3 | 0.0001566 | 2205 | GTEx | DepMap | Descartes | 0.56 | 112.91 |
| C1QC | 0.0001519 | 2250 | GTEx | DepMap | Descartes | 0.09 | 43.21 |
| SLC9A9 | 0.0001076 | 2914 | GTEx | DepMap | Descartes | 1.17 | 194.18 |
| CD14 | 0.0001054 | 2954 | GTEx | DepMap | Descartes | 0.11 | 45.78 |
| CYBB | 0.0000967 | 3150 | GTEx | DepMap | Descartes | 0.01 | 0.43 |
| RNASE1 | 0.0000566 | 4172 | GTEx | DepMap | Descartes | 0.05 | 27.81 |
| LGMN | 0.0000405 | 4684 | GTEx | DepMap | Descartes | 0.40 | 109.06 |
| CD163L1 | 0.0000380 | 4775 | GTEx | DepMap | Descartes | 0.27 | 28.22 |
| FGD2 | 0.0000204 | 5624 | GTEx | DepMap | Descartes | 0.15 | 19.93 |
| IFNGR1 | 0.0000084 | 6347 | GTEx | DepMap | Descartes | 0.29 | 61.00 |
| ADAP2 | -0.0000035 | 7942 | GTEx | DepMap | Descartes | 0.21 | 43.90 |
| CTSD | -0.0000190 | 9763 | GTEx | DepMap | Descartes | 0.00 | 0.00 |
| TGFBI | -0.0000438 | 11952 | GTEx | DepMap | Descartes | 0.20 | 23.50 |
| CTSB | -0.0000555 | 12795 | GTEx | DepMap | Descartes | 0.64 | 88.61 |
| MS4A7 | -0.0000632 | 13284 | GTEx | DepMap | Descartes | 0.02 | 2.09 |
| CSF1R | -0.0000735 | 13867 | GTEx | DepMap | Descartes | 0.09 | 12.77 |
Descartes Schwann markers
Top 50 marker genes of Schwann cells in the Decartes fetal adrenal single cell map (https://atlas.brotmanbaty.org/bbi/human-gene-expression-during-development/cell/schwann/in/adrenal)
Wilcoxon ranksum test P-value for gene set overrepresentation: 1.00e+00
Mean rank of genes in gene set: 15522.49
Median rank of genes in gene set: 17655
Rank on gene expression program of top 30 genes in gene set:
| Genes | Weight | Rank | GTEx | DepMap | Descartes | Mean.Counts | Mean.TPM |
|---|---|---|---|---|---|---|---|
| VIM | 0.0006671 | 527 | GTEx | DepMap | Descartes | 1.91 | 391.22 |
| PAG1 | 0.0001733 | 2027 | GTEx | DepMap | Descartes | 1.41 | 76.06 |
| PTN | 0.0001039 | 2982 | GTEx | DepMap | Descartes | 0.26 | 104.64 |
| KCTD12 | 0.0000567 | 4169 | GTEx | DepMap | Descartes | 0.15 | 11.14 |
| MPZ | 0.0000189 | 5703 | GTEx | DepMap | Descartes | 0.04 | 9.72 |
| PLP1 | 0.0000018 | 6847 | GTEx | DepMap | Descartes | 0.03 | 6.79 |
| GFRA3 | -0.0000158 | 9384 | GTEx | DepMap | Descartes | 0.08 | 22.59 |
| MARCKS | -0.0000266 | 10511 | GTEx | DepMap | Descartes | 1.29 | 201.17 |
| ERBB4 | -0.0000361 | 11359 | GTEx | DepMap | Descartes | 1.87 | 47.17 |
| ERBB3 | -0.0000412 | 11754 | GTEx | DepMap | Descartes | 0.01 | 2.33 |
| OLFML2A | -0.0000452 | 12051 | GTEx | DepMap | Descartes | 0.07 | 4.57 |
| ADAMTS5 | -0.0000558 | 12813 | GTEx | DepMap | Descartes | 0.06 | 3.31 |
| SOX10 | -0.0000694 | 13647 | GTEx | DepMap | Descartes | 0.02 | 5.05 |
| CDH19 | -0.0000734 | 13865 | GTEx | DepMap | Descartes | 0.23 | 18.91 |
| HMGA2 | -0.0000891 | 14669 | GTEx | DepMap | Descartes | 0.04 | 3.04 |
| TRPM3 | -0.0000947 | 14939 | GTEx | DepMap | Descartes | 0.21 | 8.85 |
| XKR4 | -0.0000965 | 15004 | GTEx | DepMap | Descartes | 0.81 | 14.30 |
| PTPRZ1 | -0.0001050 | 15376 | GTEx | DepMap | Descartes | 0.07 | 5.81 |
| EDNRB | -0.0001054 | 15395 | GTEx | DepMap | Descartes | 0.14 | 14.72 |
| MDGA2 | -0.0001206 | 16016 | GTEx | DepMap | Descartes | 0.66 | 31.87 |
| IL1RAPL2 | -0.0001390 | 16586 | GTEx | DepMap | Descartes | 0.25 | 46.98 |
| PMP22 | -0.0001395 | 16599 | GTEx | DepMap | Descartes | 0.48 | 109.20 |
| COL25A1 | -0.0001471 | 16844 | GTEx | DepMap | Descartes | 0.25 | 15.12 |
| LAMC1 | -0.0001738 | 17590 | GTEx | DepMap | Descartes | 0.63 | 35.59 |
| LAMA4 | -0.0001768 | 17655 | GTEx | DepMap | Descartes | 0.63 | 35.75 |
| ABCA8 | -0.0001788 | 17705 | GTEx | DepMap | Descartes | 0.15 | 9.64 |
| SORCS1 | -0.0001852 | 17839 | GTEx | DepMap | Descartes | 1.06 | 63.50 |
| EGFLAM | -0.0002233 | 18579 | GTEx | DepMap | Descartes | 0.28 | 29.70 |
| SCN7A | -0.0002378 | 18796 | GTEx | DepMap | Descartes | 0.42 | 24.51 |
| GRIK3 | -0.0002517 | 18986 | GTEx | DepMap | Descartes | 0.07 | 3.08 |
Descartes Megakaryocytes markers
Top 50 marker genes of Megakaryocytes cells in the Decartes fetal adrenal single cell map (https://atlas.brotmanbaty.org/bbi/human-gene-expression-during-development/cell/megakaryocytes/in/adrenal)
Wilcoxon ranksum test P-value for gene set overrepresentation: 7.03e-01
Mean rank of genes in gene set: 10746.39
Median rank of genes in gene set: 11994
Rank on gene expression program of top 30 genes in gene set:
| Genes | Weight | Rank | GTEx | DepMap | Descartes | Mean.Counts | Mean.TPM |
|---|---|---|---|---|---|---|---|
| P2RX1 | 0.0036172 | 59 | GTEx | DepMap | Descartes | 0.46 | 140.23 |
| HIPK2 | 0.0019151 | 140 | GTEx | DepMap | Descartes | 2.96 | 137.93 |
| TPM4 | 0.0006962 | 500 | GTEx | DepMap | Descartes | 1.49 | 214.37 |
| RAP1B | 0.0006758 | 519 | GTEx | DepMap | Descartes | 1.77 | 81.78 |
| FERMT3 | 0.0004501 | 817 | GTEx | DepMap | Descartes | 0.16 | 47.72 |
| FLI1 | 0.0003595 | 1009 | GTEx | DepMap | Descartes | 0.87 | 115.38 |
| BIN2 | 0.0002830 | 1278 | GTEx | DepMap | Descartes | 0.23 | 49.18 |
| ACTB | 0.0002789 | 1294 | GTEx | DepMap | Descartes | 3.78 | 1062.87 |
| GP1BA | 0.0002635 | 1371 | GTEx | DepMap | Descartes | 0.02 | 5.14 |
| TMSB4X | 0.0002457 | 1451 | GTEx | DepMap | Descartes | 3.14 | 1214.08 |
| PLEK | 0.0002285 | 1556 | GTEx | DepMap | Descartes | 0.12 | 32.79 |
| TLN1 | 0.0001145 | 2790 | GTEx | DepMap | Descartes | 0.37 | 24.84 |
| FLNA | 0.0001113 | 2852 | GTEx | DepMap | Descartes | 0.43 | 24.20 |
| CD84 | 0.0000681 | 3813 | GTEx | DepMap | Descartes | 0.13 | 9.83 |
| MYLK | 0.0000570 | 4157 | GTEx | DepMap | Descartes | 0.24 | 8.35 |
| TGFB1 | 0.0000361 | 4866 | GTEx | DepMap | Descartes | 0.44 | 101.39 |
| PF4 | 0.0000282 | 5197 | GTEx | DepMap | Descartes | 0.00 | 5.71 |
| ITGB3 | 0.0000277 | 5229 | GTEx | DepMap | Descartes | 0.00 | 0.00 |
| PPBP | 0.0000171 | 5790 | GTEx | DepMap | Descartes | 0.00 | 0.00 |
| GP9 | -0.0000088 | 8574 | GTEx | DepMap | Descartes | 0.00 | 0.00 |
| UBASH3B | -0.0000384 | 11538 | GTEx | DepMap | Descartes | 0.88 | 62.61 |
| MYH9 | -0.0000389 | 11585 | GTEx | DepMap | Descartes | 1.13 | 81.04 |
| GSN | -0.0000417 | 11790 | GTEx | DepMap | Descartes | 0.55 | 48.56 |
| ZYX | -0.0000430 | 11894 | GTEx | DepMap | Descartes | 0.13 | 24.84 |
| ARHGAP6 | -0.0000444 | 11994 | GTEx | DepMap | Descartes | 0.42 | 30.02 |
| SPN | -0.0000567 | 12873 | GTEx | DepMap | Descartes | 0.00 | 0.00 |
| MMRN1 | -0.0000651 | 13396 | GTEx | DepMap | Descartes | 0.20 | 10.94 |
| ITGA2B | -0.0001070 | 15478 | GTEx | DepMap | Descartes | 0.06 | 8.80 |
| TUBB1 | -0.0001073 | 15492 | GTEx | DepMap | Descartes | 0.01 | 0.36 |
| LIMS1 | -0.0001107 | 15626 | GTEx | DepMap | Descartes | 1.11 | 180.51 |
Descartes Lyphoid markers
Top 50 marker genes of Lyphoid cells in the Decartes fetal adrenal single cell map (https://atlas.brotmanbaty.org/bbi/human-gene-expression-during-development/cell/lymphoid/in/adrenal)
Wilcoxon ranksum test P-value for gene set overrepresentation: 3.76e-01
Mean rank of genes in gene set: 10019.43
Median rank of genes in gene set: 12084
Rank on gene expression program of top 30 genes in gene set:
| Genes | Weight | Rank | GTEx | DepMap | Descartes | Mean.Counts | Mean.TPM |
|---|---|---|---|---|---|---|---|
| HLA-B | 0.0020548 | 127 | GTEx | DepMap | Descartes | 0.97 | 470.74 |
| B2M | 0.0019104 | 141 | GTEx | DepMap | Descartes | 5.12 | 1507.56 |
| HLA-C | 0.0017390 | 163 | GTEx | DepMap | Descartes | 0.56 | 192.69 |
| MCTP2 | 0.0015705 | 192 | GTEx | DepMap | Descartes | 0.73 | 67.97 |
| HLA-A | 0.0009002 | 377 | GTEx | DepMap | Descartes | 0.90 | 116.46 |
| ARHGAP15 | 0.0005933 | 612 | GTEx | DepMap | Descartes | 3.08 | 735.34 |
| ARID5B | 0.0004934 | 749 | GTEx | DepMap | Descartes | 1.70 | 132.59 |
| IKZF1 | 0.0004869 | 755 | GTEx | DepMap | Descartes | 1.27 | 144.17 |
| WIPF1 | 0.0004667 | 786 | GTEx | DepMap | Descartes | 1.21 | 163.22 |
| SP100 | 0.0004580 | 802 | GTEx | DepMap | Descartes | 1.07 | 145.88 |
| IFI16 | 0.0004530 | 810 | GTEx | DepMap | Descartes | 0.64 | 102.39 |
| ANKRD44 | 0.0004453 | 824 | GTEx | DepMap | Descartes | 3.42 | 339.64 |
| ARHGDIB | 0.0003722 | 972 | GTEx | DepMap | Descartes | 0.27 | 173.81 |
| SKAP1 | 0.0003681 | 985 | GTEx | DepMap | Descartes | 1.45 | 578.92 |
| LCP1 | 0.0002550 | 1412 | GTEx | DepMap | Descartes | 0.37 | 60.32 |
| PTPRC | 0.0002267 | 1570 | GTEx | DepMap | Descartes | 1.63 | 195.30 |
| LEF1 | 0.0002009 | 1783 | GTEx | DepMap | Descartes | 1.49 | 249.27 |
| MBNL1 | 0.0001640 | 2134 | GTEx | DepMap | Descartes | 4.85 | 499.58 |
| PLEKHA2 | 0.0001262 | 2590 | GTEx | DepMap | Descartes | 0.62 | 68.12 |
| MSN | 0.0001048 | 2967 | GTEx | DepMap | Descartes | 0.53 | 78.44 |
| NKG7 | 0.0001012 | 3052 | GTEx | DepMap | Descartes | 0.02 | 13.49 |
| CD44 | 0.0000903 | 3279 | GTEx | DepMap | Descartes | 2.14 | 192.34 |
| CCL5 | 0.0000772 | 3601 | GTEx | DepMap | Descartes | 0.06 | 46.18 |
| RCSD1 | -0.0000457 | 12084 | GTEx | DepMap | Descartes | 0.76 | 96.51 |
| CCND3 | -0.0000659 | 13456 | GTEx | DepMap | Descartes | 1.87 | 431.09 |
| SAMD3 | -0.0001077 | 15505 | GTEx | DepMap | Descartes | 0.24 | 45.76 |
| FOXP1 | -0.0001093 | 15578 | GTEx | DepMap | Descartes | 0.23 | 13.79 |
| DOCK10 | -0.0001196 | 15975 | GTEx | DepMap | Descartes | 1.76 | 137.66 |
| ITPKB | -0.0001302 | 16320 | GTEx | DepMap | Descartes | 0.54 | 49.29 |
| BCL2 | -0.0001306 | 16338 | GTEx | DepMap | Descartes | 3.92 | 299.87 |
Embryonic Pausing Signatures Up
Embryonic pausing signature upregulated genes from Supplementary Table 6 of Rehman et al. Cell 2021. These genes are upregulated in paused ESCs and diapaused embryos.
Wilcoxon ranksum test P-value for gene set overrepresentation: 2.25e-02
Mean rank of genes in gene set: 7121
Median rank of genes in gene set: 6745
Rank on gene expression program of top 30 genes in gene set:
| Genes | Weight | Rank | GTEx | DepMap | Descartes | Mean.Counts | Mean.TPM |
|---|---|---|---|---|---|---|---|
| ACSS1 | 0.0018428 | 149 | GTEx | DepMap | Descartes | 0.41 | 70.58 |
| PDCD4 | 0.0005276 | 695 | GTEx | DepMap | Descartes | 0.85 | 167.40 |
| DPP7 | 0.0003835 | 947 | GTEx | DepMap | Descartes | 0.35 | 147.77 |
| APOE | 0.0002577 | 1398 | GTEx | DepMap | Descartes | 1.39 | 686.82 |
| RENBP | 0.0000628 | 3978 | GTEx | DepMap | Descartes | 0.07 | 28.45 |
| ALDH6A1 | 0.0000303 | 5112 | GTEx | DepMap | Descartes | 0.08 | 7.96 |
| HEXB | 0.0000061 | 6517 | GTEx | DepMap | Descartes | 0.21 | 61.25 |
| CTSL | 0.0000003 | 6973 | GTEx | DepMap | Descartes | 0.26 | NA |
| LY6G6E | 0.0000000 | 7464 | GTEx | DepMap | Descartes | 0.00 | 0.00 |
| AUH | -0.0000054 | 8174 | GTEx | DepMap | Descartes | 1.11 | 392.59 |
| SPRY1 | -0.0000331 | 11109 | GTEx | DepMap | Descartes | 0.30 | 50.93 |
| HEXA | -0.0000675 | 13543 | GTEx | DepMap | Descartes | 0.04 | 2.43 |
| CCNG2 | -0.0001064 | 15449 | GTEx | DepMap | Descartes | 0.27 | 29.55 |
| YPEL2 | -0.0002023 | 18186 | GTEx | DepMap | Descartes | 0.39 | 34.65 |
Embryonic Pausing Signatures Down
Embryonic pausing signature downregulated genes from Supplementary Table 6 of Rehman et al. Cell 2021. These genes are downregulated in paused ESCs and diapaused embryos.
Wilcoxon ranksum test P-value for gene set overrepresentation: 3.33e-01
Mean rank of genes in gene set: 10043.5
Median rank of genes in gene set: 9997
Rank on gene expression program of top 30 genes in gene set:
| Genes | Weight | Rank | GTEx | DepMap | Descartes | Mean.Counts | Mean.TPM |
|---|---|---|---|---|---|---|---|
| HDLBP | 0.0010655 | 298 | GTEx | DepMap | Descartes | 1.29 | 141.35 |
| ANKRD37 | 0.0005995 | 604 | GTEx | DepMap | Descartes | 0.09 | 32.39 |
| P4HB | 0.0004007 | 910 | GTEx | DepMap | Descartes | 0.82 | 215.58 |
| CENPM | 0.0003002 | 1208 | GTEx | DepMap | Descartes | 0.10 | 68.90 |
| PLAC8 | 0.0002993 | 1213 | GTEx | DepMap | Descartes | 0.14 | 45.29 |
| ARPC1B | 0.0002958 | 1226 | GTEx | DepMap | Descartes | 0.09 | 35.03 |
| DAD1 | 0.0002507 | 1428 | GTEx | DepMap | Descartes | 0.39 | 365.32 |
| ATOX1 | 0.0002332 | 1525 | GTEx | DepMap | Descartes | 0.37 | 60.60 |
| SEC13 | 0.0002261 | 1576 | GTEx | DepMap | Descartes | 0.31 | 89.67 |
| PSMB4 | 0.0002095 | 1713 | GTEx | DepMap | Descartes | 0.31 | 82.00 |
| MGMT | 0.0001947 | 1837 | GTEx | DepMap | Descartes | 0.89 | 112.74 |
| CAPG | 0.0001803 | 1963 | GTEx | DepMap | Descartes | 0.06 | 31.87 |
| MRPL20 | 0.0001780 | 1984 | GTEx | DepMap | Descartes | 0.34 | 128.96 |
| INO80E | 0.0001746 | 2012 | GTEx | DepMap | Descartes | 0.21 | 31.00 |
| BRMS1 | 0.0001568 | 2202 | GTEx | DepMap | Descartes | 0.07 | 27.20 |
| CCNE1 | 0.0001473 | 2318 | GTEx | DepMap | Descartes | 0.04 | 9.30 |
| TMEM258 | 0.0001419 | 2388 | GTEx | DepMap | Descartes | 0.35 | NA |
| MRPS18A | 0.0001270 | 2577 | GTEx | DepMap | Descartes | 0.07 | 45.20 |
| DRG2 | 0.0001048 | 2966 | GTEx | DepMap | Descartes | 0.11 | 11.84 |
| PSMG3 | 0.0001031 | 3003 | GTEx | DepMap | Descartes | 0.13 | 51.73 |
| TMEM109 | 0.0000888 | 3318 | GTEx | DepMap | Descartes | 0.07 | 18.29 |
| FAM118B | 0.0000821 | 3488 | GTEx | DepMap | Descartes | 0.11 | 28.95 |
| ELOF1 | 0.0000802 | 3527 | GTEx | DepMap | Descartes | 0.06 | 14.70 |
| RPS19BP1 | 0.0000779 | 3579 | GTEx | DepMap | Descartes | 0.18 | 42.42 |
| ASB6 | 0.0000712 | 3733 | GTEx | DepMap | Descartes | 0.07 | 8.82 |
| TMEM39B | 0.0000695 | 3778 | GTEx | DepMap | Descartes | 0.20 | 45.31 |
| PSMD13 | 0.0000684 | 3806 | GTEx | DepMap | Descartes | 0.23 | 74.86 |
| ID3 | 0.0000621 | 3996 | GTEx | DepMap | Descartes | 0.27 | 100.49 |
| PSMB10 | 0.0000593 | 4086 | GTEx | DepMap | Descartes | 0.02 | 4.52 |
| EXOSC4 | 0.0000582 | 4118 | GTEx | DepMap | Descartes | 0.05 | 36.81 |
Below shows the ranks on this GEP for immune marker gene lists curated by CellTypist (https://www.celltypist.org/encyclopedia).
High ranks indicate this gene is a driver of this GEP.
These curated gene list are ranked by P-value (on this GEP) of their constituent genes.
The Mean Count column shows the mean read count in cells scoring highly (H > 50) on this gene expression program.
Double-negative thymocytes: Double-negative thymocytes (model markers)
the early immature thymocytes from the thymus in the double negative (co-receptors CD4- and CD8-) stage:
Wilcoxon ranksum test P-value for gene set overrepresentation: 2.55e-05
Mean rank of genes in gene set: 2683.1
Rank on gene expression program of genes in gene set:
| Genes | Weight | Rank | GTEx | DepMap | Decartes | Mean.Counts | Mean.TPM |
|---|---|---|---|---|---|---|---|
| JCHAIN | 0.0199077 | 5 | GTEx | DepMap | Descartes | 2.23 | NA |
| MZB1 | 0.0117065 | 14 | GTEx | DepMap | Descartes | 1.42 | NA |
| CD99 | 0.0003732 | 967 | GTEx | DepMap | Descartes | 0.72 | 289.77 |
| PTCRA | 0.0003190 | 1135 | GTEx | DepMap | Descartes | 0.12 | 49.43 |
| IGLL1 | 0.0003003 | 1207 | GTEx | DepMap | Descartes | 0.02 | 14.14 |
| CD7 | 0.0002112 | 1701 | GTEx | DepMap | Descartes | 0.05 | 9.64 |
| FXYD2 | 0.0000474 | 4451 | GTEx | DepMap | Descartes | 0.00 | 0.50 |
| PDLIM1 | 0.0000201 | 5636 | GTEx | DepMap | Descartes | 0.36 | 132.04 |
| MFAP4 | 0.0000160 | 5845 | GTEx | DepMap | Descartes | 0.03 | 10.06 |
| SELL | 0.0000156 | 5870 | GTEx | DepMap | Descartes | 0.09 | 23.86 |
Mono-mac: Mono-mac (model markers)
mononuclear phagocytes including monocytes and macrophages that are involved in the regulation of innate and adaptive immunity:
Wilcoxon ranksum test P-value for gene set overrepresentation: 3.28e-05
Mean rank of genes in gene set: 2793.9
Rank on gene expression program of genes in gene set:
| Genes | Weight | Rank | GTEx | DepMap | Decartes | Mean.Counts | Mean.TPM |
|---|---|---|---|---|---|---|---|
| HLA-DRA | 0.0007861 | 433 | GTEx | DepMap | Descartes | 0.65 | 372.64 |
| LYZ | 0.0005607 | 647 | GTEx | DepMap | Descartes | 0.25 | 106.30 |
| SAT1 | 0.0003095 | 1167 | GTEx | DepMap | Descartes | 1.98 | 948.78 |
| KRT13 | 0.0002195 | 1623 | GTEx | DepMap | Descartes | 0.00 | 4.68 |
| KLRB1 | 0.0001613 | 2157 | GTEx | DepMap | Descartes | 0.05 | 22.20 |
| C1QC | 0.0001519 | 2250 | GTEx | DepMap | Descartes | 0.09 | 43.21 |
| S100A2 | 0.0001237 | 2627 | GTEx | DepMap | Descartes | 0.01 | 2.29 |
| NKG7 | 0.0001012 | 3052 | GTEx | DepMap | Descartes | 0.02 | 13.49 |
| FTH1 | 0.0000383 | 4760 | GTEx | DepMap | Descartes | 2.53 | 1261.26 |
| SPRR3 | -0.0000144 | 9223 | GTEx | DepMap | Descartes | 0.00 | 0.00 |
Macrophages: Macrophages (model markers)
specialised mononuclear phagocytic cells which recognise:
Wilcoxon ranksum test P-value for gene set overrepresentation: 3.40e-05
Mean rank of genes in gene set: 2809.4
Rank on gene expression program of genes in gene set:
| Genes | Weight | Rank | GTEx | DepMap | Decartes | Mean.Counts | Mean.TPM |
|---|---|---|---|---|---|---|---|
| FTL | 0.0005342 | 687 | GTEx | DepMap | Descartes | 3.31 | 2120.43 |
| C1QA | 0.0003776 | 957 | GTEx | DepMap | Descartes | 0.19 | 146.66 |
| SELENOP | 0.0003405 | 1061 | GTEx | DepMap | Descartes | 0.46 | NA |
| APOE | 0.0002577 | 1398 | GTEx | DepMap | Descartes | 1.39 | 686.82 |
| C1QB | 0.0001678 | 2087 | GTEx | DepMap | Descartes | 0.15 | 87.38 |
| GNLY | 0.0001317 | 2518 | GTEx | DepMap | Descartes | 0.03 | 8.53 |
| APOC1 | 0.0000628 | 3972 | GTEx | DepMap | Descartes | 0.33 | 312.00 |
| RNASE1 | 0.0000566 | 4172 | GTEx | DepMap | Descartes | 0.05 | 27.81 |
| FTH1 | 0.0000383 | 4760 | GTEx | DepMap | Descartes | 2.53 | 1261.26 |
| CD5L | 0.0000065 | 6482 | GTEx | DepMap | Descartes | 0.02 | 4.08 |